Embed Size (px)
Citation preview

AN ANALYSIS ON INVENTORY MANAGEMENT WITH SPECIAL REFERENCE TO DP WORLD COCHIN
DUBAI PORTS WORLD (DP WORLD)(International Container Transshipment Terminal ) VALLARPADAM TERMINAL, ERNAKULAM
Submitted by
ABIL T S(Reg. No. 50342)
under the guidance ofASST.PROFESSOR VIJAY GANGAN
in partial fulfillment of the requirements
for the award of the degree of
MASTER OF BUSINESS ADMINISTRATIONof Mahatma Gandhi University, Kottayam
APRIL-2015
DE PAUL INSTITUTE OF SCIENCE AND TECHNOLOGY(DiST)
ANGAMALY SOUTH P.O., ERNAKULAM DIST., KERALA(Affiliated to Mahatma Gandhi University, Kottayam & Approved by AICTE, New Delhi)
DE PAUL INSTITUTE OF SCIENCE & TECHNOLOGY (DiST)

ACKNOWLEDGEMENT
I would like to take this opportunity to express my sincere gratitude to all those who have
helped me throughout this dissertation work. It gives me immense pleasure to acknowledge
all those who have rendered encouragement and support for the successful completion of
this work.
I express my heartfelt thanks to Fr. (Dr.) James Chelapurath VC,Principal, De Paul
Institute of Science and Technology(DiST). I like to express heartfelt gratitude to my
guide Mr. Vijay Gangan, Asst.Professor , School of Management, DIST, Angamaly and to
Mr. Alex K. Ninan (Managing Partner), Baby Marine International for granting me the
permission to do my dissertation work and Mr.Jacob John, HR manager, Mr. P.P.
Surendaran, plant and purchase manager, Mrs. B S Seethalakshmi, Quality Assurance
manager, Mr. Mohan P. Nair,Finance manager, for their constant encouragement and
support during the entire project work.
I also extend my sincere gratitude to Prof.(Dr.)Unny C. J. , Director,School of
Management, De Paul Institute of Science and Technology(DiST), Angamaly, whose
advice and guidance helped me in the successful completion of this dissertation.
Angamaly Abil T S
DE PAUL INSTITUTE OF SCIENCE & TECHNOLOGY (DiST)

DECLARATION
I, Abil T S hereby declare that the Dissertation Work entitled ‘A study on Training and
Development and its impact on employee performance at Dubai Ports World,
Vallarpadam, Kochi; submitted to Mahatma Gandhi University in partial fulfillment of the
requirements for the degree of Master of Business Administration , is a bonafide work,
carried out by me during the period of my study 2013-2015 at De Paul Institute of Science
and Technology(DiST), Angamaly, under the guidance of Mr.Vijay Gangan.
Angamaly Abil T S.
DE PAUL INSTITUTE OF SCIENCE & TECHNOLOGY (DiST)

DE PAUL INSTITUTE OF SCIENCE AND TECHNOLOGY
ANGAMALY SOUTH P.O., ERNAKULAM DIST., KERALA
(Affiliated to Mahatma Gandhi University, Kottayam)
CERTIFICATEThis is to certify that this dissertation work entitled
“AN ANALYSIS ON INVENTORY MANAGEMENT WITH SPECIAL REFERENCE TO DP WORLD COCHIN”
submitted to Mahatma Gandhi University
in partial fulfillment of the requirements for the award
of the degree of
MASTER OF BUSINESS ADMINISTRATIONis a bonafide record of work done by
ABIL T S.
(Reg. No.50342 )
Asst.Prof.Vijay Gangan. ( Faculty Guide ) Prof.(Dr.)Unny C. J (Director)
______________________________
Fr. (Dr.) James Chelapurath VC (Principal)
Submitted for the viva – voce examination held on ________________________
DE PAUL INSTITUTE OF SCIENCE & TECHNOLOGY (DiST)
TABLE OF CONTENTS
SL NO
PARTICULARS PAGE NUMBER
1 INTRODUCTION
2 STATEMENT OF THE PROBLEM
3 OBJECTIVES OF THE STUDY
4 SCOPE OF THE STUDY
5 LIMITATIONS OF THE STUDY
6 REVIEW OF LITERATURE
7 THEORITICAL CONCEPT
8 COMPANY PROFILE
9 RESEARCH METHODOLOGY
10 DATA INTERPRETATION AND ANALYSIS
11 SWOT
12 FINDINGS AND SUGGESTIONS
13 CONCLUSION
DE PAUL INSTITUTE OF SCIENCE & TECHNOLOGY (DiST)

CHAPTER 1
INTRODUCTION
1.1 INTRODUCTION
DE PAUL INSTITUTE OF SCIENCE & TECHNOLOGY (DiST)

India is a country of scarce resources and it is the primary responsibility of each organisation
whether it is public sector, private sector, or government department to ensure optimum
utilisation of available resources for the production of goods and services. Materials have
come to occupy a very vital and critical position in the resource position of the country. So
Material Management function – the function of conservation of materials and their
optimum utilisation has started assuming great importance in the overall efficiency of any
industry- be it an engineering, a chemical or any other.
In modern competitive world one of the burning problem of every businesses and industries
are that of cost control and cost reduction. An all pervasive effort for cost control and cost
reduction is of paramount importance for survival and growth of every industrial enterprise.
This is why inventory management is a scientific device for controlling inventory cost and
eliminating wastage is now regarded as an integral part of industrial management. Inventory
management does not involve any human factor, as it concerns itself not with men but with
inventory. The dictionary meaning of inventory is stock of goods, of a list of goods; various
authors understand the word inventory differently. In accounting language it may mean
stock of initial goods only. In a manufacturing concern, it may include raw materials; work
in process, finished goods and stores etc. There are conflicting interests of different
departmental heads over the issue of inventory. The finance manager will try to invest less in
inventory because for him it is an idle investment, whereas production manager will
emphasis to acquire more and more inventories as he does not want any interruption in
production due to shortage of inventory. The purpose of inventory management is to keep
the stocks in such that neither there is over stocking nor under-stocking. The over stocking
will mean a reduction of liquidity and targeting off other production processed: under
stocking on the other hand will result in stoppage of work on the investment in inventory
should be kept in reasonable limits. Inventory control techniques are employed by the
inventory control. Organization within the frame work of one of the basic inventory model,
viz., fixed order quantity systems or fixed order period system. Inventory techniques
represent the operations aspects of inventory management and help to realize the objective
of inventory management and its control. Several techniques of inventory control are in use
and it depends on the policy of the firm product, the techniques most commonly used are
DE PAUL INSTITUTE OF SCIENCE & TECHNOLOGY (DiST)

1. Always Better Control (ABC) Classification
2. High, Medium and Low (HML) Classification
3. Vital, Essential and Desirable (VED) Classification
4. Scare, Difficult and Easy to obtain (SDE)
5. Fast moving, Slow moving, and Non moving (FSN)
6. Economic Order Quantity (EOQ)
7. Max – minimum System
8. Two bin System
9. Material Requirement Planning (MRP)
10. Just In Time (JIT)
11. Distribution Logistics (DL)
1.2 STATEMENT OF THE PROBLEM
DE PAUL INSTITUTE OF SCIENCE & TECHNOLOGY (DiST)

The present study entitled as ‘An analysis on inventory management with special reference
to DP world cochin” was undertaken to study and evaluate the inventory management and
the different techniques of inventory management of DP World Cochin.
1.3 OBJECTIVES OF THE STUDY
PRIMARY OBJECTIVE
To study the various inventory management techniques used in the organization.
SECONDARY OBJECTIVES
To calculate, analyze and interpret various ratios relating to inventory management.
To find EOQ of spares and to find out how they are useful in reducing requisition
cost.
To do VED analysis from the data of spares available in the stores department and to
classify them
To do an ABC analysis from the data of spares available in the stores department and
to classify them.
1.4 SCOPE OF THE STUDY
Inventory management being a very important concept in all the company’s having a wide
coverage often calls for the managerial attention and also helps in management of spares in
service providing companies. In the modern times inventory management has become the
integral part of the all companies. So all the firms give special importance for inventory
management. The major objective of the study is to examine the effectiveness of inventory
management system adopted by DP World Vallarpadam. The study mainly focuses on the
techniques used by this company to control the inventory.
1.5 LIMITATIONS OF STUDY
The project duration was 2 months.
Time was limiting factor.
DE PAUL INSTITUTE OF SCIENCE & TECHNOLOGY (DiST)

The study is based on secondary data which involves the company’s published
financial statements
Confidential matters are not exposed to outsiders.
Some of the managers seemed to be very busy and hesitated to respond due to their
work load.
DE PAUL INSTITUTE OF SCIENCE & TECHNOLOGY (DiST)

CHAPTER 2
REVIEW OF LITERATURE
DE PAUL INSTITUTE OF SCIENCE & TECHNOLOGY (DiST)

2.1 REVIEW OF LITERATURE
Every enterprise needs inventory for smooth running of its activities. It serves as a link
between production and distribution processes. There is generally, a time lag between the
recognition of a need and its fulfillment. The greater the time lag, the higher the
requirements for inventory. The unforeseen fluctuations in demand and supply of goods
also necessitate the need for inventory. It also provides a cushion for future price
fluctuations.
Inventory management is a major area of operations research. There is a significant
amount of theoretical research on best inventory management. There is also some
empirical research on overall inventory levels. However, there has been little empirical
research focusing specifically on the auto industry. Indeed, most auto industry specific
research is from the management literature and deals how various manufacturers interact
on a personal level with their dealers.
The theoretical literature dealing with inventory management is quite voluminous. This
literature presents the tools and techniques that can be used to have effective management
of inventory.
An article says that “If there is one great myth in inventory management it is that one
single technique will solve all inventory problems. Not that people believe that one
technique will solve all problems in all situations but that in any given company one
approach is all that is required to manage all inventory.” He also pointed out that, there is a
wide range of techniques and approaches that people use to manage inventory. These
include JIT, ABC, and FSN, VED analysis, Risk Management, safety stock and EOQ's.
Sometimes they are used on a standalone basis and sometimes in conjunction with each
other. All are worthwhile techniques when used appropriately (Slater).
Experts argue that inventory levels should decline markedly as a result of the
implementation of improved inventory management systems such as JIT. A paper
indicates that while it appears that the general level of inventories has decreased across all
industries since the 1960’s, it does not appear that the trend accelerated in the 1980’s or
thereafter, as JIT’s proponents might suggest (Malhotra, 2001).
DE PAUL INSTITUTE OF SCIENCE & TECHNOLOGY (DiST)

A recent study indicates that, when studying inventories on a firm level instead of on an
industry level, there appears to be a significant decrease in inventories since 1980.
However, Chen, Frank, and Wu focus on the economy as a whole. They do not focus on a
particular industry, nor do they focus on distribution, as opposed to production systems
(Chen, 2003)
A publication indicates that there are three types of inventory that require management:
raw materials, finished goods and work-in-progress. Raw materials can be cut down in a
number of different ways, most notably by ordering smaller batches with more frequency
from suppliers (JIT). Finished goods inventories can be cut down in multiple ways as well,
most notably by either producing only when you actually have an order (JIT) or by
achieving more accurate demand projections (Atkinson, October 25, 2005).\
Using the "ABC" concept to analyze and control inventory investment and turns is the
simplest and most efficient method. Most inventories are made up of hundreds and
possibly thousands of individual items necessary to manufacture a company’s products. By
rank ordering the inventory items in dollar terms, an items being the most expensive to C
items being the least expensive, managing inventory investment can be broken down to a
manageable level. "A" items usually make up 50 to 60% of inventory dollars; however,
they only account for normally 10 to 20% of inventoried items. "B" items usually make up
30 to 40% of inventory dollars and only account for normally 30 to 40% of inventoried
items. "C" items usually make up 5 to 10% of inventory dollars and account for normally
40 to 50% of inventoried items. By managing the "A" items, a positive impact can be
made in inventory investment reduction. Reducing one or two "A" items can and will have
a bigger impact on inventory reduction and increased inventory turns, greater than a
possible reduction in all "C" items (Caldwell).
The study says that the first mathematical inventory model is generally referred to as the
Economic Order Quantity (EOQ) model which was developed by Harris in 1915. The first
full length book attempts to explain how various extensions of EOQ can be used in
practice is Raymond's. The importance of the EOQ model is not only from the historical
point of view but also because many other models designed to cope with different
situations have been based on this model.
DE PAUL INSTITUTE OF SCIENCE & TECHNOLOGY (DiST)

Graman and Magazine (2006) argued that today, the cost of holding inventory, extensive
product proliferation and the risk of obsolescence, especially in rapidly changing markets,
make the expense of holding large inventories of finished goods excessive and that high
demand items naturally have safety stock assigned to them, but in many organizations
there are so many very-low-demand items that keeping any stock of these items is
unreasonably expensive, so they argue that companies must now provide good service
while maintaining minimal inventories. Therefore, inventory management approaches are
essential aspects of any organization.
DE PAUL INSTITUTE OF SCIENCE & TECHNOLOGY (DiST)

2.2 THEORETICAL CONCEPT
Meaning of Inventory:
Inventories represent aggregate of those items which are either held for sale in the
ordinary course of business or are in the process of production for sale (work- in-
process) or are yet to be utilized/ consumed in the production of goods and services.
Inventory can also be defined as “an idle stock of physical goods that contain economic
value, and are held in various forms by an organization in its custody awaiting packing,
processing, transformation, use or sale in a future point of time.”
Any organization which is into production, trading, sale and service of a product will
necessarily hold stock of various physical resources to aid in future consumption and
sale. While inventory is a necessary evil of any such business, it may be noted that the
organizations hold inventories for various reasons, which includes speculative purposes,
physical necessities etc.
Nature of inventory:
In simple words, inventory means the goods held by a firm for eventual sales. Inventory
can be classified into the following categories as follows:
(a) Raw materials: These are basic unfabricated materials (input) which have undergone
no conversion whatsoever since their receipt from the suppliers. In other words, these are
goods which have not yet been committed to production at all or those basic materials
from which components, parts and products are manufactured by the company. They
may include items like steel, copper, lead, cotton, rubber, leather, common salt etc.
(b) Work-in-process: It comprises of items or materials which are in partially completed
condition of manufacture. Raw materials become work-in-process at the end of first
operation and remain in that classification until they become finished parts or finished
goods. Work-in-process can be found on the conveyers, trucks, pallets, in and around the
machines, and in temporary areas of storage awaiting to be worked upon or assembled.
DE PAUL INSTITUTE OF SCIENCE & TECHNOLOGY (DiST)

(c) Finished goods: These are final output of the production process. In other words,
these are completed products awaiting sale. Products usually leave work-in-process
classification and enter into the classification of finished goods at the point of final
inspection when they are ready for delivery to the customer or to the finish goods store.
(d)Consumables: These are the materials which are needed to smooth the process of
production. These materials do not directly enter production but they act as catalyst, etc.
Consumables may be classified according to their consumption and criticality. Generally,
consumable stores do not create any supply problem and form a small part of production
cost. There can be instances where these materials may account for much value than the
raw materials. They may include fuel oil; general office supplies (files, pens, carbon
paper, ink pads, sealing wax etc.); printed forms (envelops, enquiry forms, purchase
order forms, invoices, vouchers etc.); ledgers and journals (goods inward register, sales
register, cash book, sales journal, purchase journal, general ledger etc.); electric supplies
(cables, lamps, plugs, switches etc.).
(e) Spares: Spares also form a part of inventory. The consumption pattern of raw
materials, consumables, finished goods are different from that of spares. The stocking
policies of spares are different from industry to industry. Some industries like transport
will require more spares than the other concerns. The costly spare parts like engines,
maintenance parts etc. are not discarded after use, rather they are kept in ready position
for further use. All decisions about spares are based on the financial cost of inventory on
such spares and costs that may arise due to their non-availability
Reasons for keeping inventory:
a) Predictability: In order to engage in capacity planning and production scheduling,
you need to control how much raw material, parts and subassemblies you process at
a given time. Inventory buffers what you need from what you process.
b) Fluctuations in demand: A supply of inventory on hand is protection to cater to
unexpected changes in customer or production demand.
c) Unreliability of supply: Inventory protects from unreliable suppliers or when an
item is scarce and it is difficult to ensure a steady supply.
DE PAUL INSTITUTE OF SCIENCE & TECHNOLOGY (DiST)

d) Price protection: Buying quantities of inventory at appropriate times helps avoid the
impact of cost inflation. Also, contracting to assure a price does not require actually
taking delivery at the time of purchase.
e) Quantity discount: The manufacturers of certain items offer discount if more units
are purchased. The buyer, therefore, may buy quantities beyond the current
requirements to take advantage of the price discounts.
f) Lower ordering costs: If larger quantity is bought less frequently, the ordering costs
are less than buying smaller quantities over and over again. In order to hold down
ordering costs and to lock in favourable pricing, many organizations issue blanket
purchase orders coupled with periodic release and receiving dates of the materials
called for.
g) Prevent loss of sales: Finish goods inventory is maintained to match requirements of
the customers for prompt execution of their orders. The failure of the company to
make such products available immediately may result in loss of sale or even the loss
of customer.
Costs of holding Inventory:
Material cost: This includes the cost of purchasing the goods, transportation and handling
charges less any discount allowed by the supplier of goods.
Ordering cost: This includes the cost of placing orders for purchase of raw materials and
components. The fewer the orders, the lower will be the ordering cost.eg costs incurred on
typing, mailing etc.
Carrying cost: This comprises the expenses for storing goods. Its components are godown
rent, insurance of goods, cost of funds tied up in inventory, spoilage costs, decline in the
price of goods, etc.
Inventory Management:
DE PAUL INSTITUTE OF SCIENCE & TECHNOLOGY (DiST)

Inventory management is the process of efficiently overseeing the constant flow of units into
and out of an existing inventory. This process usually involves controlling the transferring of
units in order to prevent the inventory from becoming too high, or dwindling to levels that
could put the operation of the company into jeopardy. Inventory management also seeks to
control the cost associated with the inventory, both from the perspective of the total value of
the goods included and the tax burden generated by cumulative value of the inventory.
There are conflicting interests of different departmental heads over the issue of inventory.
The finance manager will try to invest less in inventory because for him it is an idle
investment, whereas production manager will emphasis to acquire more and more inventory
as he does not want any interruption in production due to shortage of inventory. The purpose
of inventory management is to keep the stocks in such a way that neither there is over-
stocking will mean a reduction of liquidity and starving of other production processes;
under-stocking, on the other hand, will result in stoppage of work. The investments in
inventory should be kept in reasonable limits.
Proper inventory management is important to the financial health of the organization; being
out of stock forces customers to turn to competitors or results in a loss of sales. Excessive
level of inventory, however results in large inventory carrying costs, including cost of
capital tied up in inventory warehouse fees, insurance etc.
A major problem with managing inventory is that the demand for a company’s product is to
a degree uncertain. The supply of the raw materials used in its production process is also
somewhat uncertain. Poor inventory management results in an illiquid corporation-one that
must continually borrow in order to have enough operating cash on hand. Properly managed,
the turnover of the inventory releases cash in a timely manner, and this cash flow is then
used to make payment on payables as they come due.
Objectives of Inventory management:
1. Continuity of productive operations: An efficient inventory management should
ensures continuity of productive operations through a uniform flow of materials and
eliminate the possibility of stock-outs.
2. To minimize the financial investment in inventories: The main objective of the
system of inventory management is to minimize the capital blocked in the inventories.
DE PAUL INSTITUTE OF SCIENCE & TECHNOLOGY (DiST)

Because the capital required to carry inventories costs money and holding assets in
the form of inventories results in decreased liquidity.
3. Effective use of capital: The system should enable the management to make an
effective use of its capital. The investment in inventories should be kept at minimum
consistent with the operating sales and financial requirements of the firm.
4. To maintain timely records: An organization should maintain timely records of
inventories of all items and to maintain the stock within the desired limits.
5. To provide scientific base for inventories: An efficient inventory management will
provide a scientific base for short term and long range planning of inventory
requirements.
6. To meet demand fluctuations: Fluctuations in demand occur unexpectedly. So this
requires maintaining suitable stock for safety or buffer stock to absorb variations
reasonably well.
7. To provide a safeguard for variations in raw material delivery time or lead time:
The safety stock would have to be maintained to account for the inherent variability
of lead times of raw materials supply. This variability arises because of irregularity of
production at vendors’ plants, transportation of goods, rejects, etc.
8. To reduce surplus stock: Reduction of surplus stock is one of the essential
requirements of effective inventory control. Inventory control offers an opportunity to
critically examine the causes of excessive stocking and take appropriate measures to
bring down stock to a reasonable level and thus reduce investment in inventory and at
the same time avoid obsolescence losses.
9. To ensure timely action of replenishment: Adequate stock should be maintained to
match reasonable requirements of the customers so as to ensure prompt execution of
their orders.
10. Zero discrepancy between physical stock and book balance: No inventory
control system can work if there are discrepancies between physical stock and book
balance. Stock records must be reconciled periodically with physical balance.
Techniques of Inventory Management:
DE PAUL INSTITUTE OF SCIENCE & TECHNOLOGY (DiST)

Effective management of inventory requires a sound system of inventory control. Inventory
control is a system which ensures supply of required quantity and quality of inventory at the
required time without unnecessary investment in inventory. The main techniques of
inventory management are as follows:
1. Determination of Stock Levels
Carrying of too much and too little of inventories is detrimental to the firm. If the inventory
level is too little, the firm will face frequent stock-outs involving heavy ordering cost and if
the inventory level is too high it will be unnecessary tie-up of capital. Therefore, an efficient
inventory management requires that a firm should maintain an optimum level of inventory
where inventory costs are the minimum and at the same time there is no stock which may
result in loss of sale or stoppage of production. Various stock levels are discussed as such:
(a) Minimum Level:
This represents the minimum quantity of materials which must be maintained in hand at all
times. The quantity is fixed so that production may not be held up due to shortage of the
material. In fixing this level, the following factors are taken into consideration:
1. Lead time i.e. time lag between intending and receiving of materials. It is the time
required to replenish the supply.
2. Rate of consumption of material during the lead time which is calculated on the basis of
past experience and production plans.
3. Nature of material i.e. Minimum level is not required in case of a special material which
is required against customer’s specific order.
Formula for calculation of minimum level is as follows:
DE PAUL INSTITUTE OF SCIENCE & TECHNOLOGY (DiST)
Minimum stock level = Re-ordering level - (Normal consumption*Normal Re-
order period)

(b)Maximum Level
This represents the maximum quantity of an item of material which can be held in stock
at any time. Stock should not exceed this quantity. The quantity is fixed so there may be
no overstocking. Overstocking will mean blocking of more working capital, more space
for storing the materials, more wastage of materials and more chances of losses from
obsolescence.
Formula for calculation of maximum level is as follows:
(c) Average Stock Level:
It is the level of stock that normally carried by the business looking towards the nature and
the requirements of the business.
Formula for calculation of maximum level is as follows:
(d) Danger level:
This means a level at which normal issues of the material are stopped and issues are made
only under specific instructions. If danger level arises then immediate steps should be taken
to replenish the stocks even if more cost is incurred in arranging the materials. If materials
are not arranged immediately there is a possibility of stoppage of work.
Danger level is determined with the following formula:
(e) Re-ordering Level:
DE PAUL INSTITUTE OF SCIENCE & TECHNOLOGY (DiST)
Maximum Stock Level = Reordering level + Re-ordering quantity-(Minimum consumption * Minimum re-ordering period)
Average Stock Level = Minimum stock level +1/2 of re-order quantity
Or
½ (Minimum Stock Level + Maximum Stock Level)
Danger Level = Average consumption * Maximum re-order period for emergency purchases

This level is fixed somewhere between the maximum and minimum levels in such a way
that the difference of quantity of the material between the re-ordering and the minimum
level will be sufficient to meet the requirements of production upto the time the fresh supply
of the material is received.
Re-order level can be calculated using the following formula:
In the formula Maximum Reorder period means the maximum period taken to get the
material once it is initiated.
2. Perpetual Inventory system
The perpetual inventory is a system of records maintained by the controlling department,
which reflects the physical movements of the stocks and their
Current balance. Bin cards and the stores ledger help the management in maintaining this
system as they make a record of the physical movement of the stock on the receipts and
issues of the materials and also reflect the balance in the stores. To ensure the accuracy of
perpetual inventory records, physical verification of the stores is made by a programme of
continuous Stocktaking. It is possible that the balance of stocks shown by bin cards or stores
ledger may differ from the actual balance of stock ascertained by physical verification.
DE PAUL INSTITUTE OF SCIENCE & TECHNOLOGY (DiST)
Re-ordering Level = Minimum level + Consumption during the time required to get the fresh delivery
Or
= Maximum consumption * Maximum Re-order period

3. Just-in-Time Inventory Management
Just-in-Time (JIT) system was popularized by Japanese firms. JIT purchasing is the
purchase of material or goods in such a way that delivery of purchased item is assured
before their use or demand .JIT recognizes too much carrying costs associated with holding
high inventory levels. Therefore, it advocates developing good relations with suppliers and
making timely purchases from proven suppliers who can make ready delivery of goods
available as and when need arises. The philosophy of JIT control system implies that the
firm should maintain a minimum (zero level) of inventory and rely on suppliers to provide
materials just in time to meet the requirements. The traditional inventory control system, on
the other hand, requires maintaining a healthy level of safety stock to provide protection
against uncertainties of production and supplies.
Advantages:
The right quantities of materials are purchased or produced at the right time.
Investment in inventory is reduced.
Wastages are eliminated
Carrying cost of inventory is reduced due to low investment in inventory.
Reduction in costs of quality such as inspection cost of delayed inventory, early
delivery, processing documents etc. resulting into overall reduction in cost.
4. ABC analysis
Manufacturing firms find it useful to divide materials into three categories for the
purpose of exercising selective control on materials. Under this technique of material
control, materials are listed in ‘A’,’B’,’C’ categories in descending order based on
money value of consumption.
An analysis of material costs will show that a smaller percentage of items of materials in
the stores may contribute to a large percentage of the value of consumption and, on the
other hand, a large percentage of items of materials in the stores may contribute to a
smaller percentage of the value of consumption. Between these two extremes will fall
those items the percentage number of which is more or less equal to their value of
consumption. Items falling in the first category are treated as ‘A’ items, of the second
category as ‘B’ items and the items of the third category as ’C’ items. Such an analysis
DE PAUL INSTITUTE OF SCIENCE & TECHNOLOGY (DiST)

of material is known as ABC analysis. This method is also known as Always Better
Control method, proportional parts value method etc.
5. VED Analysis
VED- vital, essential and desirable – analysis is used primarily for control of spare parts.
The spares, the stock-out of which even for a short time will stop production for quite some
time and where the cost of stock-out is very high, are known as vital spares. The spares, the
absence of which cannot be tolerated for more than a few hours or a day and the cost of lost
production is high and which are essential for the production to continue, are known as
essential spares. The desirable spares are those spares which are needed but their absence for
a week or so will not lead to stoppage of production. Some spares, though negligible in
monetary value, may be vital for the production to continue and require constant attention.
Such spares may not receive the attention they deserve if they are maintained according to
ABC analysis because their value of consumption is small. So, in their cases, VED analysis
is made to get the effective results. As VED analysis analyses items based on their criticality
of production, it can also be used for those items of materials which are difficult to procure.
6. Turnover Ratios
(a)Inventory turnover Ratio
The inventory turnover ratio indicates the number of times the inventories are replenished or
number of times a company sells its inventory during the year. This ratio shows the speed
with which stock is rotated into sales or the number of times the stock is turned into sales
during the year and indicates whether investment in inventory is within proper limit. The
higher the ratio, the better it is, since it indicates that the stock is selling quickly. In a
business where stock turnover ratio is high, goods can be sold at a low margin of profit even
that profitability is quite high. This ratio is also known as stock velocity.
DE PAUL INSTITUTE OF SCIENCE & TECHNOLOGY (DiST)
Inventory Turnover Ratio = Net sales/ Average Inventory
OR
Cost of goods sold/ Average inventory

(b) Inventory Conversion Period:
This ratio implies the inventory holding period. In other words, it shows the number of days
in a year is required for a firm to convert its stocks into sales. It is calculated by dividing the
number of days by inventory turnover. A high inventory holding period indicates blocking
up of funds in inventories and increase in carrying cost resulting in adverse effect on
profitability.
(c)Raw material Turnover Ratio
The ratio reflects the rate of utilization of raw material. However a very high ratio is not
good for the organization as it may lead to bottleneck in production due to stock out of raw
material. On the other hand a low turnover of raw material is an indication of accumulation
of inventory. The efficiency of utilization of raw material can also be judged from raw
material holding period.
(d)Raw material holding period:
The holding period must not be too high or too low. A high holding period leads to
accumulation of Raw material causing high carrying cost in term of shrinkage in values,
pilferage, theft administrative cost, were housing charges, lightening, heating etc .Whereas
too low holding period leads to high ordering cost and there may be interruption in
production process.
(e)Work in progress turnover ratio
DE PAUL INSTITUTE OF SCIENCE & TECHNOLOGY (DiST)
Inventory Conversion Period = Days in a year/ Inventory Turnover ratio
Raw material Turnover Ratio = Raw materials consumed during the year / Average Raw materials held
Raw material holding period = Days in a year/ Raw material Turnover Ratio

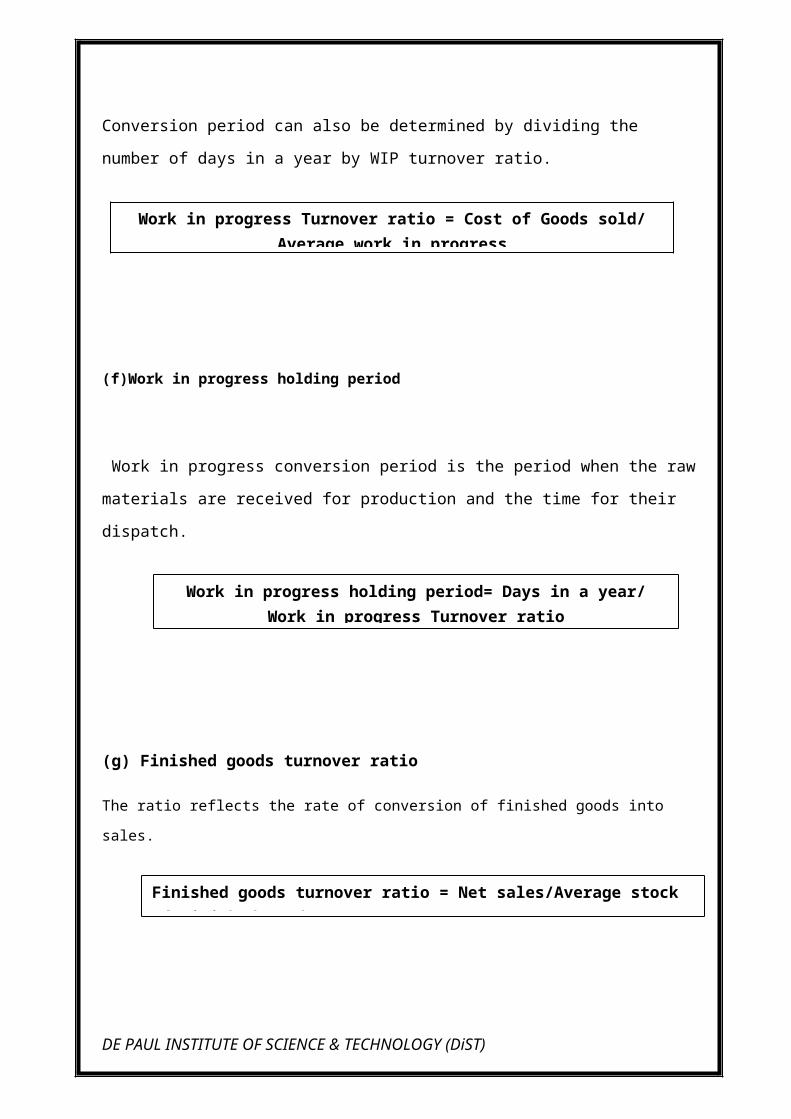
The ratio reflects the rate of utilization of work in progress. A high holding period leads to
accumulation of stock and low holding period leads to shortage of the stock. Conversion
period can also be determined by dividing the number of days in a year by WIP turnover
ratio.
(f)Work in progress holding period
Work in progress conversion period is the period when the raw materials are received for
production and the time for their dispatch.
(g) Finished goods turnover ratio
The ratio reflects the rate of conversion of finished goods into sales.
(h) Finished goods holding Period
DE PAUL INSTITUTE OF SCIENCE & TECHNOLOGY (DiST)
Work in progress Turnover ratio = Cost of Goods sold/ Average work in progress
Work in progress holding period= Days in a year/ Work in progress Turnover ratio
Finished goods turnover ratio = Net sales/Average stock of Finished Goods

A high holding period is not good from the organizations point of view as the same leads to higher
working capital.
7 Economic Order Quantity (EOQ)
EOQ refers to that number (quantity) ordered in a single purchase so that the accumulated
costs of ordering and carrying costs are at the minimum level. In other words, the quantity
that is ordered at one time should be so, which will minimize the total of (i) cost of placing
orders and receiving the goods, and (ii) cost of storing the goods as well as interest on the
capital invested.
Economic Order Quantity (EOQ) is the order size at which the total cost, comprising
ordering cost, is the least.
Ordering cost: This includes the cost of placing orders for purchase of raw materials
and components. The fewer the orders, the lower will be the ordering cost.eg costs
incurred on typing, mailing etc.
Carrying cost: This comprises the expenses for storing goods. Its components are
godown rent, insurance of goods, cost of funds tied up in inventory, spoilage costs,
decline in the price of goods, etc.
EOQ can be calculated using the following formula:
EOQ = 2A Co
C Cc
Where, A= Annual requirements in units
DE PAUL INSTITUTE OF SCIENCE & TECHNOLOGY (DiST)
Finished goods holding Period = Days in a year/ Finished goods turnover ratio

C O = Cost of placing one order
C = Inventory Carrying Cost
CC = Cost per unit
7. Lead time
Lead Time is the period that elapses between the recognition of a need and its fulfillment.
There is a direct relationship between lead time and inventories. The level of an inventory
depends upon the length of its lead time. Suppose, lead time is one month, any action taken
now will have an effect only one month later. So inventory for the current month must be in
hand. During lead time there will be no delivery of materials and consuming departments
will have to be served from the inventories held. Lead time has two components: lead time
for company (administrative lead time) from initiation of procurement action until the
placing of an order, and the lead time for the delivery of the ordered material.
Administrative lead time also follows after the delivery is taken. The functions of inspection,
material handling, and transportation in the factory also take some time. Administrative lead
time is in hands of those who are dealing with material procurement. Delivery lead time has
to be negotiated at the time of preparing purchase contract.
It is often seen that bulk of lead time is taken up by administrative lead time. This is the time
over which company has control but still too much time taken up in receiving and inspection
of goods. A business man may find to his frustration that the goods which he has persuaded
a supplier to deliver in an extremely short time have been lying in his own goods inwards
department after delivery. Stock control or purchase section of the organization should
maintain lead time schedules for all groups of materials.
9. S-OS analysis
S-OS analysis is based on seasonality of the items and it classifies the items into two groups S
(Seasonal) and OS (Off Seasonal). The analysis identifies the items which are :
DE PAUL INSTITUTE OF SCIENCE & TECHNOLOGY (DiST)

(i)Seasonal and are available only for a limited period. For example agriculture produce like
raw mangoes, raw materials for cigarette and paper industries, etc. are available for a limited
time and therefore such items are procured to last the full year.
(ii) Seasonal but are available throughout the year. Their prices are however, are lower
during the harvest time. The quantity of such items requires to be fixed after comparing the
cost savings due to lower prices if purchased during season against higher cost of carrying
inventories.
(iii) Non-seasonal items whose quantity is decided on different considerations.
10. FSN analysis:
FSN analysis is based on the consumption figures of the items. The items under this analysis
are classified into three groups: F(fast moving), S(slow moving), N(non moving).
To conduct the analysis, the last date of receipt or the last date of issue whichever is later is
taken into account and the period, usually in terms of number of months, that has elapsed
since the last movement is recorded.
Such an analysis helps to identify:
Active items required to be reviewed regularly.
Surplus items whose stocks are higher than their rate of consumption; and
Non moving items which are not being consumed. The last two categories are
reviewed further to decide on disposal action to deplete their stocks and thereby
release company’s productive capital.
Further detailed analysis is made of the third category in regards to their year-wise stocks
and items can be classified as non-moving for 2years, non-moving for 3 years, non-moving
for 5 years and so on.
DE PAUL INSTITUTE OF SCIENCE & TECHNOLOGY (DiST)

2.3 COMPANY PROFILE
DP World, which was founded in 1972, is a Dubai-based port operator mainly engaged in
the handling of containers. It has 65 terminals in Asia Pacific, India, Australia, the Middle
East, Europe, Africa and Latin America. In Peru, the company holds the concession to
Callao port’s Muelle Sur pier. It is also part owner of Buenos Aires port operator
Terminales Rio de la Plata (TRP) until October 2019. In Brazil, DP World is involved in
the startup and operation of the Santos port, Brazil’s largest private maritime terminal,
through its local subsidiary Terminais Portuários (Embraport).
DP World is an Emirati marine terminal operator. The company is based in Dubai and is
one of the largest marine terminal operators in the world. The company operates more than
60 terminals across six continents, with container handling generating around 80% of its
revenue. In addition, the company has 11 new developments and major expansion
underway in 10 countries .In 2011 DP world handled nearly 55 millions TEU (Twenty –
foot-equivalent container units) across its portfolio from Americas to Asia .With the
pipeline of expansion and development projects in key growth markets, including
India,China,and the Middle east ,capacity is expected to rise to around 92 million TEU BY
2020,in line with market demand .It employs 30,000 people .A majority of the company is
owned by Dubai World.
The company was founded by the merging Dubai Port authority and Dubai Port
International .It purchased peninsular and oriental stream navigation company of the united
kingdom in 2006 for $7billion, which was at the time the world’s fourth largest port
operator shares representing 20% of the company were floated on the NASDAQ Dubai
stock exchange in 2007.The company does not currently operate in the United States
where its purchase of a number of U.S ports led to high level controversy.
In addition to its marine terminals business, DP World also operates P&O Marine, World
Crane Service, DP World Cargo Services, and DP World intermodal.
P&O Marine owns and operates a fleet of specialist vessels, icebreakers and river barges,
providing logistics solutions to public and private sector customers.
DE PAUL INSTITUTE OF SCIENCE & TECHNOLOGY (DiST)

World Crane Services ,established in 2002, is rapidly growing business offering third party
inspection services with respect to new building of container handling equipment ,as well
as on site inspection services for existing equipment .it provides quality services designed
to enhance the condition ,performance and lifetime cost of operating mechanical handling
equipment on the individuals terminal.
DP World cargo service is one of the South Africa’s major stevedoring companies and is
able to offer a full complement of stevedoring services, which include containers, bulk,
general cargo, project cargoes as well as car carriers, reefer vessels and passenger vessel
stores & baggage handling.
VISION
Sustainable value through global growth, services and excellence
MISSION
A global approach to a local business environment where excellence, innovation and
profitability drive our core business philosophy of exceptional customer service.
VALUE
Commitment to our people and our customers
Profitable global growth
Responsible corporate and personal behavior
Excellence and innovation
HISTORY
DP World was formed in September 2005 with the integration of the terminal operations of
the Dubai Ports Authority (DPA),which was focused on the UAE ports of Rashid and Jebel
Ali ,and DPI (Dubai Ports International)which had been set up to export this success
internationally.
DE PAUL INSTITUTE OF SCIENCE & TECHNOLOGY (DiST)
When it was first established in 1999, DPI had initially applied its expertise to managing
ports in the Middle East, India and Europe. Its first project was at Jeddah Islamic Port (in
1999), where its collaborated with its local partner on the management and operation of the
south container terminal (SCT).In 2003, SCT was the first terminal in the kingdom of
Saudi Arabia to exceed 1 million TEU (twenty foot equivalent container)and volumes in
2004 exceeded 1.3 million TEU.DPI then went on to develop successful operations at the
ports of DJIBOUTI (2000)India(2002)and constanta,Romania (2003).
In January 2005, DPI transformed its network with the strategic acquisition of CSX world
terminals (CSX WT), the international terminal business of CSX corporation .this
acquisition gave the company a strong presence in Asia with major operations Hong Kong
and china as well as operations in Australia, Germany, Dominican republic and Venezuela.
Importantly for the future development and expansion of its network, DP World also
acquired CSX WT’s strong project pipeline ,which included the 9-berth Pusan Newport
(PNC),south Korea ,where DP world holds the management contract as well as a
significant equity interest ,and other projects in the rapidly expanding markets of India and
the middle east.
In February 2005, DP World signed an agreement with the cochin port trust (CPT) to
construct, develop and operate an international container transshipment terminal at
vallarpadam, kochi, india.
In March 2005, DP World was awarded a 30-year concession to develop and operate the
container terminal at the port of Fujairah, in the UAE.
In November 2005, we also announced agreements to develop new container terminals’ at
Yarmica, turkey and Qingdao, china.
DP World also has interests in logistics business in Hong Kong and china, notably
ATL ,the market leading logistics operator based at Kwai Chung,Hong Kong.
With 30,000 employees worldwide, DP World provides a wide variety of learning and
development opportunities equipping individuals with the skills to do their job and to
pursue carriers.
DE PAUL INSTITUTE OF SCIENCE & TECHNOLOGY (DiST)

Our training and learning arm, the DP World institute, delivers these programmes across
the organisation.As the centre of learning excellence it provides our people with the tools
to learn new skills and to invest in their own development.
DP WORLD IN COCHIN
In 2004 DP World won the concession to operate the Rajiv Gandhi Container Terminal
and to develop the International Container Transshipment Terminal at Vallarpadam.
Cochin Port is located next to the East-West trade route, only eleven nautical miles from
the direct Middle East - Far East sea-route. No other Indian port enjoys such a strategic
geographic proximity to the major maritime sea routes. DP World Cochin serves as the
natural gateway to the vast industrial and agricultural produce markets of the South &
West of India. The hinterland of the port includes the state of Kerala and parts of
Tamilnadu and Karnataka. Improved road and rail connectivity have substantially reduced
the transit time and logistics cost making Cochin Port a preferred gateway for exports &
imports from/to the hinterland.
Since the official handover in April 2005, DP World's operational expertise has
significantly improved efficiencies. Investment in quayside and yard-handling equipment
has been focused on improving productivity.
The application of IT plays a vital role at the terminal. Its state-of-the-art IT infrastructure,
technology and support have been specifically tailored to facilitate the smooth flow of
traffic and transactions keeping the trade in south India in mind.
Opened in 2011, DP World cochin is the first ever dedicated transshipment and gateway
hub in India, and the largest single-operator terminal container terminal in the country.
The new terminal located on vallarpadam island within the port of cochin, is a public
private partnership(PPP)between DP World and the government of india,with container
corporation of india,transworld and chakiat also strategic partners in the venture. The
government of India constructed and enhanced supporting infrastructure such as a four
lane national highway connecting the terminal to the rest of India. A new 8 –kilometer
DE PAUL INSTITUTE OF SCIENCE & TECHNOLOGY (DiST)

electrified rail link will also allow 15 trains to serve the terminal daily, connecting
customers directly with indias national rail network cochin serves as the natural gateway to
the vast industrial and agricultural produce markets of the south and west of india.the
hinterland of this port includes the state of Kerala and parts of Tamil nadu and Karnataka.
Improved road and rail connectivity have substantially reduced the transit time and
logistics cost, making Cochin port a preferred gateway for exports and imports from /to the
hinterland. Enjoying a strategic position along the major Far East Europe trade lanes, DP
World Cochin targets not only southern India origin and destination volumes, but also
regional transshipment traffic. The new terminal is indented to make cochin a key centre in
the shipping world reducing India’s dependency on foreign ports to handle
transhipment.DP World cochin will be completed In three phases, the 600 meter long quay
with a draught of around 14.5 meters is able to simultaneously serve of the world’s largest
container ships –those with a nominal capacity of around 10,000 TEU (twenty foot
equivalent container units)-with capacity to handle 1 million TEU annually. Capacity will
expand in line with market demand, increasing to around 1.5 million TEU in the second
phase, once fully commissioned, capacity will be around 4 million TEU.
DE PAUL INSTITUTE OF SCIENCE & TECHNOLOGY (DiST)

DE PAUL INSTITUTE OF SCIENCE & TECHNOLOGY (DiST)

DE PAUL INSTITUTE OF SCIENCE & TECHNOLOGY (DiST)
DE PAUL INSTITUTE OF SCIENCE & TECHNOLOGY (DiST)

DE PAUL INSTITUTE OF SCIENCE & TECHNOLOGY (DiST)

DE PAUL INSTITUTE OF SCIENCE & TECHNOLOGY (DiST)

RESEARCH METHODOLOGY
INTRODUCTION
When we talk of research methodology, we not only talk of the research methods but also
the comparison of the logic behind the methods, we use this context in our research study
DE PAUL INSTITUTE OF SCIENCE & TECHNOLOGY (DiST)

and explain why we are using a particular method or technique and why using the others.
Research methodology is a way to systematically solve the research problem. It may be
understood as a science of studying how research is done systematically. In this we study
various steps that are generally adopted by the researcher in studying his research problem
along with the logic behind them.
As the study is analyze probing in nature, which is entirely based on the secondary data
gathered through the various reports of the industry. Therefore it provides a historical
perspective of decisions.
RESERCH METHODS
Research method may be understood as those method or techniques that are used for
conduction of research. All those methods which are used by the researcher during the
course of studying the research problem are termed research methods. Keeping in view, the
research methods can be put into following three groups:
In the first group we include those methods which are concerned with the collection
of data. Those methods will be used where the data already available are sufficient to
arrive at the required solution.
The second group consists of those statistical techniques which are used to establish
relationships between the data and the unknown.
The third group consists of those methods which are used to evaluate the accuracy of
the obtained results.
METHOD USED FOR STUDY
ANALYTICAL STUDY METHOD (STATISTICAL METHOD)
Statistical method is a system of procedures and techniques of analysis
applied to quantitative data. It consists of a system of statistical techniques applicable to
numerical data. Statistical methods are a mechanical process especially designed to facilitate
the consideration and the analysis of the large body of quantitative data. The aim of
statistical method is to facilitate comparison, study relationship between the two phenomena
and to interpret the data for the purpose of analysis.
DE PAUL INSTITUTE OF SCIENCE & TECHNOLOGY (DiST)

Uses of statistical methods
It helps in comparison between present and past.
It is useful to make projection and to make predictions.
Relationship can be studied.
It helps to form probable inferences.
It describes facts through presentation of data.
Its approach is quantitative and hence definite and reliable.
Disadvantages of statistical method
It can be misused by inexpert.
It can be applied only to quantitative data.
It can be used to study only aggregates.
In the qualitative approach, the subjective assessment of attitudes, opinions,
behaviour will be done. Research in such situation is a function of researcher’s insight and
impressions. Such an approach to researchers generates results either in non-qualitative
form.
Type of research
The design followed is descriptive research. It is based on the internal records and the
annual records of the company. Besides, information is gathered from the officers of the
company. Here the researcher attempts to present the existing facts by collecting data. It
is a research of fact finding.
Sources for data collection
The data for the study were collected in the following manner.
1. Primary data collected through investigation.
2. Secondary data has been collected by reffering the various records, reports and the website of the company.
Tools for analysis
Comparative Statement
DE PAUL INSTITUTE OF SCIENCE & TECHNOLOGY (DiST)

Common size Statement Ratio analysis Trend analysis
Representation
Tables,
Figures, and
Charts.
DE PAUL INSTITUTE OF SCIENCE & TECHNOLOGY (DiST)

ANALYSIS AND INTERPRETATION
DE PAUL INSTITUTE OF SCIENCE & TECHNOLOGY (DiST)

Analysis and Interpretation:
The term “Analysis and Interpretation” means methodical classification of data given in the
financial statements and explaining the meaning and significance of the data so classified.
The analysis and interpretation of financial statements are an attempt to determine the
significance and meaning of the financial statement data so that a forecast may made of the
prospects of the future earning, ability to pay debt and probability of a sound dividend
policy.
Following are the methods used for analysing efficiency and effectiveness of company’s
inventory management system:
1. Turnover Ratios
2. Computation of Economic Order Quantity (EOQ)
3. VED analysis
4. ABC analysis
Inventory turnover Ratio
The inventory turnover ratio indicates the number of times the inventories are replenished or
number of times a company sells its inventory during the year. The higher the ratio, the
better it is, since it indicates that the stock is selling quickly.
DE PAUL INSTITUTE OF SCIENCE & TECHNOLOGY (DiST)

Table no. 5.1.1 showing Inventory turnover Ratio
Year Average Inventory Cost Of Issue Inventory Turnover Ratio
2009-2010 34633578.6 94457934.61 2.727
2010-2011 34808264.39 66162393.47 1.901
2011-2012 35031384.03 62655546.26 1.788
2012-2013 32176724.75 75875659.02 2.358
2013-2014 28925197.71 85669084.66 2.962
Source: Annual reports Of DP World Cochin.
Figure no.1.1 showing Inventory turnover Ratio
DE PAUL INSTITUTE OF SCIENCE & TECHNOLOGY (DiST)
Inventory Turnover Ratio = Cost of goods sold/ Average inventory
Cost of goods sold = (Opening stock + Purchases) - Closing stock
Average Inventory = (Opening stock+ Closing stock)/2

Source: Annual reports Of DP World Cochin.
Interpretation:
The inventory turnover ratio is seen fluctuating over the years. In the year 2013-14, the ratio
is the highest. The higher ratio indicates the larger movement of stock from the stores which
means more cost incurred. The financial year 2011-12 indicates the lowest turnover which
shows less movement to spares from stores.
5.1.2 Inventory Conversion Period:
It shows the number of days in a year is required for a firm to convert its stocks into sales or
to exhaust the spares in the stores. It is calculated by dividing the number of days by
inventory turnover.
Table no. 1.2 showing Inventory Conversion period
Year Days in a Year Inventory Turnover Inventory
DE PAUL INSTITUTE OF SCIENCE & TECHNOLOGY (DiST)
Inventory Conversion Period = Days in a year/ Inventory Turnover ratio

Ratio Conversion Period
2009-2010 360 2.727 132.01
2010-2011 360 1.901 189.37
2011-2012 360 1.788 201.34
2012-2013 360 2.358 152.67
2013-2014 360 2.962 121.53
Interpretation:
In the year 2011-12 the inventory conversion period was found to be the highest. But in the
year 2013-2014 and 2009-2010 showed the lower conversion period. The lesser the
conversion period, more is the frequency of movement of spares due to increase in
maintenance of the equipments
Inventory to Current Asset Ratio
Inventory to Current Asset Ratio reveals how much the contributions of inventory to the
current asset in the organization. This helps to decide in advance the amount required to be
invested in the inventory.
Table No.1.3 showing Inventory to Current Asset Ratio
Year Inventory Current Asset Ratio in %
2009-10
2010-11
DE PAUL INSTITUTE OF SCIENCE & TECHNOLOGY (DiST)
Inventory to Current Asset Ratio= (Inventory/Current Asset) *100

2011-12
2012-13
2013-14
Interpretation
Economic Order Quantity (EOQ)
Economic Order Quantity (EOQ) is the order size at which the total cost, comprising
ordering cost and carrying cost, is the least.
EOQ = 2A Co
C Cc
Where, A= Annual requirements in units
C O = Cost of placing one order
C = Inventory Carrying Cost
CC = Cost per unit
DE PAUL INSTITUTE OF SCIENCE & TECHNOLOGY (DiST)

5.2.1 EOQ of Wire Rope 12 MM
Table no.5.2.1 showing EOQ of Wire Rope 12 MM
Year
Annual
Consumption
Ordering
Cost
Cost per
unit
Carrying
Cost
EOQ
2011-12 3185 600 108 .16 470
2012-13 3114 600 99 .16 486
2013-14 889 650 117 .16 314
2014-15 2035 650 148 .16 334
DE PAUL INSTITUTE OF SCIENCE & TECHNOLOGY (DiST)

Interpretation:
The EOQ of Wire Rope 12 MM showed a varying trend. In the year 2012-13 it showed
comparatively a better position as the ordering cost (600) and cost per unit (99) are
minimum and the EOQ is maximum(486)
5.2.1 EOQ of Wire Rope 24mm
Table no.5.2.1 showing EOQ of Wire Rope 24mm
Year Annual
Consumption
Ordering
Cost
Cost per
unit
Carrying
Cost
EOQ
2011-12 1567 645 887 .16 119
2012-13 1787 640 910 .16 125
2013-14 1617 650 957 .16 117
2014-15 872 635 401 .16 131
DE PAUL INSTITUTE OF SCIENCE & TECHNOLOGY (DiST)

Interpretation:
The EOQ of Wire Rope 22 MM showed a varying trend. In the year 2014-15 it showed
comparatively a better position as the ordering cost (635) and cost per unit (401) are
minimum and the EOQ is maximum (131). The annual consumption of the spare is
reduced year after year due to efficient maintenance and stores management.
5.2.1 EOQ Of Filter Fuel
Table no.5.2.1 Showing EOQ of Filter Fuel
Year Annual
Consumption
Ordering
Cost
Cost per
unit
Carrying
Cost
EOQ
2011-12 271 645 1301 .16 41
2012-13 156 650 1553 .16 28
2013-14 76 650 1756 .16 19
DE PAUL INSTITUTE OF SCIENCE & TECHNOLOGY (DiST)

2014-15 89 660 2094 .16 19
Interpretation:
The EOQ of filter fuel showed a varying trend as the consumption of the item has
reduced considerably after 2011-2012 .The year 2011-12 showed comparatively a better
position as the ordering cost (645) and cost per unit (1301) are minimum and the EOQ is
maximum (41).
5.2.1 EOQ of Filter Lube Oil
Table no.5.2.1 showing EOQ of Filter Lube Oil
Year Annual
Consumption
Ordering
Cost
Cost Per
Unit
Carrying
Cost
EOQ
2011-12 271 640 1575 .16 37
2012-13 155 645 1896 .16 26
2013-14 75 650 2156 .16 17
DE PAUL INSTITUTE OF SCIENCE & TECHNOLOGY (DiST)

2014-15 90 650 2559 .16 17
Interpretation:
The EOQ of filter Lube Oil showed a varying trend and the consumption of the item has
reduced considerably after 2011-2012 .The year 2011-12 showed comparatively a better
EOQ as the ordering cost (640) and cost per unit (1575) are minimum and the EOQ is
maximum (37).
5.2.1 EOQ of ROTEX Coupling
Table no.5.2.1 showing EOQ of ROTEX Coupling
Year Annual
Consumption
Ordering
Cost
Cost per
Unit
Carrying
Cost
EOQ
2011-12 21 650 516 .16 18
2012-13 32 640 581 .16 21
DE PAUL INSTITUTE OF SCIENCE & TECHNOLOGY (DiST)

2013-14 9 650 626 .16 11
2014-15 12 650 1027 .16 10
Interpretation:
The EOQ of ROTEX Coupling showed a varying trend and the consumption of the item
has reduced considerably after 2011-2012 .The year 2012-13 showed comparatively a
better EOQ as the ordering cost (640) and cost per unit (581) are minimum and the EOQ
is maximum
VED Analysis
Table no.5.3.1 showing VED analysis
Vital Items Essential Items Desirable Items
High Speed Diesel (HSD) Coolant (Volvo) Ready Mix Oxygen Gas in Returnable Cylinders.
Battery/Distilled Water Rivet Brake Shoe Paints & painting materials
Rectifier Bolt with nut 5/8*5/16 18G5 Clearing items
DE PAUL INSTITUTE OF SCIENCE & TECHNOLOGY (DiST)

Electrical equipment Electrical fittings Uniform materials
Chlorinate cylinder Valve 20 mm
Pumps & motors Wood materials
Silver Gasket 110 mm*160 mm
Hand tools Pumping materials
PTFME Bellows with MS
Flanges
Material Handling Equipment
Rust OFF 300GMS WURTH/ZEBRA
EPDM Moulded Rubber Gasket
Diesel Engine & spares M Seal Epoxy 90 GMS Packing.
Ceramic Rasching Ring Pressure transmitters ‘T’ type strainer
Anode Gasket Level indicators Cotton Rags/Bits of Minimum Size 12”*12”
EDPM with steel insert Gasket
Fuels & Lubricants Steel bearing Balls
Spring Washer ID5MMX1 Pipe & pipe Fittings Gloves Leather 10.5” Size
Cable,Copper,Flexible,1.0Sq MM
Face Mask Disposable- Green
Soldering Lead-Wire Insulation Tape- Red/Green/Black/Yellow/Blue
Oil AMOCAM 220 Tape Caution Barricading
Engine OIL 150W40 Premium Blue Cl 4
G.M Globe Valve S/E 25 mm
Table no. showing Consolidated statement of VED analysis
Categories Total number of items in Classes
Percentage
V 12 27
DE PAUL INSTITUTE OF SCIENCE & TECHNOLOGY (DiST)

E 17 39
D 15 34
Total 44 100
Interpretation:
For VED analysis 44 spare parts from different categories were considered. Out of these, 12
of them can be grouped under the category ‘Vital items’, 17 can be categorized under
‘Essential items ‘and remaining 15 under ‘Desirable items’. If there is a stock-out for vital
spares even for a short time will stop production so that cost of stock-out is very high.
Therefore every effort should be made to ensure the availability of these spare parts at any
time. The absence spares cannot be tolerated for more than a few hours or a day as it would
lead to huge loss to company as well as the service takers. For the desirable spares their
absence for a week will not lead to stoppage of production.
ABC Analysis :
Spare Part Name No of Items
Value Annual Cumulative Value
Percentage Value
Category
WIRE ROPE 28MM POWERFORM-81960 IWRC; RHO LAY; 4706
3779150 3779150 45.459%
A
OIL ENGINE 15W40 PREMIUM BLUE C14
5103 864037 4643187 10.393%
DE PAUL INSTITUTE OF SCIENCE & TECHNOLOGY (DiST)

OIL MAK ATF-A 425 644155 5287342 7.749%
OIL AMOCAM 220 3069 482251 5769593 5.801%
WIRE ROPE DRESSING COMPOUND - ROCOL 20024 497 417946 6187539 5.027%
B
WIRE ROPE 24 MM 6/36,RHOL,1960N/SQ,MM,GALVANISED. 813 326500 6514039 3.927%
WIRE ROPE 12MM ANTISWAY 18/7, 1770 N/SQ.MM 1765 248735 6762774 2.992%
OIL AUTOTRANSFLUID D111 533 208636 6971410 2.510%
OIL AMOCAM 320 1231 191816 7163226 2.307%
OIL HYDRO, HPL46 1187 172612 7335838 2.076%
COOLANT(VOLVO) READY MIX PART NO 1141674 279 163959 7499797 1.972%
OIL ELF TRACTELF SF -31 488 150788 7650585 1.814%
C
COTTON RAGS/BITS OF MINIMUM SIZE 12"*12 1862 148627 7799212 1.788%
OIL MAK HYDROL HPL-68 987 145720 7944932 1.753%
GLOVES LEATHER 10.5" SIZE NEW MODEL AND TYPE 790 141850 8086782 1.706%
ANABOND 666- 310GM 282 90409 8177191 1.088%
GREASE MOLY RT 362 88501 8265692 1.065%
OXYGEN GAS IN RETURNABLE CYLINDERS 282 20567 8286259 0.247%
C
CUTTING WHEEL 5" 1 MM THICK, SPEED ABOVE 12220 RPM 254 9414 8295673 0.113%
BATTERY/ DISTILLED WATER BULK PACKING 632 6599 8302272 0.079%
TAPE CAUTION BARRICADING TAPE 3 " WIDTH X500 MTR ONE 3994 4847 8307119 0.058%
DE PAUL INSTITUTE OF SCIENCE & TECHNOLOGY (DiST)

AUTO CABLE,FLEXIBLE,COPPER,SINGLE CORE,1.5 SQ.MM 253 4108 8311227 0.049%
FACE MASK DISPOSIBIL GREEN 700 882 8312109 0.011%
M SEAL EPOXY 90 GMS PACKING 2160 791 8312900 0.010%
MASK F1 ELASTIC 300 378 8313278 0.005%
TOTAL 100
ABC Analysis:
Category No. of Items Percentage of Items Percentage of value
A
4 16 69.402
B
7 28 20.813
C
14 56 9.785
TOTAL 25 100 100
DE PAUL INSTITUTE OF SCIENCE & TECHNOLOGY (DiST)

Interpretation:
For ABC analysis 25 materials were taken. Out of these, 4 items are under the category “A”,
7 items under the category “B”, and 14 items under the category “C”. For” A” items
percentage of value is 69.402, for B items 20.813 and for C items 9.785.
DE PAUL INSTITUTE OF SCIENCE & TECHNOLOGY (DiST)

FINDINGS, SUGGESTIONS AND CONCLUSION
Findings
Purchasing and stocking of spares for the maintenance of cranes, fork lifts and other
engineering equipment’s are mainly dependent on the periodicity of wear and tear of
equipment’s and the need for various service related spares and materials.
The inventory control department (Stores) utilises Managerial information Software
(IFS) for management and control of inventories. The staffs are able to control and
DE PAUL INSTITUTE OF SCIENCE & TECHNOLOGY (DiST)

coordinate inventory without any hustle bustle very effectively using the integrated
financial Software (IFS).
The inventory turnover ratio is fluctuating over the years. In the year 2013-14, the ratio is
highest. The higher ratio indicates the larger movement of stock from the stores which
means more cost incurred. The financial year 2011-12 indicates the lowest turnover which
shows more efficient maintenance of equipment’s.
In the year 2011-12 the inventory conversion period was found to be the highest. But in
years 2013-2014 and 2009-2010 showed a lower conversion period. The lesser the
conversion period, More is the frequency of movement of spares due to increase in
maintenance of the equipments.
EOQ will be good for a firm when in a single purchase the accumulated costs of
ordering and carrying costs are at the minimum level.
The EOQ of Wire Rope 12 MM showed a varying trend. In the year 2012-13 it
showed comparatively a better position as the ordering cost (600) and cost per unit
(99) are minimum and the EOQ is maximum(486).
The EOQ of Wire Rope 22 MM showed a varying trend. In the year 2014-15 it
showed comparatively a better position as the ordering cost (635) and cost per unit
(401) are minimum and the EOQ is maximum (131). The annual consumption of the
spare is reduced year after year due to efficient maintenance and stores management.
The EOQ of filter fuel showed a varying trend as the consumption of the item has
reduced considerably after 2011-2012 .The year 2011-12 showed comparatively a
better position as the ordering cost (645) and cost per unit (1301) are minimum and
the EOQ is maximum (41).
The EOQ of filter Lube Oil showed a varying trend and the consumption of the item
has reduced considerably after 2011-2012 .The year 2011-12 showed comparatively
DE PAUL INSTITUTE OF SCIENCE & TECHNOLOGY (DiST)

a better EOQ as the ordering cost (640) and cost per unit (1575) are minimum and
the EOQ is maximum (37).
The EOQ of ROTEX Coupling showed a varying trend and the consumption of the
item has reduced considerably after 2011-2012 .The year 2012-13 showed
comparatively a better EOQ as the ordering cost (640) and cost per unit (581) are
minimum and the EOQ is maximum (21).
For VED analysis 44 spare parts from different categories were considered. Out of these, 12
of them can be grouped under the category ‘vital items’, 17 can be categorised under
‘Essential items ‘and remaining 15 under ‘Desirable items’. If there is a stock-out for
vital spares even for a short time will stop production so that cost of stock-out is very
high. For essential spares, the absence of which cannot be tolerated for more than
few hours or a day. In case of the desirable spares, their absence for a week will not
lead to stoppage of production.
For ABC analysis 25 materials were taken. Out of these, 4 items are under the
category “A”, 7 items under the category “B”, and 14 items under the category “C”.
For” A” items the percentage of value is 69.402, for B items 20.813 and for C items
9.785. Therefore the items like WIRE ROPE 28MM, OIL ENGINE 15W40
PREMIUM BLUE, OIL MAK ATF –A and OIL AMOCAM-220 requires more
strict control system.
Therefore the items like Common salt, Barium carbonate and Furnace oil requires
more strict control system.
DE PAUL INSTITUTE OF SCIENCE & TECHNOLOGY (DiST)

6.2 Suggestions:
1. Serial numbers of spares can be barcoded and a barcode scanner can be used for
more easy detection and input of data to the IFS software.
2. Integrated inventory management system should be always effectively applied in the
company.
3. The company should follow ABC analysis effectively in inventory control.
4. A new policy of keeping constant inventory to CA is preferred.
5. Ordering cost of spares can be minimised by proper vendor selection and contracts.
6. The management should try to avoid the problems like overstocking and under
stocking of inventory and the spares must be issued without any delay after getting
the requisition order.
DE PAUL INSTITUTE OF SCIENCE & TECHNOLOGY (DiST)

7. The company should adopt the modern inventory control techniques such as Just In
Time (JIT) Management. .
6.3 Conclusion:
DP Word is a pioneer in providing stevedoring services across the world. The
multinational transshipment company has created reliability and credibility among the
customers due to its excellence in service. With excellent sea port facility and proximity
to high way and railway line, DP World is able to manage its business profitably and
efficiently. Inventory management in DP World is successful in solving the problem
relating to bottlenecks and also paves way for reducing the huge investment or blocking
of investment in inventory. Company, with the use of Integrated Financial system
software (MIS) is able to manage stores and other departments very effectively.
From the analysis it was concluded that the company can continue following the EOQ
method for optimum purchase of spares and it can maintain safety stock for its
components in order to avoid stock out conditions. This would reduce the cost and
enhance the profit. The Company takes into consideration many effective inventory
DE PAUL INSTITUTE OF SCIENCE & TECHNOLOGY (DiST)

analysis techniques like ABC analysis and VED analysis for proper management of
inventory in the company.
DE PAUL INSTITUTE OF SCIENCE & TECHNOLOGY (DiST)

DE PAUL INSTITUTE OF SCIENCE & TECHNOLOGY (DiST)