Embed Size (px)
Citation preview
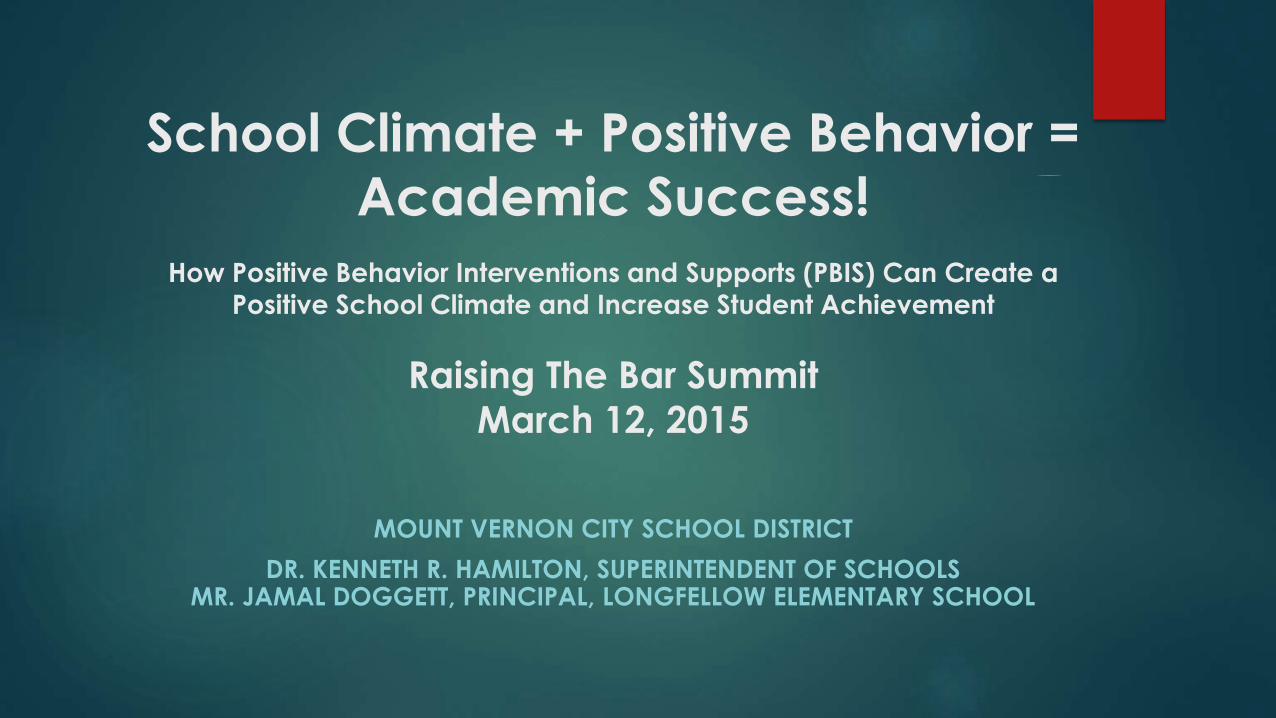
School Climate + Positive Behavior =
Academic Success!
How Positive Behavior Interventions and Supports (PBIS) Can Create a
Positive School Climate and Increase Student Achievement
Raising The Bar Summit
March 12, 2015
MOUNT VERNON CITY SCHOOL DISTRICT
DR. KENNETH R. HAMILTON, SUPERINTENDENT OF SCHOOLSMR. JAMAL DOGGETT, PRINCIPAL, LONGFELLOW ELEMENTARY SCHOOL

Longfellow Elementary School
Demographic Data
2
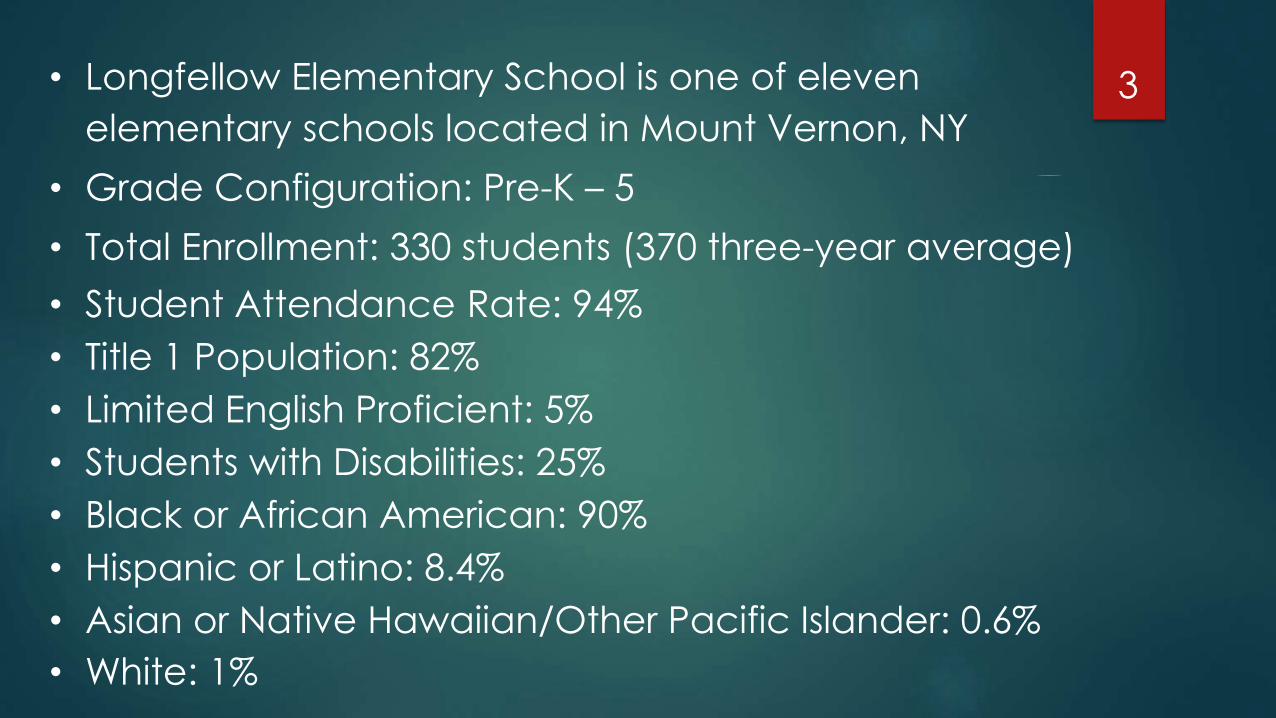
• Longfellow Elementary School is one of eleven
elementary schools located in Mount Vernon, NY
• Grade Configuration: Pre-K – 5
• Total Enrollment: 330 students (370 three-year average)
• Student Attendance Rate: 94%
• Title 1 Population: 82%
• Limited English Proficient: 5%
• Students with Disabilities: 25%
• Black or African American: 90%
• Hispanic or Latino: 8.4%
• Asian or Native Hawaiian/Other Pacific Islander: 0.6%
• White: 1%
3
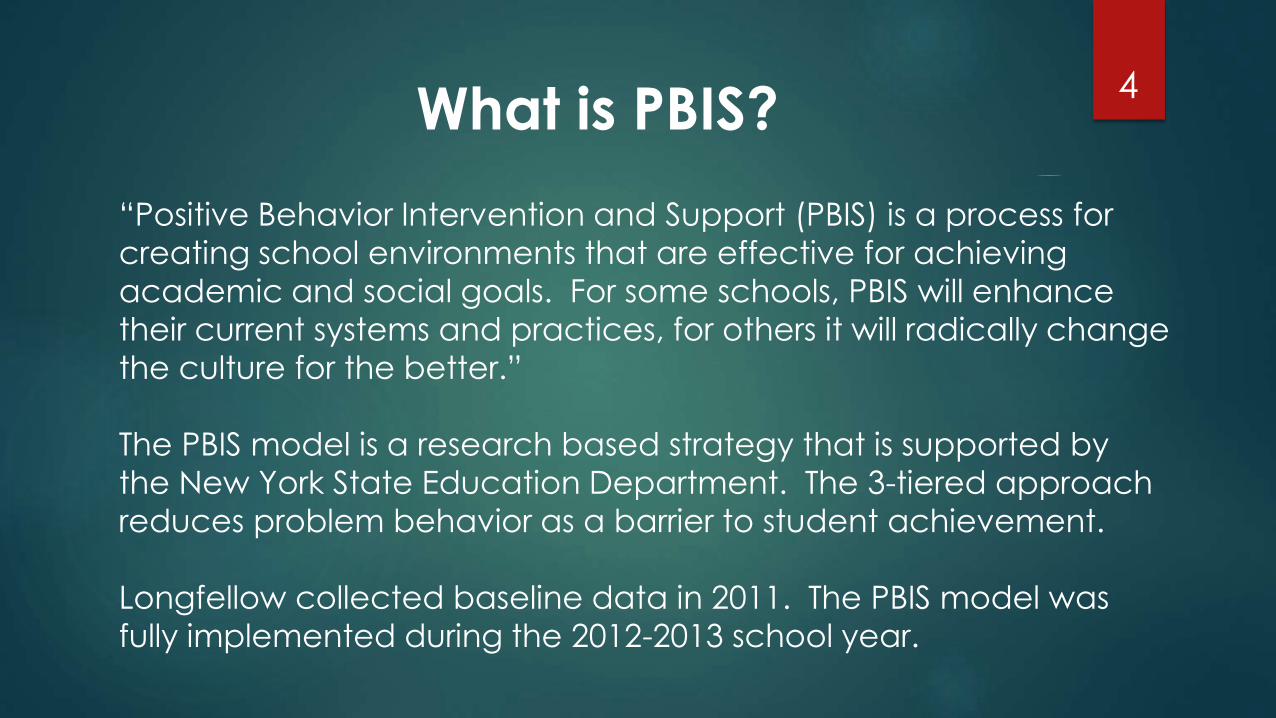
What is PBIS?
“Positive Behavior Intervention and Support (PBIS) is a process for
creating school environments that are effective for achieving
academic and social goals. For some schools, PBIS will enhance
their current systems and practices, for others it will radically change
the culture for the better.”
The PBIS model is a research based strategy that is supported by
the New York State Education Department. The 3-tiered approach
reduces problem behavior as a barrier to student achievement.
Longfellow collected baseline data in 2011. The PBIS model was
fully implemented during the 2012-2013 school year.
4
Where was Longfellow
Elementary School before
fully implementing PBIS?
5
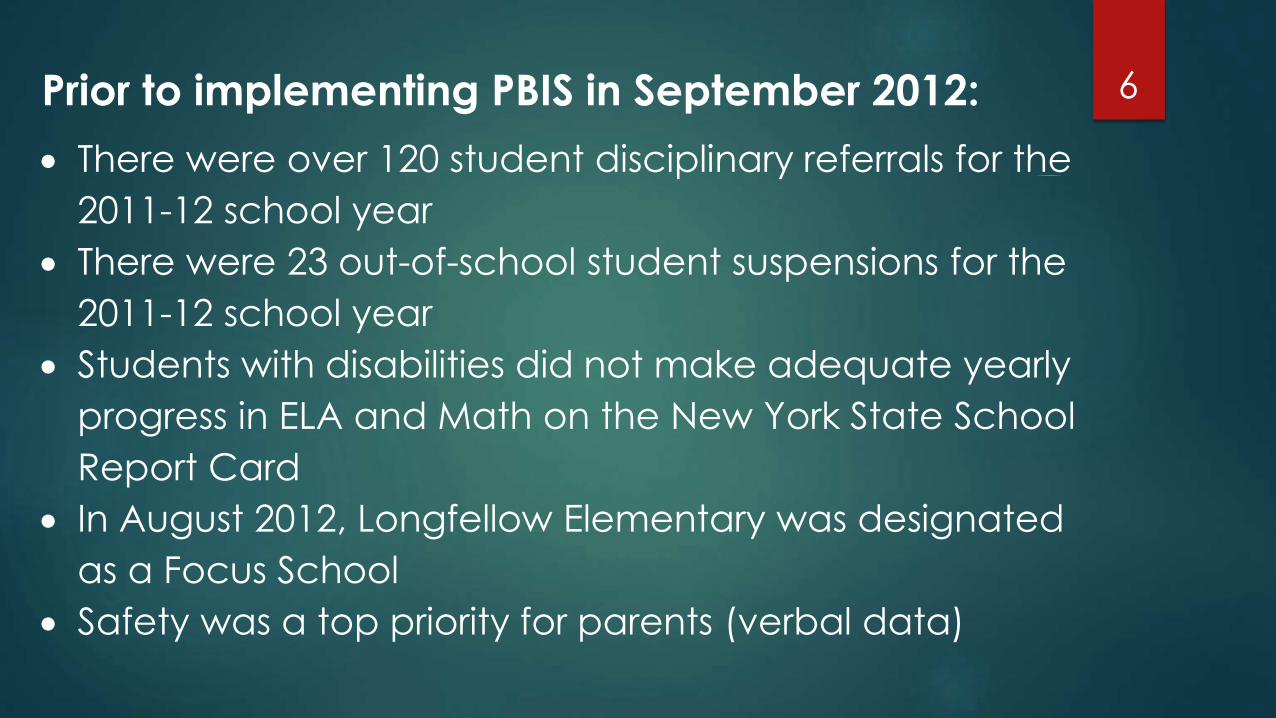
Prior to implementing PBIS in September 2012:
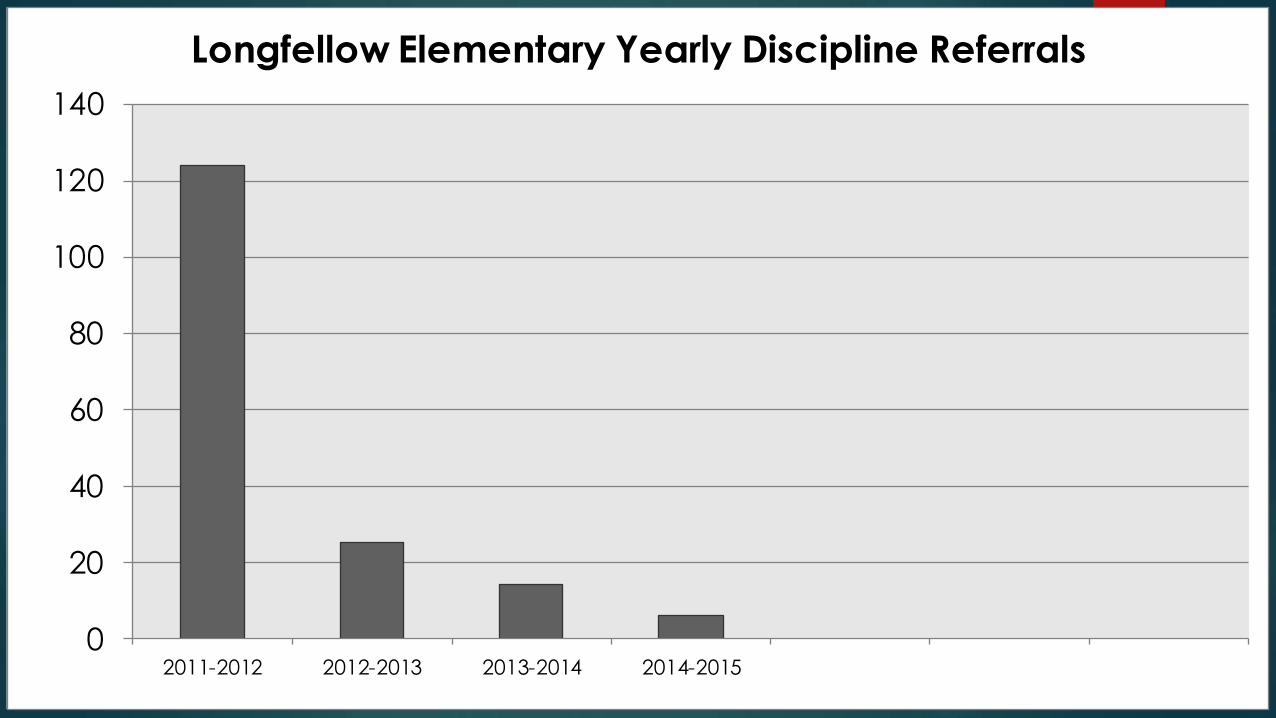
There were over 120 student disciplinary referrals for the
2011-12 school year
There were 23 out-of-school student suspensions for the
2011-12 school year
Students with disabilities did not make adequate yearly
progress in ELA and Math on the New York State School
Report Card
In August 2012, Longfellow Elementary was designated
as a Focus School
Safety was a top priority for parents (verbal data)
6
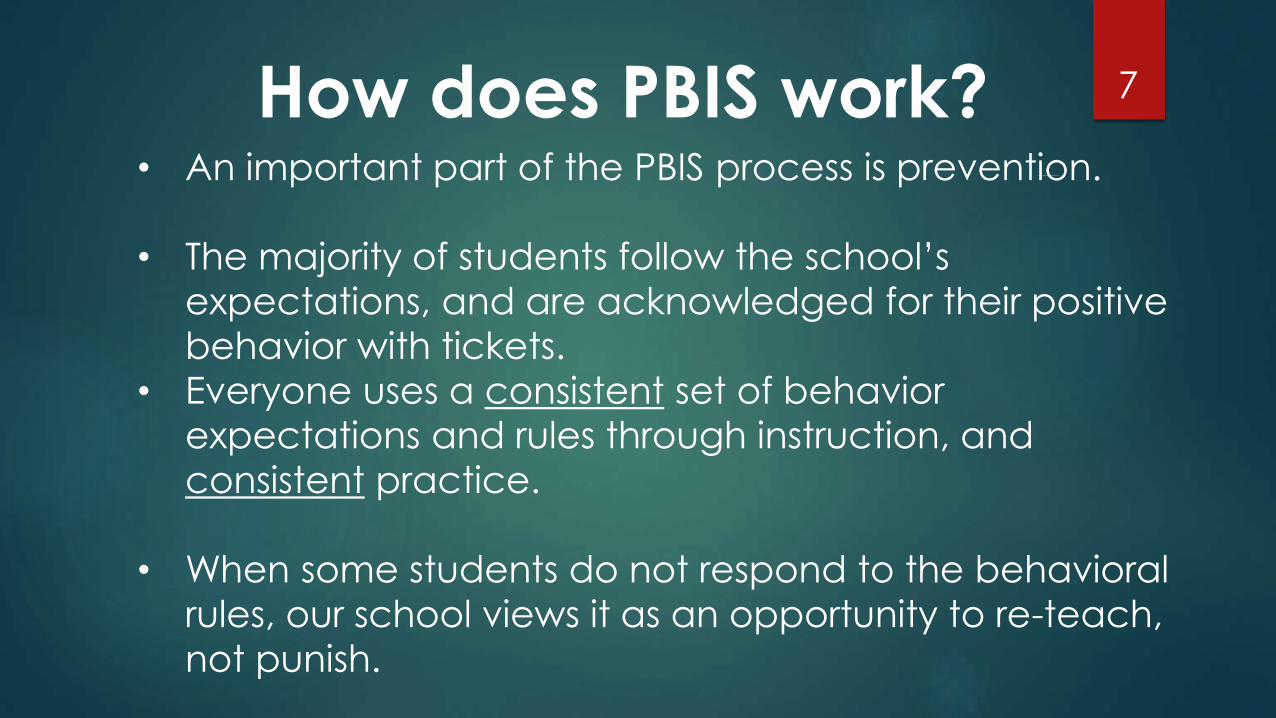
• An important part of the PBIS process is prevention.
• The majority of students follow the school’s
expectations, and are acknowledged for their positive
behavior with tickets.
• Everyone uses a consistent set of behavior
expectations and rules through instruction, and
consistent practice.
• When some students do not respond to the behavioral
rules, our school views it as an opportunity to re-teach,
not punish.
How does PBIS work? 7
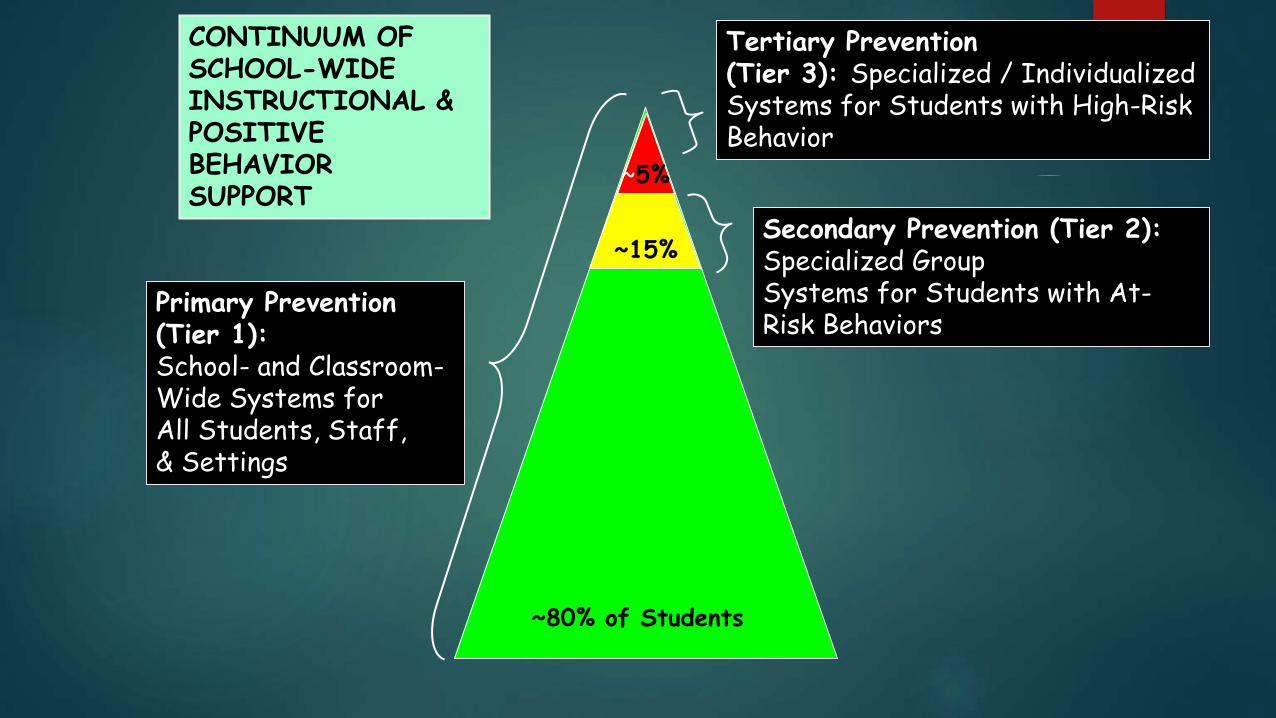
Primary Prevention (Tier 1):School- and Classroom-Wide Systems forAll Students, Staff, & Settings
~80% of Students
~15%
~5%
CONTINUUM OFSCHOOL-WIDE INSTRUCTIONAL & POSITIVE BEHAVIORSUPPORT
Tertiary Prevention (Tier 3): Specialized / IndividualizedSystems for Students with High-Risk Behavior
Secondary Prevention (Tier 2):Specialized GroupSystems for Students with At-Risk Behaviors
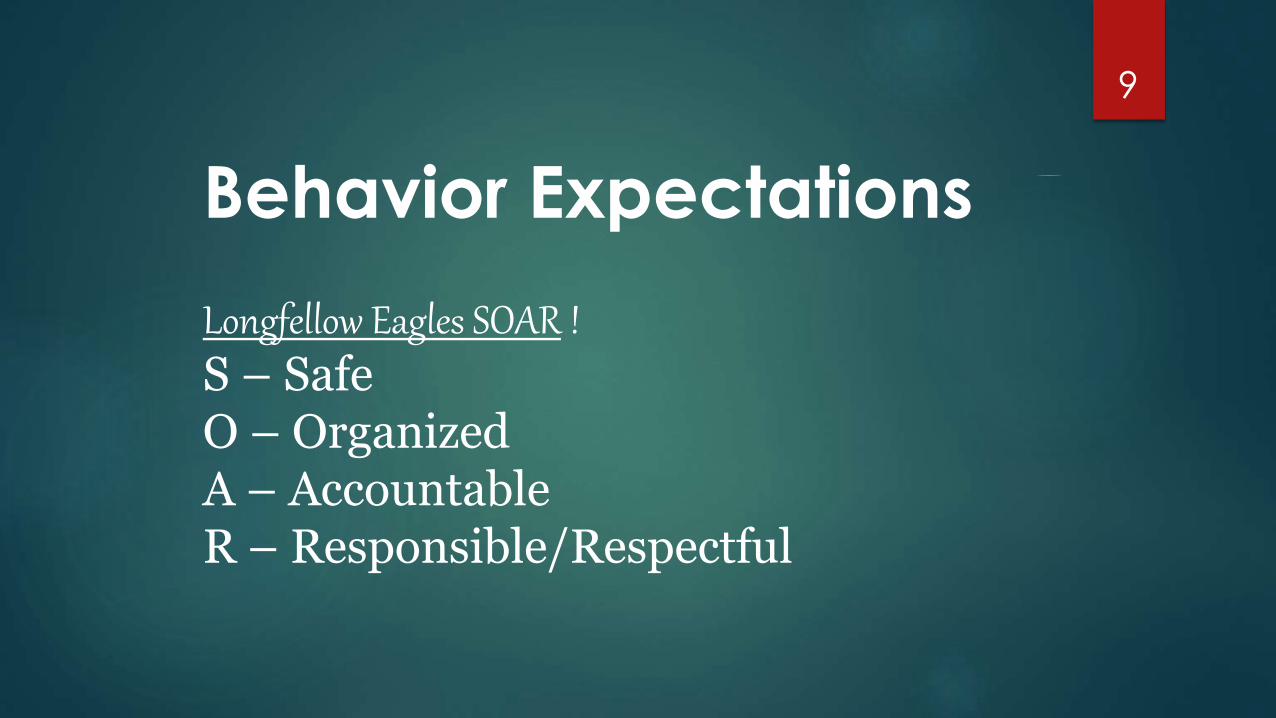
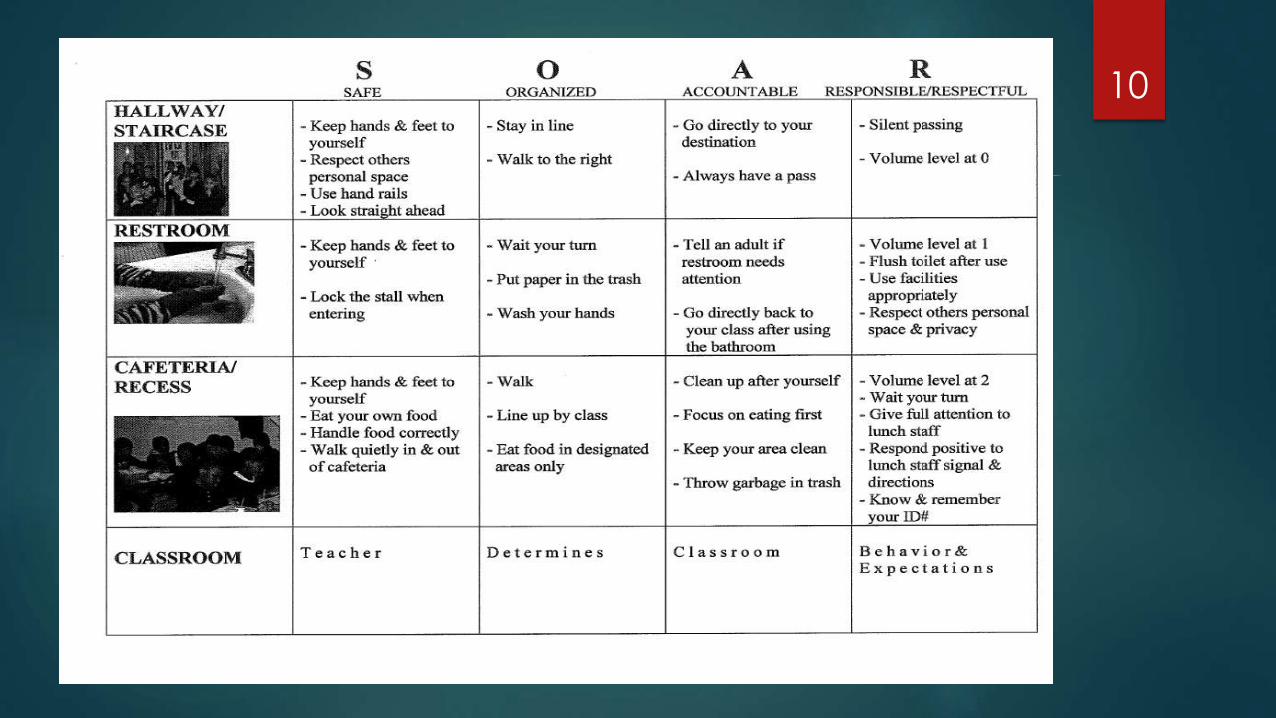
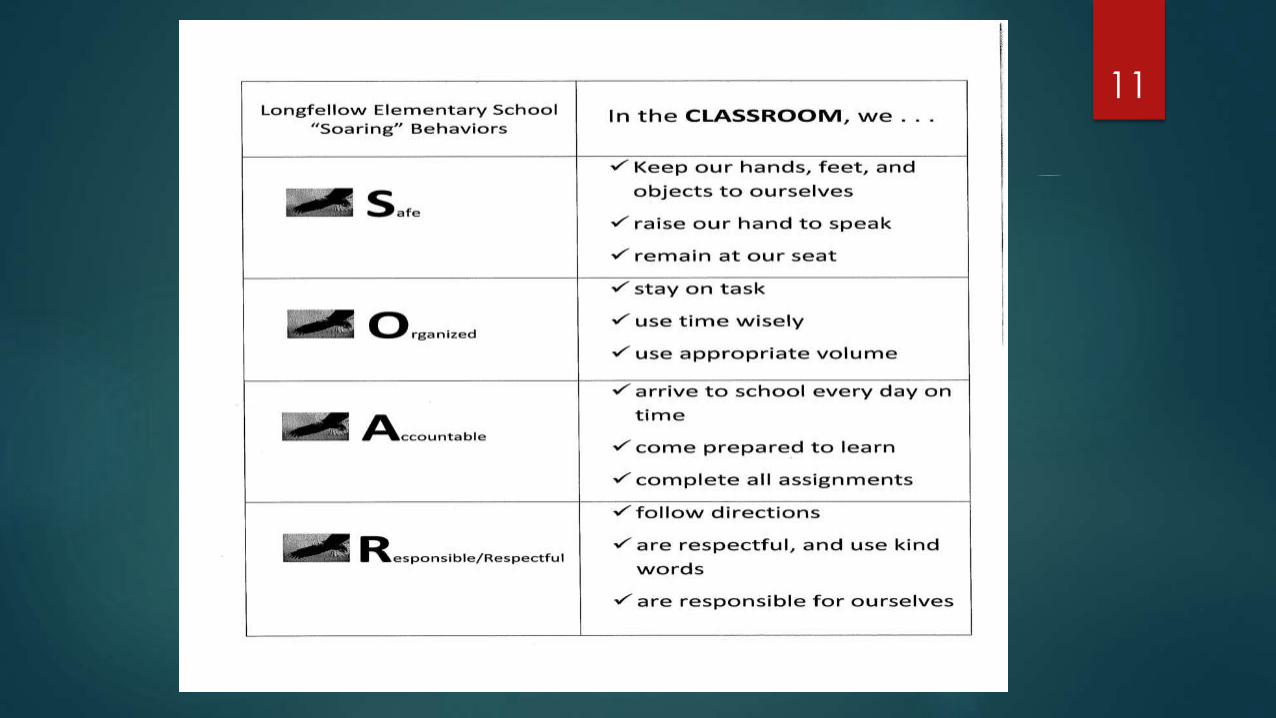
Behavior Expectations
Longfellow Eagles SOAR !S – SafeO – Organized A – Accountable R – Responsible/Respectful
9
10
11
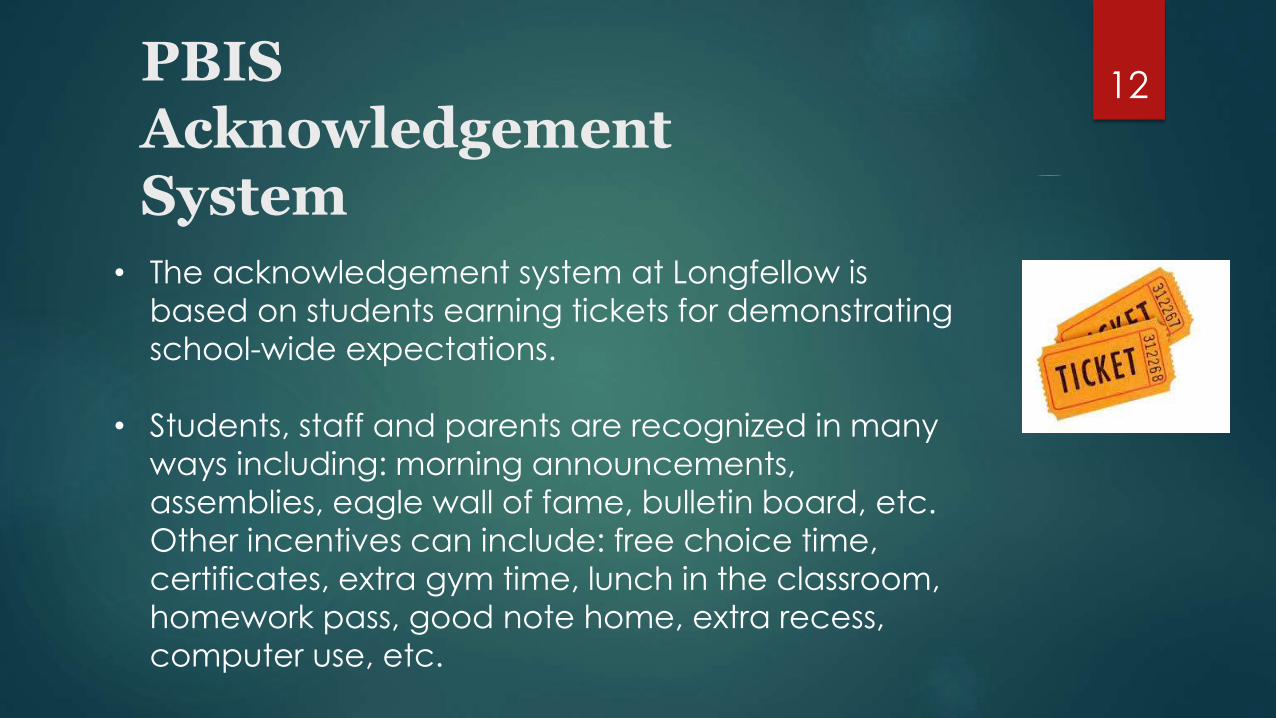
PBISAcknowledgement System
• The acknowledgement system at Longfellow is
based on students earning tickets for demonstrating
school-wide expectations.
• Students, staff and parents are recognized in many
ways including: morning announcements,
assemblies, eagle wall of fame, bulletin board, etc.
Other incentives can include: free choice time,
certificates, extra gym time, lunch in the classroom,
homework pass, good note home, extra recess,
computer use, etc.
12
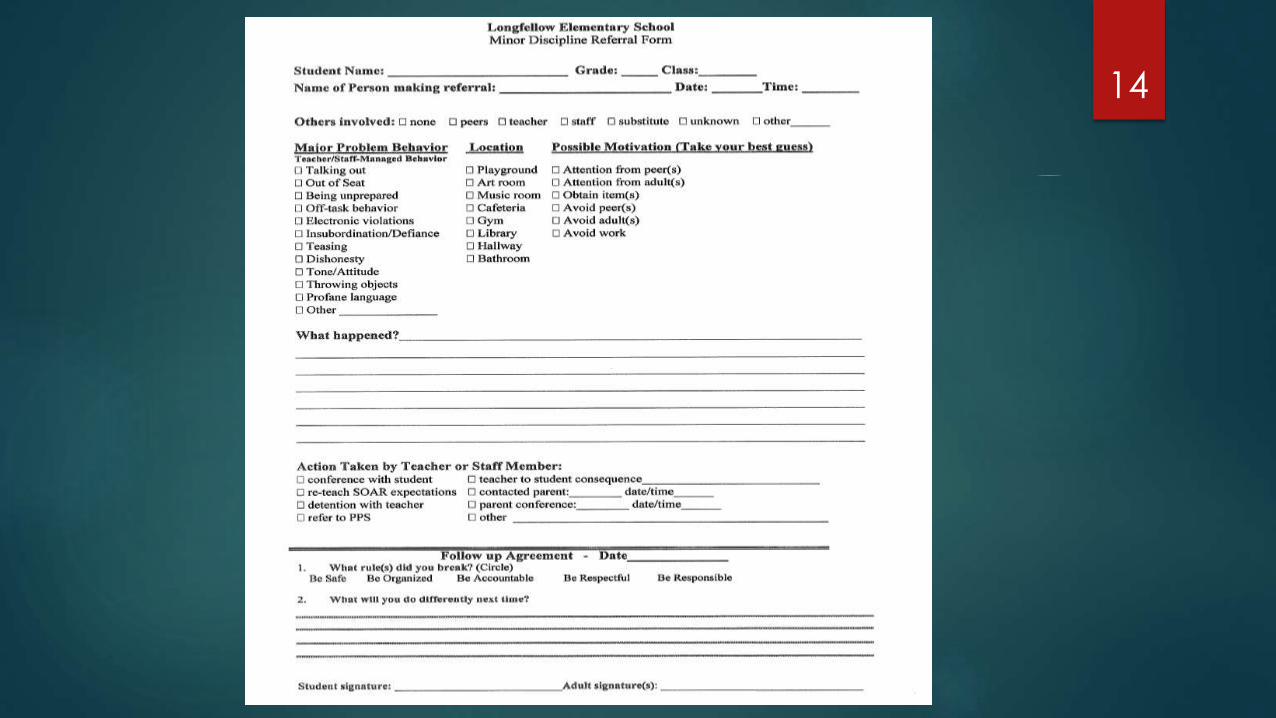
How do we document discipline issues?
13
14
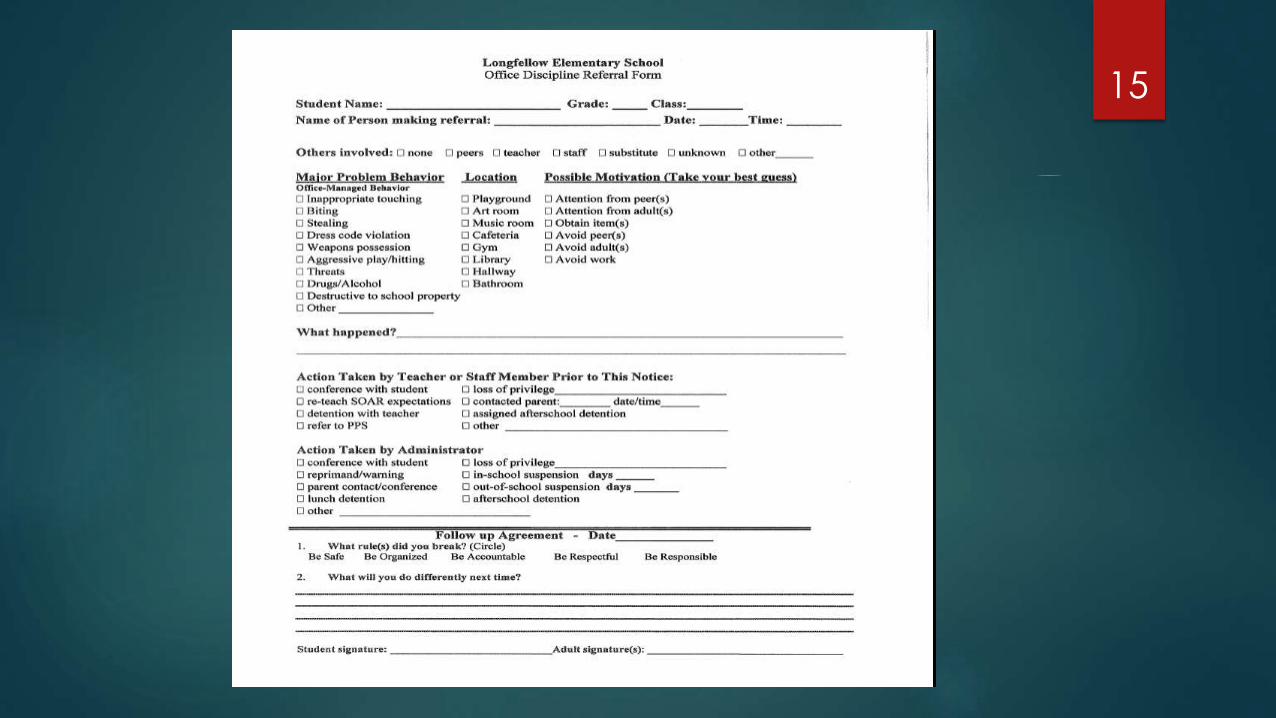
15
What accountability
systems are in place?
16
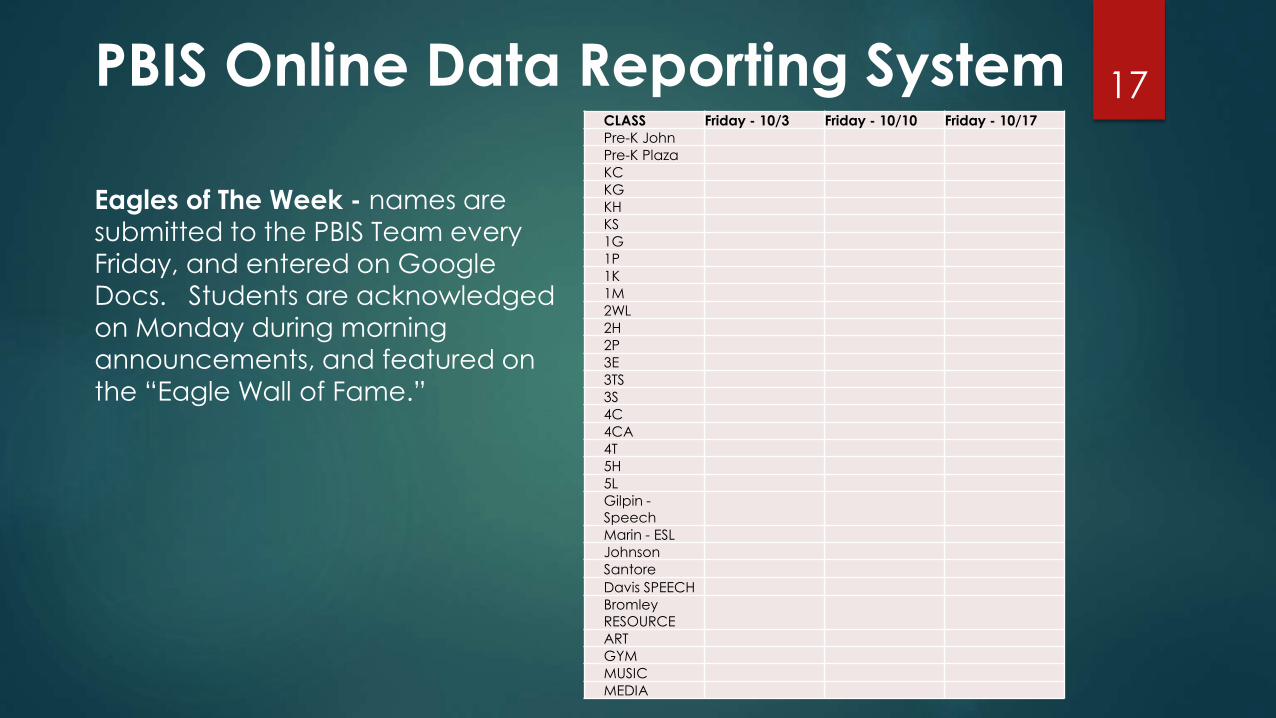
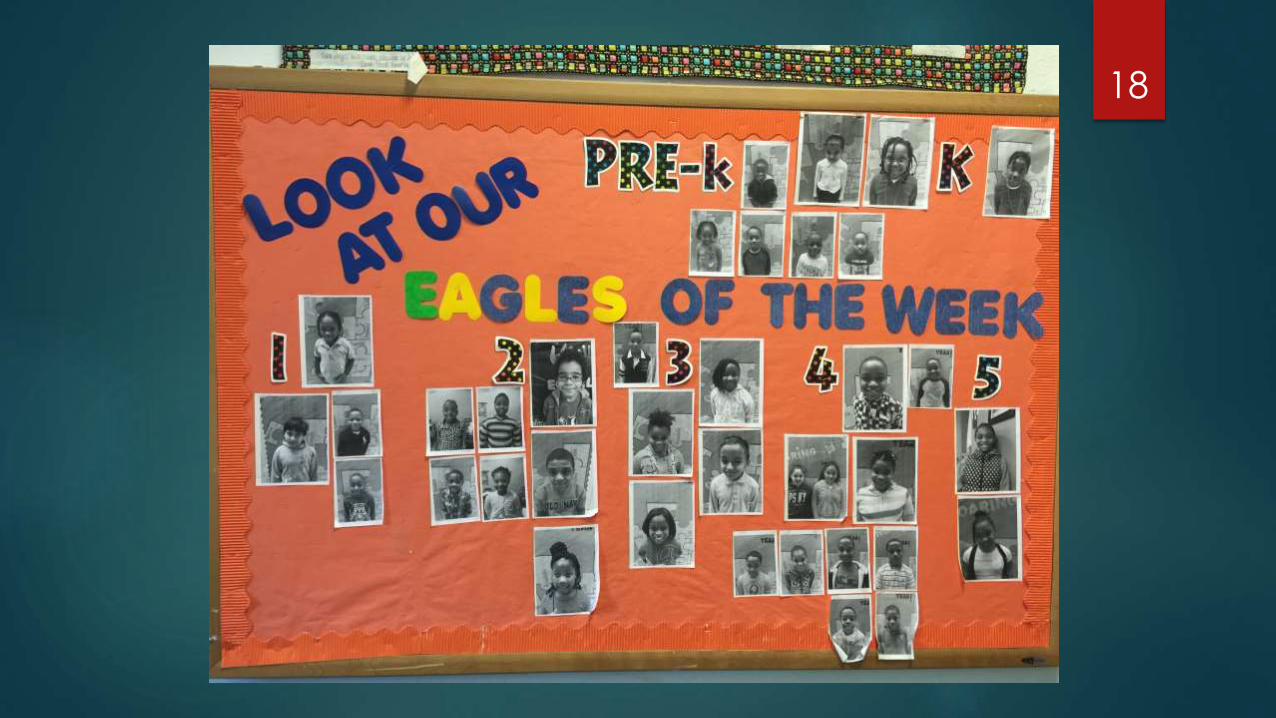
PBIS Online Data Reporting System
Eagles of The Week - names are
submitted to the PBIS Team every
Friday, and entered on Google
Docs. Students are acknowledged
on Monday during morning
announcements, and featured on
the “Eagle Wall of Fame.”
CLASS Friday - 10/3 Friday - 10/10 Friday - 10/17
Pre-K John
Pre-K Plaza
KC
KG
KH
KS
1G
1P
1K
1M
2WL
2H
2P
3E
3TS
3S
4C
4CA
4T
5H
5L
Gilpin -Speech
Marin - ESL
Johnson
Santore
Davis SPEECH
Bromley RESOURCE
ART
GYM
MUSIC
MEDIA
17
18
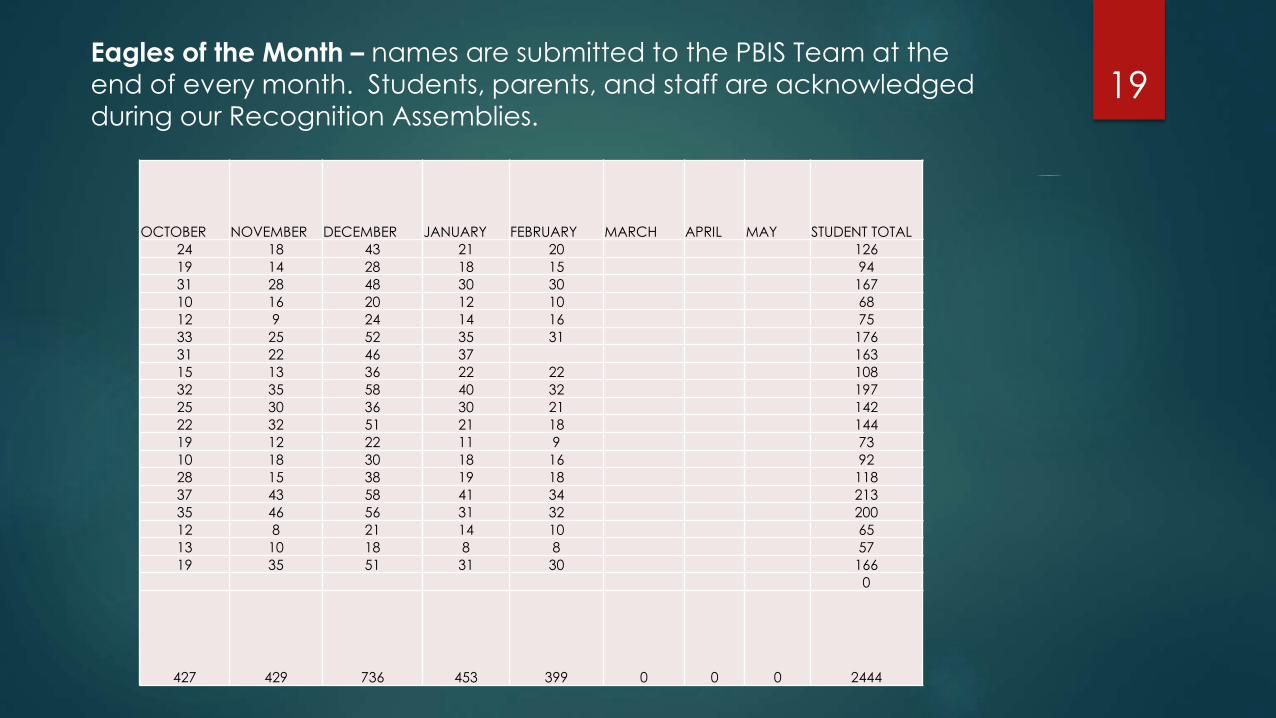
OCTOBER NOVEMBER DECEMBER JANUARY FEBRUARY MARCH APRIL MAY STUDENT TOTAL
24 18 43 21 20 126
19 14 28 18 15 94
31 28 48 30 30 167
10 16 20 12 10 68
12 9 24 14 16 75
33 25 52 35 31 176
31 22 46 37 163
15 13 36 22 22 108
32 35 58 40 32 197
25 30 36 30 21 142
22 32 51 21 18 144
19 12 22 11 9 73
10 18 30 18 16 92
28 15 38 19 18 118
37 43 58 41 34 213
35 46 56 31 32 200
12 8 21 14 10 65
13 10 18 8 8 57
19 35 51 31 30 166
0
427 429 736 453 399 0 0 0 2444
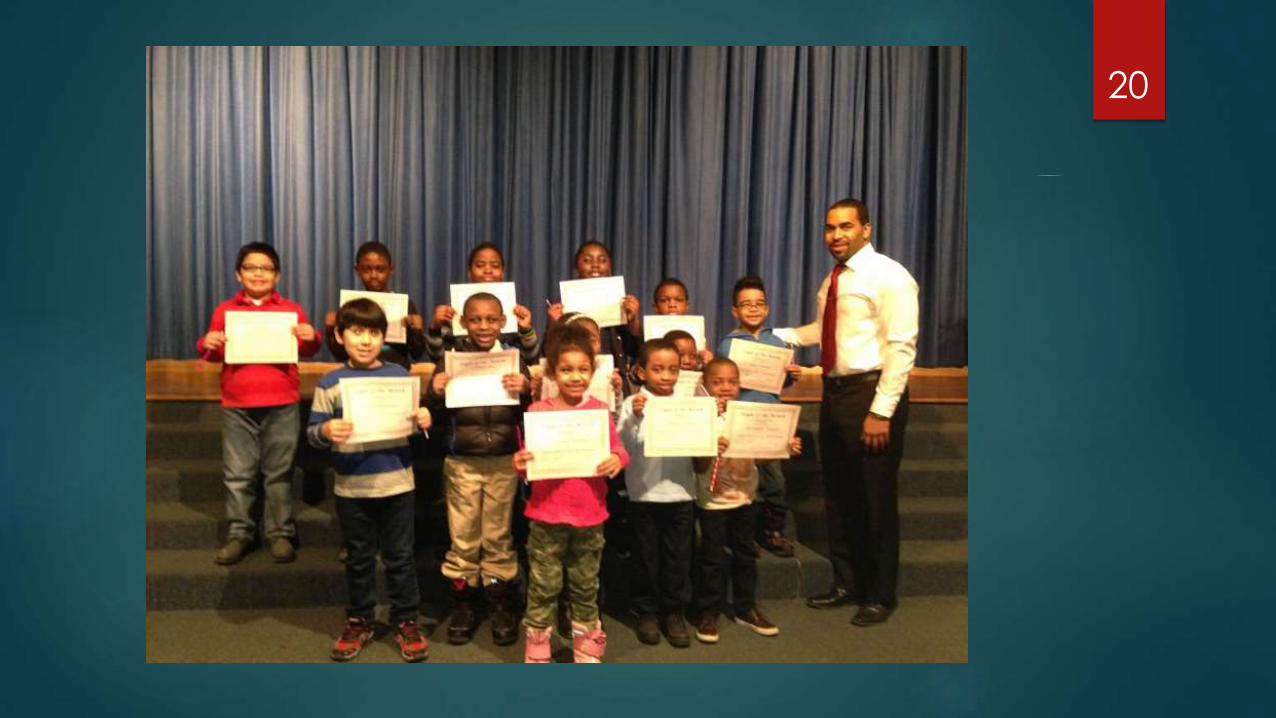
Eagles of the Month – names are submitted to the PBIS Team at the
end of every month. Students, parents, and staff are acknowledged
during our Recognition Assemblies. 19
20
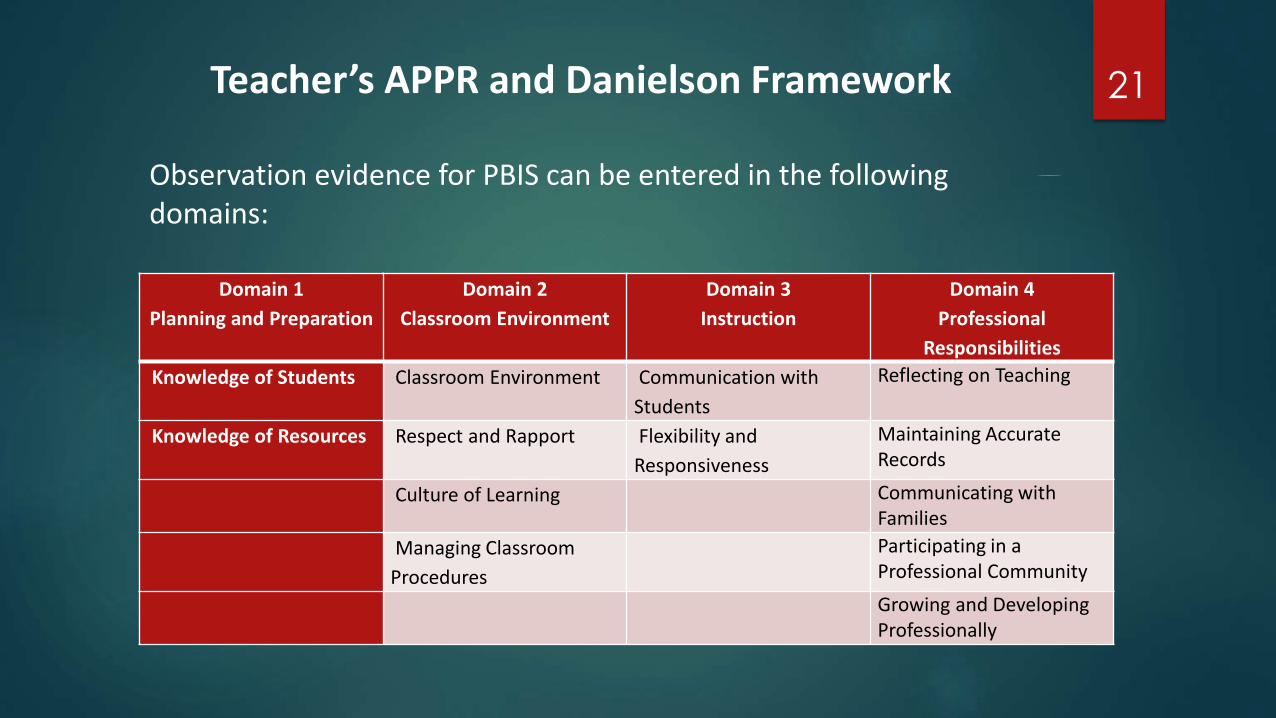
Domain 1
Planning and Preparation
Domain 2
Classroom Environment
Domain 3
Instruction
Domain 4
Professional
Responsibilities
Knowledge of Students Classroom Environment Communication with
Students
Reflecting on Teaching
Knowledge of Resources Respect and Rapport Flexibility and
Responsiveness
Maintaining Accurate Records
Culture of Learning Communicating with Families
Managing Classroom
Procedures
Participating in a Professional Community
Growing and Developing Professionally
Teacher’s APPR and Danielson Framework
Observation evidence for PBIS can be entered in the following domains:
21
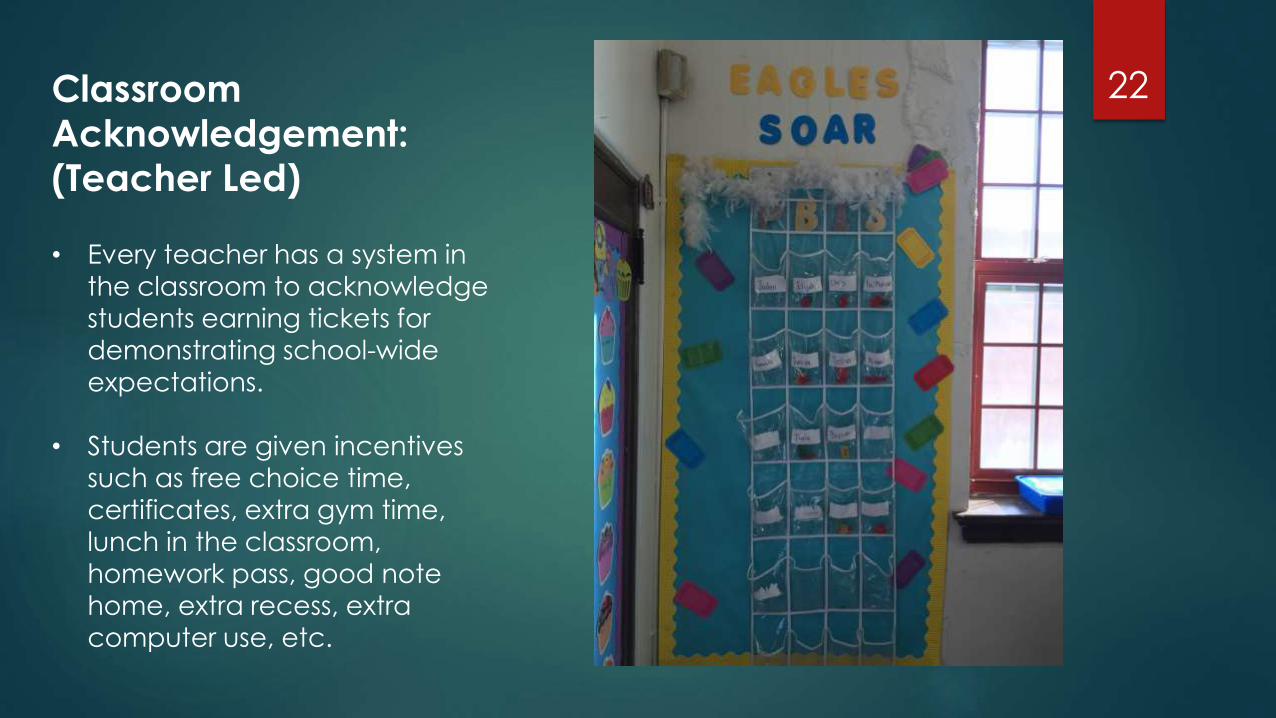
Classroom
Acknowledgement: (Teacher Led)
• Every teacher has a system in
the classroom to acknowledge
students earning tickets for
demonstrating school-wide
expectations.
• Students are given incentives
such as free choice time,
certificates, extra gym time, lunch in the classroom,
homework pass, good note
home, extra recess, extra
computer use, etc.
22

Let’s take a look
at what the
discipline referral data shows!!!
23
0
20
40
60
80
100
120
140
2011-2012 2012-2013 2013-2014 2014-2015
Longfellow Elementary Yearly Discipline Referrals24
25
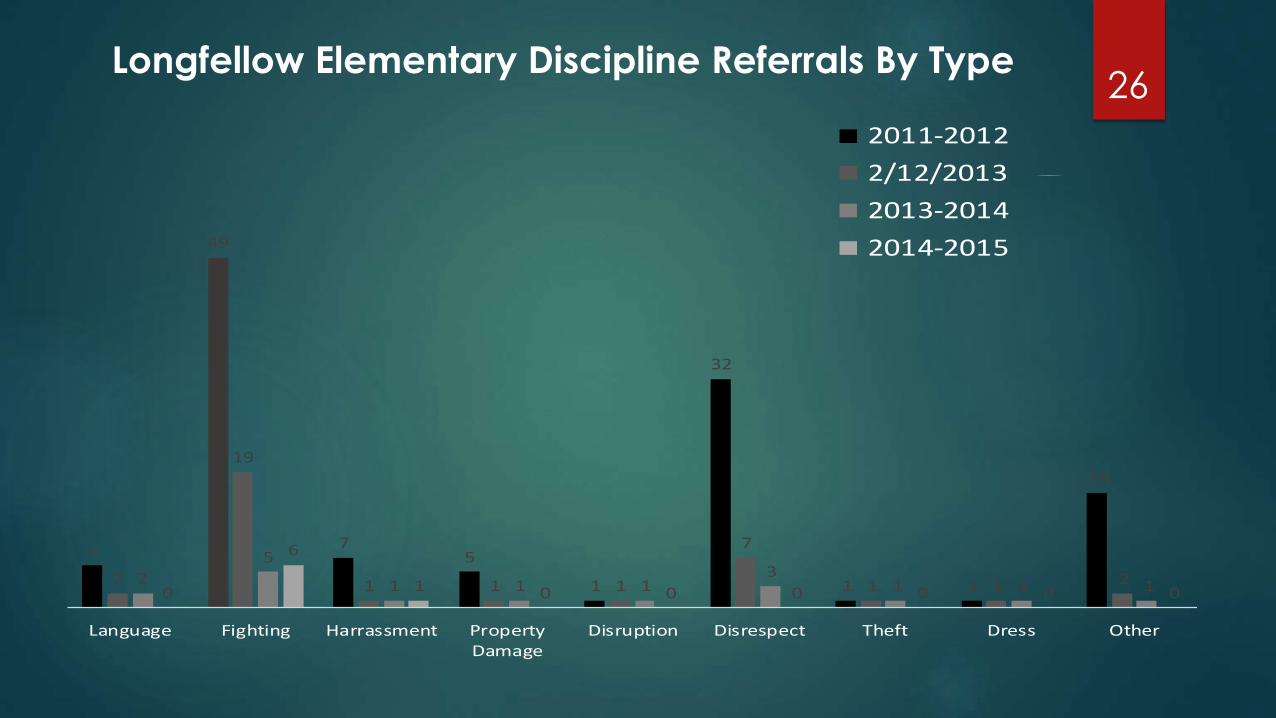
Longfellow Elementary Discipline Referrals By Type
6
49
75
1
32
1 1
16
2
19
1 1 1
7
1 1 22
5
1 1 13
1 1 10
6
1 0 0 0 0 0 0
Language Fighting Harrassment PropertyDamage
Disruption Disrespect Theft Dress Other
2011-2012
2/12/2013
2013-2014
2014-2015
26
So what has this
done to our
suspensions?
27
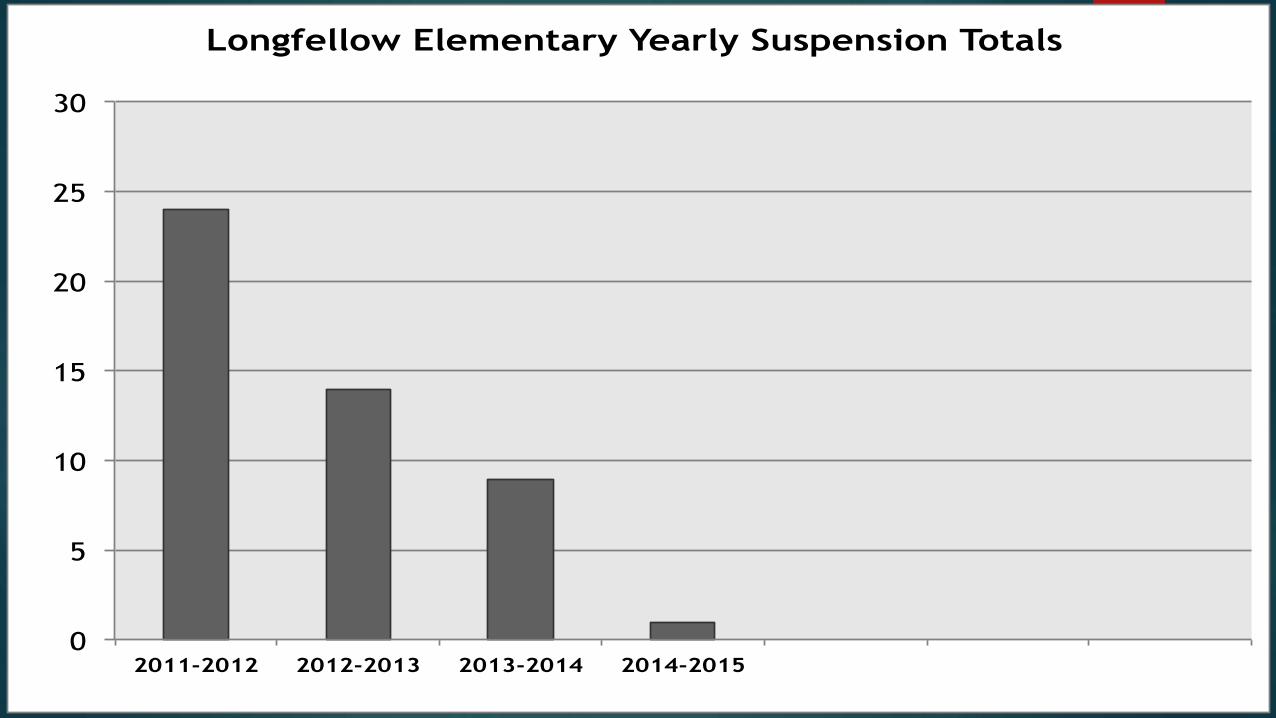
0
5
10
15
20
25
30
2011-2012 2012-2013 2013-2014 2014-2015
Longfellow Elementary Yearly Suspension Totals
28
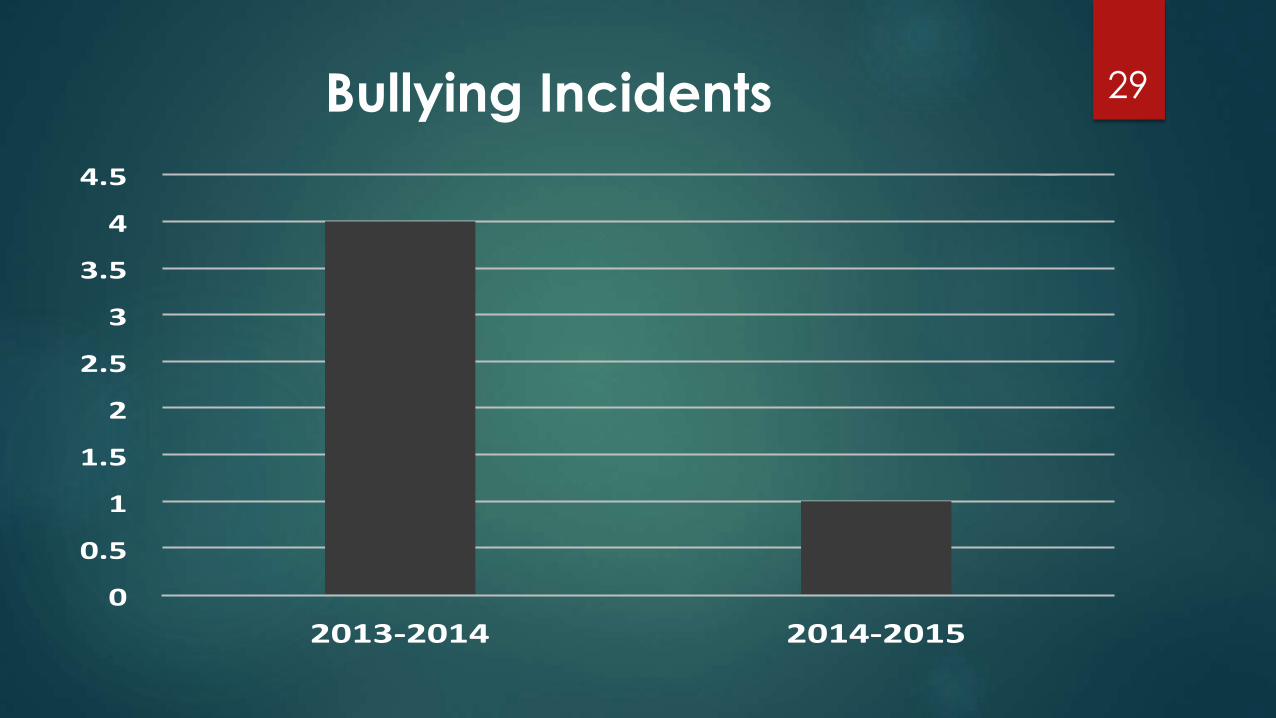
0
0.5
1
1.5
2
2.5
3
3.5
4
4.5
2013-2014 2014-2015
Bullying Incidents 29
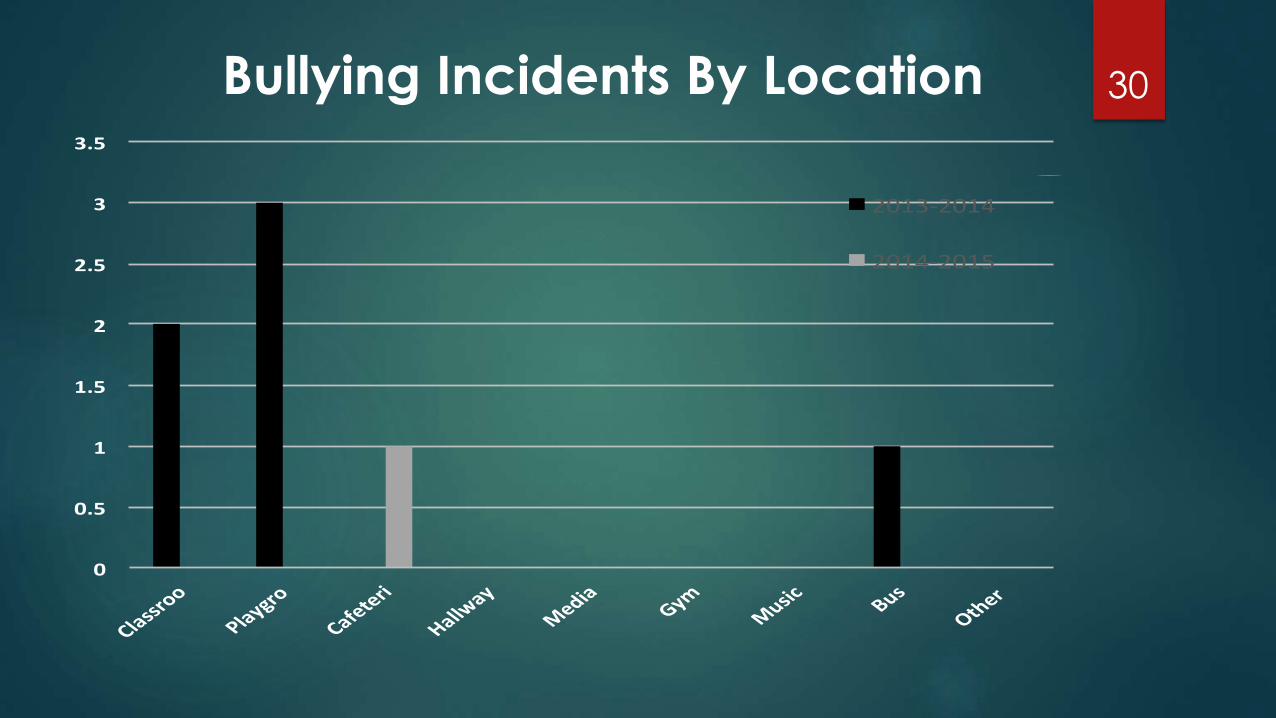
0
0.5
1
1.5
2
2.5
3
3.5
Classroo
Playgro
Cafeteri
Hallway
Media
Gym
Music Bu
s
Other
2013-2014
2014-2015
Bullying Incidents By Location 30
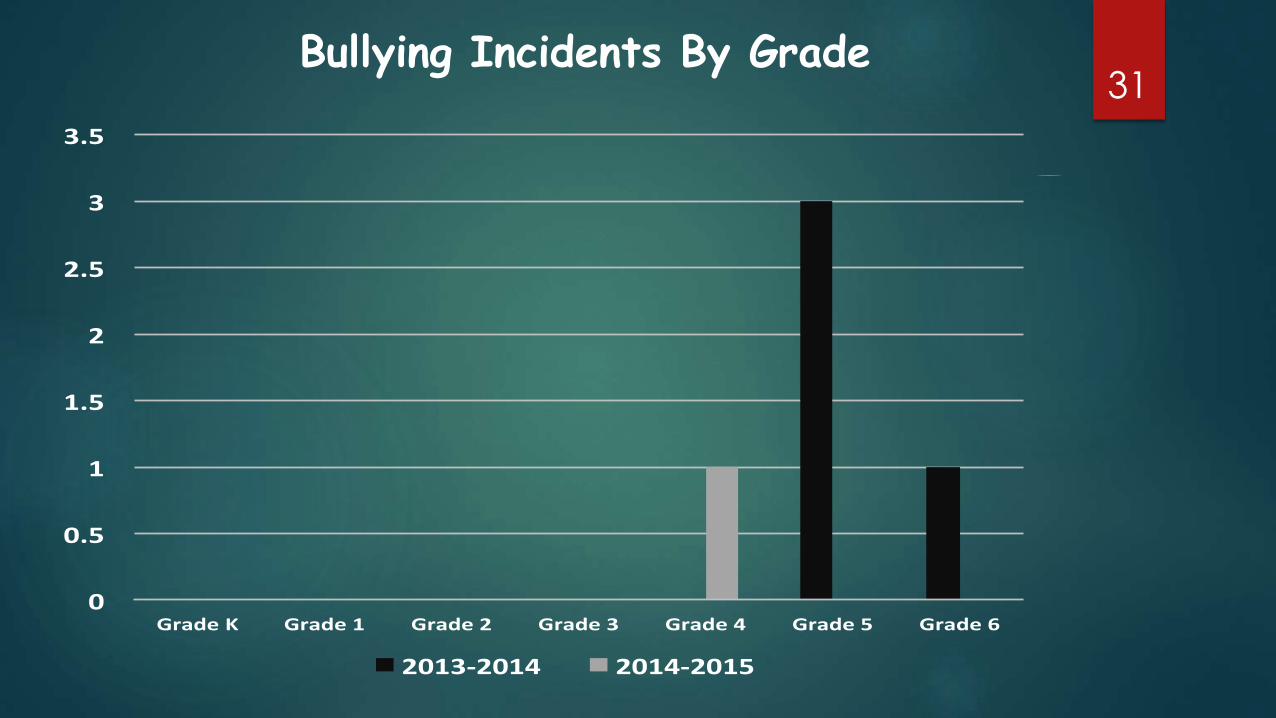
0
0.5
1
1.5
2
2.5
3
3.5
GradeK Grade1 Grade2 Grade3 Grade4 Grade5 Grade6
2013-2014 2014-2015
Bullying Incidents By Grade 31
What has this done to
our student
achievement data?
32
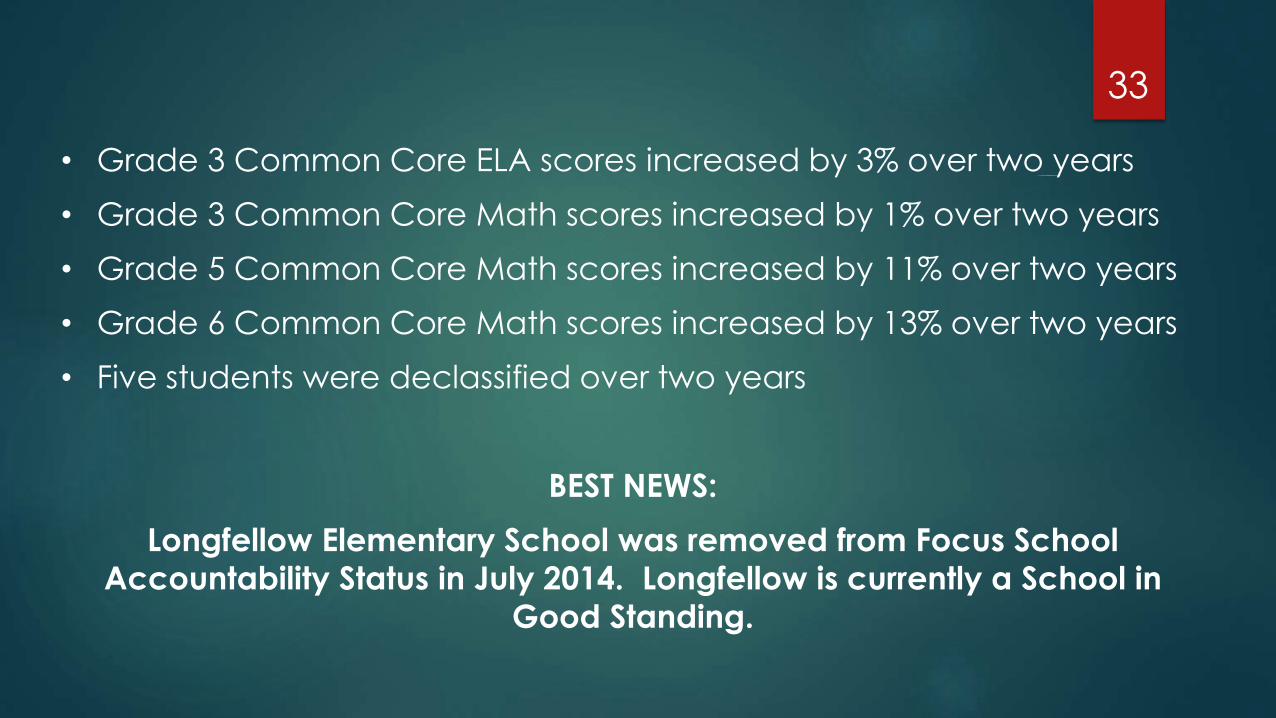
• Grade 3 Common Core ELA scores increased by 3% over two years
• Grade 3 Common Core Math scores increased by 1% over two years
• Grade 5 Common Core Math scores increased by 11% over two years
• Grade 6 Common Core Math scores increased by 13% over two years
• Five students were declassified over two years
BEST NEWS:
Longfellow Elementary School was removed from Focus School
Accountability Status in July 2014. Longfellow is currently a School in
Good Standing.
33
What are parents,
students, and staff
saying about PBIS?
34
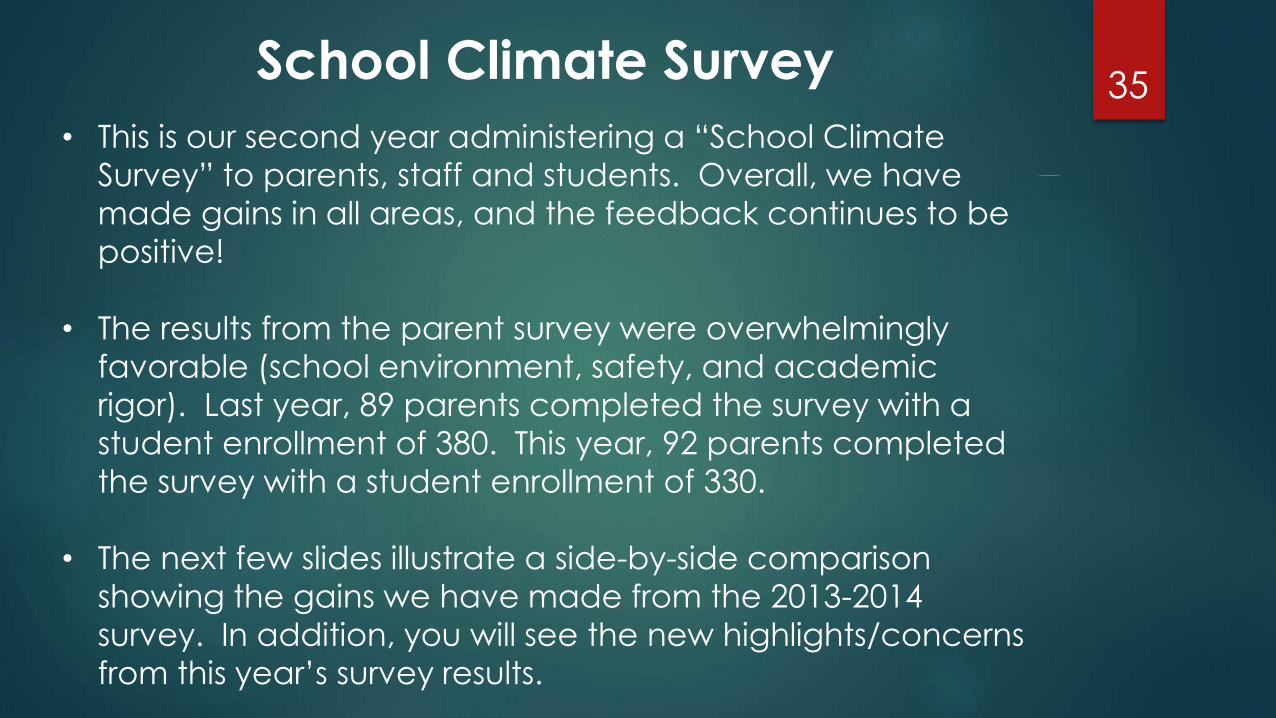
• This is our second year administering a “School Climate
Survey” to parents, staff and students. Overall, we have
made gains in all areas, and the feedback continues to be
positive!
• The results from the parent survey were overwhelmingly
favorable (school environment, safety, and academic
rigor). Last year, 89 parents completed the survey with a
student enrollment of 380. This year, 92 parents completed
the survey with a student enrollment of 330.
• The next few slides illustrate a side-by-side comparison
showing the gains we have made from the 2013-2014
survey. In addition, you will see the new highlights/concerns
from this year’s survey results.
School Climate Survey 35
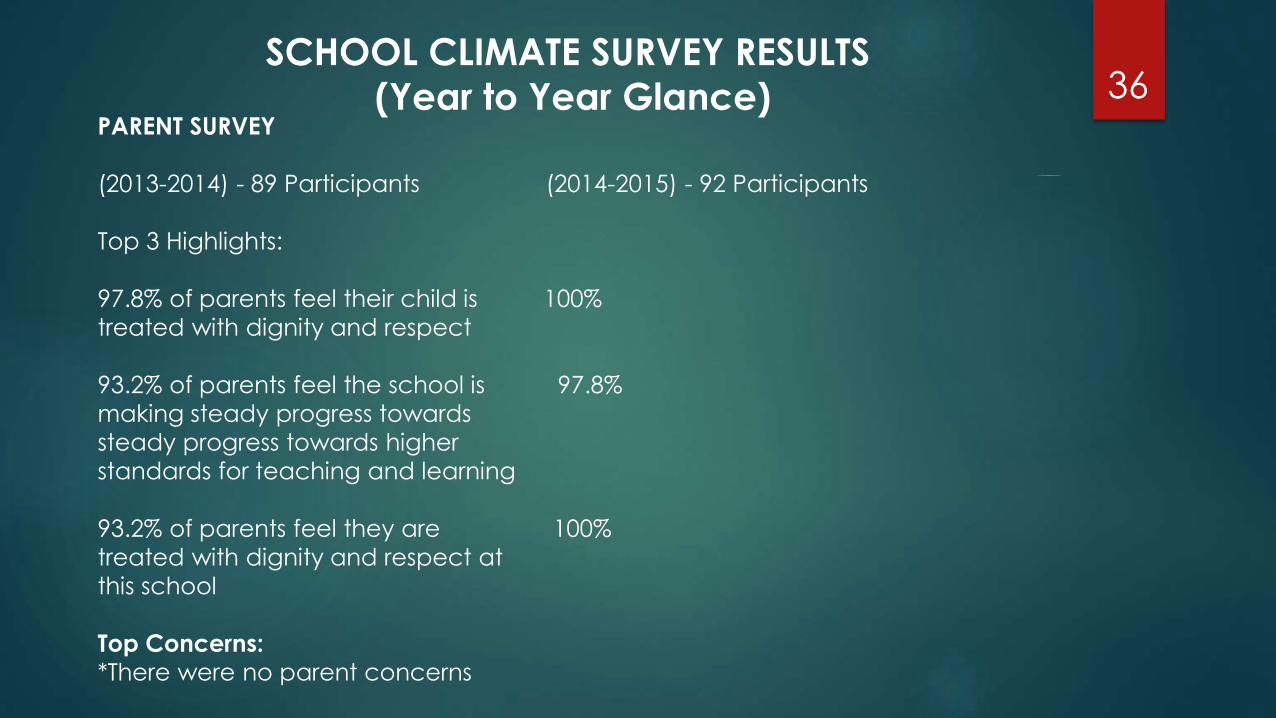
SCHOOL CLIMATE SURVEY RESULTS
(Year to Year Glance)PARENT SURVEY
(2013-2014) - 89 Participants (2014-2015) - 92 Participants
Top 3 Highlights:
97.8% of parents feel their child is 100%
treated with dignity and respect
93.2% of parents feel the school is 97.8%
making steady progress towards
steady progress towards higher
standards for teaching and learning
93.2% of parents feel they are 100%
treated with dignity and respect at
this school
Top Concerns:
*There were no parent concerns
36
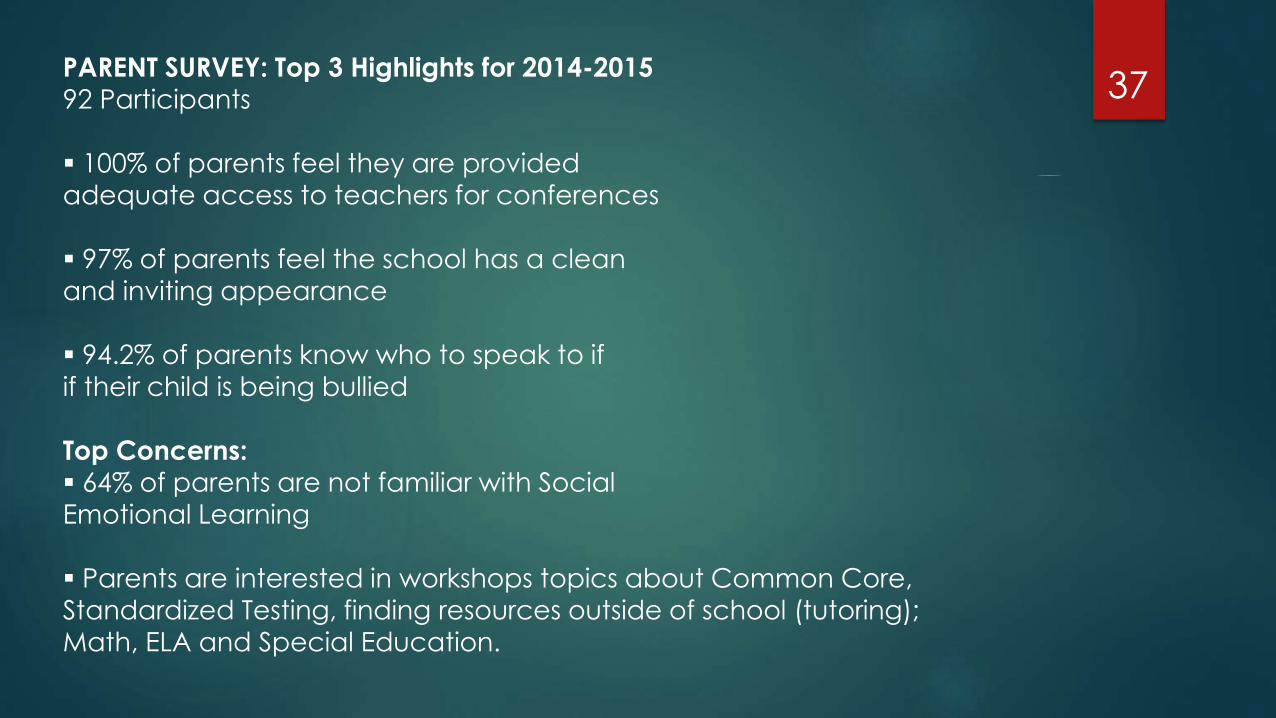
PARENT SURVEY: Top 3 Highlights for 2014-2015
92 Participants
100% of parents feel they are provided
adequate access to teachers for conferences
97% of parents feel the school has a clean
and inviting appearance
94.2% of parents know who to speak to if
if their child is being bullied
Top Concerns:
64% of parents are not familiar with Social
Emotional Learning
Parents are interested in workshops topics about Common Core,
Standardized Testing, finding resources outside of school (tutoring);
Math, ELA and Special Education.
37
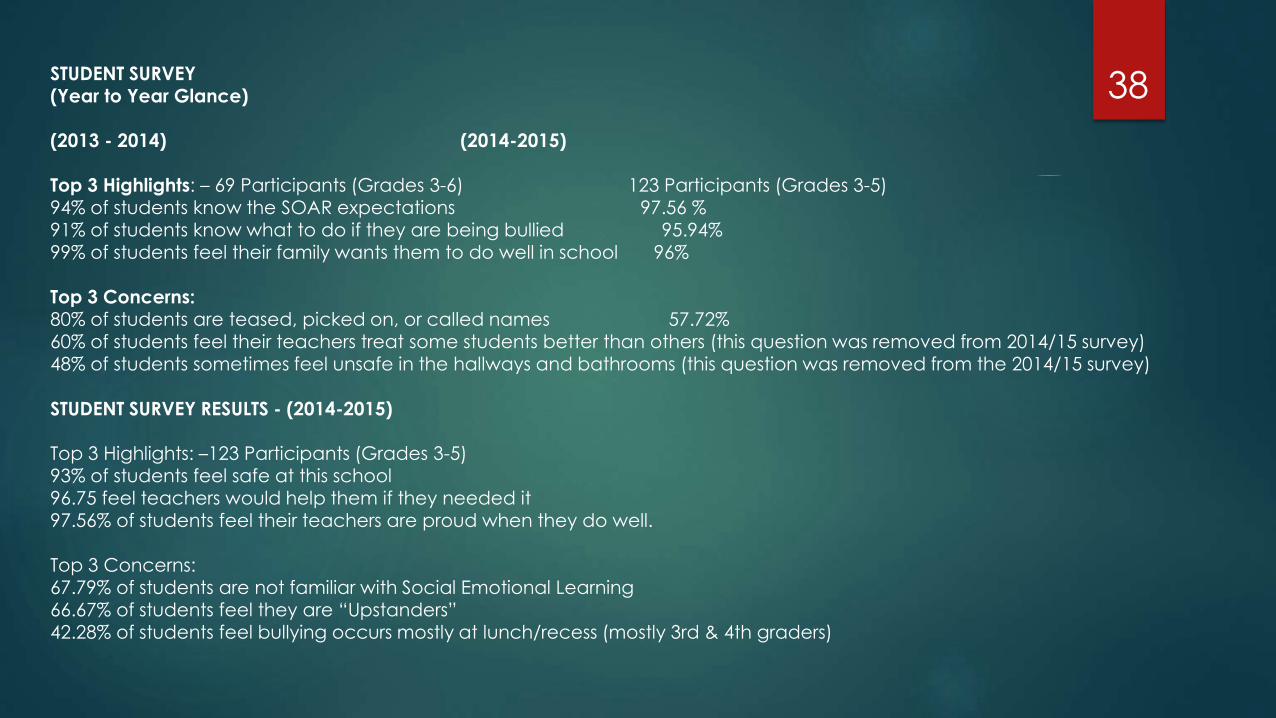
STUDENT SURVEY(Year to Year Glance)
(2013 - 2014) (2014-2015)
Top 3 Highlights: – 69 Participants (Grades 3-6) 123 Participants (Grades 3-5)
94% of students know the SOAR expectations 97.56 % 91% of students know what to do if they are being bullied 95.94% 99% of students feel their family wants them to do well in school 96%
Top 3 Concerns:80% of students are teased, picked on, or called names 57.72% 60% of students feel their teachers treat some students better than others (this question was removed from 2014/15 survey)48% of students sometimes feel unsafe in the hallways and bathrooms (this question was removed from the 2014/15 survey)
STUDENT SURVEY RESULTS - (2014-2015)
Top 3 Highlights: –123 Participants (Grades 3-5)93% of students feel safe at this school 96.75 feel teachers would help them if they needed it97.56% of students feel their teachers are proud when they do well.
Top 3 Concerns:67.79% of students are not familiar with Social Emotional Learning66.67% of students feel they are “Upstanders”42.28% of students feel bullying occurs mostly at lunch/recess (mostly 3rd & 4th graders)
38
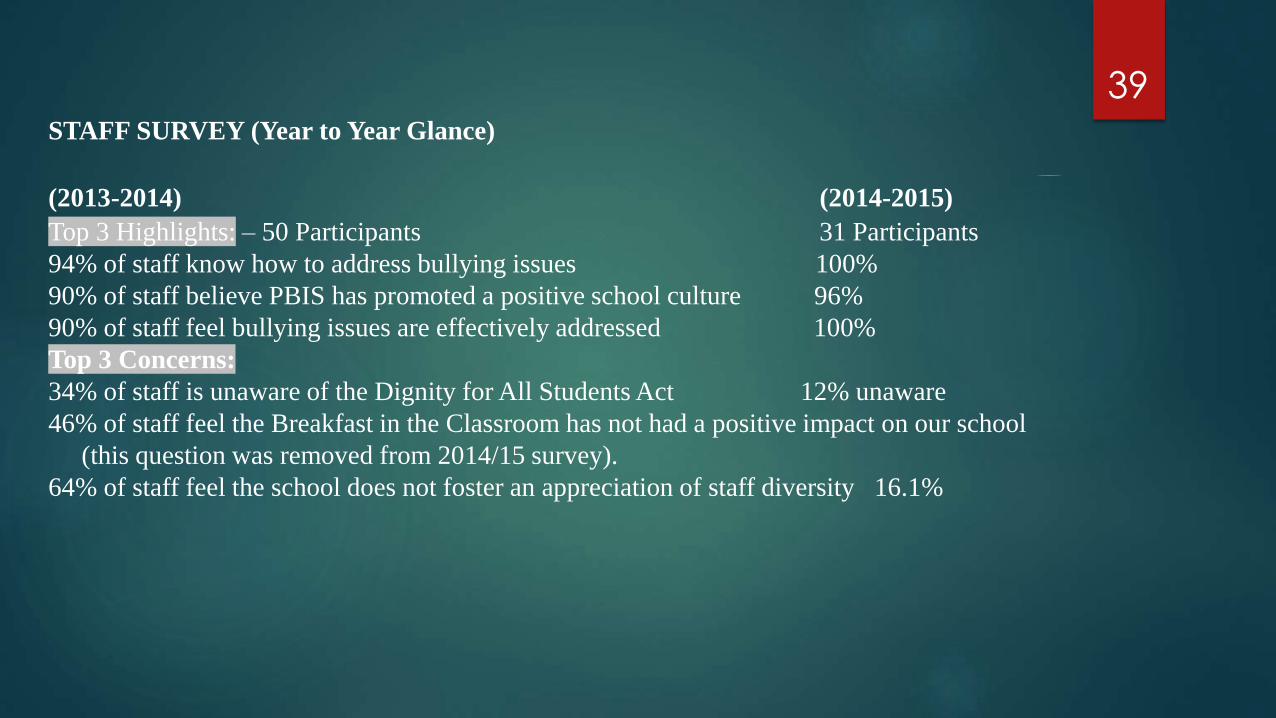
STAFF SURVEY (Year to Year Glance)
(2013-2014) (2014-2015)
Top 3 Highlights: – 50 Participants 31 Participants
94% of staff know how to address bullying issues 100%
90% of staff believe PBIS has promoted a positive school culture 96%
90% of staff feel bullying issues are effectively addressed 100%
Top 3 Concerns:
34% of staff is unaware of the Dignity for All Students Act 12% unaware
46% of staff feel the Breakfast in the Classroom has not had a positive impact on our school
(this question was removed from 2014/15 survey).
64% of staff feel the school does not foster an appreciation of staff diversity 16.1%
39
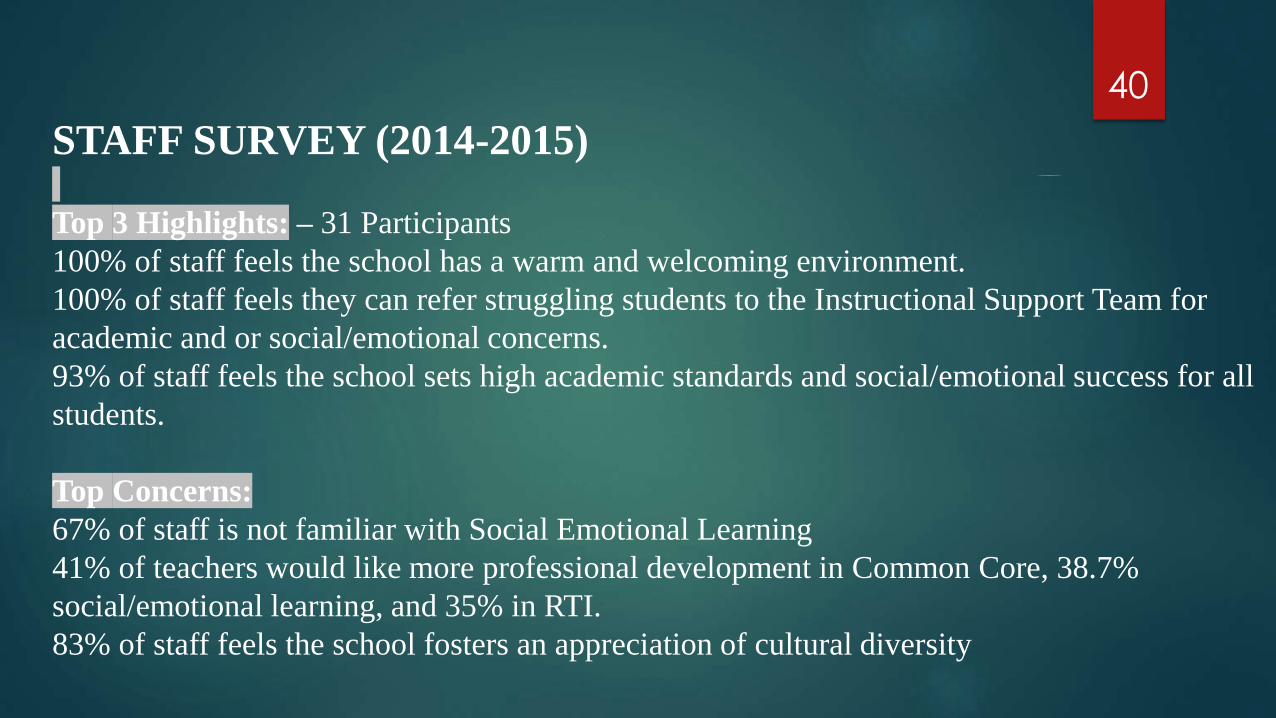
STAFF SURVEY (2014-2015)
Top 3 Highlights: – 31 Participants
100% of staff feels the school has a warm and welcoming environment.
100% of staff feels they can refer struggling students to the Instructional Support Team for
academic and or social/emotional concerns.
93% of staff feels the school sets high academic standards and social/emotional success for all
students.
Top Concerns:
67% of staff is not familiar with Social Emotional Learning
41% of teachers would like more professional development in Common Core, 38.7%
social/emotional learning, and 35% in RTI.
83% of staff feels the school fosters an appreciation of cultural diversity
40
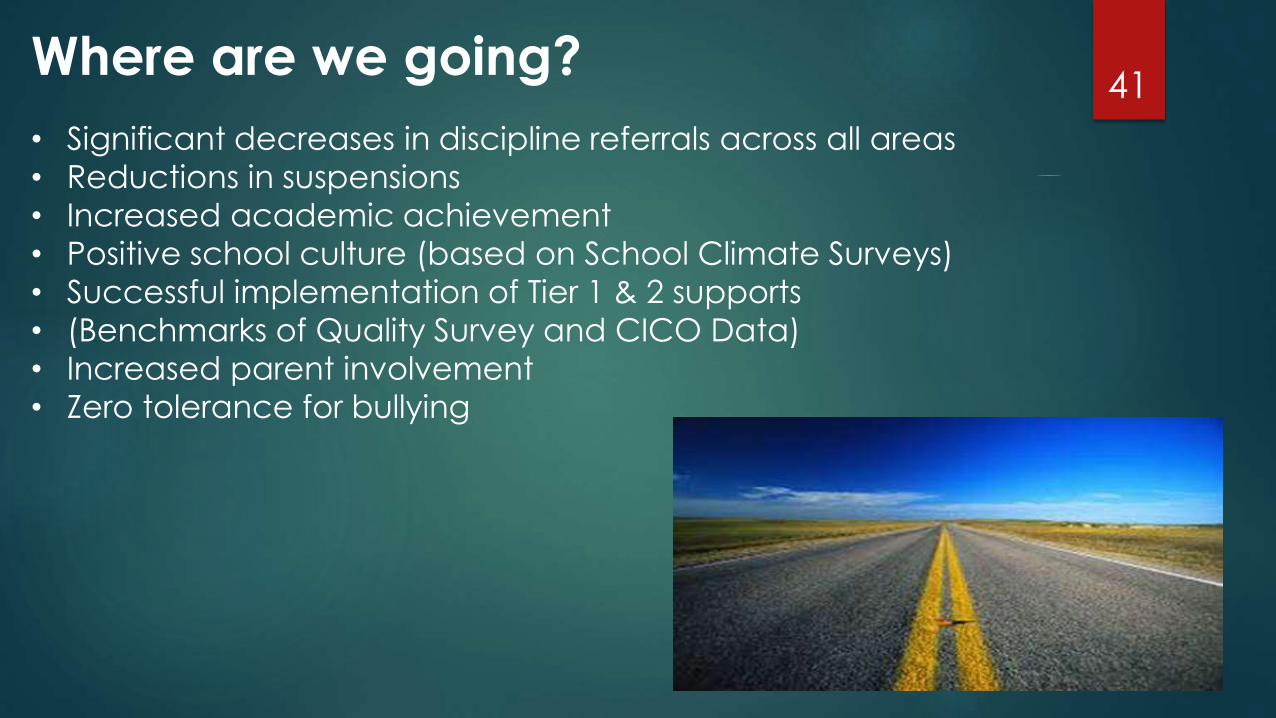
Where are we going?
• Significant decreases in discipline referrals across all areas
• Reductions in suspensions
• Increased academic achievement
• Positive school culture (based on School Climate Surveys)
• Successful implementation of Tier 1 & 2 supports
• (Benchmarks of Quality Survey and CICO Data)
• Increased parent involvement
• Zero tolerance for bullying
41
Important Take-Aways
• Set up a school-wide behavior plan that focuses on
the positive behaviors
• Create an acknowledgment system for
students……parents and staff too!
• Create a PBIS Team and build time into schedule to
meet; empower teacher leaders
• Look at your data and respond accordingly; present
data to your school community frequently
• Show the connection to academic outcomes
• Stay consistent!
42

Questions/Comments
43