Embed Size (px)
Citation preview
1
Relationships Between Visual Static Models and Students’ Written Solutions
to Fraction Tasks
Katie L. Anderson-Pence1, University of Colorado Colorado Springs
Patricia S. Moyer-Packenham2, Utah State University
Arla Westenskow3, Utah State University
Jessica Shumway4, Utah State University
Kerry Jordan5, Utah State University
The purpose of this study was to deconstruct the relationship between visual static
models and students’ written solutions to fraction problems using a large sample
of students’ solutions. Participants in the study included 162 third-grade and 209
fourth-grade students from 17 different classrooms. Students’ written responses to
open-ended tasks were examined to determine common solutions and errors when
using visual static models. The results indicate that (a) common students errors
relate to how students interpret the given model or their own model of the
situation, and (b) students’ flexibility with visual static models is related to
successful written solutions. Students with errors generally demonstrated a lack of
flexibility in interpreting their own and the given visual static models.
Researchers hypothesize that students’ exposure to varied mathematical
representations influences their ability to flexibly use static visual representations.
They recommend that students have a solid understanding of real-world
mathematics situations in order to successfully create and interpret visual static
models of mathematics.
Key words: fractions, mathematics education, real-world mathematics, visual
perception, visual static models, visualization
Introduction
An understanding of fractions provides a foundation for success in future learning of
mathematics topics, such as ratios, proportions, percentages, decimals, and algebra (National
1 K. L. Anderson-Pence, Assistant Professor in the Department of Curriculum and Instruction at
the University of Colorado Colorado Springs. 2 P. S. Moyer-Packenham, Professor and the Director of Mathematics Education and Leadership
in the School of Teacher Education and Leadership at Utah State University. Email:
[email protected] 3 A. Westenskow, Director of the Tutoring Intervention and Mathematics Enrichment Clinic in
the School of Teacher Education and Leadership at Utah State University. Email:
[email protected] 4 J. Shumway, Doctoral Candidate in the School of Teacher Education and Leadership at Utah
State University. Email: [email protected] 5 K. Jordan, Associate Professor in the Department of Psychology at Utah State University.
Email: [email protected]
Relationships Between Visual Static Models and Students’ Written Solutions to Fraction Tasks
2
Mathematics Advisory Panel, 2008; Council of Chief State School Officers [CCSSO] and
National Governors Association [NGA], 2010). Because of the importance of fraction
understanding, documents such as Principles and Standards for School Mathematics (National
Council of Teachers of Mathematics [NCTM], 2000), Foundations for Success (National
Mathematics Advisory Panel, 2008), and the Common Core State Standards for Mathematics
(CCSSO and NGA, 2010) recommend intense focus on fractions from fourth through eighth
grades. However, many students struggle with basic fraction and rational number concepts in
these grade levels (Lamon, 2007; Wu, 2005). A lack of visualization skills offers one explanation
for students’ difficulties with fractions. The visualization of mathematical concepts plays a
pivotal role in how well students apply their fraction understanding to novel situations (Arcavi,
2003).
The Common Core State Standards for Mathematics (CCSSO and NGA, 2010)
recommend that students “model with mathematics” and “use appropriate tools strategically” (p.
7). When students develop facility with models and tools for thinking, they are able to analyze
situations, draw conclusions, and make connections to other domains of mathematics.
Additionally, standards established by NCTM emphasize the importance of representing
mathematical concepts while problem solving (2000). Sedig and Laing (2006) describe these
visual mathematical representations as “graphical representations that encode causal, functional,
structural, logical, and semantic properties and relationships of mathematical structures, objects,
concepts, problems, patterns, and ideas” (2006, p. 180). Visual static models, as examined in this
study, are a specific type of visual mathematical representation that include fixed pictorial
images of mathematical concepts. While visual static models provide one method of representing
and problem solving with mathematics, those representations that commonly appear on
worksheets or tests, may have elements that are unfamiliar to the student or that do not match the
student’s own mental representation. An unfamiliar visual model may impact how a student
interprets a problem. The purpose of this study was to deconstruct the relationship between
visual static models and students’ written solutions to fraction problems using a large sample of
students’ solutions. By using this large sample of students’ solution models, we hoped to identify
patterns and to generate hypotheses about how students employed the models leading to
successful or unsuccessful problem solving outcomes. This type of reverse engineered
hypothesis, using a large data set of patterns and relationships to generate theory, has the
potential to bridge learning (i.e., how students develop and use models) with teaching practices
(i.e., how teachers support students’ development of fraction models) (Carpenter, Fennema, &
Franke, 1996; Hill, Rowan, & Ball, 2005). In this type of hypothesis generation, our inquiry will
“not only enable us to systematically specify what we see, but when they take the form of
hypotheses or propositions, they suggest how phenomena might possibly be related to each other”
(Strauss & Corbin, 1998, p. 102). The following section gives a brief review of the current
literature related to the visualization of mathematical representations.
Review of Literature
Visual Representations in Mathematics
NCTM states, “The ways in which mathematical ideas are represented are fundamental to
how people can understand and use those ideas” (2000, p. 67). Therefore, as learners develop

Anderson-Pence, Moyer-Packenham, Westenskow, Shumway, & Jordan
3
clear and sophisticated visualizations of mathematical concepts, they will have a deep
understanding of those concepts, and develop what Tall and Vinner (1981) refer to as a concept
image. In this study, we define a visual static model, as a still picture that is either printed or
drawn on a page to represent mathematical concepts. In this study, we adopt Arcavi’s (2003)
definition of mathematical visualization: the ability to create, use, interpret, and reflect on
images in the mind or on paper. Therefore, students use and create visual static models as they
develop mathematical visualization skills. These visualizations support meaningful connections
with different types of representations and abstract mathematical concepts. Lesh, Post, and Behr
(1987) identify five types of mathematical representations: static pictures, manipulative models,
written symbols, real-life situations, and spoken language. Understanding a mathematical
concept involves a) recognizing the concept among different types of representation, b) flexibly
manipulating the concept within a type of representation, and c) translating the concept from one
type of representation to another. Static pictures are of particular interest to this study because
static models are what students often develop when problem solving, and are often what students
see on tests, worksheets, and in textbooks during typical mathematics instruction (Yeh &
McTigue, 2009).
Visual representations alleviate cognitive load during problem solving (Clark, Nguyen, &
Sweller, 2006) and allow learners to mentally work on one part of the model without having to
keep track of the entire model in their minds (Woleck, 2001). For example, many students
automatically picture a square divided equally into three parts, two of which are shaded, when
they hear or see the symbol, 2/3. This visual model enables learners to maintain the part-whole
meaning of the fraction. Findings by van Garderen (2006) also indicate that visualization skills
correlate significantly with students’ ability to understand mathematics. High-achieving students
often display the highest level of spatial visualization. Likewise, low-achieving students benefit
from working with given visual static models (Moyer-Packenham, Ulmer, & Anderson, 2012).
Visual models provide a scaffold for students as they develop their own visualization skills. But
these models can only be useful to students when the students are able to create an accurate
model themselves or interpret a given model and use the model effectively for problem solving.
When students interpret and create visual static models, they develop new knowledge that
can be applied to other problem solving situations. Researchers emphasize the importance of
engaging students in real-world mathematics (Baruk, 1985, Greer, 1993; Verschaffel, De Corte,
& Lasure, 1994; Verschaffel, Greer, & De Corte, 2007). Model generation, selection, and
interpretation become key factors in students’ success in solving mathematical problems (Martin,
Svihla, & Petrick Smith, 2012; Moseley & Okamoto, 2008; Ng & Lee, 2009). In his coordination
class theory, diSessa (2002) argues that a student’s interpretation of a problem situation is
connected to his or her readout (i.e. consistently identifying the important information in a
problem situation in order to enact a solution strategy). Proficient problem solvers typically
develop complex representations (e.g., pictures, diagrams, or tables) to organize and keep track
of their solution strategies (Edens & Potter, 2008; Larkin, McDermott, Simon, & Simon, 1980;
Whitin & Whitin, 2001). Unfortunately, many students do not automatically utilize visual static
models while problem solving or they create a model that does not reflect the mathematical
situation. Students require assistance and guidance from teachers and knowledgeable peers as
they select, interpret, and create visual models of mathematics (Abrams, 2001; Moyer & Jones,
2004). This research suggests that complex relationships exist among the visual static models
teachers use in instruction, the mental models students create for themselves, and students’
strategies when using a model for problem solving.
Relationships Between Visual Static Models and Students’ Written Solutions to Fraction Tasks
4
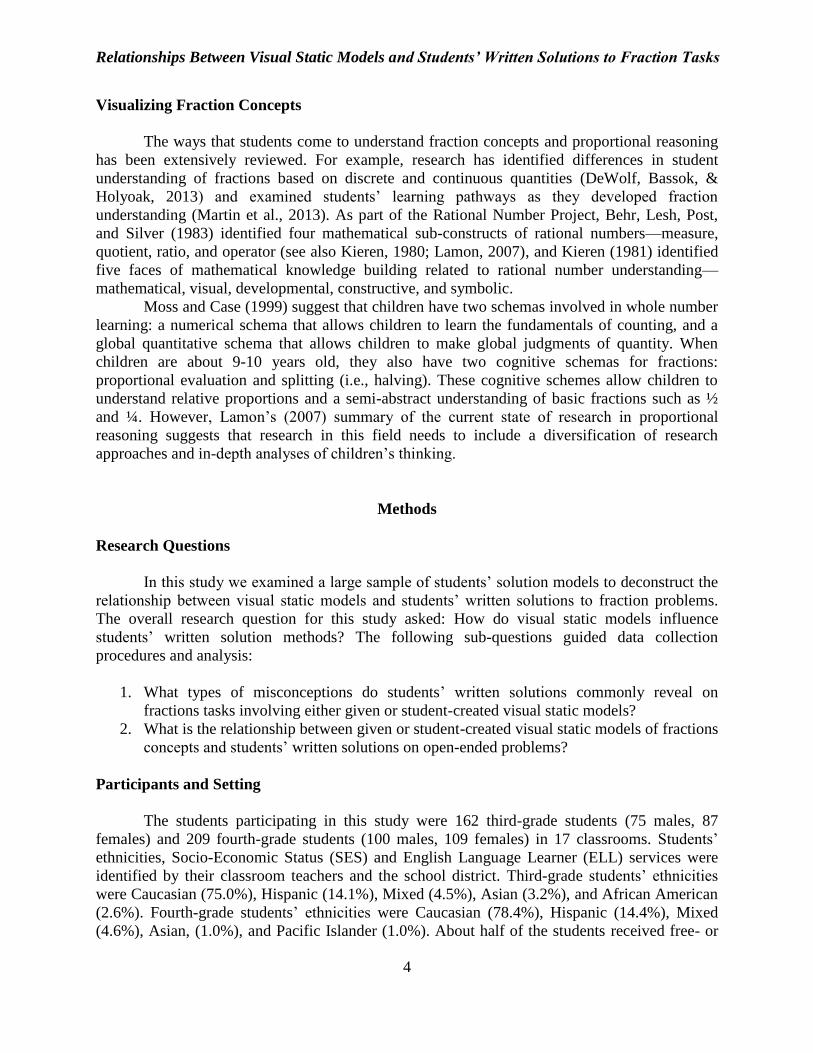
Visualizing Fraction Concepts
The ways that students come to understand fraction concepts and proportional reasoning
has been extensively reviewed. For example, research has identified differences in student
understanding of fractions based on discrete and continuous quantities (DeWolf, Bassok, &
Holyoak, 2013) and examined students’ learning pathways as they developed fraction
understanding (Martin et al., 2013). As part of the Rational Number Project, Behr, Lesh, Post,
and Silver (1983) identified four mathematical sub-constructs of rational numbers—measure,
quotient, ratio, and operator (see also Kieren, 1980; Lamon, 2007), and Kieren (1981) identified
five faces of mathematical knowledge building related to rational number understanding—
mathematical, visual, developmental, constructive, and symbolic.
Moss and Case (1999) suggest that children have two schemas involved in whole number
learning: a numerical schema that allows children to learn the fundamentals of counting, and a
global quantitative schema that allows children to make global judgments of quantity. When
children are about 9-10 years old, they also have two cognitive schemas for fractions:
proportional evaluation and splitting (i.e., halving). These cognitive schemes allow children to
understand relative proportions and a semi-abstract understanding of basic fractions such as ½
and ¼. However, Lamon’s (2007) summary of the current state of research in proportional
reasoning suggests that research in this field needs to include a diversification of research
approaches and in-depth analyses of children’s thinking.
Methods
Research Questions
In this study we examined a large sample of students’ solution models to deconstruct the
relationship between visual static models and students’ written solutions to fraction problems.
The overall research question for this study asked: How do visual static models influence
students’ written solution methods? The following sub-questions guided data collection
procedures and analysis:
1. What types of misconceptions do students’ written solutions commonly reveal on
fractions tasks involving either given or student-created visual static models?
2. What is the relationship between given or student-created visual static models of fractions
concepts and students’ written solutions on open-ended problems?
Participants and Setting
The students participating in this study were 162 third-grade students (75 males, 87
females) and 209 fourth-grade students (100 males, 109 females) in 17 classrooms. Students’
ethnicities, Socio-Economic Status (SES) and English Language Learner (ELL) services were
identified by their classroom teachers and the school district. Third-grade students’ ethnicities
were Caucasian (75.0%), Hispanic (14.1%), Mixed (4.5%), Asian (3.2%), and African American
(2.6%). Fourth-grade students’ ethnicities were Caucasian (78.4%), Hispanic (14.4%), Mixed
(4.6%), Asian, (1.0%), and Pacific Islander (1.0%). About half of the students received free- or
Anderson-Pence, Moyer-Packenham, Westenskow, Shumway, & Jordan
5
reduced lunch and were classified as low-SES (third grade: 42.3%, fourth grade: 53.6%). A small
percentage of students received English Language Learner (ELL) services (third grade: 4.5%,
fourth grade: 7.7%). The 17 classrooms were in two different school districts in eight different
elementary schools in the western United States.
Data Sources & Instruments
The main data source for this analysis was a set of open-ended assessment items
following a unit of fraction instruction. These open-ended items came from four different test-
item databases (National Assessment of Educational Progress, Massachusetts Comprehensive
Assessment System, Utah Test Item Pool Service, and Virginia Standards of Learning) and
included visual and numeric representations of fraction concepts. Five mathematics educators
reviewed the test items for content validity and the tests were piloted in six school districts prior
to the study to determine item difficulties and reliability measures (Moyer-Packenham et al.,
2013).
With the aid of university researchers, classroom teachers administered the assessment at
the end of their regular unit of fraction instruction. Instructional objectives for these units related
directly to state curriculum standards. Third-grade objectives included understanding equal parts;
understanding and using region, set, and number line models; naming and writing fractions;
comparing and ordering fractions; and understanding equivalent fractions. Fourth-grade
objectives included dividing regions into fractional parts; understanding part/whole ideas;
comparing and ordering fractions; identifying numbers between fractions; identifying and
generating equivalent fractions; modeling addition and subtraction of fractions; and adding and
subtracting fractions.
The two open-ended assessment items that form the basis of this analysis highlight
students’ use of visual static models in their written solutions and were designed to gather
information beyond simple correct or incorrect responses (Cai, Lane, & Jakabcsin, 1996). The
purpose of these open-ended tasks was to understand the relationships between either given or
student-created visual static models of fraction concepts and students’ written solutions. The
Area Task required third-grade students to interpret models of equivalent fractions. The Pizza
Task presented fourth-grade students with a situation of equivalent fractions of different-sized
wholes.
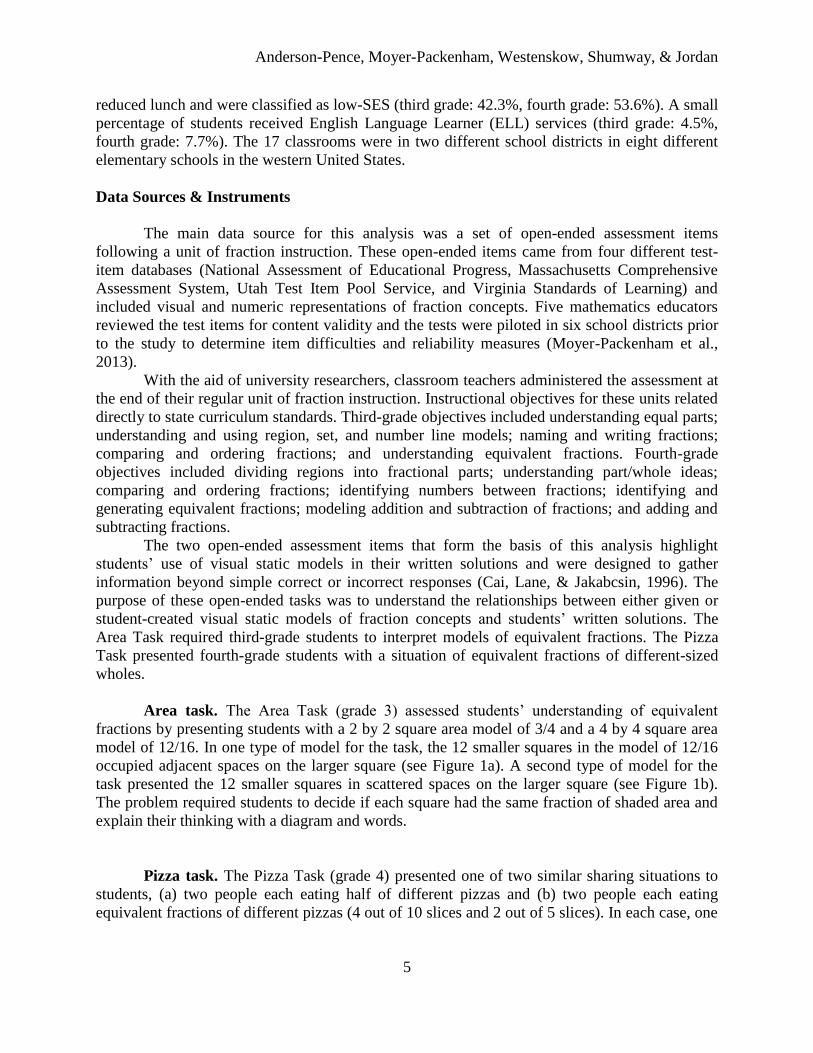
Area task. The Area Task (grade 3) assessed students’ understanding of equivalent
fractions by presenting students with a 2 by 2 square area model of 3/4 and a 4 by 4 square area
model of 12/16. In one type of model for the task, the 12 smaller squares in the model of 12/16
occupied adjacent spaces on the larger square (see Figure 1a). A second type of model for the
task presented the 12 smaller squares in scattered spaces on the larger square (see Figure 1b).
The problem required students to decide if each square had the same fraction of shaded area and
explain their thinking with a diagram and words.
Pizza task. The Pizza Task (grade 4) presented one of two similar sharing situations to
students, (a) two people each eating half of different pizzas and (b) two people each eating
equivalent fractions of different pizzas (4 out of 10 slices and 2 out of 5 slices). In each case, one
Relationships Between Visual Static Models and Students’ Written Solutions to Fraction Tasks
6
person (José) claimed to have eaten more pizza than the other person (Ella). The problem then
required students to determine how José could be correct (see Figure 2).
In these situations José can be correct if his original pizza was larger than Ella’s. In other
words, one whole could have been larger than the other whole. These tasks assessed students’
understanding of part-whole relationships in fractions using a region model.
1a.
Sam said that the two squares
below have the same fraction of
shaded area. Use a drawing and
explain why you think Sam is
right or wrong.
1b.
Sam said that the two squares
below have the same fraction of
shaded area. Use a drawing and
explain why you think Sam is
right or wrong.
Figure 1. Area Task for Third Grade.
Think carefully about the following question. Write a complete answer. You may use
drawings, words, and numbers to explain your answer. Be sure to show all of your work.
a. José ate ½ of a pizza
Ella ate ½ of another pizza
José said that he ate more pizza than
Ella, but Ella said they both ate the
same amount. Use words and pictures
to show that José could be right.
b. A pizza is sliced into 10 equal
pieces and José ate 4 slices of the
pizza.
Another pizza is sliced into 5
equal pieces and Ella ate 2 slices
of the pizza.
José said that he ate more pizza
than Ella, but Ella said they both
ate the same amount. Use words
and pictures to show that José
could be right.
Figure 2. Pizza Task for Fourth Grade.
VISUALIZING FRACTIONS: MODELS AND PROBLEM SOLVING 7
7
Data Analysis
A qualitative analysis on the open-ended task questions followed data collection and
included open and axial coding (Strauss & Corbin, 1998; Merriam, 2009; Moghaddam, 2006).
First, pairs of researchers scored a sample of students’ solutions for each problem as correct or
incorrect. Incorrect responses were then categorized using open (i.e., descriptive) coding to
identify patterns in students’ errors. Next, researchers used axial coding to examine the
descriptive codes. Researchers grouped similar categories together and identified patterns and
relationships among categories. The axial coding resulted in preliminary problem-specific
scoring rubrics based on the accuracy of models used in representing the mathematics and how
the students used those models in their written solutions.
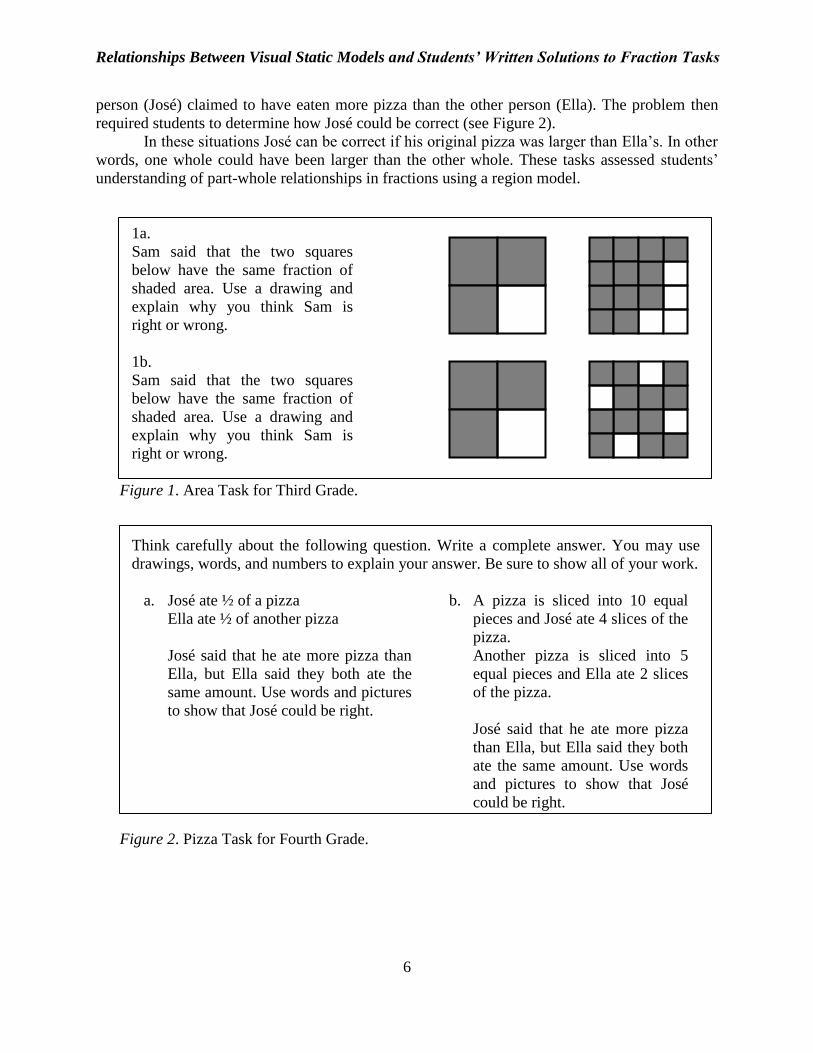
Next, researchers used the scoring rubrics to independently score and code the entire set
of 371 students’ open-ended responses. After independent coding, researchers met to compare
codes and to discuss discrepancies. In cases of discrepancy, researchers discussed the particular
student response and reached a consensus decision. An examination of the error patterns across
the entire data set revealed additional patterns, and led researchers to revise the preliminary
scoring rubric to distinguish those trends more closely. Consequently, researchers scored and
coded the entire data set a second time based on the revised rubrics (see Figure 3). Finally, the
frequency and percentage of students in each coding category were tabulated to identify common
errors on each of the assessment tasks resulting in the generation of hypotheses about
relationships between visual static models of fraction concepts and students’ written solutions to
problems based on those models.
3a. Rubric for Area Task
Code Meaning of Code
1 Completely wrong: no attempt or
indicated that Sam was wrong
2 Correct spatial drawing OR numerical
explanation: either incomplete
explanation OR did not provide a
drawing as proof
3 Correct spatial drawing AND numerical
explanation: explained that four little
squares were equivalent to one big square
and provided a drawing as proof
3b. Rubric for Pizza Task Code Meaning of Code
1 Equivalence: state that the fractions are
equivalent without considering size of
whole
2 Uneven parts: indicate that the only way
José’s piece could be larger is if the
pieces were not cut evenly
3 Focus on whole number: indicate that
José was looking at the whole numbers
of the fractions when comparing
4 Correct: explanation or drawing shows a
difference in the sizes of the two pizzas
Figure 3. Rubrics for scoring open-ended assessment items: Area and Pizza Tasks.
Results
The overall research question for this study asked: How do visual static models influence
students’ written solution methods? To generate hypotheses about this relationship, the results
for both assessment items are presented. The first section provides descriptive frequencies of
errors for each of the assessment tasks. The second section provides descriptive examples of how
the given and student-created visual static models related to students’ written solutions on the
assessment tasks.
Relationships Between Visual Static Models and Students’ Written Solutions to Fraction Tasks
8
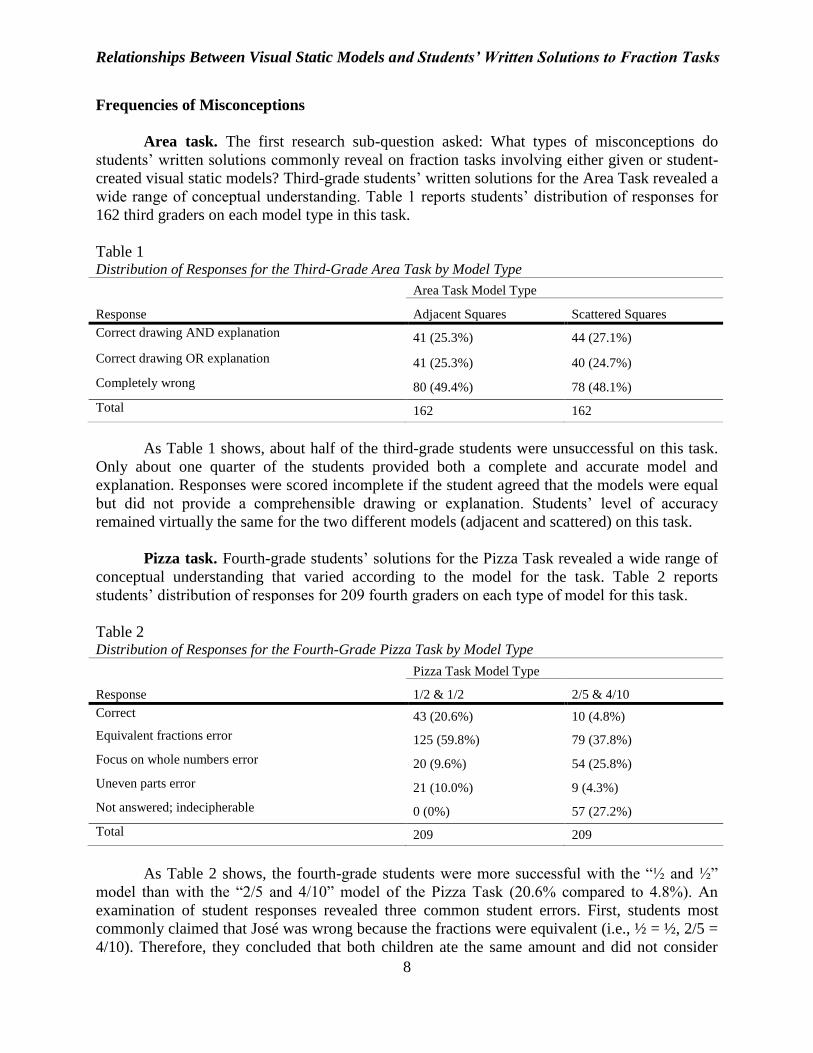
Frequencies of Misconceptions
Area task. The first research sub-question asked: What types of misconceptions do
students’ written solutions commonly reveal on fraction tasks involving either given or student-
created visual static models? Third-grade students’ written solutions for the Area Task revealed a
wide range of conceptual understanding. Table 1 reports students’ distribution of responses for
162 third graders on each model type in this task.
Table 1 Distribution of Responses for the Third-Grade Area Task by Model Type
Response
Area Task Model Type
Adjacent Squares Scattered Squares
Correct drawing AND explanation 41 (25.3%) 44 (27.1%)
Correct drawing OR explanation 41 (25.3%) 40 (24.7%)
Completely wrong 80 (49.4%) 78 (48.1%)
Total 162 162
As Table 1 shows, about half of the third-grade students were unsuccessful on this task.
Only about one quarter of the students provided both a complete and accurate model and
explanation. Responses were scored incomplete if the student agreed that the models were equal
but did not provide a comprehensible drawing or explanation. Students’ level of accuracy
remained virtually the same for the two different models (adjacent and scattered) on this task.
Pizza task. Fourth-grade students’ solutions for the Pizza Task revealed a wide range of
conceptual understanding that varied according to the model for the task. Table 2 reports
students’ distribution of responses for 209 fourth graders on each type of model for this task.
Table 2 Distribution of Responses for the Fourth-Grade Pizza Task by Model Type
Response
Pizza Task Model Type
1/2 & 1/2 2/5 & 4/10
Correct 43 (20.6%) 10 (4.8%)
Equivalent fractions error 125 (59.8%) 79 (37.8%)
Focus on whole numbers error 20 (9.6%) 54 (25.8%)
Uneven parts error 21 (10.0%) 9 (4.3%)
Not answered; indecipherable 0 (0%) 57 (27.2%)
Total 209 209
As Table 2 shows, the fourth-grade students were more successful with the “½ and ½”
model than with the “2/5 and 4/10” model of the Pizza Task (20.6% compared to 4.8%). An
examination of student responses revealed three common student errors. First, students most
commonly claimed that José was wrong because the fractions were equivalent (i.e., ½ = ½, 2/5 =
4/10). Therefore, they concluded that both children ate the same amount and did not consider
Anderson-Pence, Moyer-Packenham, Westenskow, Shumway, & Jordan
9
that the two wholes could be different sizes. Second, many students argued José’s error by
comparing the whole numbers of the numerators and denominators. For example, one student
partitioned José’s pizza into eight sections and suggested that José thought that 4/8 was bigger
than ½ because 4 is bigger than 1. This error occurred more often on the “2/5 and 4/10” task
(25.8%) than on the “½ and ½” task (9.6%). Finally, some students reasoned that José’s portion
of the pizza must have been cut slightly larger than the other pieces. Ten percent of the students
offered this explanation for the “½ and ½” task, but only 4.3% of the students offered a similar
explanation for the “2/5 and 4/10” task. Overall, it seemed that students had difficulty visualizing
a model with pizzas of two different sizes.
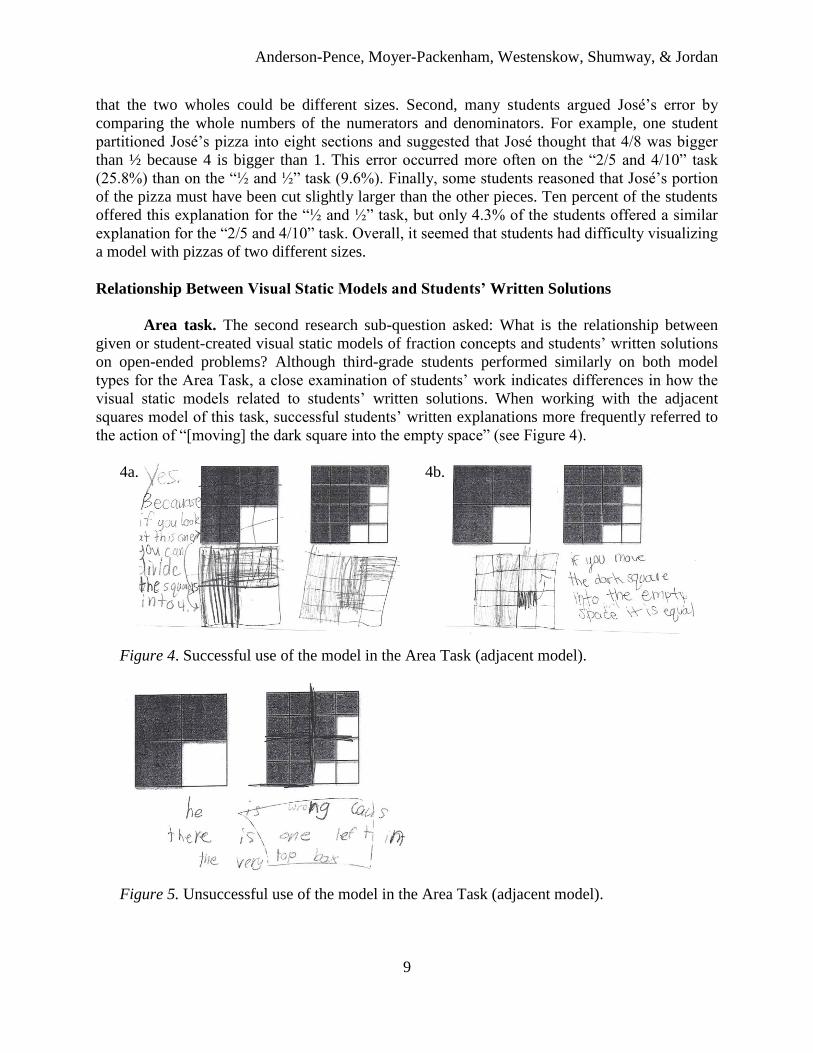
Relationship Between Visual Static Models and Students’ Written Solutions
Area task. The second research sub-question asked: What is the relationship between
given or student-created visual static models of fraction concepts and students’ written solutions
on open-ended problems? Although third-grade students performed similarly on both model
types for the Area Task, a close examination of students’ work indicates differences in how the
visual static models related to students’ written solutions. When working with the adjacent
squares model of this task, successful students’ written explanations more frequently referred to
the action of “[moving] the dark square into the empty space” (see Figure 4).
4a. 4b.
Figure 4. Successful use of the model in the Area Task (adjacent model).
Figure 5. Unsuccessful use of the model in the Area Task (adjacent model).

Relationships Between Visual Static Models and Students’ Written Solutions to Fraction Tasks
10
Unsuccessful students did not provide written information in their responses that
indicated that they were able to visualize this action. It is most likely that these students simply
perceived the two models as not identical, and therefore concluded that the models did not
represent equivalent fractions (see Figure 5).
When working with the scattered squares model for this task, successful students’ written
explanations more frequently identified four smaller squares as equivalent to one larger square
(see Figure 6a). Unsuccessful students typically focused only on the number of squares and not
on the size of the squares to determine if the amounts were equivalent (see Figure 6b).
6a. 6b.
Figure 6. Successful and unsuccessful use of the model in the Area Task (scattered model).
Pizza task. The Pizza Task did not provide students with a visual static model of the
problem. Instead, it required the students to develop their own visual static model of the situation
(see Figure 7).
Figure 7. Successful use of a student-generated model in the Pizza Task (“½ and ½” model).
Anderson-Pence, Moyer-Packenham, Westenskow, Shumway, & Jordan
11
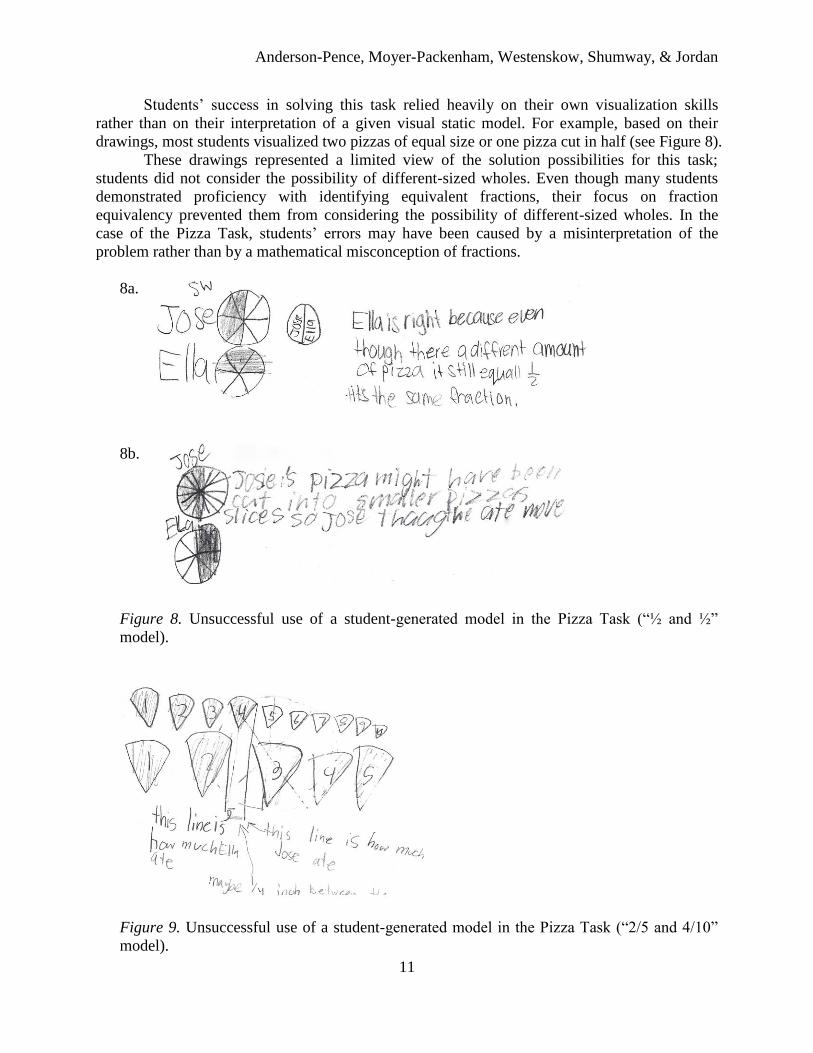
Students’ success in solving this task relied heavily on their own visualization skills
rather than on their interpretation of a given visual static model. For example, based on their
drawings, most students visualized two pizzas of equal size or one pizza cut in half (see Figure 8).
These drawings represented a limited view of the solution possibilities for this task;
students did not consider the possibility of different-sized wholes. Even though many students
demonstrated proficiency with identifying equivalent fractions, their focus on fraction
equivalency prevented them from considering the possibility of different-sized wholes. In the
case of the Pizza Task, students’ errors may have been caused by a misinterpretation of the
problem rather than by a mathematical misconception of fractions.
8a.
8b.
Figure 8. Unsuccessful use of a student-generated model in the Pizza Task (“½ and ½”
model).
Figure 9. Unsuccessful use of a student-generated model in the Pizza Task (“2/5 and 4/10”
model).

Relationships Between Visual Static Models and Students’ Written Solutions to Fraction Tasks
12
At times, the models drawn by the students actually hindered their success with the task.
For example, Figure 9 shows a student’s drawing of ten smaller pizza slices (José’s) lined up
with five larger pizza slices (Ella’s). The student then drew lines to compare the end of four of
José’s slices and two of Ella’s slices. Unfortunately, even though the student correctly concludes
that José ate more pizza, this model does not accurately portray the relationship between the two
fractions.
Discussion
This study used a large sample of students’ solution models to deconstruct the
relationship between visual static models and students’ written solutions to fraction problems.
Results indicate that common student errors relate to how students interpret the given model or
their own model of the problem situation. Results also indicate that students’ flexibility with
visual static models is related to successful written solutions. These results are discussed in the
sections that follow.
What types of misconceptions do students’ written solutions commonly reveal on fraction
tasks involving either given or student-created visual static models?
This study highlights two misconceptions students have when developing understandings
of fraction situations. First, in the Area Task, students unsuccessful with the scattered squares
model often focused on the number and not on the size of the squares to determine equivalence.
Students’ incorrect explanations and answers showed that they were likely considering whole
numbers, rather than fractions in making the comparison. This result supports recent research
findings that from a young age, number may be more influential than size in children’s
quantitative problem solving (e.g., Libertus, Starr, & Brannon, 2013).
In the Pizza Task, most students made the assumption that the pizzas were the same size.
Because of this, students were unable to generate an accurate model of the mathematical counter-
example. A possible explanation of students’ difficulty with this problem is that the students did
not relate the mathematical pizza context to real-world pizzas that come in many different sizes.
This finding is consistent with Verschaffel, Greer, and De Corte’s (2007) observation that
without a connection to real-world mathematics, students tend to suspend their sense-making and
“answer word problems without taking into account realistic considerations about the situations
described in the text” (p. 586). Students’ difficulty with making sense of the Pizza Task is also
consistent with other studies reporting students’ tendencies to give an answer to word problems
without considering real-world implications of a given situation (Baruk, 1985; Greer, 1993;
Verschaffel, et al., 1994).
Another possible explanation of students’ difficulty with this problem is that they
misinterpreted the task. According to diSessa’s (2002) coordination class theory, students attend
to what they consider the most important facts of the problem situation and design their solution
strategies accordingly. For example, measurement error while cutting pizza slices may be a
realistic interpretation. When sharing a pizza, the number of pieces shared is usually more
significant than the size of the pieces. This may partially explain some students’ reliance on
whole number thinking in this situation. Therefore, it can be argued that students’ difficulty with
the Pizza Task stemmed from a misinterpretation, rather than a misconception (i.e., a well-
Anderson-Pence, Moyer-Packenham, Westenskow, Shumway, & Jordan
13
rehearsed and trusted incorrect idea). Some of the students’ interpretations make some sense in
the real world even if they do not match the world of mathematics.
An important result to consider is that the two models of the Pizza Task elicited different
answers and student misconceptions. In the “½ and ½” model, over half (59.8%) of the students
inappropriately used equivalent fractions (i.e., ½ = ½, so the two portions must be equal) to
justify their answer. Yet, in the “2/5 and 4/10” model, only 37.8% of the students used the same
reasoning. Similarly, students were more likely to consider the numerator and denominator as
whole numbers on the “2/5 and 4/10” model than on the “½ and ½” model. This finding suggests
that students have a strong concept image (Tall & Vinner, 1981) of fractions such as one half,
but not of fractions such as 2/5 or 4/10—possibly because they have had many more experiences
seeing the re-representation (Scaife & Rogers, 1996) of ½ and because circular regions are
difficult to measure precisely when drawing fraction models. They are less likely to compare or
operate on the numerator and denominator of one half (or fractions equivalent to one half)
because of this concept image. This pattern reflects the two types of cognitive schema—
numerical and global quantitative—described by Moss and Case (1999). These cognitive
schemes allow children to understand relative proportions and a semi-abstract understanding of
basic fractions such as ½ and ¼. Additionally, reasoning with the 2/5 and 4/10 models involves
coordinating the measures and operator sub-constructs (Behr, Lesh, Post, & Silver, 1983) making
it more difficult than reasoning with the ½ model. This explains children’s ability to work with
the ½ model more successfully than the 2/5 and 4/10 models.
What is the relationship between given or student-created visual static models of fraction
concepts and students’ written solutions on open-ended problems?
The models that students experience, either visually or mentally, relate to students’
written solutions to problems. The results from this study shed light on ways that students use
these models. First, in the Area Task, most of the students completed the task correctly without
dealing directly with fractions because they were able to use the model. Instead of counting the
squares to determine equivalent fractions (i.e., using conservation of ratio), they proved
equivalence by visualizing the squares moving to different locations. Such movement of squares
supports Piaget’s (1952) notion of conservation of area. However, relying on the drawn model
alone may also divert students’ attention away from the numerical relations among the fractional
numbers. As long as no parts of the model are deleted or inserted, the model will still represent
the same amount regardless of the location of the parts. Some students wrote solutions based on
conservation of ratio, but the majority of students in this study relied on conservation of area in
their written solutions. The ability to interpret visual static models of fractions in this way may
be a precursor to understanding fraction concepts.
Second, in the Pizza Task, students were not given a visual static model on which to base
their solutions. Their success with this task depended on their ability to visualize the situation
with two different-sized wholes. A large majority of students were unable to satisfactorily
complete the two different models of this task (79.4% and 95.2%, respectively). Clearly, self-
generation of a representation is more cognitively demanding than working with given
representations (Clark, Nguyen, & Sweller, 2006; Woleck, 2001). This finding suggests that
students’ limited view of fraction models inhibited their success on this task. As noted above,
when students fail to visualize mathematical concepts in the real world, they develop a limited
conception of the meaning of the mathematics. Students’ ability to visualize mathematical
Relationships Between Visual Static Models and Students’ Written Solutions to Fraction Tasks
14
concepts is both a process and product of quality experiences in mathematics (Arcavi, 2003).
These results also support van Garderen’s (2006) findings that well-developed visualization
skills contribute greatly to high-achieving students’ success in mathematics.
Conclusion
The results of this study indicate that just being presented with visual static models in
assessment situations does not guarantee that students will be able to successfully generate their
own models or use the given models to accurately solve mathematics problems. The analyses
suggest that common misconceptions relate to how a student interprets either the given model or
his or her own model of the situation. Differences in students’ written solutions could be
influenced by instructional strategies or other exposures to mathematical representations
including real-world situations. We hypothesize that when students have a solid understanding of
real-world mathematical situations, they can successfully create and interpret visual static models
to make sense of mathematics. As students manipulate mental objects and consider real-world
applications, they actively participate in their own knowledge construction and develop
visualization skills. Based on the results of this study, further research is needed to determine the
factors influencing students’ development of visual static models.
Anderson-Pence, Moyer-Packenham, Westenskow, Shumway, & Jordan
15
References
Abrams, J. P. (2001). Teaching mathematical modeling and the skills of representation. In A. A.
Cuoco & F. R. Curcio (Eds.), The Roles of Representation in School Mathematics, 2001
Yearbook (pp. 269-282). Reston, VA: National Council of Teachers of Mathematics.
Arcavi, A. (2003). The role of visual representations in the learning of mathematics. Educational
Studies in Mathematics, 52(3), 215–241.
Baruk, S. (1985). L’âge du capitaine. De l’erreur en mathématiques. [The captian’s age. About
errors in mathematics]. Paris: Seuil.
Behr, M., Lesh, R., Post, T., & Silver, E. (1983). Rational number concepts. In R. Lesh & M.
Landau (Eds.), Acquisition of Mathematics Concepts and Processes (pp. 91-125). New
York: Academic Press.
Cai, J., Lane, S., & Jakabcsin, M. S. (1996). The role of open-ended tasks and holistic scoring
rubrics: Assessing students’ mathematical reasoning and communication. In P. C. Elliott
(Ed.), Communication in Mathematics, K-12 and Beyond (pp. 137-145). Reston, VA: The
National Council of Teachers of Mathematics.
Carpenter, T. P., Fennema, E., & Franke, M. L. (1996). Cognitively guided instruction: A
knowledge base for reform in primary mathematics instruction. The Elementary School
Journal, 97(1), 3–20.
Clark, R., Nguyen, F., & Sweller, J. (2006). Efficiency in learning: Evidence-based guidelines to
manage cognitive load. San Francisco, CA: Pfeiffer.
Council of Chief State School Officers and National Governors Association. (2010). Common
Core Standards. Retrieved from http://www.corestandards.org/about-the-standards/key-
points-in-mathematics.
DeWolf, M, Bassok, M, & Holyoak, K. J. (2013). Analogical reasoning with rational numbers:
Semantic alignment based on discrete versus continuous quantities. In M. Knauf, M.
Pauven, N. Sebanz, & I. Wachsmuth (Eds.), Proceedings of the 35th Annual Conference
of the of the Cognitive Science Society (pp. 388-393). Austin, TX: Cognitive Science
Society.
DiSessa, A. A. (2002). Why “conceptual ecology” is a good idea." In M. Limón & L. Mason
(Eds.). Reconsidering Conceptual Change: Issues in Theory and Practice (pp. 29-60).
Netherlands: Kluwer Academic Publishers.
Edens, K., & Potter, E. (2008). How students "unpack" the structure of a word problem: graphic
representations and problem solving. School Science And Mathematics, 108(5), 184-196.
Greer, B. (1993). The modeling perspective on wor(l)d problems. Journal of Mathematical
Behavior, 12, 239-250.
Hill, H. C., Rowan, B., & Ball, D. L. (2005). Effects of teachers’ mathematical knowledge for
teaching on student achievement. American Educational Research Journal, 42(2), 371–
406. doi:10.3102/00028312042002371

Relationships Between Visual Static Models and Students’ Written Solutions to Fraction Tasks
16
Kieren, T. E. (1980). The rational number construct: Its elements and mechanisms. In T. E.
Kieren (Ed.), Recent Research on Number Learning (pp. 125-150). Columbus, OH:
ERIC/SMEAC.
Kieren, T. E. (1981). Five faces of mathematical knowledge building. Edmonton: Department of
Secondary Education, University of Alberta.
Lamon, S. (1996). The development of unitizing: Its role in children's partitioning strategies.
Journal for Research in Mathematics Education, 27(2), 170-193.
Lamon, S. (2007). Rational numbers and proportional reasoning: Toward a theoretical
framework for research. In F. K. Lester (Ed.), Second Handbook of Research on
Mathematics Teaching and Learning (Vol. 1, pp. 629-667). Charlotte, NC: Information
Age Publishing Inc.
Larkin, J., McDermott, J., Simon, D.P., & Simon, H. A. (1980). Expert and novice performance
in solving physics problems. Science, 208(20), 1335-1342.
Lesh, R., Post, T., & Behr, M. (1987). Representations and translations among representations in
mathematics learning and problem solving. In C. Janvier (Ed.), Problems of
Representation in the Teaching and Learning of Mathematics (pp. 33-40). Hillsdale, NJ:
Lawrence Erlbaum Associates.
Libertus, M. E., Starr, A., & Brannon, E. M. (2013). Number trumps area for 7-month-old
infants. Developmental Psychology, doi:10.1037/a0032986
Martin, T., Aghababyan, A., Pfaffman, J., Olsen, J., Baker, S., Janisiewicz, P., ... & Smith, C. P.
(2013, April). Nanogenetic learning analytics: Illuminating student learning pathways in
an online fraction game. In Proceedings of the Third International Conference on
Learning Analytics and Knowledge (pp. 165-169). ACM.
Martin, T., Svihla, V., & Petrick Smith, C. (2012). The role of physical action in fraction
learning. Journal of Education and Human Development, 5(1).
Merriam, S. B. (2009). Qualitative research: A guide to design and implementation (3rd ed.).
San Francisco, CA: Jossey-Bass.
Moghaddam, A. (2006). Coding issues in grounded theory. Issues in Educational Research,
16(1), 52–66. http://www.iier.org.au/iier16/moghaddam.html
Moseley, B., & Okamoto, Y. (2008). Identifying fourth graders' understanding of rational
number representations: A mixed methods approach. School Science And
Mathematics, 108(6), 238-250.
Moss, J., & Case, R. (1999). Developing children’s understanding of the rational numbers: A
new model and an experimental curriculum. Journal for Research in Mathematics
Education, 30(2), 122-147.
Moyer, P. S., Bolyard, J. J., & Spikell, M. A. (2002). What are virtual manipulatives? Teaching
Children Mathematics, 8(6), 372–377.
Moyer, P. S., & Jones, M. G. (2004). Controlling choice: Teachers, students, and manipulatives
in mathematics classrooms. School Science and Mathematics, 104(1), 16-31.
Anderson-Pence, Moyer-Packenham, Westenskow, Shumway, & Jordan
17
Moyer-Packenham, P., Baker, J., Westenskow, A., Anderson, K., Shumway, J., Rodzon, K., &
Jordan, K., The Virtual Manipulatives Research Group at Utah State University. (2013).
A study comparing virtual manipulatives with other instructional treatments in third- and
fourth-grade classrooms. Journal of Education, 193(2), 25-39.
Moyer-Packenham, P. S., Ulmer, L. A., & Anderson, K. L. (2012). Examining pictorial models
and virtual manipulatives for third-grade fraction instruction. Journal of Interactive
Online Learning, 11(3), 103–120.
National Council of Teachers of Mathematics. (2000). Principles and standards for school
mathematics. Reston, VA: Author.
National Mathematics Advisory Panel (2008). Foundations for success: The final report of the
National Mathematics Advisory Panel. Washington, DC: U. S. Department of Education.
Ng, S. F., & Lee, K. (2009). The model method: Singapore children’s tool for representing and
solving algebraic word problems. Journal for Research in Mathematics Education, 40(3),
282-313.
Piaget, J. (1952). The child’s conception of number. New York: Humanities Press.
Sedig, K., & Liang, H.-N. (2006). Interactivity of visual mathematical representations: Factors
affecting learning and cognitive processes. Journal of Interactive Learning Research,
17(2), 179–212.
Scaife, M., & Rogers, Y. (1996). External cognition: how do graphical representations work?
International Journal of Human-Computer Studies, 45(2), 185–213.
doi:10.1006/ijhc.1996.0048
Strauss, A., & Corbin, J. (1998). Basics of qualitative research: Techniques and procedures for
developing grounded theory. Thousand Oaks, CA: Sage Publications, Inc.
Tall, D., & Vinner, S. (1981). Concept image and concept definition in mathematics with
particular reference to limits and continuity. Educational Studies in Mathematics, 12(2),
151-169.
Van Garderen, D. (2006). Spatial visualization, visual imagery, and mathematical problem
solving of students with varying abilities. Journal of Learning Disabilities, 39(6), 496–
506. doi:10.1177/00222194060390060201
Verschaffel, L., De Corte, E., & Lasure, S. (1994). Realistic considerations in mathematical
modeling of school arithmetic word problems. Learning and Instruction, 4, 273-294.
Verschaffel, L., Greer, B., & De Corte, E. (2007). Whole number concepts and operations. In F.
K. Lester (Ed.), Second handbook of research on mathematics teaching and learning
(Vol. 1, pp. 557–628). Charlotte, NC: Information Age Publishing Inc.
Whitin, P., & Whitin, D. (2001). Using literature to invite mathematical representations. In A. A.
Cuoco & F. R. Curcio (Eds.), The Roles of Representation in School Mathematics, 2001
Yearbook (pp. 228-237). Reston, VA: National Council of Teachers of Mathematics.
Woleck, K. R. (2001). Listen to their pictures; An investigation of children’s mathematical
drawings. In A. A. Cuoco & F. R. Curcio (Eds.), The Roles of Representation in School
Relationships Between Visual Static Models and Students’ Written Solutions to Fraction Tasks
18
Mathematics, 2001 Yearbook (pp. 215- 227). Reston, VA: National Council of Teachers
of Mathematics.
Wu, H. (2005, April). Key mathematical ideas in grades 5–8. Paper presented at National
Council of Teachers of Mathematics Annual Meeting, Anaheim, CA.
Yeh, Y. Y., & McTigue, E. M. (2009). The frequency, variation, and function of graphical
representations within standardized state science tests. School Science And
Mathematics, 109(8), 435-449.