Embed Size (px)
Citation preview

Managerial Economics

What is Managerial Economics ?
Economics: The branch of knowledge concerned with the production, consumption, and transfer of wealth.
It is the study of to use scarce resources that have alternate uses to satisfy desires that are unlimited and of varying importance. The manager is a person who direct resources to realize an explicit goal. The managerial Economics: The study of how to direct scarce resources within the way that majority efficiently achieves a managerial goal

Different types of economy : Capitalist
Capitalist Economy: A system of economics based on the private ownership of capital and production inputs, and on the production of goods and services for profit. No government involved in the economic decisions. Example : United States of America In economics, the invisible hand is a metaphor used by Adam Smith to describe unintended social benefits resulting from individual actions in his book "An Inquiry into the Nature and Causes of the Wealth of Nations"

Smith’s Invisible Hand "Every individual necessarily labors to render the annual revenue of the society as great as he can. He generally neither intends to promote the public interest, nor knows how much he is promoting it . He intends only his own gain, and he is in this, as in many other cases, led by an invisible hand to promote an end which was no part of his intention. Nor is it always the worse for society that it was no part of his intention. By pursuing his own interest he frequently promotes that of the society more effectually than when he really intends to promote it. I have never known much good done by those who affected to trade for the public good."

Different types of economy : Socialist
Socialist economy : a system is based on some form of social ownership of the means of production, which mean direct public ownership, where the government answer the questions of What to produce ? How to produce and For Whom to produce?
Example : North Korea

Different types of economy : Mixed
Mixed Economy : A system in which both the private enterprise and public sector coexist. All modern economies are mixed where the means of production are shared between the private and public sectors. Also called dual economy.
Example : India

Economic CostCost : is payment of labor or estimated price
and Opportunity cost is the benefit of resources
that we gave up. For example a man opt a job offer in a city away from his home town for better salary gave up the opportunity of staying home, which is the opportunity cost in this case

Cost & Profit
Profit is the difference between the amount earned and the amount spent for any commodity
Economic profit = Total Revenue – Total Economic cost
The economic cost composed of the sum of all opportunity costs
Economic cost = Explicit costs + Implicit costsExplicit cost : Direct Monetary payments/costImplicit Cost : Non Monetary opportunity costs,
like the technology used by the manufacturerIe Economic profit = Total Revenue – (Explicit
costs + Implicit costs)Economic profit = Accounting Profit – Implicit
costsWhere Accounting Profit = Total Revenue –
Explicit costs

Cost
Marginal cost : marginal cost is the change in the total cost when the quantity produced has an increment by unit.
Incremental cost : Incremental cost is the change in total cost when the quantity produced has changed in terms of bulk

Economic Variables : Demand
Demand : defines a consumer's desire and willingness to pay a price for a specific good or service when all other factors are constant
The law of demand : states that, other things remaining same, the quantity demanded of a good increases when its price falls and vice versa

Economic Variables : Demand
Exceptions to the law of demand
Inferior Goods : The goods consumed by the people even if the price raises
Example : Hike in Ticket rates
Veblen Goods : Veblen good’s demand also increases with the raise in price. Veblen goods are types of Luxury goods, expressing conspicuous consumption and high status seeking
Example : a Rolls-Royce

The Demand Curve
The Demand curve is diminishing in nature
Price
Quantity
Demand

Factors influencing Demand
Price of goods or servicesPrices of related goodsIncome of the consumersTaste of the consumersExpected raise in the priceNumber of consumers

Factors influencing Demand
The variation of Demand curve w.r.t PRICE The change in price moves along with the curve
Price
Quantity
DemandP1
P2
q1 q2

Factors influencing Demand The variation of curve w.r.t Taste and other
factors (excluding price of the goods) A decrease in quantity demanded results a leftward shift ( Demand 2) and an increase results a rightward shift (Demand 3) of the curve
Price
Quantity
Demand 1Demand 2
Demand 3

Complimentary and Substitute
Complimentary Goods Whenever price of a good decreases as per the law of demand it’s demand will increase. Complimentary goods are those whose demand increases with the increase in demand of the former. Example : Tea and Sugar Whenever the demand of Tea increases, demand of sugar also increases. Here Sugar is the complimentary good of Tea.

Complimentary and Substitute
Substitute Goods Whenever the price of a good increases as per the law of demand it’s demand will decrease. Substitute good’s demand will decrease with increase in price of the former
Example : Tea and Coffee Whenever the price of Tea increases, it’s demand will decreases. Here Coffee act as a substitute of Tea and it’s demand decreases

Economic Variables : Supply
Supply : refers to the amount of goods that producers and firms are willing to sell at a given price when all other factors being held constant.
Law of Supply: The law of supply states that the quantity supplied of good rises when the price of good rises, considering all other factors constant

The Supply Curve
The Supply curve is incrementing in nature
Price
Quantity
Supply

Factors influencing Supply
Price of goods or servicesPrice of production inputsPrice of substitute goodsAdvance in production technologyExpected raise in the priceNumber of sellers

Factors influencing Supply
Price of goods or servicesPrice of production inputsPrice of substitute goodsAdvance in production technologyExpected raise in the priceNumber of sellers

Factors influencing Supply
The variation of Supply curve w.r.t PRICE The change in price moves along with the curve
Price
Quantity
Supp
ly
P1
P2
q2 q1

Factors influencing Supply
The variation of Supply curve other than price
Supp
ly d
ecre
ases
Supp
ly in
crea
ses
Price
Quantity

Market Equilibrium
A market attain equilibrium when, QUANTITY DEMANDED = QUANTITY SUPPLIED
Price
Quantity
DemandSu
pply

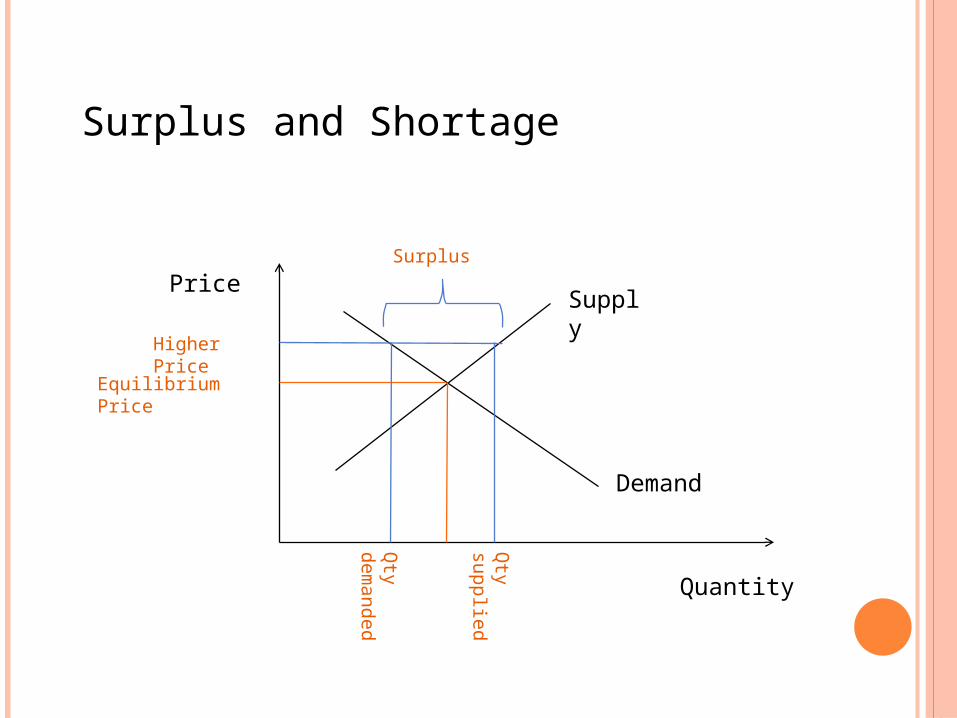
Surplus and Shortage
Surplus : It is the condition that arises when price of the commodity is greater than market equilibrium price. This leads to increase in quantity supplied than the quantity demanded. This excess supply of quantity is called Surplus
Shortage : It is the condition that arises when price of the commodity is less than market equilibrium price. This leads to a hype in demand. This scarcity of commodity than the actual demand is called Shortage
Surplus and Shortage
Price
Quantity
Equilibrium Price
Higher Price
Supply
Demand
Qty
dem
an
ded
Qty
sup
plie
d
Surplus

Surplus and Shortage
Price
Quantity
Equilibrium Price
Lower Price
Supply
Demand
Qty
sup
plie
d
Qty
dem
an
ded
Shortage

Variation in price and quantity when supply and demand changes simultaneously
SupplyNo Change Increases Decreases
No Change Price no changeQty no change
Price decreasesQty increases
Price increasesQty decreases
Increases Price increasesQty increases
Price can’t sayQty increases
Price increasesQty can’t say
Decreases Price decreasesQty decreases
Price decreasesQty can’t say
Price can’t sayQty decreases
Demand
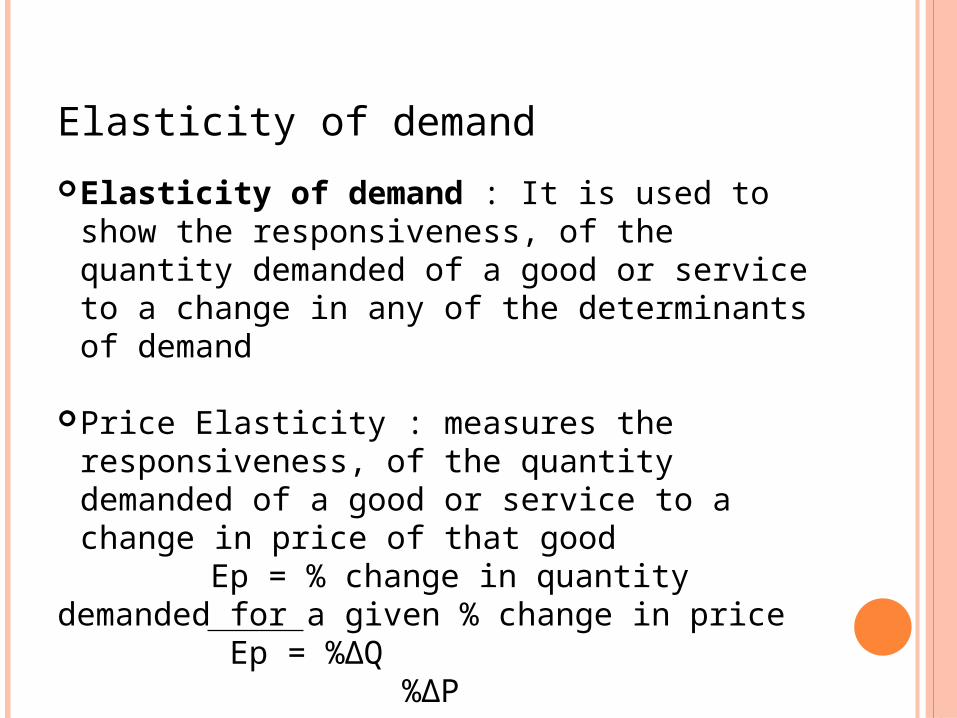
Elasticity of demand
Elasticity of demand : It is used to show the responsiveness, of the quantity demanded of a good or service to a change in any of the determinants of demand
Price Elasticity : measures the responsiveness, of the quantity demanded of a good or service to a change in price of that good
Ep = % change in quantity demanded for a given % change in price Ep = %ΔQ %ΔP

Elasticity of demand
Elasticity of demand : It is used to show the responsiveness, of the quantity demanded of a good or service to a change in any of the determinants of demand
Price Elasticity : measures the responsiveness, of the quantity demanded of a good or service to a change in price of that good
Ep = % change in quantity demanded for a given % change in price, since Q and P are inversely related the value of Ep will be -ve Ep = %ΔQ %ΔP
Elasticity of demand
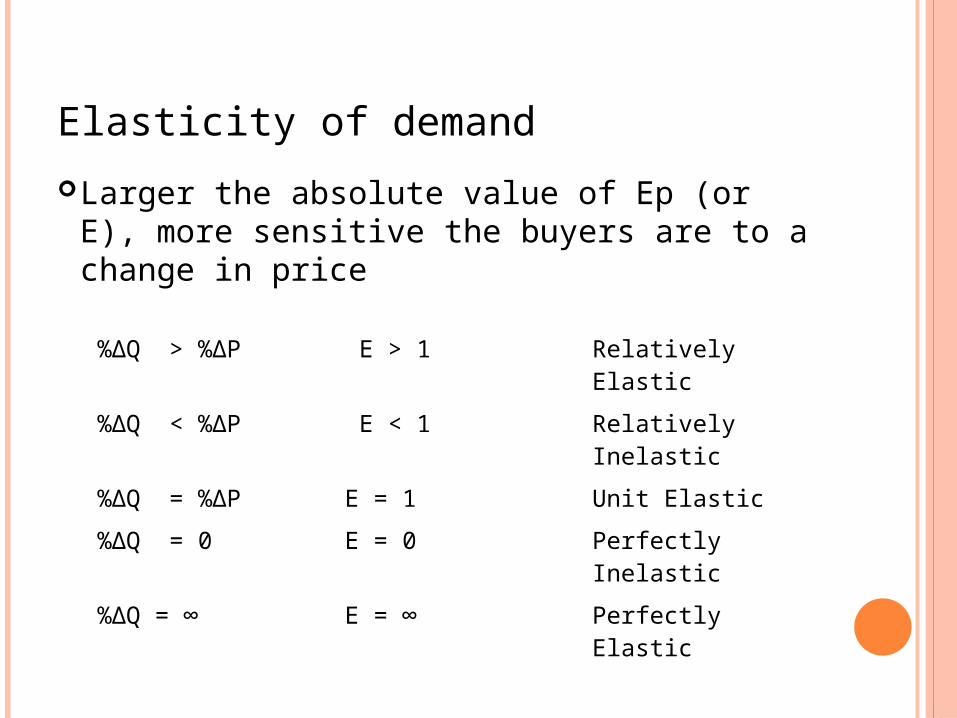
Larger the absolute value of Ep (or E), more sensitive the buyers are to a change in price
%ΔQ > %ΔP E > 1 Relatively Elastic
%ΔQ < %ΔP E < 1 Relatively Inelastic
%ΔQ = %ΔP E = 1 Unit Elastic
%ΔQ = 0 E = 0 Perfectly Inelastic
%ΔQ = ∞ E = ∞ Perfectly Elastic

Elasticity of demand
Price
Quantity
Price
Quantity
Perfectly Elastic Perfectly Inelastic

Elasticity of demand
Price
Quantity
Price
Quantity
Relatively less elastic
5
4
10075
Unit Elastic
10090
Elastic curves are more flatter and Inelastic curves are more steeper

Price Elasticity and total revenue
Price
Quantity
5
75
Tota
l re
ven
ue
Total Revenue = Price x Quantity Here ; Total Revenue = 5 x 75

Price Elasticity and total revenue
Price Elastic Unitary Inelastic
Increases Total Revenue Decreases
No change Total Revenue Increases
Decreases Total Revenue Increases
No change Total Revenue Decreases