Embed Size (px)
DESCRIPTION
Users who cannot formulate a precise query but know there must be a good answer somewhere, often rely on exploratory search. This requires an interactive and responsive system, or else the user will soon give up. As data bases are becoming larger, more specialized, and more distributed this calls for a Rich Internet Application, fast enough to keep pace with the users explorations. This thesis studies and implements a system, called MultiMap, which computes similarity maps in real-time. This entailed: (1) precomputing every data structure that does not change after the initial query, (2) optimizing algorithms for zooming and map generation (3) and providing a cognitively appropriate visualization of high dimensional space. Applied to a very large movie database, it resulted in a highly responsive, satisfying, usable system.
Citation preview
Master Thesis
The Design of a Rich Internet Application for
Exploratory Search by Real-Time Generation of
Similarity Maps
Roman Atachiants
Master of Science Thesis DKE 10-5
Thesis submitted in partial fulfillment of the requirements forthe degree of Master of Science of Master of Science in ArtificialIntelligence at the Department of Knowledge Engineering of the
Maastricht University
Exam committee:Dr. Eduard Hoenkamp (supervisor)
Dr. Ronald Westra
Maastricht UniversityFaculty of Humanities and Sciences
Department of Knowledge EngineeringMaster of Science in Artificial Intelligence
June 28, 2010
Abstract
Users who cannot formulate a precise query but know there must be a good answer somewhere,often rely on exploratory search. This requires an interactive and responsive system, or elsethe user will soon give up. As data bases are becoming larger, more specialized, and moredistributed this calls for a Rich Internet Application, fast enough to keep pace with the usersexplorations. This thesis studies and implements a system, called MultiMap, which computessimilarity maps in real-time. This entailed: (1) precomputing every data structure that doesnot change after the initial query, (2) optimizing algorithms for zooming and map generation(3) and providing a cognitively appropriate visualization of high dimensional space. Appliedto a very large movie database, it resulted in a highly responsive, satisfying, usable system.
1
Acknowledgments
A lot of people helped me in different ways all along the research project and brought differentinsights and opinions. I want to thank my fellow students, professors, friends and family whohelped, tested the prototype and supported/endured me during the research.
In particular, I would like to thank Dr. Eduard Hoenkamp for his support and supervisionof the project. Our regular meetings, discussions, brainstorming helped me a lot from thevery beginning and theoretical part of the research, down to the implementation, engineeringand design. But aside of professional relationship, I enjoyed his company the most and ourdiscussions about various domains, including: education, technology, politics, travel,... arereally memorable to me.
Next, I would like to thank a fellow A.I. student, Tom Marechal. He was an invaluableasset and friend, as he provided me with inspiration and ideas all along the research project.
Additional, I would like to thank Dr. Johannes C. Scholtes and Dr. Ronald Westra fortheir support, evaluation and critical thinking. Not only they, during the classes, largelyinspired me for this project but also gave various invaluable insights that contributed tomaking this thesis better.
I would also like to thank also everyone who participated in the testing and evaluation ofthe system, without their time and feedback the project would not be what it is today.
2
Contents
1 Introduction 41.1 Exploratory Search . . . . . . . . . . . . . . . . . . . . . . . . . . . . . . . . . 51.2 Faceted Classification . . . . . . . . . . . . . . . . . . . . . . . . . . . . . . . 71.3 Interactivity & Responsiveness . . . . . . . . . . . . . . . . . . . . . . . . . . 9
2 The Concept 122.1 The Idea . . . . . . . . . . . . . . . . . . . . . . . . . . . . . . . . . . . . . . . 122.2 The Prototype . . . . . . . . . . . . . . . . . . . . . . . . . . . . . . . . . . . 14
3 The System 153.1 Architectural Overview . . . . . . . . . . . . . . . . . . . . . . . . . . . . . . 153.2 Mathematical Concepts & Algorithms . . . . . . . . . . . . . . . . . . . . . . 17
3.2.1 Overview . . . . . . . . . . . . . . . . . . . . . . . . . . . . . . . . . . 173.2.2 Preprocessing & Correlations . . . . . . . . . . . . . . . . . . . . . . . 193.2.3 Ranking . . . . . . . . . . . . . . . . . . . . . . . . . . . . . . . . . . . 243.2.4 Facets Selection . . . . . . . . . . . . . . . . . . . . . . . . . . . . . . . 253.2.5 Movies Selection . . . . . . . . . . . . . . . . . . . . . . . . . . . . . . 263.2.6 Creation of Aspect Maps . . . . . . . . . . . . . . . . . . . . . . . . . 27
3.3 Server Technology . . . . . . . . . . . . . . . . . . . . . . . . . . . . . . . . . 283.4 The Client Front-End . . . . . . . . . . . . . . . . . . . . . . . . . . . . . . . 30
3.4.1 Overview . . . . . . . . . . . . . . . . . . . . . . . . . . . . . . . . . . 303.4.2 GridMap . . . . . . . . . . . . . . . . . . . . . . . . . . . . . . . . . . 31
4 Usability Aspects 35
5 Conclusions 37
A Protocol Generation DSL 41
3
Chapter 1
Introduction
Search and data visualization are becoming more and more important as we are entering thePetabyte Age. Traditional approaches of searching large datasets are query-based ones, whichby itself implies knowing what the user (researcher) is looking for. However, this approachof searching the information is difficult when one is not familiar with the domain or lacksthe knowledge or contextual awareness in order to formulate precise queries to navigate theinformation space. For example, how do we find something we would like to know more about,but without having the specific knowledge to formulate a precise question? How would wefind a movie we might enjoy if we never saw Robert DeNiro or Charlie Chaplin? Or knowingthat we enjoy Quentin Tarantino’s movies, how would we discover other, relatively similarmovies? In order to find those movies, we perform a search process called exploratory search.
Exploratory search is a specialization of information retrieval which represents the activitiescarried out by searchers who are:
• unfamiliar with the domain of their goal (i.e. need to learn about the topic in order tounderstand how to achieve their goal)
• or unsure about the ways to achieve their goals (either the technology or the process)
• or even unsure about their goals in the first place.
In this research, we try to address this exploratory search problem [27] by introducing anovel interactive search system. This system is called MultiMap and relies on similaritymeasurements in order to present the latent information relations to the user in a geographicmanner. The system have been developed and tested using the Netflix dataset [7], containingabout 125.000 movies. A custom selection were performed on the dataset:
• The genres were filtered to 28 IMDB genres.
• The directors were filtered to those with at least 5 movies made (in total around 2500directors).
• The actors were filtered to those with at least 10 movies where an actor has participated(in total around 6000 actors).
• The movies were filtered to those containing all needed information and made by thepreselected directors and actors. The final database contained around 16000 movies.
4
1.1. EXPLORATORY SEARCH CHAPTER 1. INTRODUCTION
1.1 Exploratory Search
During the first phase of research we considered the exploratory search problem [11] [19],trying to answer the following questions:
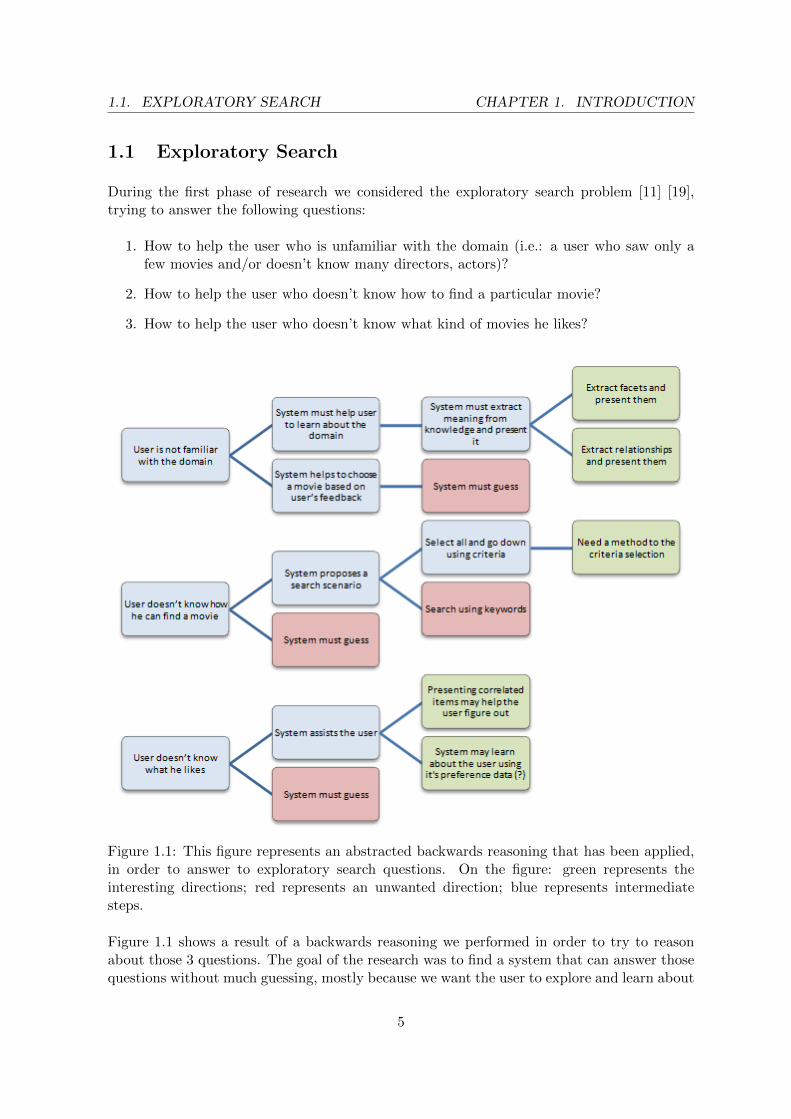
1. How to help the user who is unfamiliar with the domain (i.e.: a user who saw only afew movies and/or doesn’t know many directors, actors)?
2. How to help the user who doesn’t know how to find a particular movie?
3. How to help the user who doesn’t know what kind of movies he likes?
Figure 1.1: This figure represents an abstracted backwards reasoning that has been applied,in order to answer to exploratory search questions. On the figure: green represents theinteresting directions; red represents an unwanted direction; blue represents intermediatesteps.
Figure 1.1 shows a result of a backwards reasoning we performed in order to try to reasonabout those 3 questions. The goal of the research was to find a system that can answer thosequestions without much guessing, mostly because we want the user to explore and learn about
5
1.1. EXPLORATORY SEARCH CHAPTER 1. INTRODUCTION
the domain. From this analysis phase we derived several things that needed to be achievedby the system:
• An extracted meaning of the data is required, the system should know about the domain.In our particular case, the cinematographic domain.
• A way to preserve relations in order to help the user to relate different items.
• A way to drill down to individual movies and examine them is needed in order to allowthe user to navigate.
• Relevance feedback is needed in order to show the user how interesting a particular itemis and how relevant it is for his search. The idea behind relevance feedback is to takethe results that are initially returned from a given query and to use information aboutwhether or not those results are relevant to perform a new query.
The exploration in exploratory search means that a user have to be able to explore differentdirections and, in a manner, swim in the data. The exploration factor is something veryimplicit and therefore difficult to evaluate. In contrast to standard search engines, where theuser composes a query and the engine returns the closest documents to that query (document),we do not want to select the closest points always in our system and restrict the user to thesearch results that are the most relevant ones. By doing so, we allow the user to exploredifferent directions in this multi-dimensional space.
6
1.2. FACETED CLASSIFICATION CHAPTER 1. INTRODUCTION
1.2 Faceted Classification
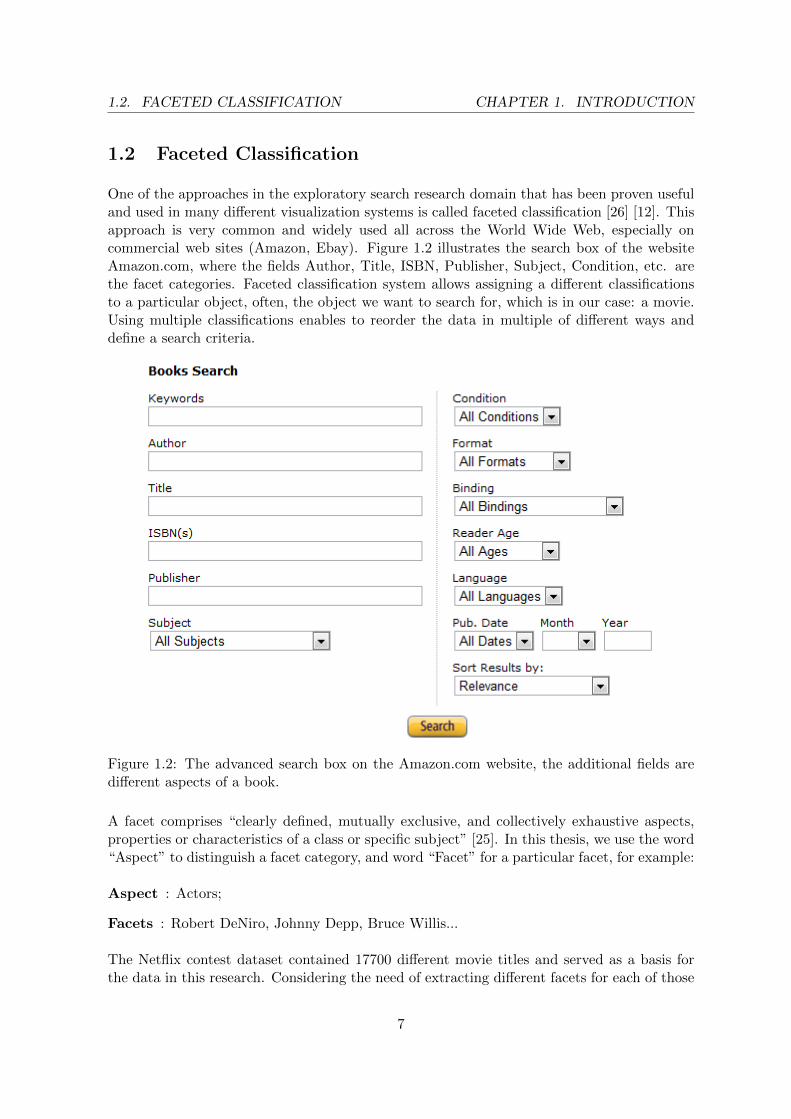
One of the approaches in the exploratory search research domain that has been proven usefuland used in many different visualization systems is called faceted classification [26] [12]. Thisapproach is very common and widely used all across the World Wide Web, especially oncommercial web sites (Amazon, Ebay). Figure 1.2 illustrates the search box of the websiteAmazon.com, where the fields Author, Title, ISBN, Publisher, Subject, Condition, etc. arethe facet categories. Faceted classification system allows assigning a different classificationsto a particular object, often, the object we want to search for, which is in our case: a movie.Using multiple classifications enables to reorder the data in multiple of different ways anddefine a search criteria.
Figure 1.2: The advanced search box on the Amazon.com website, the additional fields aredifferent aspects of a book.
A facet comprises “clearly defined, mutually exclusive, and collectively exhaustive aspects,properties or characteristics of a class or specific subject” [25]. In this thesis, we use the word“Aspect” to distinguish a facet category, and word “Facet” for a particular facet, for example:
Aspect : Actors;
Facets : Robert DeNiro, Johnny Depp, Bruce Willis...
The Netflix contest dataset contained 17700 different movie titles and served as a basis forthe data in this research. Considering the need of extracting different facets for each of those
7
1.2. FACETED CLASSIFICATION CHAPTER 1. INTRODUCTION
movies, a special tool has been written to extract additional information from the InternetMovie DataBase (IMDB) [1] website and Netflix Database via their exposed APIs. This toolwas able to extract about 95% of the information for those movies. In particular, we wereinterested in:
• Genres of the movies (Fantasy, Science-Fiction, Crime, Drama...)
• Year of release
• IMDB ratings, which is a precise rating from 1 to 10, rounded to 1st decimal
• Directors of the movies (Steven Spielberg, Quentin Tarantino...)
• Actors of the movies (Robert DeNiro, Johnny Depp, Bruce Willis...)
Additionally, there were also some other data about the movies (writers, movie plots, ...),but not as abundant as the five aspects presented above. Therefore, we decided to base thesystem on above aspects alone.
8
1.3. INTERACTIVITY & RESPONSIVENESS CHAPTER 1. INTRODUCTION
1.3 Interactivity & Responsiveness
Exploratory search is a process performed by a human who is using a tool (computer) tointeract with large quantities of information in order to explore and find the relevant piecesof information. This human-computer part means by definition that the actual process isan interactive process, therefore the interactivity is a very important aspect in exploratorysearch.
One way to approach interactivity is to start with the notion of “look and feel”. The term hasbecome more or less synonymous with how the term style is used in other design disciplines.In a concrete sense, the “look” of a GUI is its visual appearance, while the “feel” denotesits interactive aspects [24]. One of the consequences is that the interface should be veryresponsive and fast. One must also consider the fact that search systems need to handle largeamounts of data and need a lot of computing power. One logical conclusion is that in order tobuild a good exploratory search system, the data manipulation should be handled by powerfulmachines to be fast. During our research, we opted to a client-server approach to enhancethe interactivity without losing the computing power we need to perform all operations inreal-time, keeping the system well responsive and interactive. By having all operations inreal-time, we run into the problem of massive networking communication.
The communication in this case is a two-way dialog between the client and the server. Weneed the communication to be duplex, where the server and the client have the ability toinitiate the dialog, because the current world wide web is becoming real-time (huge servicesas Twitter and Facebook are good examples). As the information flow is updated in real-time,most of the services are still using the traditional HTTP protocol-based technologies.
The Hypertext Transfer Protocol (HTTP) is an Application Layer protocol for distributed,collaborative, hypermedia information systems (RFC specifications can be found: [2]). HTTPis a request-response protocol standard for client-server computing. In HTTP, a web browser,for example, acts as a client, while an application running on a computer hosting the website acts as a server. The client submits HTTP requests to the responding server by sendingmessages to it. The server, which stores content (or resources) such as HTML files and images,or generates such content on the fly, sends messages back to the client in response. Thesereturned messages may contain the content requested by the client or may contain other kindsof response indications [3].
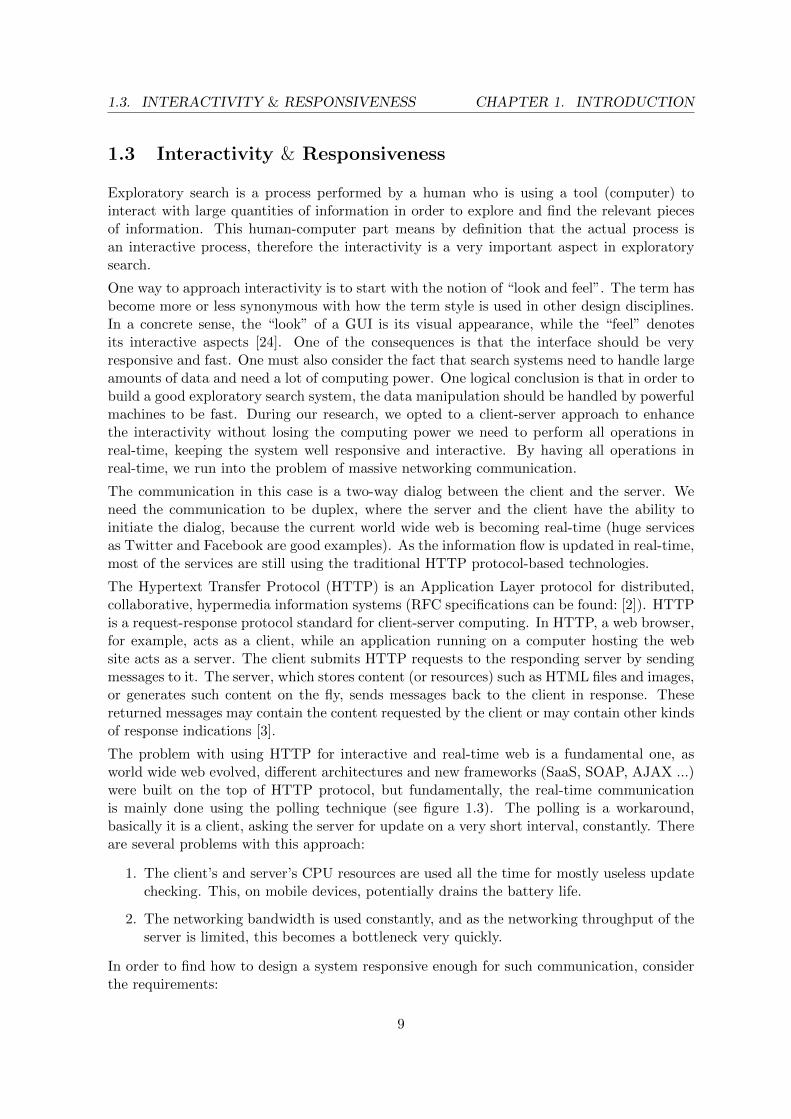
The problem with using HTTP for interactive and real-time web is a fundamental one, asworld wide web evolved, different architectures and new frameworks (SaaS, SOAP, AJAX ...)were built on the top of HTTP protocol, but fundamentally, the real-time communicationis mainly done using the polling technique (see figure 1.3). The polling is a workaround,basically it is a client, asking the server for update on a very short interval, constantly. Thereare several problems with this approach:
1. The client’s and server’s CPU resources are used all the time for mostly useless updatechecking. This, on mobile devices, potentially drains the battery life.
2. The networking bandwidth is used constantly, and as the networking throughput of theserver is limited, this becomes a bottleneck very quickly.
In order to find how to design a system responsive enough for such communication, considerthe requirements:
9
1.3. INTERACTIVITY & RESPONSIVENESS CHAPTER 1. INTRODUCTION
Figure 1.3: This figure shows the communication principles for real-time updates of the pollingarchitecture and a publisher/subscriber architecture.
1. A client-server approach, since the amount of data is important and the computationscan be very expensive.
2. Reliable networking is necessary (as we are not considering a streaming application andneed a reliable two-way communication), therefore the choice for the transport layer isTCP [14].
3. A format for message parsing in order to encode/decode complex messages while havingthe minimum impact on the performance
Since those requirements are quite similar to the requirements for multi-player client/serveron-line games, we considered that the best place for finding the technological answer for aninteractive search system would be the gaming literature [10] [18] [22]. The games are bydefinition interactive applications, and on-line games are usually intensively optimized forthe latency and throughput. Due to the fact that the interactivity requires a lot of duplexcommunication, the best option is a socket-server [18], and a custom protocol for low-levelmessage encoding.
Following those considerations, an interactive exploratory search system can be designed asa multiuser on-line game engine. The architecture should fulfill six goals: minimize networktraffic, provide opportunities for load balancing, provide a secure game playing environment,
10
1.3. INTERACTIVITY & RESPONSIVENESS CHAPTER 1. INTRODUCTION
provide a high level of scalability and maintainability, and maximize client side performancefor real-time graphics [8].
The architecture for the system is layered and component-based:
• The Network Component that contains the Packet Serializer (Messenger), De/Encrypt,De/Compress and Network modules. The Messenger module is in charge of formingand sending messages in a given format.
• The User Component that contains both the Authenticator and the User Databasemodules.
• The Search Component that is used and designed specifically for the exploratory searchpurposes with a custom protocol. For the system designed for this thesis, the searchcomponent is described more in detail in the section 3.2.
As mentioned earlier, the latency is a crucial point for highly interactive applications. Latencyrefers to the time it takes for a packet of data to be transported from its source to itsdestination. In many networking texts, you will also see the term Round Trip Time (RTT)in reference to the latency of a round trip from source to destination and then back to sourceagain. In many cases the RTT is twice the latency, but some network paths exhibit asymmetriclatencies, with higher latencies in one direction than the other [6]. There are different waysto deal with latency, but simply put: we need more control over the sent/received packetsand minimize their size and being able to prioritize and parallelize different actions [5].
11
Chapter 2
The Concept
2.1 The Idea
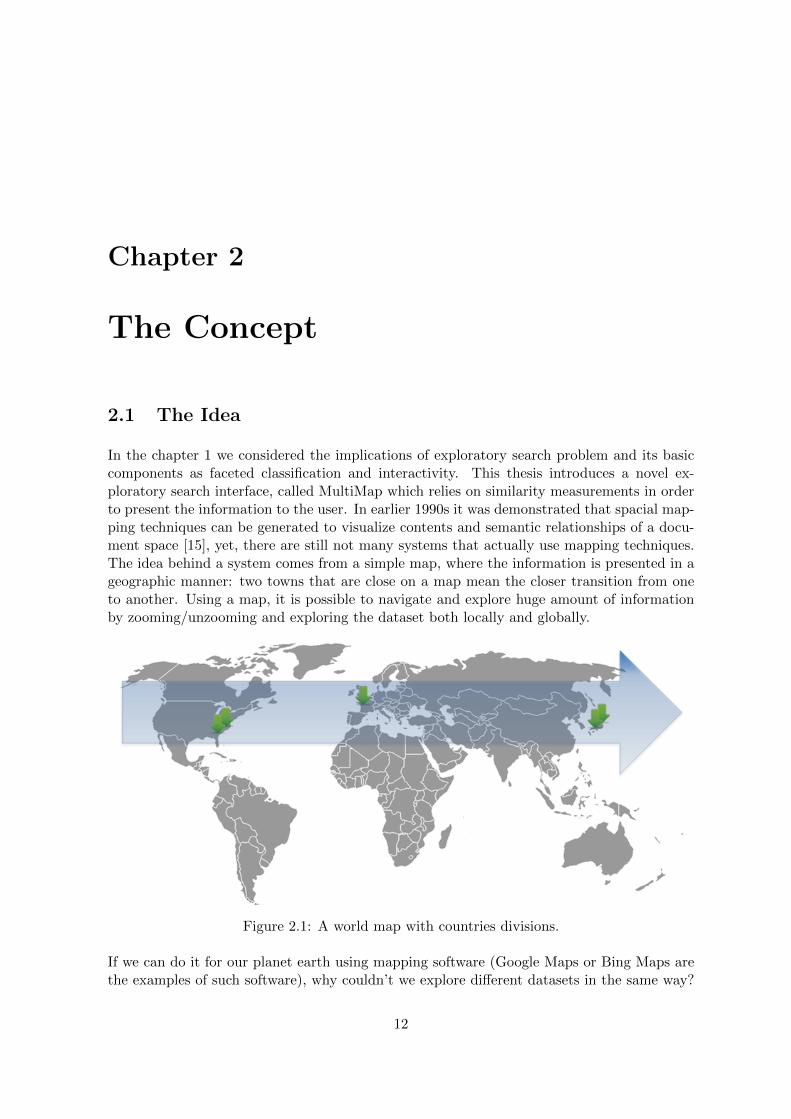
In the chapter 1 we considered the implications of exploratory search problem and its basiccomponents as faceted classification and interactivity. This thesis introduces a novel ex-ploratory search interface, called MultiMap which relies on similarity measurements in orderto present the information to the user. In earlier 1990s it was demonstrated that spacial map-ping techniques can be generated to visualize contents and semantic relationships of a docu-ment space [15], yet, there are still not many systems that actually use mapping techniques.The idea behind a system comes from a simple map, where the information is presented in ageographic manner: two towns that are close on a map mean the closer transition from oneto another. Using a map, it is possible to navigate and explore huge amount of informationby zooming/unzooming and exploring the dataset both locally and globally.
Figure 2.1: A world map with countries divisions.
If we can do it for our planet earth using mapping software (Google Maps or Bing Maps arethe examples of such software), why couldn’t we explore different datasets in the same way?
12
2.1. THE IDEA CHAPTER 2. THE CONCEPT
What if we could zoom on both New York and Tokyo and generate a new world map, havingWashington, New York, Tokyo, Kyoto and Paris in between (use figure 2.1 in order to helpimagining)? It can be rather messy to view them in this way, that’s why we also need tointroduce the context: Washington and New York are in United States of America, Tokyo andKyoto are in Japan and Paris is in France. The countries are a clear separation between thecities and helps us to understand better the cities. Now replace the towns by the Movies, thecountries by Genres/Actors/Directors and this gives a basic understanding of how MultiMapworks.
MultiMap is based on this idea of zooming and on-the-fly generation of new maps. Formallyit involves choosing new coordinate system. MultiMap features also the ability to unzoom tosee again the whole picture and switch the maps if needed (again, think Google Maps). Inorder to understand better how MultiMap works, let’s go back into the movie context andthink of different aspects, facets and movies:
• An aspect “Genres” contains facets “Action”, “Adventure”, etc.
• The facets “Action”, “Adventure” can relate to movies like “Indiana Jones” etc.
• The movie “Indiana Jones” contains the actor “Harrison Ford” (which is also a facet ofaspect “Actors”)
One can notice that this is a closed loop, it is possible to look at different genres, then look ata particular movie, then switch to actors and go on and explore the information this way. Ifwe imagine for a second that we can create a map of an aspect, where the points (“countries”)would be the facets, we probably should be able to place also the movies (”towns”) on thatmap. In order to create such maps, we need several components:
• A function to compare two facets of an aspect, a distance measurement. For example,this way we would be able to compare the similarity between the Adventure genre andthe Action genre or between Tom Hanks and Harrison Ford.
• A way to create a map very quickly as new map should be generated when the userzooms on some movie.
• A way to measure relevancy of the movies and facets. Considering our example above,what towns we would choose to present on a new map if we zoomed on New York andTokyo? Paris, London, Rome?
Further in this document, chapter 3 explains how the whole system is done, and in particular,the section 3.2 explains all concepts and algorithms that were developed in order to producea working prototype of MultiMap.
13
2.2. THE PROTOTYPE CHAPTER 2. THE CONCEPT
2.2 The Prototype
The MultiMap concept can be divided on two main parts:
• The system that performs all mathematical computations, handles the data and oper-ations on the data.
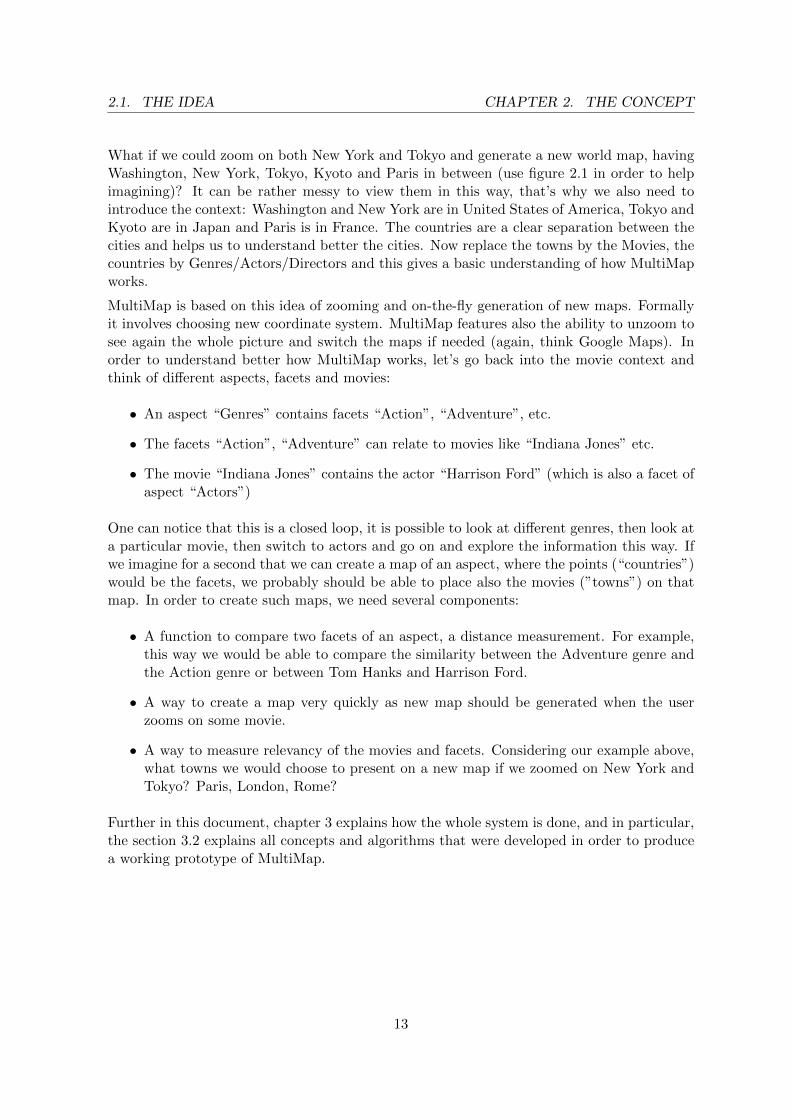
• The front-end that is presented to the user, after all, there are many different ways topresent a map. Figure 2.2 shows the front-end that we designed as our first approachto create a visualization for MultiMap system.
Figure 2.2: A screen-shot of the prototype, presenting a grid map on the directors aspect.
The front-end visualization for the MultiMap we designed is called GridMap, and is one ofthe approaches to visualize those maps. This approach relies on very ordered presentationof the maps . In fact, it tries to map a cloud of 2D points to a grid while trying preservethe spacial relations. The interface allows users to switch the aspect maps, zoom on differentfacets and by flipping a grid cell, viewing a details of a particular movie and follow its links toconstruct new maps. Section 3.4 explains more in detail the actual interface and its differentcomponents.
14
Chapter 3
The System
3.1 Architectural Overview
The system was designed to be a client-server application with several tiers, in this sectionwe will describe its design. The main idea is based on the interactivity between the user andthe data, and the ease-of-use. First of all, the system should meet several prerequisites:
• it should be interactive, so it has a real-time constraint;
• it should be able to handle large datasets;
• it should be easy to use and available to remote users.
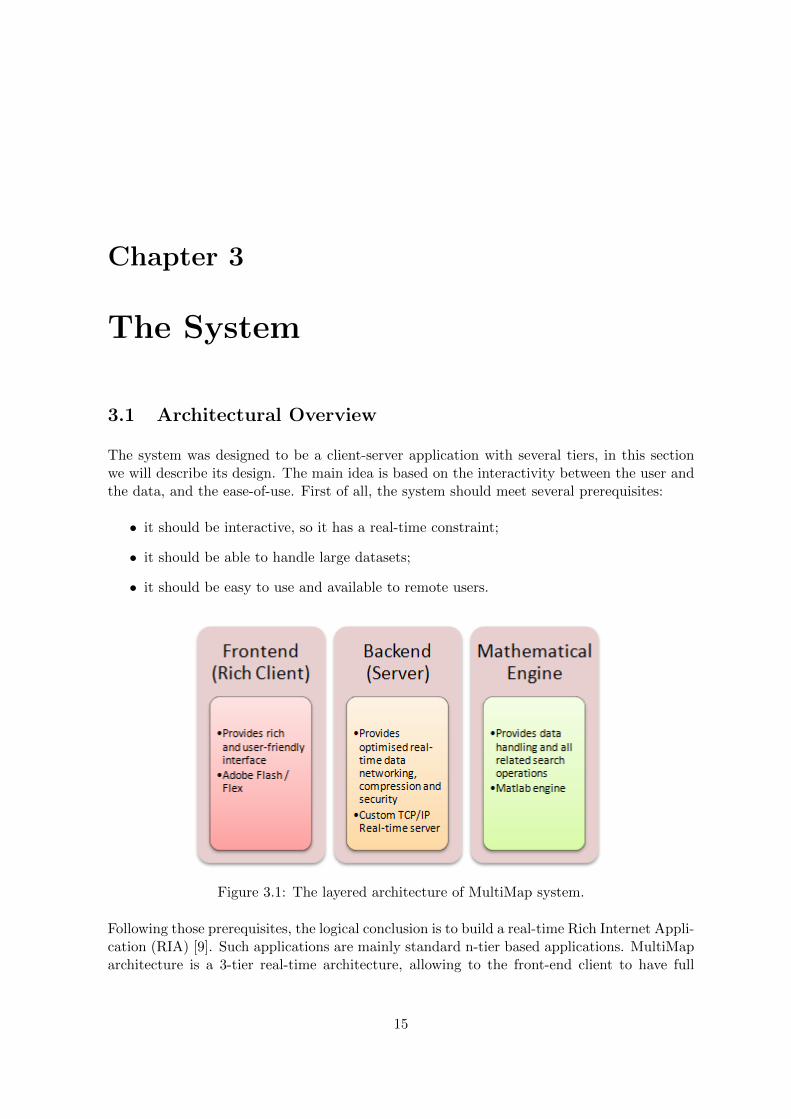
Figure 3.1: The layered architecture of MultiMap system.
Following those prerequisites, the logical conclusion is to build a real-time Rich Internet Appli-cation (RIA) [9]. Such applications are mainly standard n-tier based applications. MultiMaparchitecture is a 3-tier real-time architecture, allowing to the front-end client to have full
15
3.1. ARCHITECTURAL OVERVIEW CHAPTER 3. THE SYSTEM
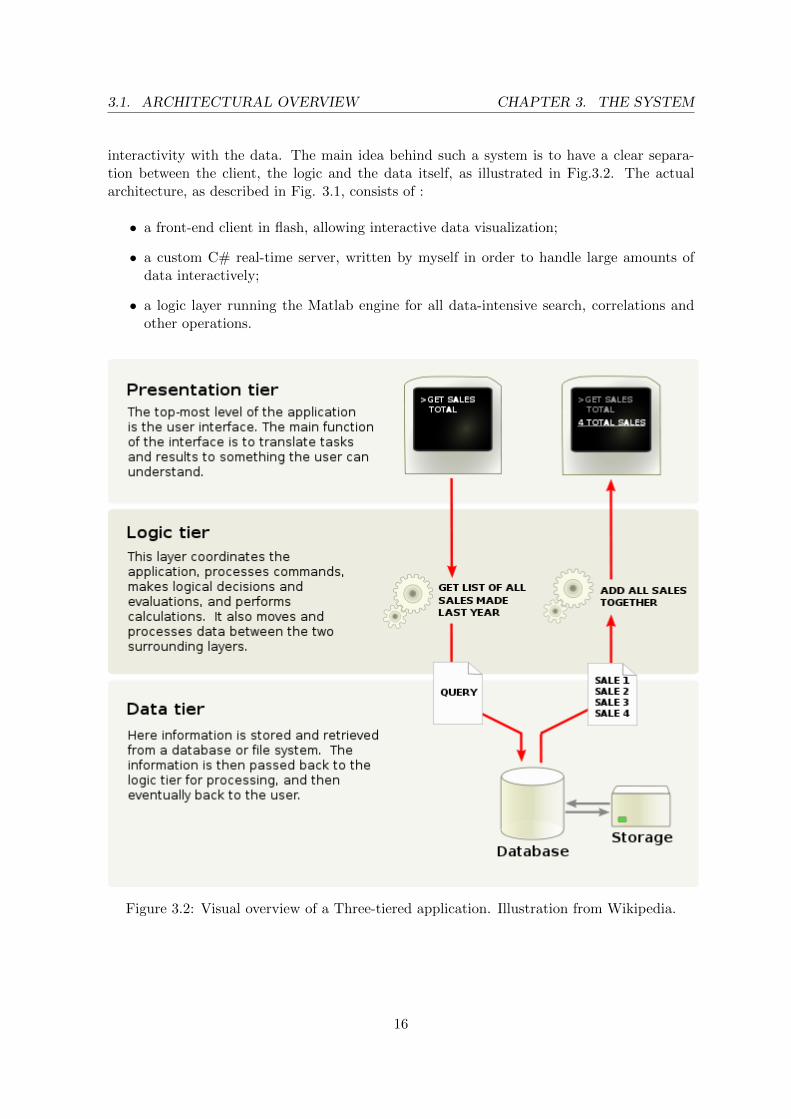
interactivity with the data. The main idea behind such a system is to have a clear separa-tion between the client, the logic and the data itself, as illustrated in Fig.3.2. The actualarchitecture, as described in Fig. 3.1, consists of :
• a front-end client in flash, allowing interactive data visualization;
• a custom C# real-time server, written by myself in order to handle large amounts ofdata interactively;
• a logic layer running the Matlab engine for all data-intensive search, correlations andother operations.
Figure 3.2: Visual overview of a Three-tiered application. Illustration from Wikipedia.
16
3.2. MATHEMATICAL CONCEPTS & ALGORITHMS CHAPTER 3. THE SYSTEM
3.2 Mathematical Concepts & Algorithms
3.2.1 Overview
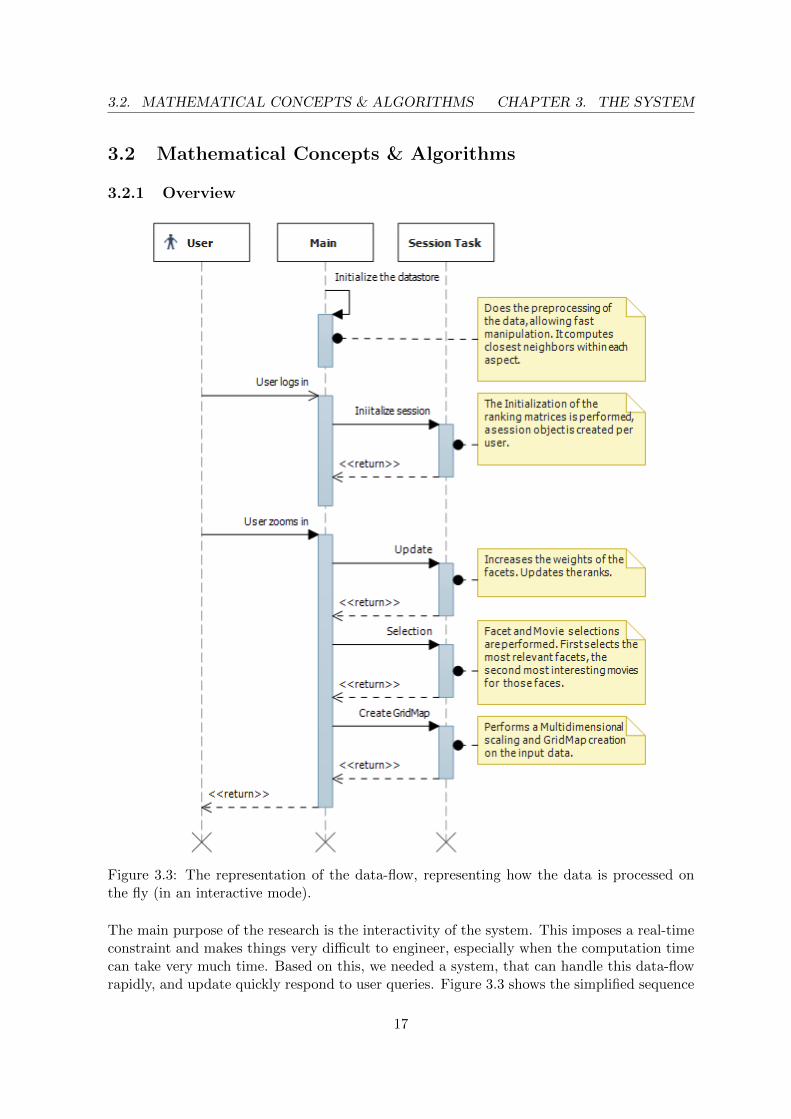
Figure 3.3: The representation of the data-flow, representing how the data is processed onthe fly (in an interactive mode).
The main purpose of the research is the interactivity of the system. This imposes a real-timeconstraint and makes things very difficult to engineer, especially when the computation timecan take very much time. Based on this, we needed a system, that can handle this data-flowrapidly, and update quickly respond to user queries. Figure 3.3 shows the simplified sequence
17
3.2. MATHEMATICAL CONCEPTS & ALGORITHMS CHAPTER 3. THE SYSTEM
diagram of the system, when the information need to be updated and presented. Next fewsection explain the details of this schema, block by block.
The system uses a content-based recommendation method. In content-based recommendationmethods, the utility u(c, s) of item s for user c is estimated based on the utilities u(c, si)assigned by user c to items si ∈ S that are similar to item s. For example, in a movierecommendation application, in order to recommend movies to user c, the content-basedrecommender system tries to understand the commonalities among the movies user c hasrated highly in the past (specific actors, directors, genres, subject matter, etc.). Then, onlythe movies that have a high degree of similarity to whatever users preferences are would getrecommended [4].
Overall, the flow consists of several main points:
• The preprocessing step performs the transformation and precomputes the maximum ofinformation that can be precomputed. It considers all aspects and for each facet in eachaspect computes a closest network (explained in the section 3.2.2).
• The session initialization step initializes the user session and copies some of the prepro-cessed data in a so-called Ranking Matrix.
• The update step performs the update of the Ranking Matrix (see 3.2.3 for more infor-mation). By doing so, a new ranking matrix is created, basically updating the ranks/rel-evancy ratings based on the selection.
• The facets selection step chooses several facets, based on the Ranking Matrix. To doso, it combines 2 techniques: takes a subset of most relevant facets from the matrix,then performs a k-means clustering to be able to pick most ”global” facets. This stepis explained more in detail in section 3.2.4.
• The movies selection step selects the most relevant movies for each facet that have beenchosen. This step is explained more in detail in section 3.2.5.
• The creation of aspect maps performs the multidimensional scaling [23] and a customgrid-map algorithms, in order to create 2-dimensional grid, where the latent relationsbetween different facets are retained. This approach is explained in section 3.2.6. Thisstep can be potentially replaced by any other representation, including 3-dimensionalones.
18
3.2. MATHEMATICAL CONCEPTS & ALGORITHMS CHAPTER 3. THE SYSTEM
3.2.2 Preprocessing & Correlations
Overview
The system handles a lot of data and reorders it continually on each request of the user. Inorder to allow the system to perform in the real-time, as much data as can be done shouldbe precomputed. Several things that needs to be done:
• For each aspect, the facets should be correlated in order to allow the comparison between2 points. This is done differently for each aspect, depending on the data. It allows, forexample, to correlate an Adventure genre and Science-Fiction genre.
• For each aspect, the facet network is computed. This network allows us to propagate aranking and reorder the facets in real-time. See the section 3.2.2 for more details.
• For each facet of each aspect, a list of most relevant movies is constructed and ordered.This is done to allow to pick the movies in real-time. This step is explained in moredetail in the section 3.2.2.
In the precomputation phase, one of the most important result is to be able to construct so-called ”Aspect Spaces”. Aspect Spaces are N-Dimensional dissimilarity matrices. The AspectSpaces are computed based on a particular distance metric δ(i, j) := distance between i thand j th features of an aspect. In order to simplify the implementation, we define:
• Input matrix I is an initial data we need in order to compute similarities between aspectsamples. They are presented in N dimensional space, where N is the number of movies,about 16000.
• Per aspect, a function δ which can be different for every aspect and computes themembership of the aspect to a particular movie.
Next few sections are explaining the definitions and the steps which are performed in orderto create each aspect space.
Genres Space
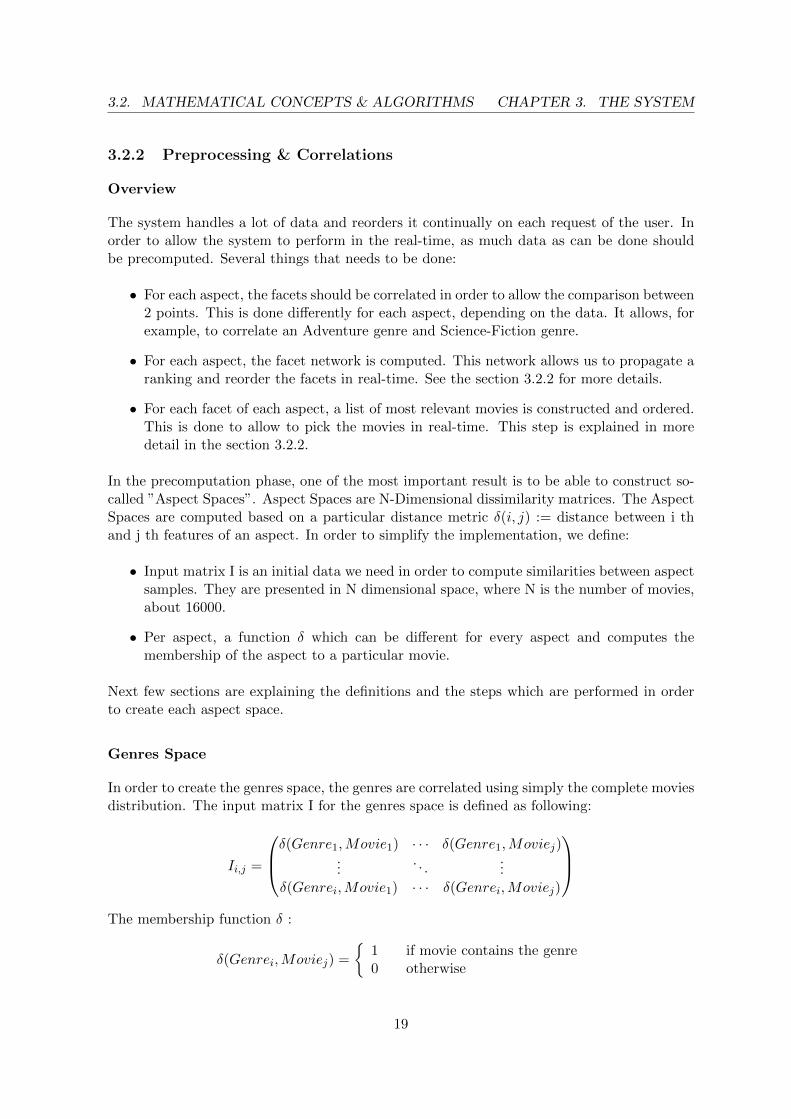
In order to create the genres space, the genres are correlated using simply the complete moviesdistribution. The input matrix I for the genres space is defined as following:
Ii,j =
δ(Genre1,Movie1) · · · δ(Genre1,Moviej)...
. . ....
δ(Genrei,Movie1) · · · δ(Genrei,Moviej)
The membership function δ :
δ(Genrei,Moviej) =
{1 if movie contains the genre0 otherwise
19
3.2. MATHEMATICAL CONCEPTS & ALGORITHMS CHAPTER 3. THE SYSTEM
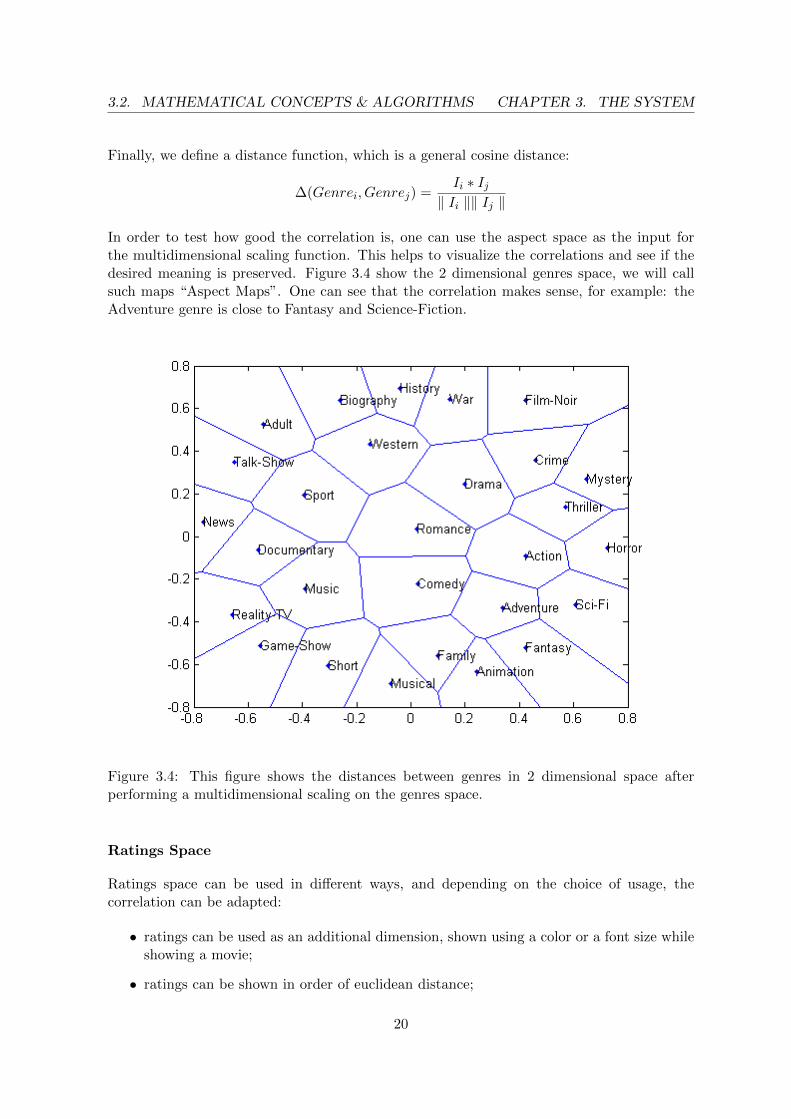
Finally, we define a distance function, which is a general cosine distance:
∆(Genrei, Genrej) =Ii ∗ Ij
‖ Ii ‖‖ Ij ‖
In order to test how good the correlation is, one can use the aspect space as the input forthe multidimensional scaling function. This helps to visualize the correlations and see if thedesired meaning is preserved. Figure 3.4 show the 2 dimensional genres space, we will callsuch maps “Aspect Maps”. One can see that the correlation makes sense, for example: theAdventure genre is close to Fantasy and Science-Fiction.
Figure 3.4: This figure shows the distances between genres in 2 dimensional space afterperforming a multidimensional scaling on the genres space.
Ratings Space
Ratings space can be used in different ways, and depending on the choice of usage, thecorrelation can be adapted:
• ratings can be used as an additional dimension, shown using a color or a font size whileshowing a movie;
• ratings can be shown in order of euclidean distance;
20
3.2. MATHEMATICAL CONCEPTS & ALGORITHMS CHAPTER 3. THE SYSTEM
• ratings can be used to create a complete ratings aspect space, but this requires morecomplex correlation function.
In the research, we decided to use the second approach, simply calculating the euclideanpairwise distance for each rating.
Years, Directors and Actors Spaces
There are several ways to correlate the years, directors and actors. In our research, wewanted to explore the possibility to correlate those facets based on their genres distribution.This approach would allow the user, for example, to see what kind of movies were done ina particular year and what are similar years, in terms of genres distribution. To do so, weproceed as follows:
Ai,j =
δ1(Y ear1,Movie1) · · · δ1(Y ear1,Moviej)...
. . ....
δ1(Y eari,Movie1) · · · δ1(Y eari,Moviej)
The membership function δ1 :
δ1(Y eari,Moviej) =
{1 if movie released that year0 otherwise
Next, we reuse the input matrix I from the genres space. This is defined as follows:
Bi,j =
δ2(Genre1,Movie1) · · · δ2(Genre1,Moviej)...
. . ....
δ2(Genrei,Movie1) · · · δ2(Genrei,Moviej)
The membership function δ2 :
δ2(Genrei,Moviej) =
{1 if movie contains the genre0 otherwise
Next, we need to compute the matrix I, which tells us in how many movies of differentgenres the actor has participated in. This is computed by a matrix multiplication of A andB transposed:
Ii,j =
δ(Y ear1, Genre1) · · · δ(Y ear1, Genrej)...
. . ....
δ(Y eari, Genre1) · · · δ(Y eari, Genrej)
= A×BT
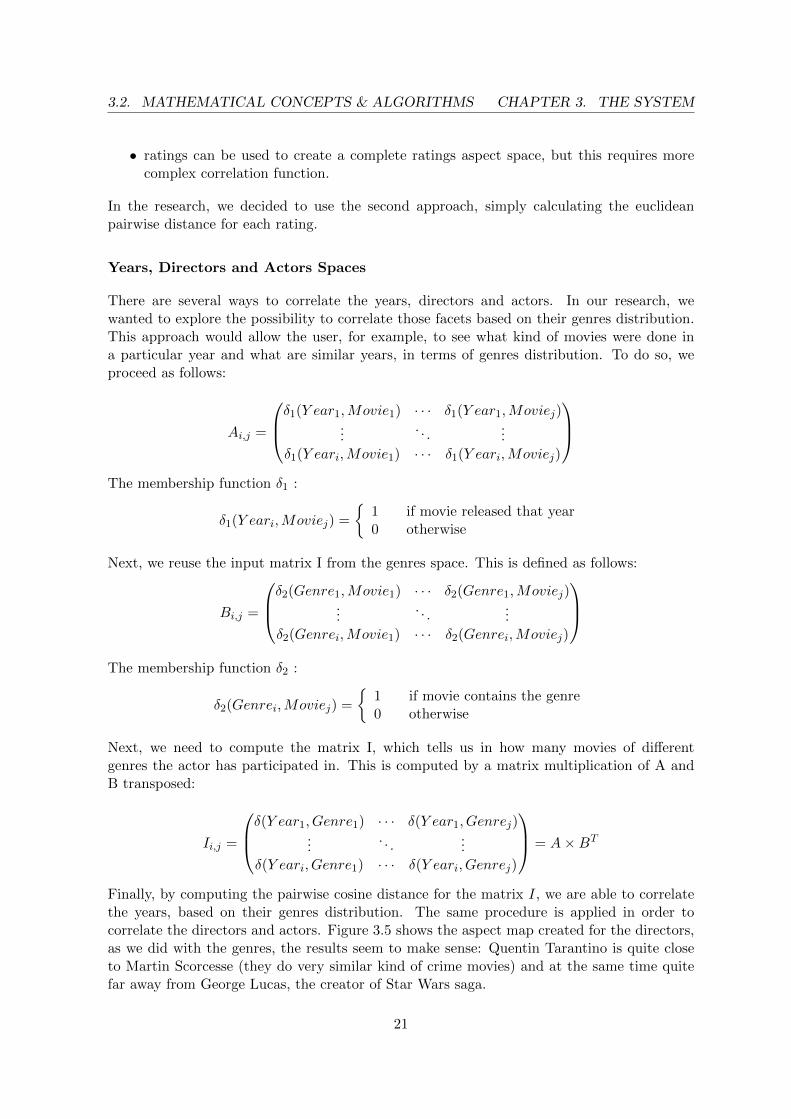
Finally, by computing the pairwise cosine distance for the matrix I, we are able to correlatethe years, based on their genres distribution. The same procedure is applied in order tocorrelate the directors and actors. Figure 3.5 shows the aspect map created for the directors,as we did with the genres, the results seem to make sense: Quentin Tarantino is quite closeto Martin Scorcesse (they do very similar kind of crime movies) and at the same time quitefar away from George Lucas, the creator of Star Wars saga.
21
3.2. MATHEMATICAL CONCEPTS & ALGORITHMS CHAPTER 3. THE SYSTEM
Figure 3.5: This figure shows the distances between directors in 2 dimensional space afterperforming a multidimensional scaling on the directors space, similar to figure 3.4
Facet Network
In order to perform the zooming and allow the system to be interactive, one needs a wayto select and sort the facets rapidly. In MultiMap, this is done by precomputing a facetnetwork (Fig. 3.6), and setting a particular rank value to each node in this kind of network.Generally speaking, we need to compute the matrix R with facets on the rows and two (ormore) “pointers” to the closest points. The desired matrix R:
Ri,3 =
Facet1 1st closest facet 2nd closest facet...
......
Faceti 1st closest facet 2nd closest facet
The closest points computation is done using the previous inter-facet correlations. Thisstep can be very time-consuming, as it has the complexity of O(n2). This would interrupta smooth interaction with the user, and therefore would be prohibitive. Fortunately thismatrix can be precomputed even before the interaction starts. In general, anything that canbe precomputed, should be precomputed to make the system responsive.
22
3.2. MATHEMATICAL CONCEPTS & ALGORITHMS CHAPTER 3. THE SYSTEM
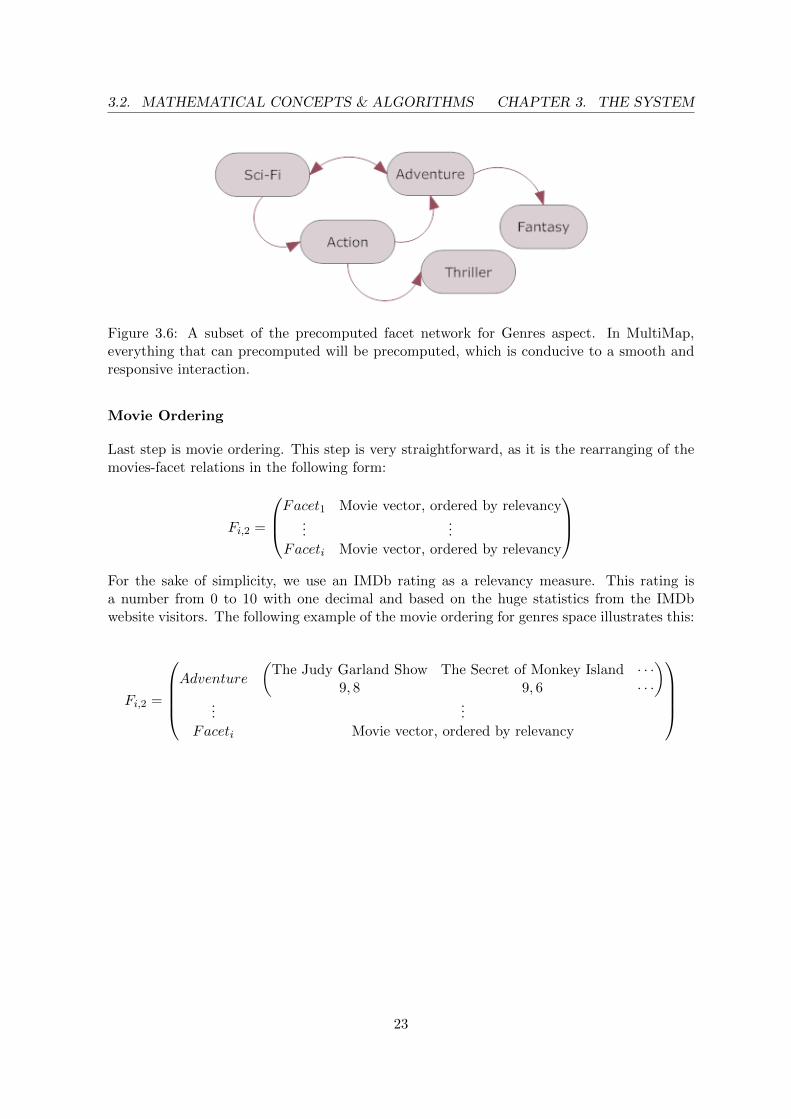
Figure 3.6: A subset of the precomputed facet network for Genres aspect. In MultiMap,everything that can precomputed will be precomputed, which is conducive to a smooth andresponsive interaction.
Movie Ordering
Last step is movie ordering. This step is very straightforward, as it is the rearranging of themovies-facet relations in the following form:
Fi,2 =
Facet1 Movie vector, ordered by relevancy...
...Faceti Movie vector, ordered by relevancy
For the sake of simplicity, we use an IMDb rating as a relevancy measure. This rating isa number from 0 to 10 with one decimal and based on the huge statistics from the IMDbwebsite visitors. The following example of the movie ordering for genres space illustrates this:
Fi,2 =
Adventure
(The Judy Garland Show The Secret of Monkey Island · · ·
9, 8 9, 6 · · ·
)...
...Faceti Movie vector, ordered by relevancy
23
3.2. MATHEMATICAL CONCEPTS & ALGORITHMS CHAPTER 3. THE SYSTEM
3.2.3 Ranking
We would like to give users the ability to zoom in on individual facets or movies based ontheir selection. This can be accomplished, by ranking each point and re-ranking them withevery zoom. For this we need a facet network (graph), ideally with a 100% coverage of thefacets and tightly interconnected. Such a network is constructed in the preprocessing step (seesection 3.2.2) in the form of graph where a node (a facet) is connected to 2 closest neighbors.For example Science-Fiction genre would be connected to Adventure genre and Action genre,as illustrated in figure 3.6.
Based on such network, a zooming can be effectively done as a recursive algorithm, withseveral parameters:
• Vector B, is a weight vector for the closest points. For example, a vector where firstclosest gets full weight, second closest gets half of the weight would be:
B = (1, 0.5)
• Depth-decay function for each node at depth d
λ(d+ 1, ρ, b) = ρ+ (γ/d) ∗ b
Where:
– d is the actual depth
– ρ is the actual rank of the node
– γ is the decay factor (a constant)
– b is the weight of the point from weight vector
The depth-decay function here presented is a linear function, but depending on the contextand needs, can be adapted or changed. The depth-decay function calculates the currentranking ρ, which updates the network. The ranking is computed recursively for each neighbor,then the network is sorted by the rank and first x nodes are shown to the user.
Additionally, zooming out can be done in several different ways: the simplest (and mostcomputationally efficient one), is to keep track of all changes to the ranking value ρ on eachstep. This approach would use some memory, but there’s no need to recalculate everything.Another approach would be to recursively recalculate ρ values backwards, but effectivelyusing CPU to do the calculation. The depth-decay function should also be updated in orderto support such feature.
24
3.2. MATHEMATICAL CONCEPTS & ALGORITHMS CHAPTER 3. THE SYSTEM
3.2.4 Facets Selection
At this point in the data-flow we have a Ranking Matrix and a simple solution would consistof performing a selection and simply selecting few first ranked facets. Such an approach isjust fine for standard search engines, for example Google, Lemur... In MultiMap, this isperformed using a selection algorithm but why do we actually need one? In order to answerthis question, let’s consider following:
• standard search engines use a query in order search the data, therefore the most relevantdocuments are the ones what are the closest to the query in this multi-dimensionaldocument space;
• in exploratory search we need an exploration factor, allowing the users to explore dif-ferent possibilities. With this, we don’t particularly want to restrict the results to onlyclosely-related and most relevant points, but also to other points, related to the topic(at some extent).
The selection algorithm allows us to pick a number of rows from an Input Matrix I. Recall thatInput Matrix I is a step just before pair-wise distance comparison, so basically it’s a ready-to-compare matrix, where getting a distance between 2 points actually means something. Theidea behind the algorithm is quite simple: it selects a subset of relevant facets, which is biggerthan the amount of facets that need to be shown to the user; it tries to find k clusters withinthe subset and then takes the closest points to each cluster centroid. The selection algorithmworks in a rather straightforward way:
• first, a selection of top ranked facets is performed. In the prototype we take twice thenumber of facets that we actually want to present to the user (i.e.: if we need to showa grid of 2 by 2 points, we take the 8 most relevant facets from the ranking matrix);
• next, the algorithm computes k-means clustering, with k clusters. Where k clusterswould be the number of points to show to the user, for example 4 actors would meank=4
• once k clusters are found, each point has an assigned index of a cluster and we also havek centroids for each cluster. The selection continues by taking 1 closest point to eachcentroid, therefore taking the most average point in the particular cluster.
• finally, it returns the selected facets.
25
3.2. MATHEMATICAL CONCEPTS & ALGORITHMS CHAPTER 3. THE SYSTEM
3.2.5 Movies Selection
The next step in the data-flow is the actual selection of the movies. By now the system is goingto present the facets it selected (the most relevant facets to the current zoom sequence). Themovies presented on the map can be selected simply by taking several first movies, based onsome rating function. We take the IMDB average rating as the value used to sort the movieswithin each facet. This was already done in the preprocessing phase (see section 3.2.2), andthe selection resumes by taking the first few movies from the facet.
For example, in the following matrix one can see that if Adventure is a selected facet, themovies ”The Judy Garland Show” and ”The Secret of Monkey Island” will be selected asthey have the highest IMDB rating within the facet.
Fi,2 =
Adventure
(The Judy Garland Show The Secret of Monkey Island · · ·
9, 8 9, 6 · · ·
)...
...Faceti Movie vector, ordered by relevancy
Now the selection of facets and movies are done, we can actually proceed to the creation ofthe Aspect Maps.
26
3.2. MATHEMATICAL CONCEPTS & ALGORITHMS CHAPTER 3. THE SYSTEM
3.2.6 Creation of Aspect Maps
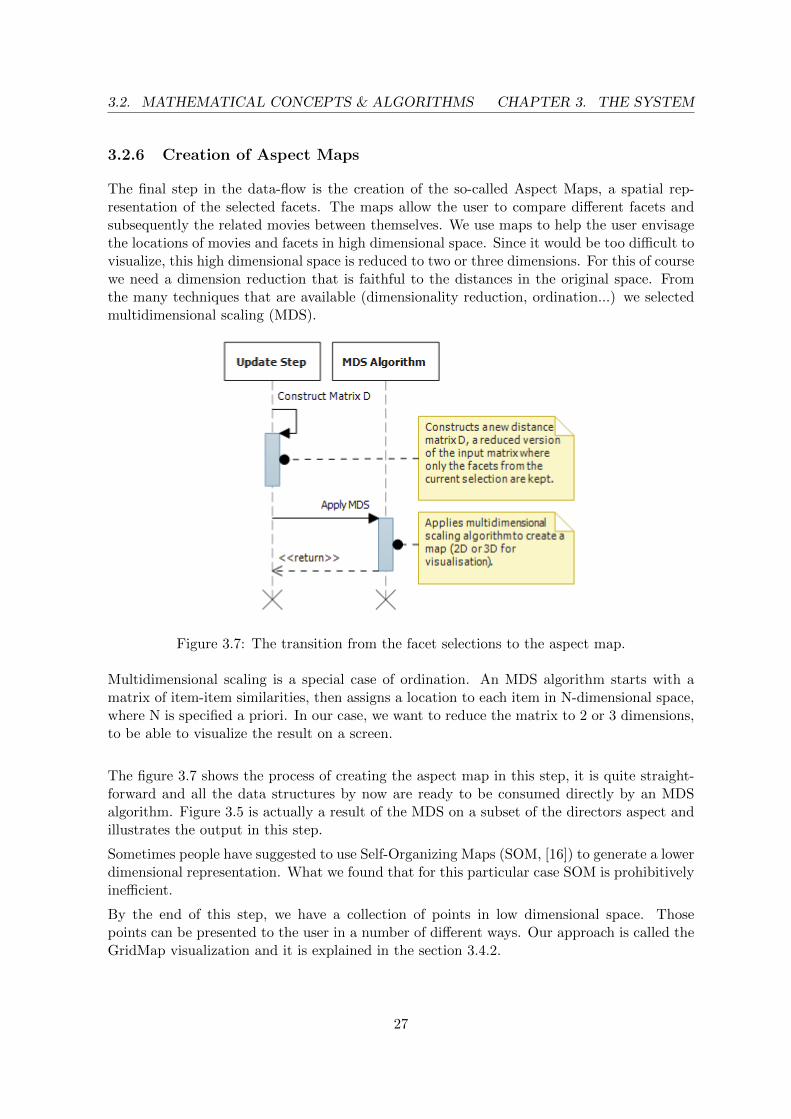
The final step in the data-flow is the creation of the so-called Aspect Maps, a spatial rep-resentation of the selected facets. The maps allow the user to compare different facets andsubsequently the related movies between themselves. We use maps to help the user envisagethe locations of movies and facets in high dimensional space. Since it would be too difficult tovisualize, this high dimensional space is reduced to two or three dimensions. For this of coursewe need a dimension reduction that is faithful to the distances in the original space. Fromthe many techniques that are available (dimensionality reduction, ordination...) we selectedmultidimensional scaling (MDS).
Figure 3.7: The transition from the facet selections to the aspect map.
Multidimensional scaling is a special case of ordination. An MDS algorithm starts with amatrix of item-item similarities, then assigns a location to each item in N-dimensional space,where N is specified a priori. In our case, we want to reduce the matrix to 2 or 3 dimensions,to be able to visualize the result on a screen.
The figure 3.7 shows the process of creating the aspect map in this step, it is quite straight-forward and all the data structures by now are ready to be consumed directly by an MDSalgorithm. Figure 3.5 is actually a result of the MDS on a subset of the directors aspect andillustrates the output in this step.
Sometimes people have suggested to use Self-Organizing Maps (SOM, [16]) to generate a lowerdimensional representation. What we found that for this particular case SOM is prohibitivelyinefficient.
By the end of this step, we have a collection of points in low dimensional space. Thosepoints can be presented to the user in a number of different ways. Our approach is called theGridMap visualization and it is explained in the section 3.4.2.
27
3.3. SERVER TECHNOLOGY CHAPTER 3. THE SYSTEM
3.3 Server Technology
From the beginning of the research, we wanted the system to be highly interactive and re-sponsive. In order achieve this we need a scalable system with high performance. For this,we determined the following requirements:
• the data has to be sent very efficiently, potentially about 5-10 Kilobyte of text data oneach user request;
• the ability to notify user of events happening on the server;
• real-time communication for the interaction, for instance, when user clicks on something,the system have to process the request in less than a second (or else, people simply won’tuse it).
Given the above requirements, the system should be based on an event-driven architecture(EDA) with compression and security. For completeness, here is the list of most distinctivefeatures of the server (some readers may find it a bit technical):
• Monolithic server, running on one machine, but potentially scalable to a cluster ofmachines.
• Manages the thread pool and distributes the work to each thread. It would try to matchthe number of threads to cores (i.e.: 4 threads on a Quad Core machine) and distributesmaller tasks to those threads.
• Big tasks are represented in a form of software timers, which are sliced in order toachieve scalability.
• The server manages a socket pool, listening to several endpoints. Works with IPv4 andIPv6 as well.
• Written in C#, the server is compatible with 32 and 64 bit platforms. It is also CLI-compliant and works on cross-platform frameworks like Mono (works on Unix, Linux...).
• Handles client-socket lifetime, in order to achieve stability and error-tolerance.
• Integrates Matlab interoperability layer, allowing the C# to communicate with Matlaband then send the results to the Flash client via network.
• Handles the data via an object-relational mapping (ORM) layer.
• Publish-Subscribe model is used for the real-time notifications. It allows clients tosubscribe to an event of the server and be notified by the server when the event happens.This notification happens via a push-operation.
• Custom message serialization/deserialization.
• Per-packet compression/decompression.
28

3.3. SERVER TECHNOLOGY CHAPTER 3. THE SYSTEM
• Through introspection, the server generates a networking libraries, compliant to a pro-tocol interface. Appendix A provides more information on this feature and illustratessome of the security and compression mechanisms.
• Accounting, sessions mechanisms in order to keep track of users and their accounts andconnections.
• Access-Level security mechanism.
All these features were actually implemented by ourselves, since at the time of our researchnot all of the technology was available to us.
29
3.4. THE CLIENT FRONT-END CHAPTER 3. THE SYSTEM
3.4 The Client Front-End
3.4.1 Overview
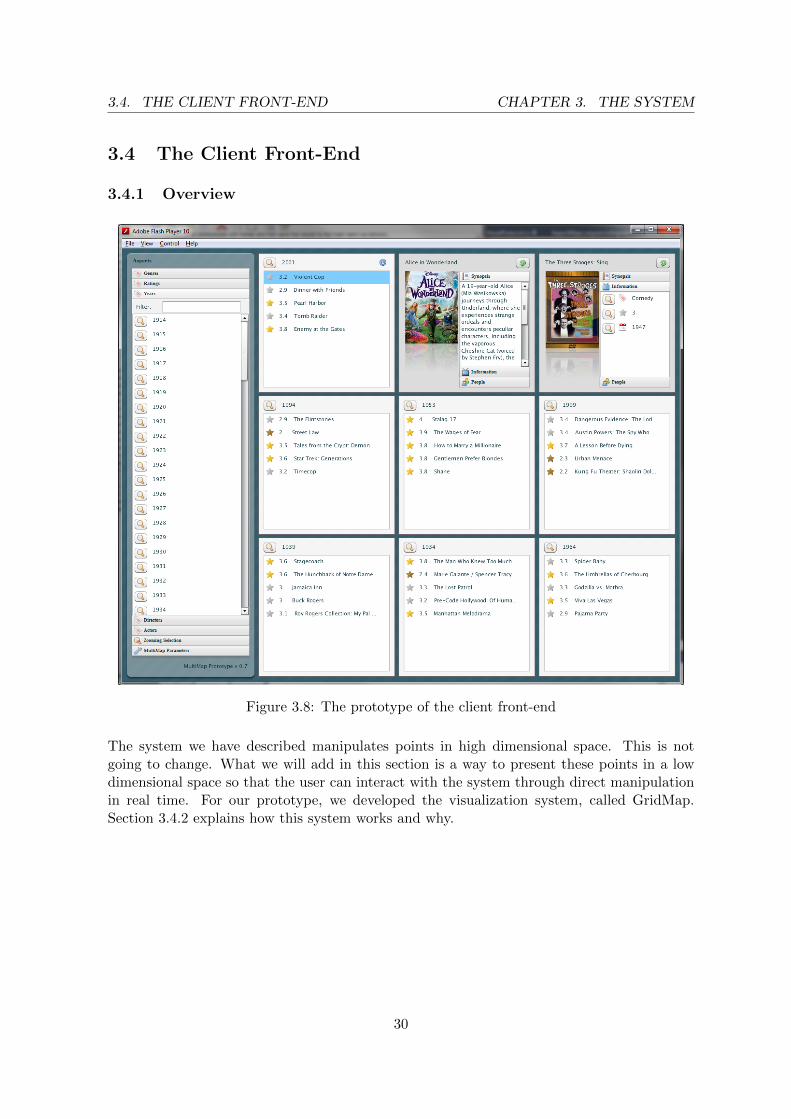
Figure 3.8: The prototype of the client front-end
The system we have described manipulates points in high dimensional space. This is notgoing to change. What we will add in this section is a way to present these points in a lowdimensional space so that the user can interact with the system through direct manipulationin real time. For our prototype, we developed the visualization system, called GridMap.Section 3.4.2 explains how this system works and why.
30
3.4. THE CLIENT FRONT-END CHAPTER 3. THE SYSTEM
3.4.2 GridMap
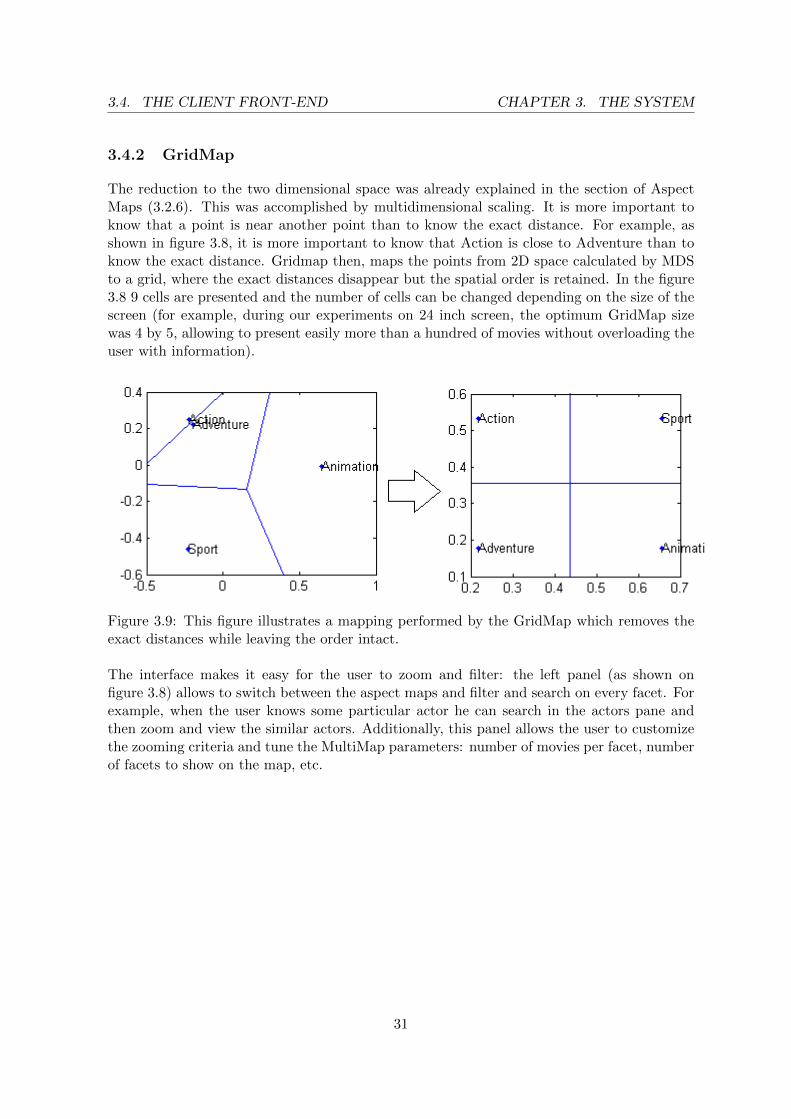
The reduction to the two dimensional space was already explained in the section of AspectMaps (3.2.6). This was accomplished by multidimensional scaling. It is more important toknow that a point is near another point than to know the exact distance. For example, asshown in figure 3.8, it is more important to know that Action is close to Adventure than toknow the exact distance. Gridmap then, maps the points from 2D space calculated by MDSto a grid, where the exact distances disappear but the spatial order is retained. In the figure3.8 9 cells are presented and the number of cells can be changed depending on the size of thescreen (for example, during our experiments on 24 inch screen, the optimum GridMap sizewas 4 by 5, allowing to present easily more than a hundred of movies without overloading theuser with information).
Figure 3.9: This figure illustrates a mapping performed by the GridMap which removes theexact distances while leaving the order intact.
The interface makes it easy for the user to zoom and filter: the left panel (as shown onfigure 3.8) allows to switch between the aspect maps and filter and search on every facet. Forexample, when the user knows some particular actor he can search in the actors pane andthen zoom and view the similar actors. Additionally, this panel allows the user to customizethe zooming criteria and tune the MultiMap parameters: number of movies per facet, numberof facets to show on the map, etc.
31
3.4. THE CLIENT FRONT-END CHAPTER 3. THE SYSTEM
Transitions
It often happens that a person viewing a scene fails to see large changes in the scene. Thisis called change blindness, a well-known psychological phenomenon [20]: if the change in thescene coincides with some visual disruption such as a saccade (very small eye movements) orwhen the scene is briefly obscured. This situation often occurs in web applications, wherethe web page briefly flashes after actions demanding a new server request. In this context,animated transitions help the user see the changes in the scene [13] [21].
The transitions turned out to be quite important, providing visual feedback to the user so heknow what’s going on. In the GridMap, there are two kinds of crucial transitions:
• The transition that animates the facet pane, keeping it visible during the zooming onthis pane, then moving it to a new position. This greatly helps to the user to keep trackof the item he is zooming on to. This is needed, since on each zooming the coordinatesystem changes according to the zoom and can be quite confusing to the person whouses the interface.
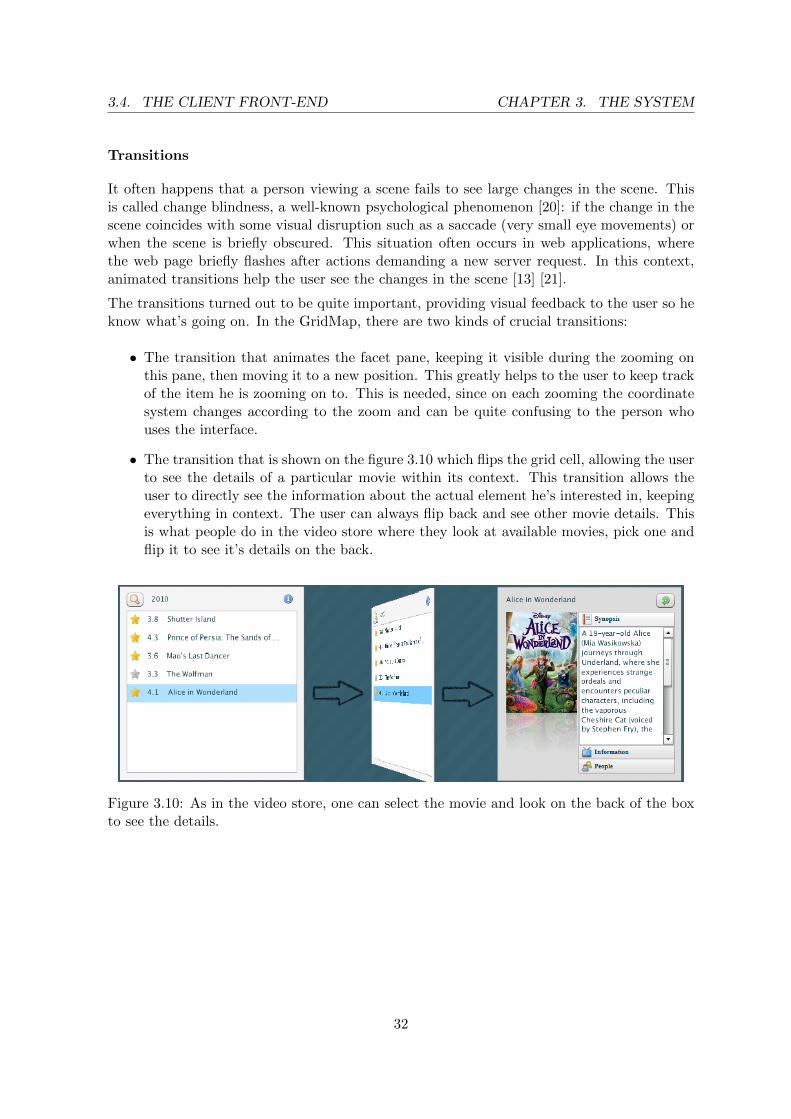
• The transition that is shown on the figure 3.10 which flips the grid cell, allowing the userto see the details of a particular movie within its context. This transition allows theuser to directly see the information about the actual element he’s interested in, keepingeverything in context. The user can always flip back and see other movie details. Thisis what people do in the video store where they look at available movies, pick one andflip it to see it’s details on the back.
Figure 3.10: As in the video store, one can select the movie and look on the back of the boxto see the details.
32
3.4. THE CLIENT FRONT-END CHAPTER 3. THE SYSTEM
Cell Representation
The cell representation allows the flipping feature, illustrated in figure 3.10. Based on thefeedback of users, this feature proved to be very attractive and motivated them to experimentfurther with the interface. Additionally, this allows to present movie details while keepingthe other facets visible.
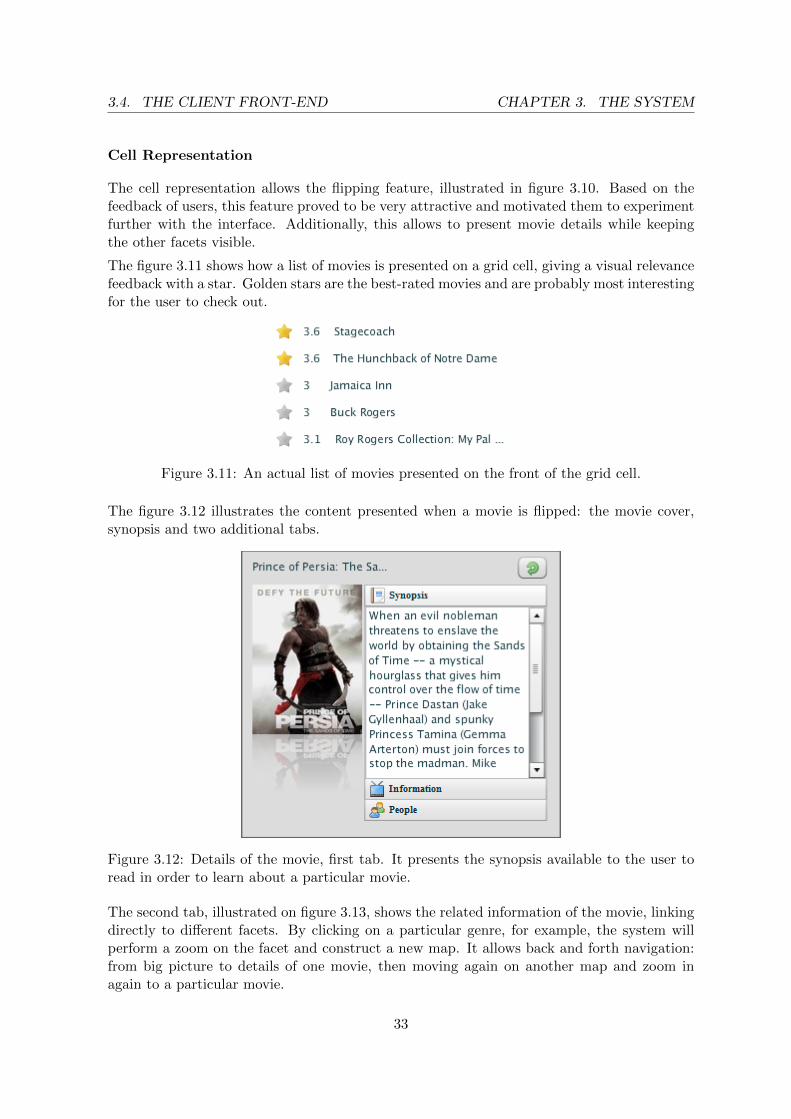
The figure 3.11 shows how a list of movies is presented on a grid cell, giving a visual relevancefeedback with a star. Golden stars are the best-rated movies and are probably most interestingfor the user to check out.
Figure 3.11: An actual list of movies presented on the front of the grid cell.
The figure 3.12 illustrates the content presented when a movie is flipped: the movie cover,synopsis and two additional tabs.
Figure 3.12: Details of the movie, first tab. It presents the synopsis available to the user toread in order to learn about a particular movie.
The second tab, illustrated on figure 3.13, shows the related information of the movie, linkingdirectly to different facets. By clicking on a particular genre, for example, the system willperform a zoom on the facet and construct a new map. It allows back and forth navigation:from big picture to details of one movie, then moving again on another map and zoom inagain to a particular movie.
33
3.4. THE CLIENT FRONT-END CHAPTER 3. THE SYSTEM
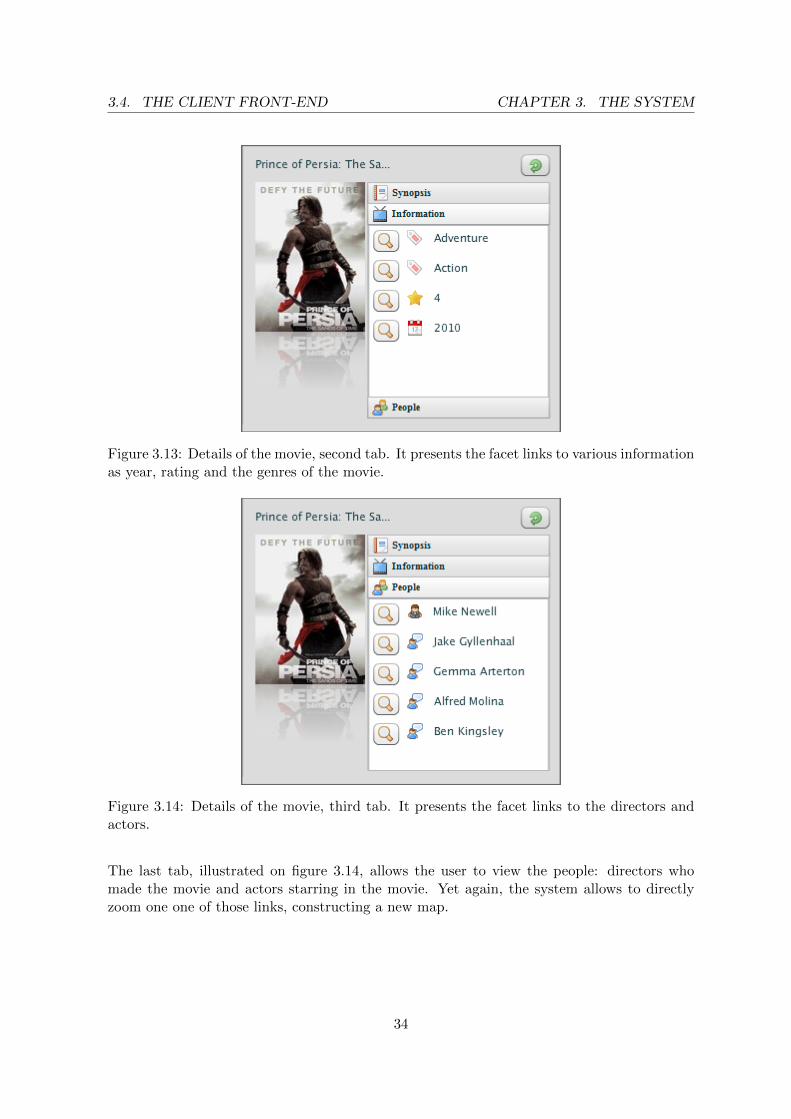
Figure 3.13: Details of the movie, second tab. It presents the facet links to various informationas year, rating and the genres of the movie.
Figure 3.14: Details of the movie, third tab. It presents the facet links to the directors andactors.
The last tab, illustrated on figure 3.14, allows the user to view the people: directors whomade the movie and actors starring in the movie. Yet again, the system allows to directlyzoom one one of those links, constructing a new map.
34
Chapter 4
Usability Aspects
The main purpose of the work was to build a responsive system for a particular Rich InternetApplication, in the area of exploratory search. Of course, such a system only makes senseif users can actually use it. So we did a, admittedly limited and informal, evaluation of itsusability.
To do so, I asked ten people, acquaintances and friends age 20-30 years old, half of each gender,to participate in a survey about my thesis work. The were explained what exploratory searchwas in general, without reference to the movie database. Next, they were asked to work withthe system for about half an hour, and find movies of their liking. After working with thesystem they were asked to fill out a questionnaire with 25 questions. The questions are shownbelow and were about Usefulness, Ease of Use, Ease of Learning, and Satisfaction with thesystem.
The questionnaires were constructed as seven-point Likert rating scales. Users were asked torate agreement with the statements, raging from strongly disagree to strongly agree [17].
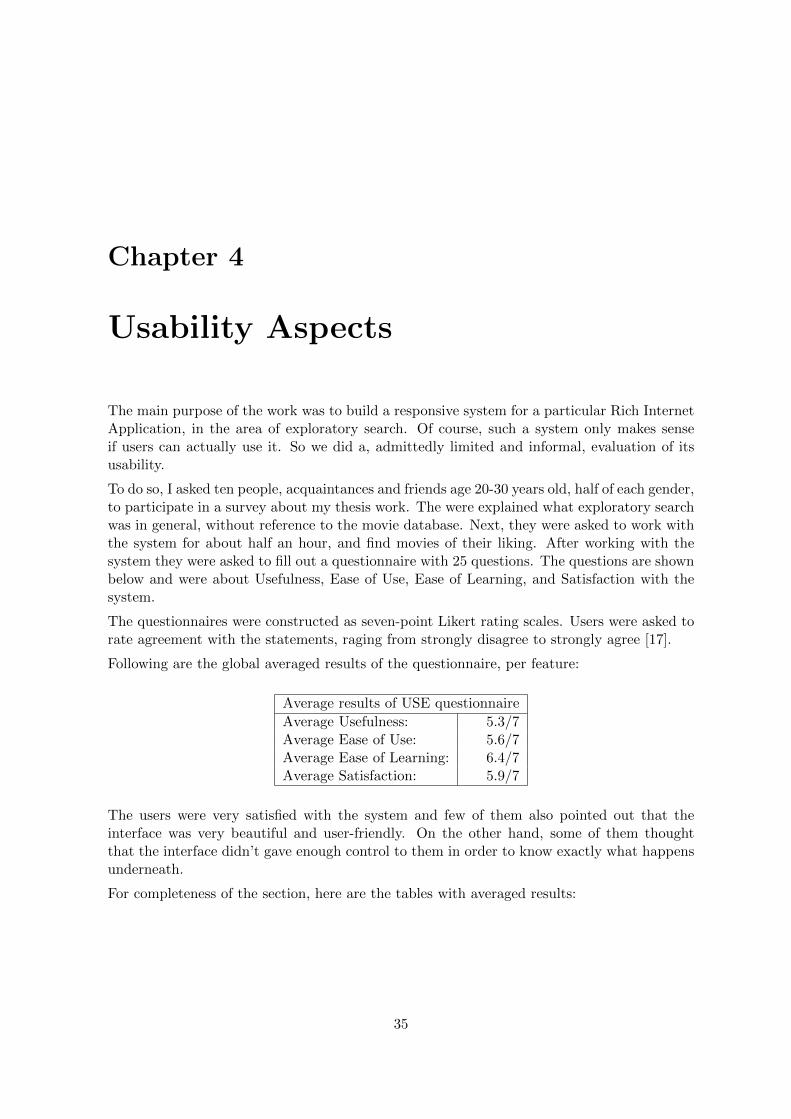
Following are the global averaged results of the questionnaire, per feature:
Average results of USE questionnaire
Average Usefulness: 5.3/7Average Ease of Use: 5.6/7Average Ease of Learning: 6.4/7Average Satisfaction: 5.9/7
The users were very satisfied with the system and few of them also pointed out that theinterface was very beautiful and user-friendly. On the other hand, some of them thoughtthat the interface didn’t gave enough control to them in order to know exactly what happensunderneath.
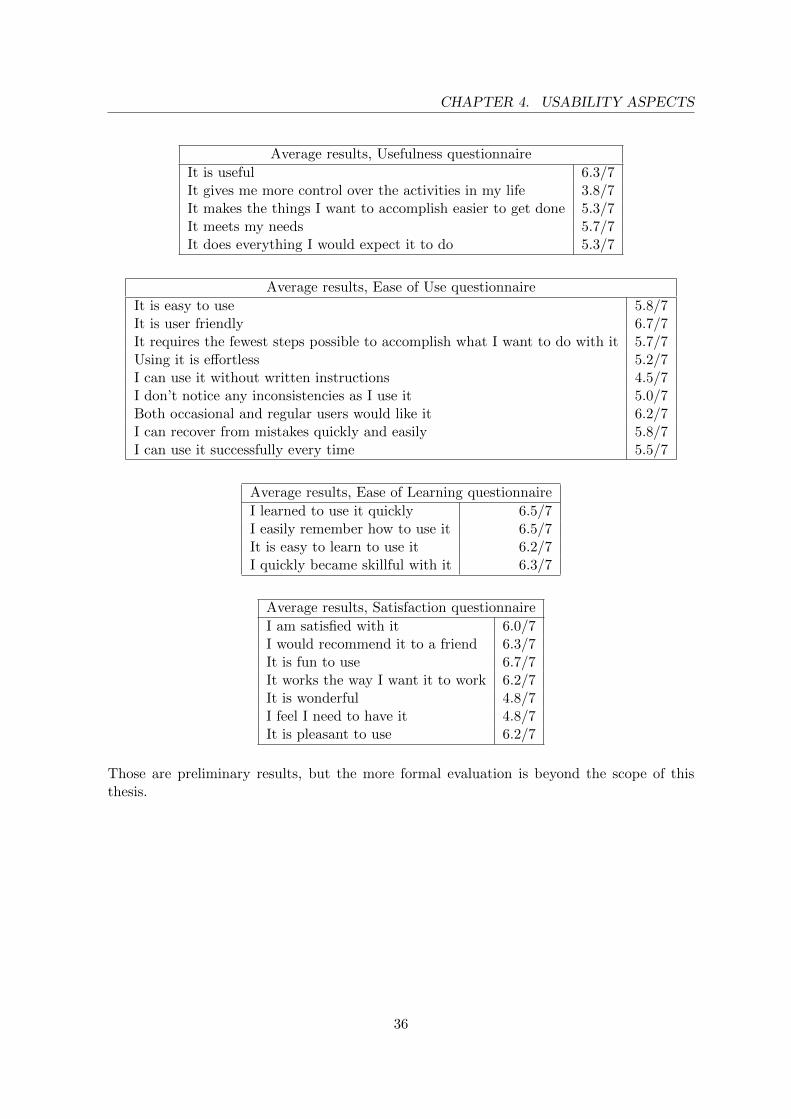
For completeness of the section, here are the tables with averaged results:
35
CHAPTER 4. USABILITY ASPECTS
Average results, Usefulness questionnaire
It is useful 6.3/7It gives me more control over the activities in my life 3.8/7It makes the things I want to accomplish easier to get done 5.3/7It meets my needs 5.7/7It does everything I would expect it to do 5.3/7
Average results, Ease of Use questionnaire
It is easy to use 5.8/7It is user friendly 6.7/7It requires the fewest steps possible to accomplish what I want to do with it 5.7/7Using it is effortless 5.2/7I can use it without written instructions 4.5/7I don’t notice any inconsistencies as I use it 5.0/7Both occasional and regular users would like it 6.2/7I can recover from mistakes quickly and easily 5.8/7I can use it successfully every time 5.5/7
Average results, Ease of Learning questionnaire
I learned to use it quickly 6.5/7I easily remember how to use it 6.5/7It is easy to learn to use it 6.2/7I quickly became skillful with it 6.3/7
Average results, Satisfaction questionnaire
I am satisfied with it 6.0/7I would recommend it to a friend 6.3/7It is fun to use 6.7/7It works the way I want it to work 6.2/7It is wonderful 4.8/7I feel I need to have it 4.8/7It is pleasant to use 6.2/7
Those are preliminary results, but the more formal evaluation is beyond the scope of thisthesis.
36
Chapter 5
Conclusions
This thesis described a form of exploratory search where responsiveness was of the essence.The application we called ‘MultiMap’ can be categorized under the heading of so-called RichInternet Applications, a class of applications that is becoming more and more important asdata bases become larger, more specialized, and more distributed. Because of this, users moreand more often get into a situation where they know there must be information available toanswer their questions, nor are the means to formulate a precise query.
The resources they need to answer such a query may be available on remote servers, henceto quickly explore possible answers, the servers much be made responsive enough or else theuser will quickly give up. MultiMap was built with such users in mind. Every design decisionin this thesis was under the constraint of responsiveness.
This led to the following requirements:
• The system should be responsive, scalable, and interactive.
• The system should support exploratory search.
• The system should provide real-time spatial visual feedback reflecting changes in thehigh-dimensional search space.
Exploratory search is the problem to find information that we may not know how to formulate,but which we will recognize once we see it. There are three bottlenecks that could makeour system unresponsive: (1) complex calculations, (2) slow zooming, and (3) ineffectivevisualization . The way we solved these bottlenecks are the following:
1. Every computation that can be done in advance will be done in advance, so that itcannot cause any delay.
2. Zooming and map generation are highly optimized and can be done in real-time.
3. The visualization is presented to the user in a cognitively appropriate way.
We believe that such a system should be constructed in a modular fashion and in this thesiswe presented a way to do so. This modularity allows, for example, to change the ranking or
37
CHAPTER 5. CONCLUSIONS
enhance the selection algorithms and be able to evaluate the new algorithm performance basedon the existing one. It also allows to build various user-interfaces on top of the search engineand eventually audience-targeted user interfaces. During the research we discussed severaldifferent possible front ends, including different 2-dimensional representations enhanced withcolors, sounds, font sizes. Also, 3-dimensional interfaces can be built and are very interestingdirections to explore. We considered implementing 3-dimensional sphere navigation wherethe zooming could allow to create 2D map or a new 3D sphere, but we leave that for futurework.
The third question (about usability) was answered by evaluation and feedback we got fromusers. The users were very satisfied with both MultiMap and GridMap, but also felt thatthey had not enough control over the system. They quickly learned how to use the systemand how to get movie suggestions. However, here was a need to explain and introduce themto the concept at first, as it is a different approach to information exploration.
After having designed and evaluated the system, we believe that the map generation techniquepresented in this thesis is an important direction to go and an effective way to performexploratory search.
38
Bibliography
[1] International movie database, http://www.imdb.com, December 2009.
[2] Rfc 2616: Hypertext transfer protocol – http/1.1, http://tools.ietf.org/html/rfc2616,June 1999.
[3] Http wikipedia, http : //en.wikipedia.org/wiki/hypertexttransferprotocol, June 2010.
[4] G. Adomavicius and A. Tuzhilin. Toward the next generation of recommender systems: asurvey of the state-of-the-art and possible extensions. IEEE Transactions on Knowledgeand Data Engineering, 17:734-749, 6 2005.
[5] G. Armitage. Quality of service in ip networks: Foundations for a multi-service internet.Macmillan Technical Publishing, 4 2000.
[6] G. Armitage, M. Claypool, and P. Branch. Networking and Online Games: Understand-ing and Engineering Multiplayer Internet Games. John Wiley and Sons Ltd., 2006.
[7] R.M. Bell, J. Bennett, Y. Koren, and C. Volinsky. The million dollars programmingprize. IEEE Spectrum, 5 2009.
[8] S. Caltagirone, M. Keys, B. Schlief, and M. J. Willshire. Architecture for a massivelymultiplayer online role playing game engine. Journal of Computing Sciences in Colleges,Volume 18, Issue 2, 12 2002.
[9] Piero Fraternali, Gustavo Rossi, and Fernando S andnchez Figueroa. Rich internet ap-plications. Internet Computing, IEEE, 14(3):9 –12, may-june 2010.
[10] J. Gregory. Game Engine Architecture. A K Peters, 2009.
[11] M. A. Hearst. Next generation web search: Setting our sites. IEEE Data EngineeringBuletin 23, 3, 38-48, 3 2000.
[12] M. A. Hearst. Design recommendations for hierarchical faceted search interfaces. SIGIR,Workshop on Faceted Search, pages 2630, August 2006. pages 2630, August 2006, 2006.
[13] J. Heer and G. Robertson. Animated transitions in statistical data graphics. IEEETransactions on Visualization and Computer Graphics, 6 2007.
[14] J. F. Kurose and K. W. Ross. Computer Networking A Top-Down Approach. PearsonEducation Inc., 2008.
39
BIBLIOGRAPHY BIBLIOGRAPHY
[15] X. Lin. Map displays for information retrieval. Journal of the Americal Society forInformation Science, 1 1997.
[16] X. Lin, D. Soergel, and G. Marchionini. A self-organizing semantic map for informa-tion retrieval. Proceedings of the 14th annual international ACM SIGIR conference onResearch and development in information retrieval. 262 - 269, 1991.
[17] A.M. Lund. Measuring usability with the use questionnaire. STC Usability SIG Newslet-ter, 8:2, 8 2001.
[18] J. Makar. ActionScript for Multiplayer Games and Virtual Worlds. New Riders, 2010.
[19] G. Marchionini. Exploratory search: From finding to understanding. Communicationsof the ACM 49, 4 2006.
[20] J. ORegan, R. Rensink, and J. Clark. To see or not to see: The need for attention toperceive changes in scenes. Psychological Science, 8 1997.
[21] G. M. Sacco and Y. Tzitzikas. Dynamic Taxonomies and Faceted Search: Theory, Prac-tice, and Experience. Springer Science and Business Media Inc., 2009.
[22] J. Smed and H. Hakonen. Algorithms and Networking for Computer Games. John Wileyand Sons Ltd, 2006.
[23] M. Steyvers. Multidimensional Scaling. In: Encyclopedia of Cognitive Science. MacmillanReference Ltd., 2002.
[24] D. Svanaes. Understanding Interactivity: Steps to a Phenomenology of Human-ComputerInteraction. PhD Thesis. NTNU, Trondheim, Norway, 2000.
[25] A. G Taylor. Introduction to Cataloging and Classification. 8th ed. Englewood, Colorado.Libraries Unlimited, 1992.
[26] B.C Vickery. Faceted classification: a guide to construction and use of special schemes.London: Aslib, 1960.
[27] R.W. White, B. Kules, S.M. Drucker, and M.C. Schraefel. Supporting exploratory search.Communications of the ACM, 49, 4 2006.
40
Appendix A
Protocol Generation DSL
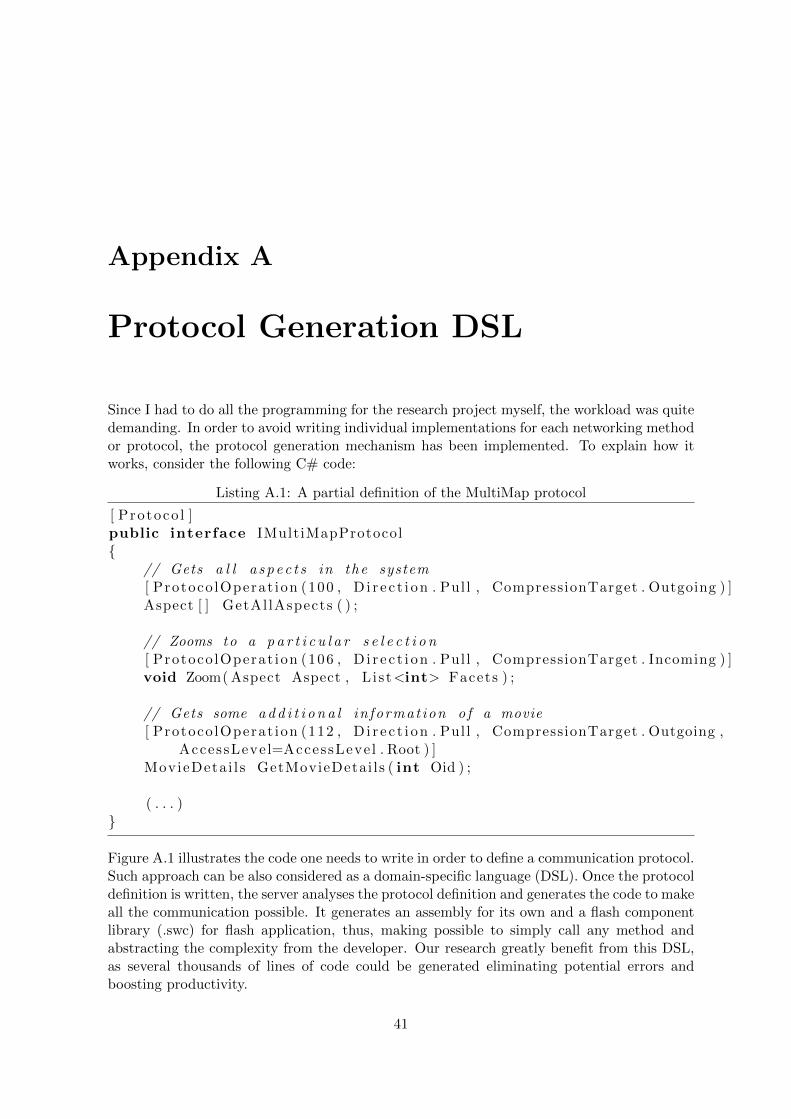
Since I had to do all the programming for the research project myself, the workload was quitedemanding. In order to avoid writing individual implementations for each networking methodor protocol, the protocol generation mechanism has been implemented. To explain how itworks, consider the following C# code:
Listing A.1: A partial definition of the MultiMap protocol
[ Protoco l ]public interface IMultiMapProtocol{
// Gets a l l a s p e c t s in the system[ Protoco lOperat ion (100 , D i r e c t i on . Pull , CompressionTarget . Outgoing ) ]Aspect [ ] GetAl lAspects ( ) ;
// Zooms to a p a r t i c u l a r s e l e c t i o n[ Protoco lOperat ion (106 , D i r e c t i on . Pull , CompressionTarget . Incoming ) ]void Zoom( Aspect Aspect , L i s t<int> Facets ) ;
// Gets some a d d i t i o n a l in format ion o f a movie[ Protoco lOperat ion (112 , D i r e c t i on . Pull , CompressionTarget . Outgoing ,
AccessLeve l=AccessLeve l . Root ) ]MovieDeta i l s GetMovieDetai ls ( int Oid ) ;
( . . . )}
Figure A.1 illustrates the code one needs to write in order to define a communication protocol.Such approach can be also considered as a domain-specific language (DSL). Once the protocoldefinition is written, the server analyses the protocol definition and generates the code to makeall the communication possible. It generates an assembly for its own and a flash componentlibrary (.swc) for flash application, thus, making possible to simply call any method andabstracting the complexity from the developer. Our research greatly benefit from this DSL,as several thousands of lines of code could be generated eliminating potential errors andboosting productivity.
41

APPENDIX A. PROTOCOL GENERATION DSL
Using the protocol definition it is also possible to define the compression direction (None,Incoming, Outgoing or Both), which will generate the subsequent function calls during thepacket compilation/read. It is also possible to define the security level per operation, usingAccessLevel parameter (shown in figure A.1).
42


![User profile correlation-based similarity (UPCSim) algorithm ......collaborative ltering similarity [29], the Triangle Multiplying Jaccard (TMJ) similarity [30], and the similarity](https://img.pdfslide.net/doc/110x75/6147013af4263007b1358a2c/user-profile-correlation-based-similarity-upcsim-algorithm-collaborative.jpg)