Embed Size (px)
Citation preview
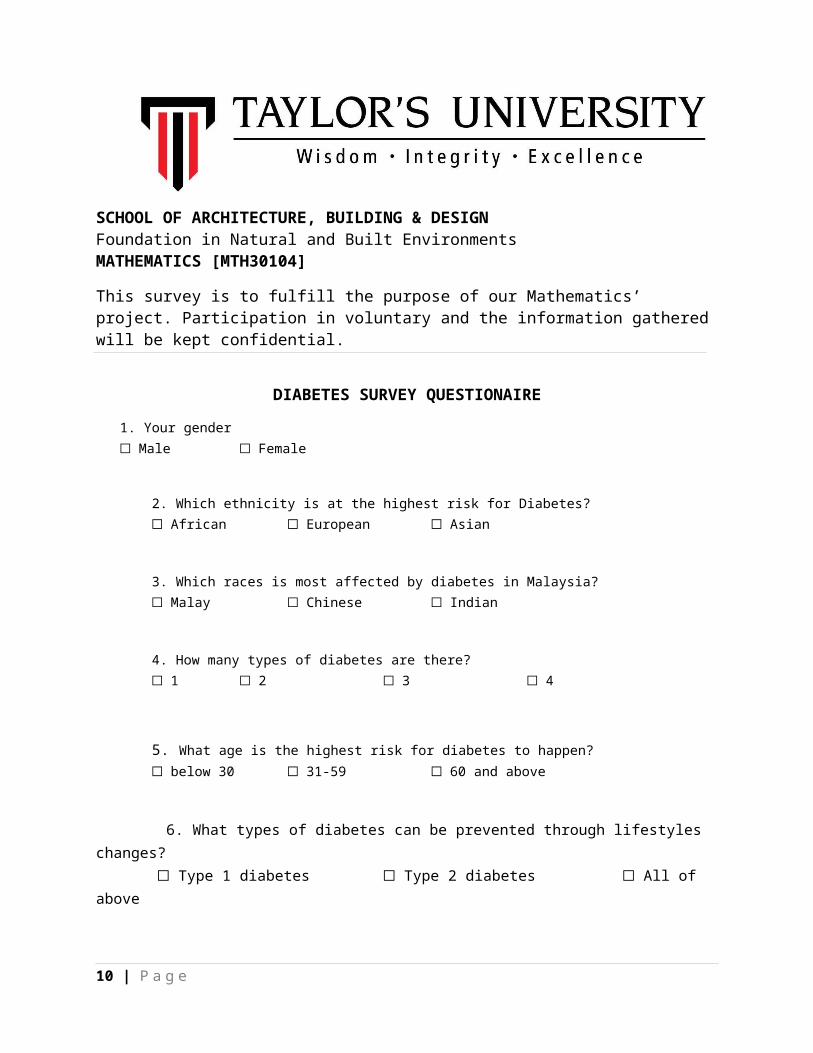
SCHOOL OF ARCHITECTURE, BUILDING & DESIGN
Foundation in Natural and Built Environment
NAME OF MODULE: MATHEMATICS [MTH10304]
PROJECT: STATISTICS
LECTURER: MS.ANN SEE PENG
SUBMISSION DATE: 1ST JUNE 2015
GROUP MEMBERS / ID NO. : CHAU XET NEE [0320222]
AMANDA CHIONG PEI SHAN [0320328]
LEE KAILY [0320273]
CHONG KIT YEE [0319748]
LEE SHZE HWA [0320053]
FOO ZHI FUNG [0320226]
1 | P a g e
TABLE OF CONTENT
CONTENT PAGE
A INTRODUCTION 3-4
B OBJECTIVE 5
C METHODOLOGY 6-8
D SURVEY FORM 9-11
E ANALYSIS 12-29
F CONCLUSION 30-31
INTRODUCTION
Statistics is a type of mathematical science that study of how to collect, organize, analyze, interpret and present the numerical information from the data given for drawing inferences on the basis of their probability. The statisticians are able to make the predictions based on the understanding of
2 | P a g e
the process based on the statistical analysis. In other words, we can say that the statistical techniques assist in the decision making and this statistical method can be applied broadly in the variety of scientific, social and business careers in such areas like astronomy, biology, education, economics, engineering, genetics, marketing, medicine, psychology, public health, sports and also among many other fields. Without the techniques of statistics, many economic, social, political and military decisions cannot be done.
This assignment is designed to provide students with a hands-on experience on how to conduct a survey, to organize and present the data. Thus, by assuming that Kementerian Kesihatan Malaysia (Malaysian Health Ministry) engaged us to conduct a survey on the common chronic diseases in Malaysia such as stroke, high blood pressure, diabetes and others, we are divided into a group consisted of 6 members to carry out this survey and prepare a statistical analysis report for the facts and information collected. This survey emphasizes on the comparing of different gender of students in Taylor’s University on the understanding about the common chronic diseases in Malaysia. For this assignment, we had chosen diabetes as our focal point and prepare the questionnaire to collect the numerical data for further analysis.
Diabetes is one of the commonest overall diseases amongst all races in Malaysia. According to the online research report, WHO(World Health Organization), diabetes or more commonly known as ‘kencingmanis’ has been listed in the top tenth killer diseases in Malaysia. Diabetes has been ranked in the seventh place in the ranking list with a total death amounting to 3,205. Diabetes is a kind of diseases that happened when our body is unable to use and store glucose properly. Most of the food that we consume is turn into glucose or sugar for our bodies to use for growth and energy. The pancreas, which is an organ of our body that is near to the stomach function to secrete hormone called insulin to digest the glucose and remove it from blood into the cells of our bodies. Diabetes are caused by inadequate of insulin or your body can’t function with its own insulin as well as it should. This will lead to the accumulation of sugars in the blood, which causes higher blood glucose level than normal blood sugar level. Diabetes can cause
3 | P a g e
serious health complications including heart disease, blindness, kidney failure and lower-extremity amputations.
Through this survey, we are able to compare the facts with the understanding level of female and male students in Taylor’s University on the common chronic diseases in Malaysia. We also learned to organize statistical data and apply the knowledge of analyzing statistical data and draw conclusion from the data analyzed. We also get better understanding of this principle and learned to apply fundamental mathematical principles and statistical method in this assignment.
Objective
The objective of this assignment is to test which gender understand more about the disease of diabetes in Taylor’s University. We choose to survey on diabetes mellitus because this disease is one of the most common diseases in Malaysia. In order to get the result of this assignment, we had to prepare a survey questionnaire for 131 male and 169 female students. We had included the types, causes, symptoms and also complications of diabetes in the survey questionnaire. From the responded survey, we had to analyze the statistical data and conclude the result by applying the statistic knowledge. Besides, we also need to transfer the survey data into a survey report and create one A2 sized printed infographic poster. Through this
4 | P a g e
assignment, we get to identify the understanding level of both genders in Taylor’s University and get a conclusion about which gender understand more about diabetes. Other than that, we also gain the knowledge of diabetes when we prepare the survey questions. Throughout this survey, we hope it will create awareness among people towards diabetes and learn to prevent from getting diabetes by maintains a balance diet and healthy lifestyles.
METHODOLOGY
Since we were targeting 150 male and 150 female students in Taylor’s Lakeside University Campus, we decided to separate into two teams. One team is responsible to survey male students while another team is responsible to survey female students. We had spent 3 days of surveying from 11th May 2015 to 13th May 2015 to do our survey. We go through all around Taylor’s Lakeside University Campus for the survey. Most of the
5 | P a g e
respondents were willing to spend their time and help us to fill in the survey questionnaire.
Surveying a male and female respondent in Block C “E-quarium”
Surveying female respondent in library and X space.
6 | P a g e
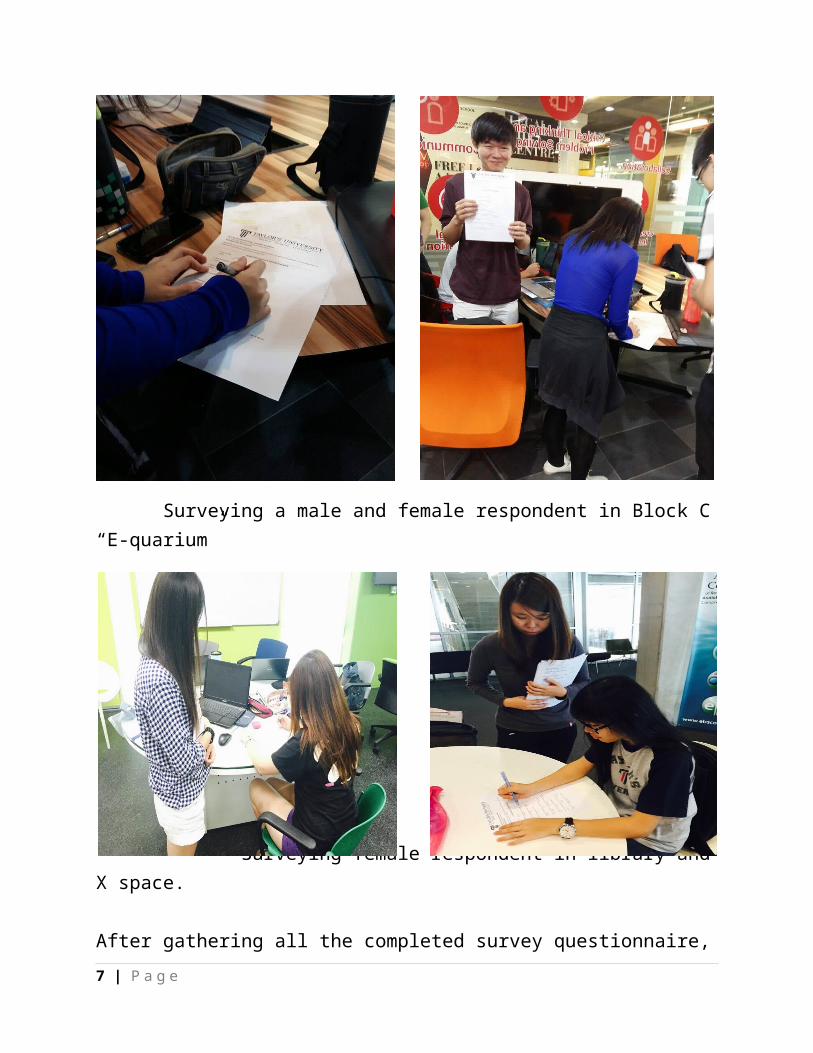
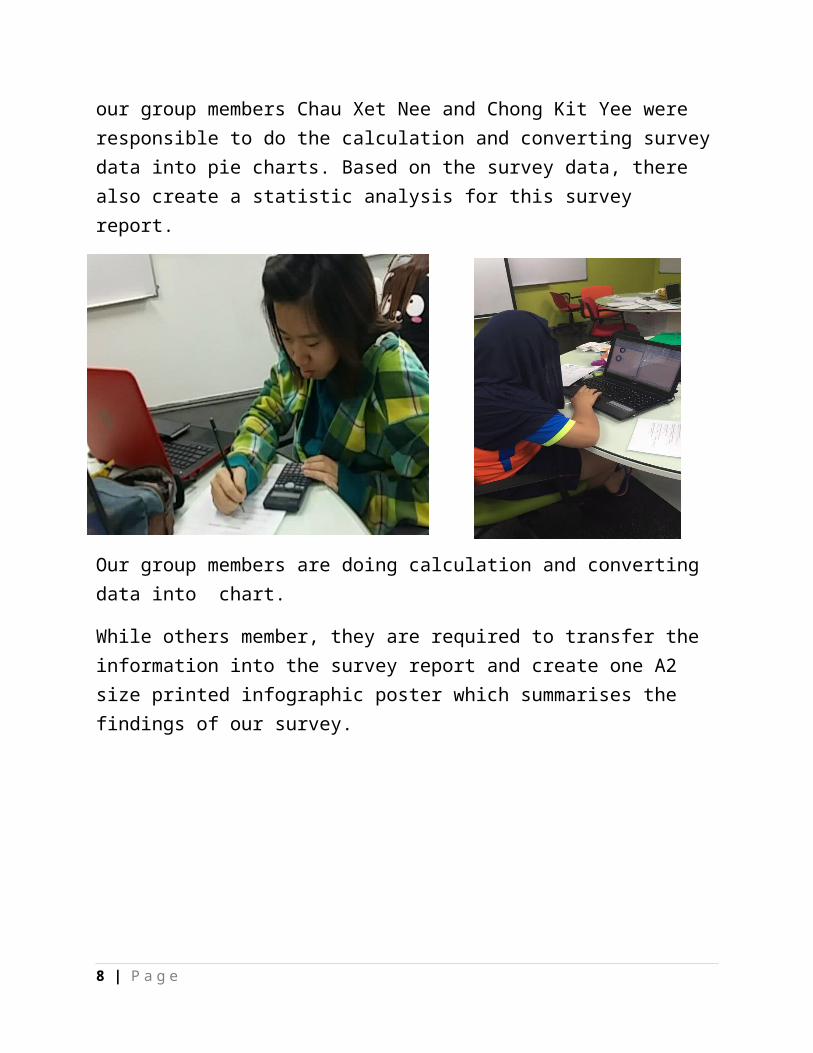
After gathering all the completed survey questionnaire, our group members Chau Xet Nee and Chong Kit Yee were responsible to do the calculation and converting survey data into pie charts. Based on the survey data, there also create a statistic analysis for this survey report.
Our group members are doing calculation and converting data into chart.
While others member, they are required to transfer the information into the survey report and create one A2 size printed infographic poster which summarises the findings of our survey.
7 | P a g e
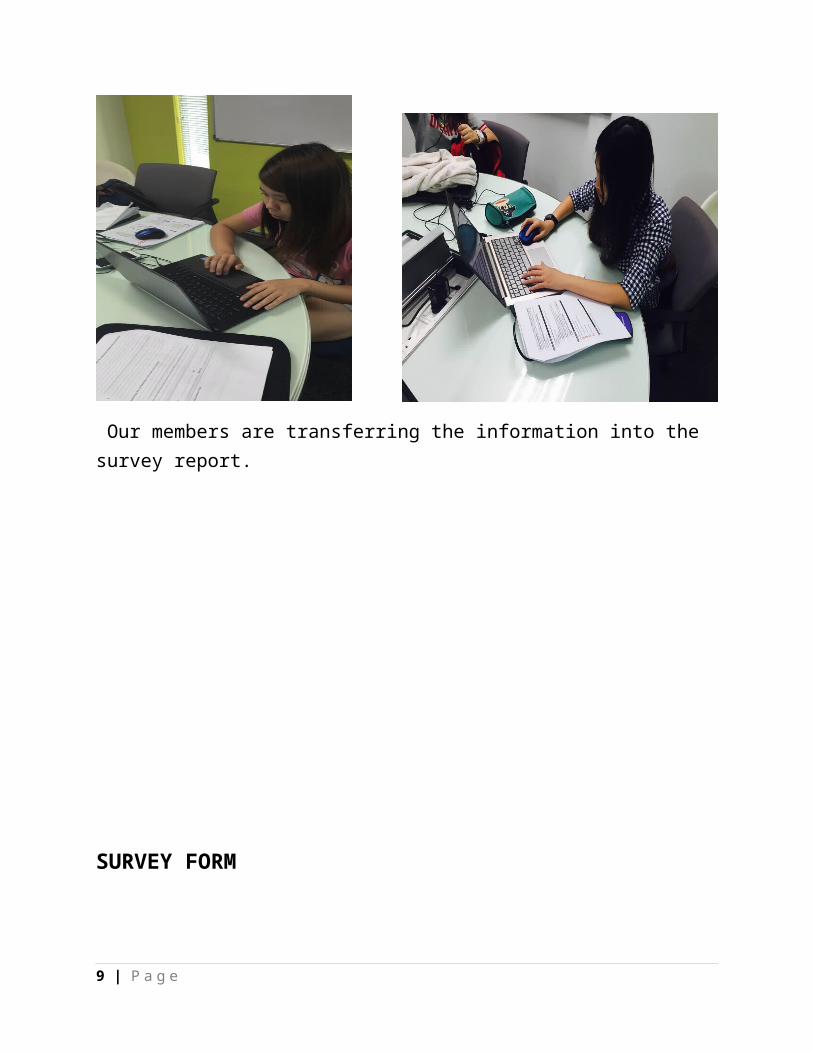
Our members are transferring the information into the survey report.
SURVEY FORM
8 | P a g e
SCHOOL OF ARCHITECTURE, BUILDING & DESIGNFoundation in Natural and Built EnvironmentsMATHEMATICS [MTH30104]
This survey is to fulfill the purpose of our Mathematics’ project. Participation in voluntary and the information gathered will be kept confidential.
DIABETES SURVEY QUESTIONAIRE
1. Your gender☐ Male ☐ Female
2. Which ethnicity is at the highest risk for Diabetes? ☐ African ☐ European Asian☐
3. Which races is most affected by diabetes in Malaysia? ☐ Malay Chinese☐ Indian☐
4. How many types of diabetes are there? 1☐ 2☐ 3☐ 4☐
5. What age is the highest risk for diabetes to happen? below 30☐ 31-59☐ 60 and above☐
6. What types of diabetes can be prevented through lifestyles changes? ☐ Type 1 diabetes ☐ Type 2 diabetes ☐ All of above
7. High blood pressure is a risk factor for diabetes? True☐ False☐
8. Which of the following can alter a person’s blood glucose levels?
☐ Exercise Climate ☐ Stress Level☐ All of above☐
9. Which factor do you think is the main causes of this disease? Genetic☐ Unhealthy lifestyle☐
9 | P a g e
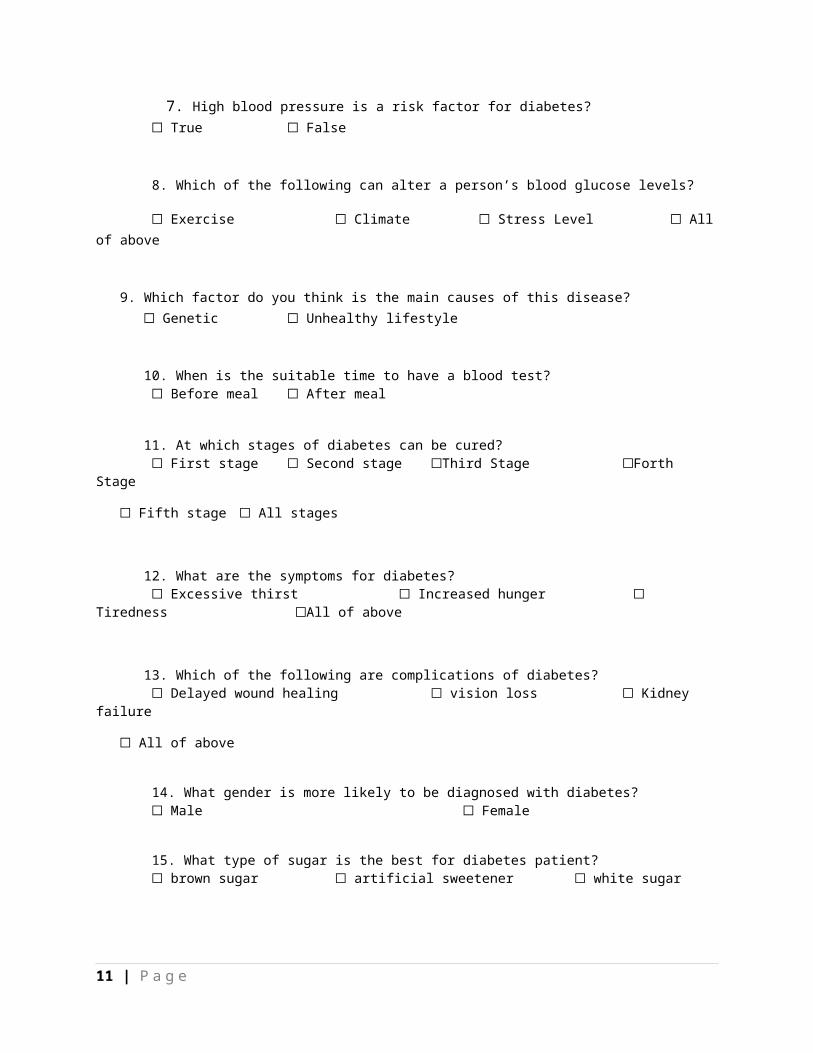
10. When is the suitable time to have a blood test? Before meal ☐ After meal☐
11. At which stages of diabetes can be cured? First stage☐ Second stage ☐ Third Stage☐ Forth Stage☐
Fifth stage☐ All stages☐
12. What are the symptoms for diabetes? Excessive thirst☐ Increased hunger Tiredness☐ ☐ All of above☐
13. Which of the following are complications of diabetes? Delayed wound healing☐ vision loss☐ Kidney failure☐
All of above☐
14. What gender is more likely to be diagnosed with diabetes? Male☐ Female☐
15. What type of sugar is the best for diabetes patient? brown sugar☐ artificial sweetener☐ white sugar☐
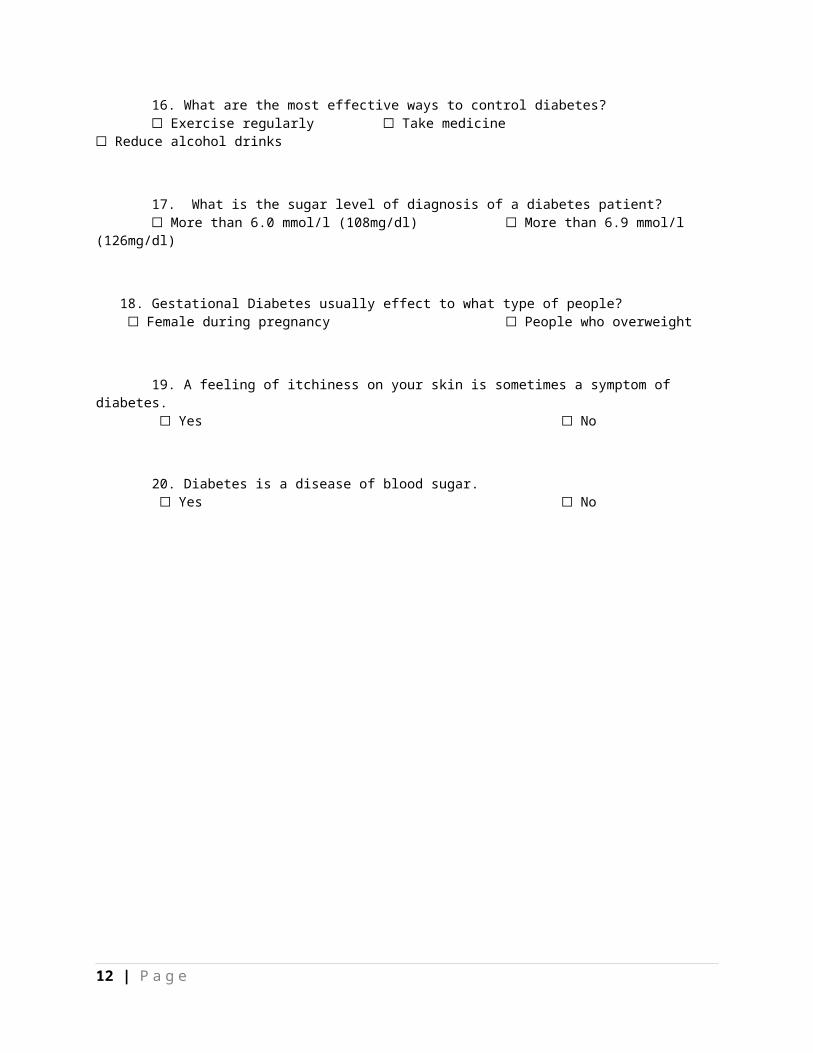
16. What are the most effective ways to control diabetes? Exercise regularly ☐ Take medicine Reduce alcohol drinks☐ ☐
17. What is the sugar level of diagnosis of a diabetes patient? More than 6.0 mmol/l (108mg/dl) More than 6.9 mmol/l (126mg/dl)☐ ☐
18. Gestational Diabetes usually effect to what type of people? Female during pregnancy People who overweight☐ ☐
19. A feeling of itchiness on your skin is sometimes a symptom of diabetes. Yes No☐ ☐
20. Diabetes is a disease of blood sugar. Yes No☐ ☐
10 | P a g e
STATISTICAL ANALYSIS
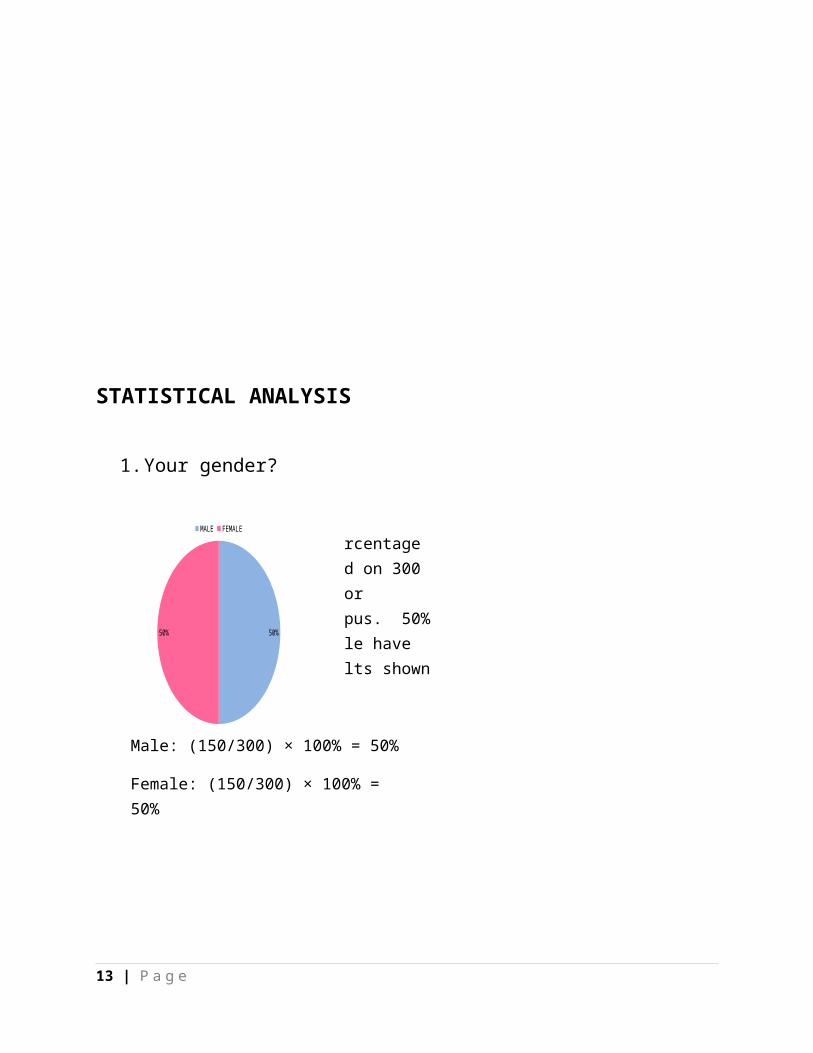
1. Your gender?
11 | P a g e
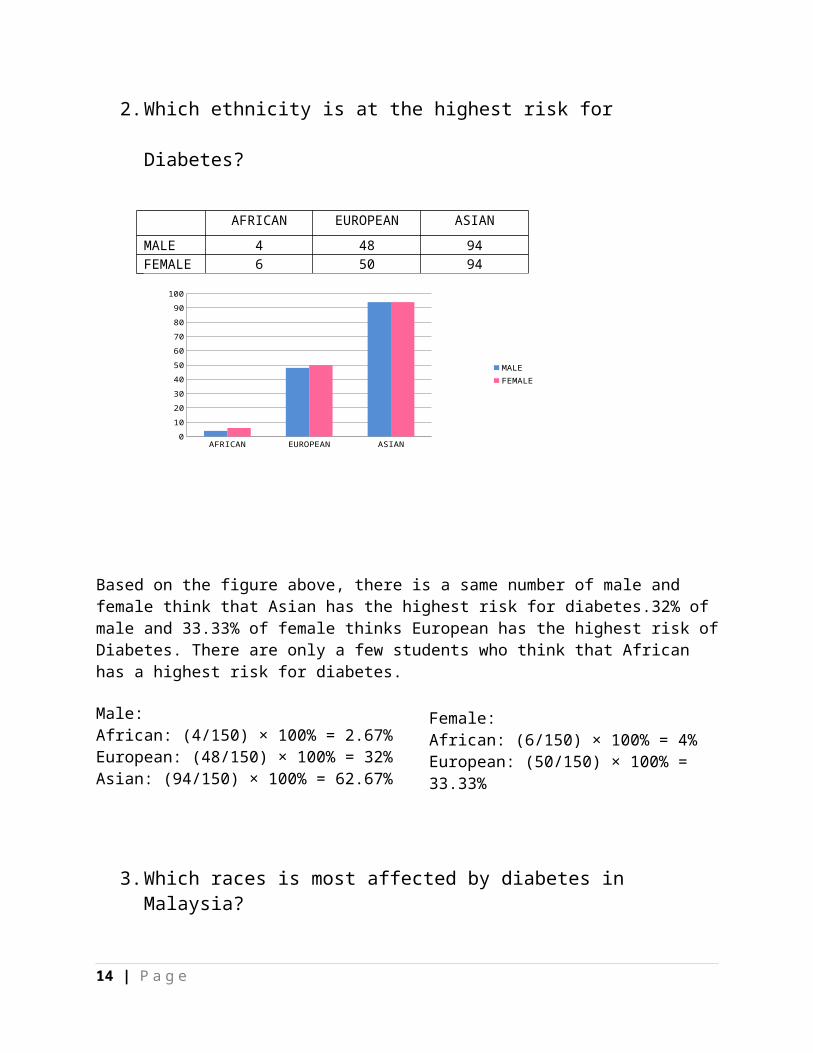
2. Which ethnicity is at the highest risk for Diabetes?
AFRICAN EUROPEAN ASIAN
MALE 4 48 94FEMALE 6 50 94
AFRICAN EUROPEAN ASIAN0
10
20
30
40
50
60
70
80
90
100
MALEFEMALE
12 | P a g e
50%50%
MALE FEMALE
The figure shows the percentage of male and female based on 300 survey students in Taylor University lakeside campus. 50% of Male and 50% of Female have contributed to the results shown on the pie chart above.
Male: (150/300) × 100% = 50%
Female: (150/300) × 100% = 50%
Based on the figure above, there is a same number of male and female think that Asian has the highest risk for diabetes.32% of male and 33.33% of female thinks European has the highest risk of Diabetes. There are only a few students who think that African has a highest risk for diabetes.
Male:African: (4/150) × 100% = 2.67%European: (48/150) × 100% = 32%Asian: (94/150) × 100% = 62.67%
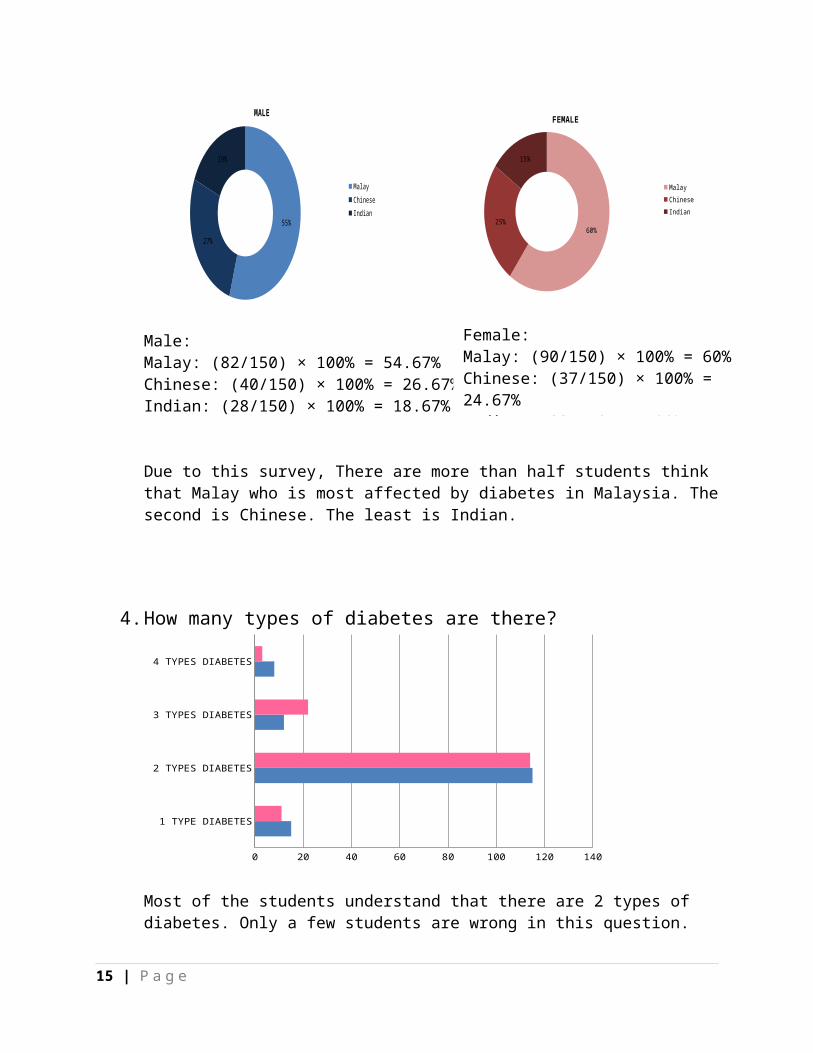
3. Which races is most affected by diabetes in Malaysia?
55%
27%
19%
MALE
MalayChineseIndian
Male:Malay: (82/150) × 100% = 54.67%Chinese: (40/150) × 100% = 26.67%Indian: (28/150) × 100% = 18.67%
Due to this survey, There are more than half students think that Malay who is most affected by diabetes in Malaysia. The second is Chinese. The least is Indian.
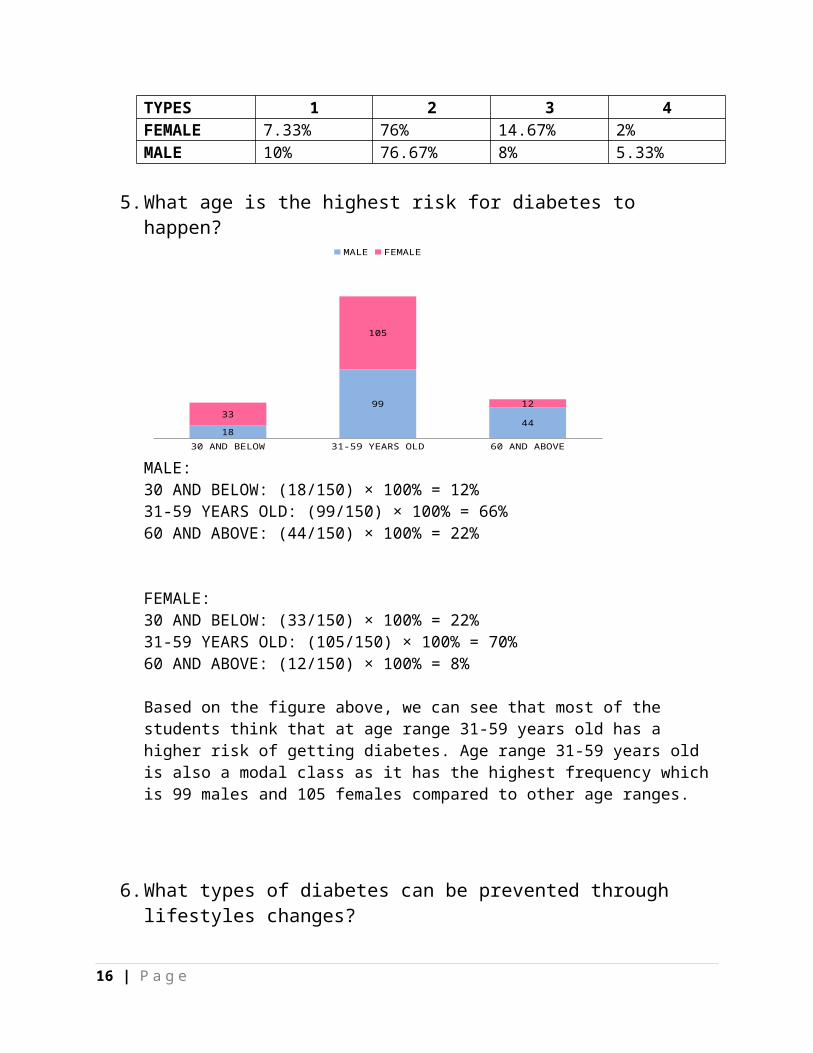
4. How many types of diabetes are there?
13 | P a g e
Female: African: (6/150) × 100% = 4%European: (50/150) × 100% = 33.33%Asian: (94/150) × 100%= 62.67%
60%25%
15%
FEMALE
MalayChineseIndian
Female:Malay: (90/150) × 100% = 60%Chinese: (37/150) × 100% = 24.67%Indian: (23/150) × 100% = 15.33%
1 TYPE DIABETES
2 TYPES DIABETES
3 TYPES DIABETES
4 TYPES DIABETES
10 30 50 70 90 110 1301 TYPE DIABETES 2 TYPES DIABETES 3 TYPES DIABETES 4 TYPES DIABETES
MALE 15 115 12 8
FEMALE 11 114 22 3
Most of the students understand that there are 2 types of diabetes. Only a few students are wrong in this question.
TYPES 1 2 3 4FEMALE 7.33% 76% 14.67% 2%MALE 10% 76.67% 8% 5.33%
5. What age is the highest risk for diabetes to happen?
30 AND BELOW 31-59 YEARS OLD 60 AND ABOVE
18
99
4433
105
12
MALE FEMALE
MALE:30 AND BELOW: (18/150) × 100% = 12%31-59 YEARS OLD: (99/150) × 100% = 66%60 AND ABOVE: (44/150) × 100% = 22%
FEMALE:30 AND BELOW: (33/150) × 100% = 22%31-59 YEARS OLD: (105/150) × 100% = 70%60 AND ABOVE: (12/150) × 100% = 8%
14 | P a g e
Based on the figure above, we can see that most of the students think that at age range 31-59 years old has a higher risk of getting diabetes. Age range 31-59 years old is also a modal class as it has the highest frequency which is 99 males and 105 females compared to other age ranges.
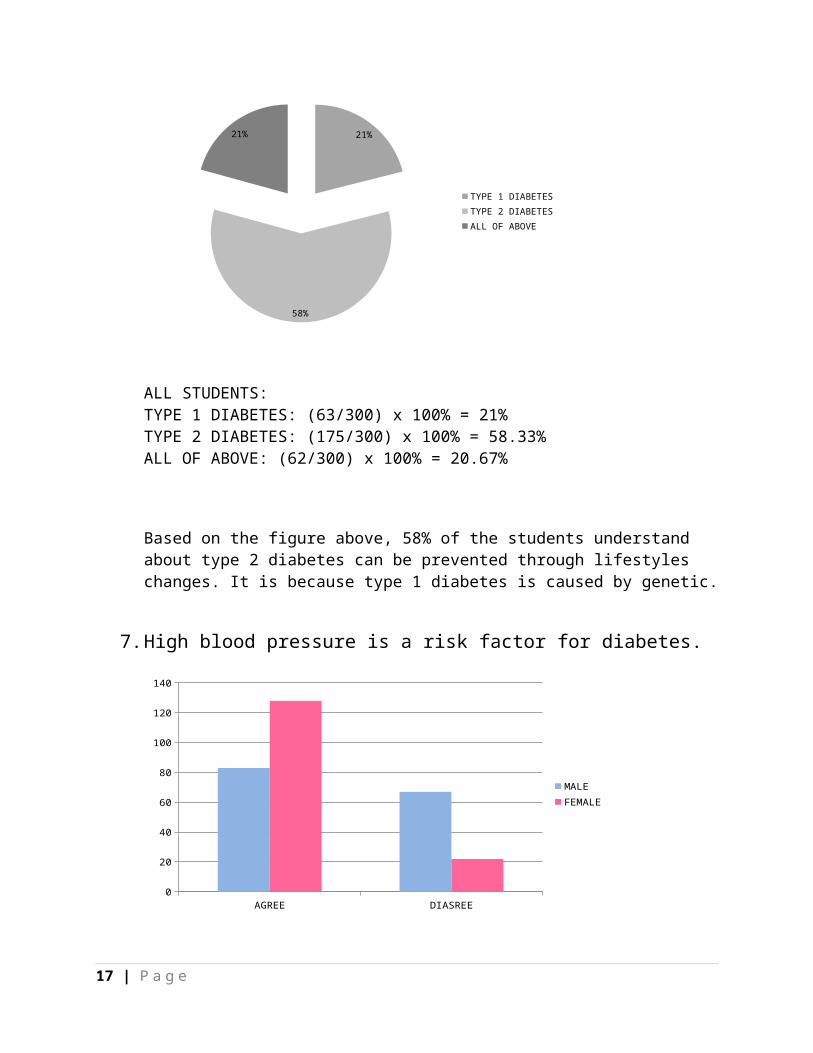
6. What types of diabetes can be prevented through lifestyles changes?
21%
58%
21%
TYPE 1 DIABETESTYPE 2 DIABETESALL OF ABOVE
ALL STUDENTS:TYPE 1 DIABETES: (63/300) x 100% = 21%TYPE 2 DIABETES: (175/300) x 100% = 58.33%ALL OF ABOVE: (62/300) x 100% = 20.67%
Based on the figure above, 58% of the students understand about type 2 diabetes can be prevented through lifestyles changes. It is because type 1 diabetes is caused by genetic.
7. High blood pressure is a risk factor for diabetes.
15 | P a g e
AGREE DIASREE0
20
40
60
80
100
120
140
MALEFEMALE
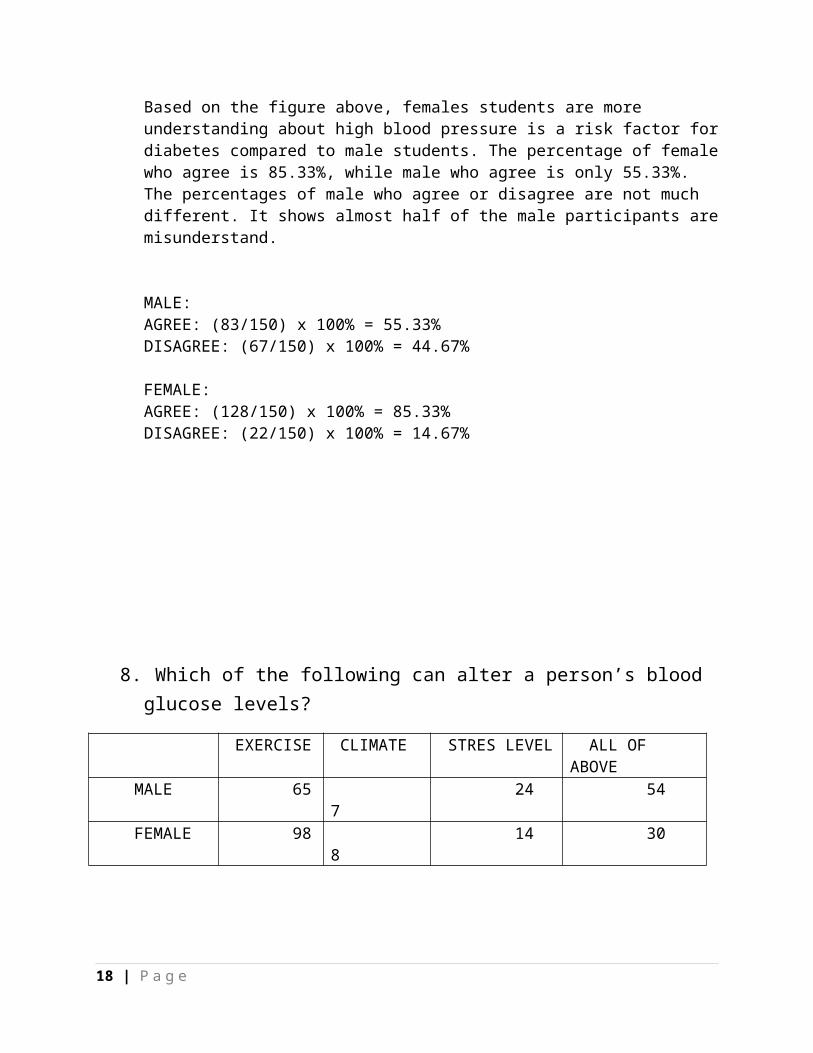
Based on the figure above, females students are more understanding about high blood pressure is a risk factor for diabetes compared to male students. The percentage of female who agree is 85.33%, while male who agree is only 55.33%. The percentages of male who agree or disagree are not much different. It shows almost half of the male participants are misunderstand.
MALE:AGREE: (83/150) x 100% = 55.33%DISAGREE: (67/150) x 100% = 44.67%
FEMALE:AGREE: (128/150) x 100% = 85.33%DISAGREE: (22/150) x 100% = 14.67%
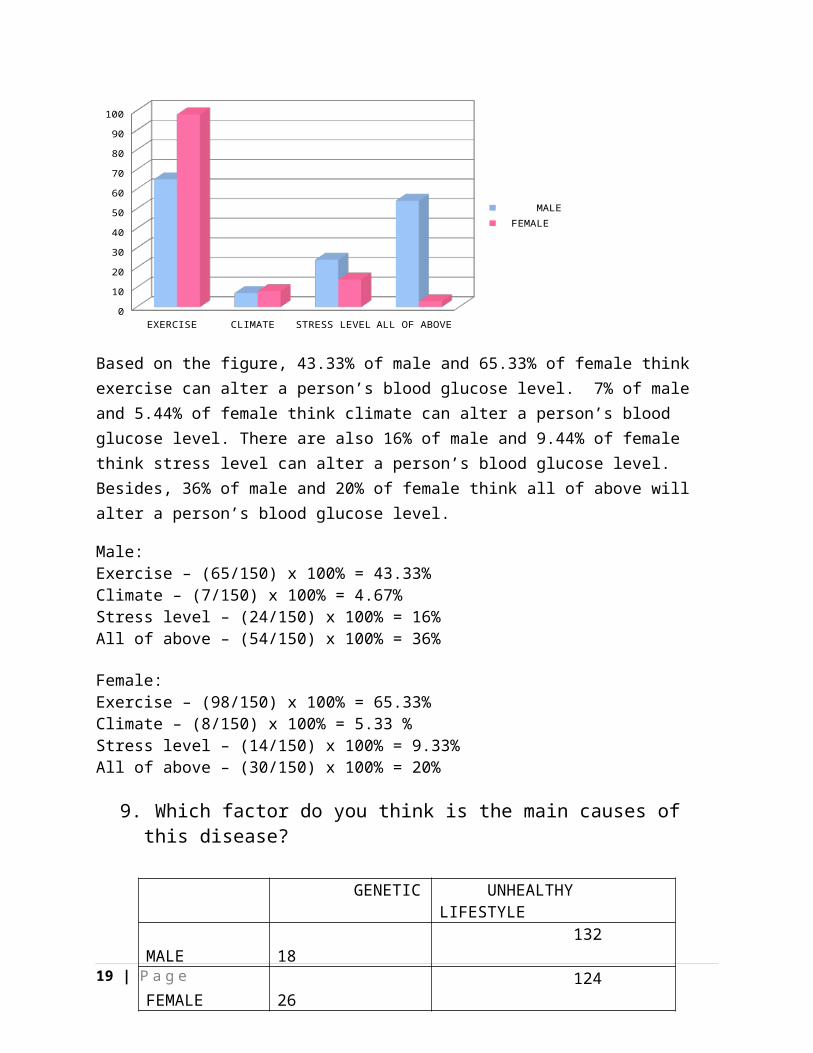
8. Which of the following can alter a person’s blood glucose levels?
EXERCISE CLIMATE STRES LEVEL ALL OF ABOVE MALE 65 7 24 54 FEMALE 98 8 14 30
16 | P a g e
EXERCISE CLIMATE STRESS LEVEL ALL OF ABOVE0
10
20
30
40
50
60
70
80
90
100
MALE FEMALE
Based on the figure, 43.33% of male and 65.33% of female think exercise can alter a person’s blood glucose level. 7% of male and 5.44% of female think climate can alter a person’s blood glucose level. There are also 16% of male and 9.44% of female think stress level can alter a person’s blood glucose level. Besides, 36% of male and 20% of female think all of above will alter a person’s blood glucose level.
Male:Exercise – (65/150) x 100% = 43.33%Climate – (7/150) x 100% = 4.67%Stress level – (24/150) x 100% = 16%All of above – (54/150) x 100% = 36%
Female:Exercise – (98/150) x 100% = 65.33%Climate – (8/150) x 100% = 5.33 %Stress level – (14/150) x 100% = 9.33%All of above – (30/150) x 100% = 20%
9. Which factor do you think is the main causes of this disease?
17 | P a g e
GENETIC UNHEALTHY LIFESTYLE MALE 18 132 FEMALE 26 124
GENETIC UNHEALTHY LIFESTYLE
0
20
40
60
80
100
120
140
MALEFEMALE
Based on the figure, there are 12% of male and 17.33% of female think genetic is the main causes of this disease. Therefore, there are also 88% of male and 82.67% of female think unhealthy lifestyle is the main causes of this disease. Hence, not everyone has the genetic problem, but everyone who has unhealthy lifestyle can caused diabetes easily.
MALE:Genetic : (18/150) x 100% = 12%Unhealthy Lifestyle : (132/150) x 100% = 88%
FEMALE:Genetic : (26/150) x 100% = 17.33%Unhealthy Lifestyle : (124/150) x 100% = 82.67%
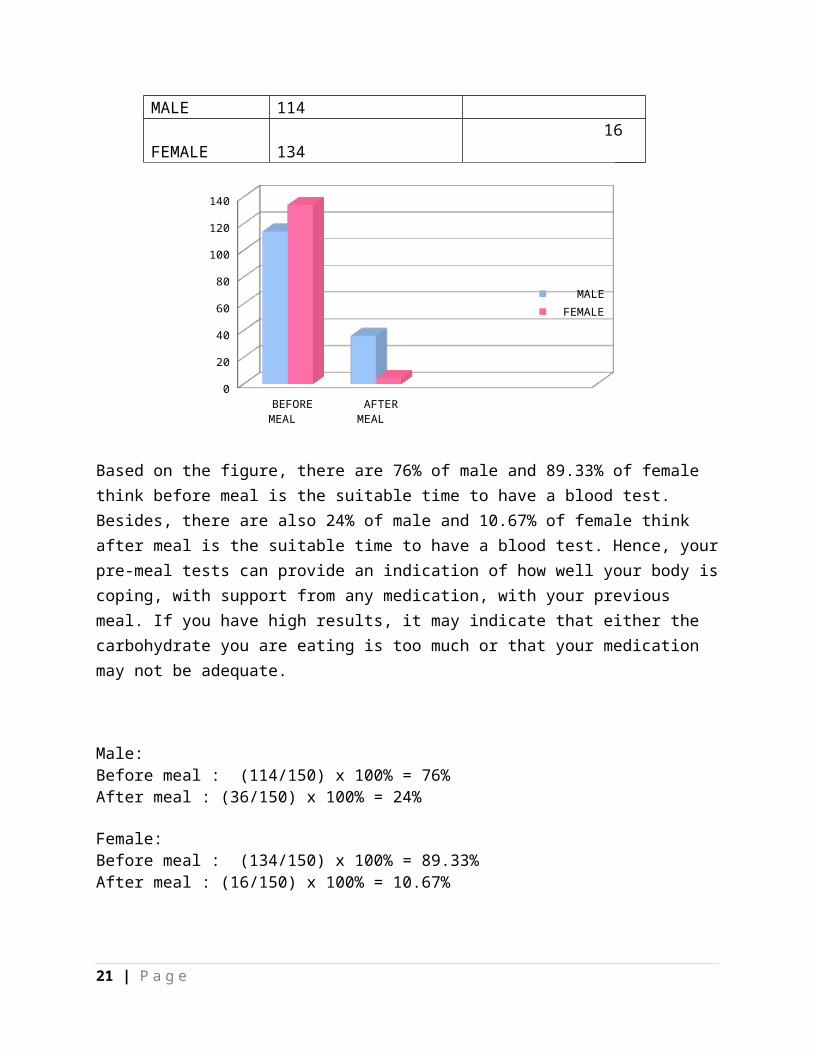
10. When is the suitable time to have a blood test?
BEFORE MEAL AFTER MEAL MALE 114 36 FEMALE 134 16
18 | P a g e
BEFORE MEAL AFTER MEAL0
20
40
60
80
100
120
140
MALE FEMALE
Based on the figure, there are 76% of male and 89.33% of female think before meal is the suitable time to have a blood test. Besides, there are also 24% of male and 10.67% of female think after meal is the suitable time to have a blood test. Hence, your pre-meal tests can provide an indication of how well your body is coping, with support from any medication, with your previous meal. If you have high results, it may indicate that either the carbohydrate you are eating is too much or that your medication may not be adequate.
Male:Before meal : (114/150) x 100% = 76%After meal : (36/150) x 100% = 24%
Female:Before meal : (134/150) x 100% = 89.33%After meal : (16/150) x 100% = 10.67%
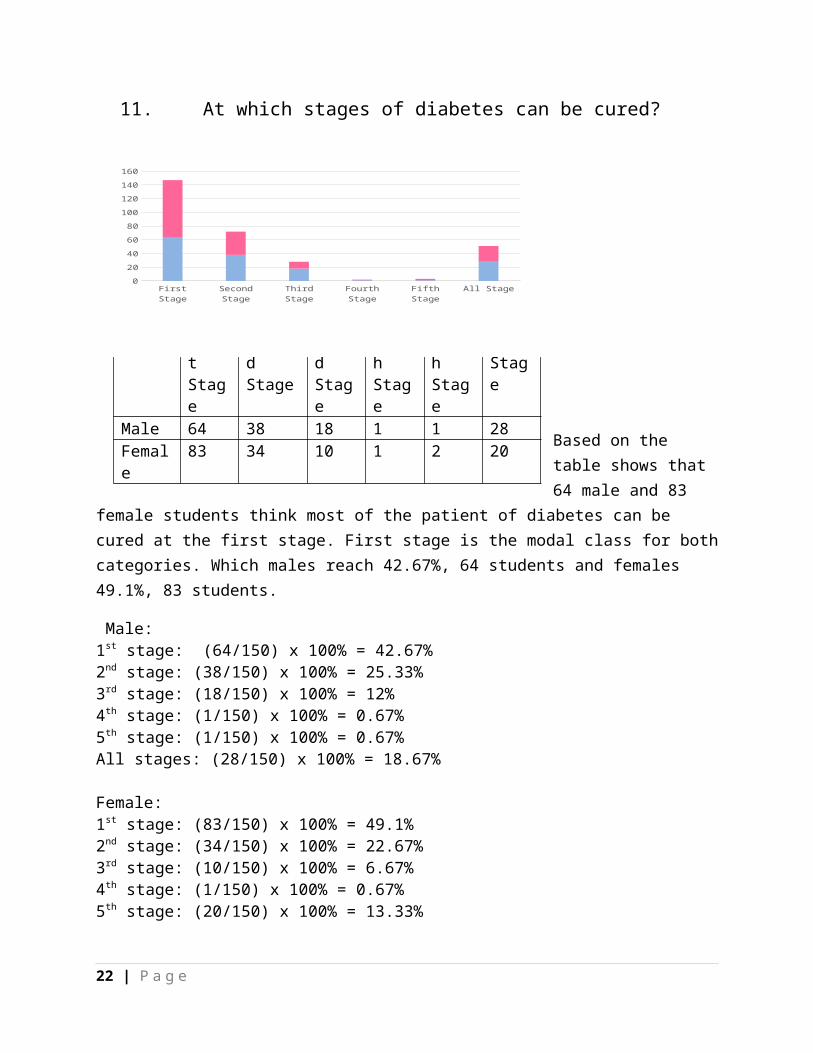
11. At which stages of diabetes can be cured?
19 | P a g e
Based on the table shows that 64 male and 83
female students think most of the patient of diabetes can be cured at the first stage. First stage is the modal class for both categories. Which males reach 42.67%, 64 students and females 49.1%, 83 students.
Male:1st stage: (64/150) x 100% = 42.67%2nd stage: (38/150) x 100% = 25.33%3rd stage: (18/150) x 100% = 12%4th stage: (1/150) x 100% = 0.67%5th stage: (1/150) x 100% = 0.67%All stages: (28/150) x 100% = 18.67%
Female:1st stage: (83/150) x 100% = 49.1%2nd stage: (34/150) x 100% = 22.67%3rd stage: (10/150) x 100% = 6.67%4th stage: (1/150) x 100% = 0.67%5th stage: (20/150) x 100% = 13.33%
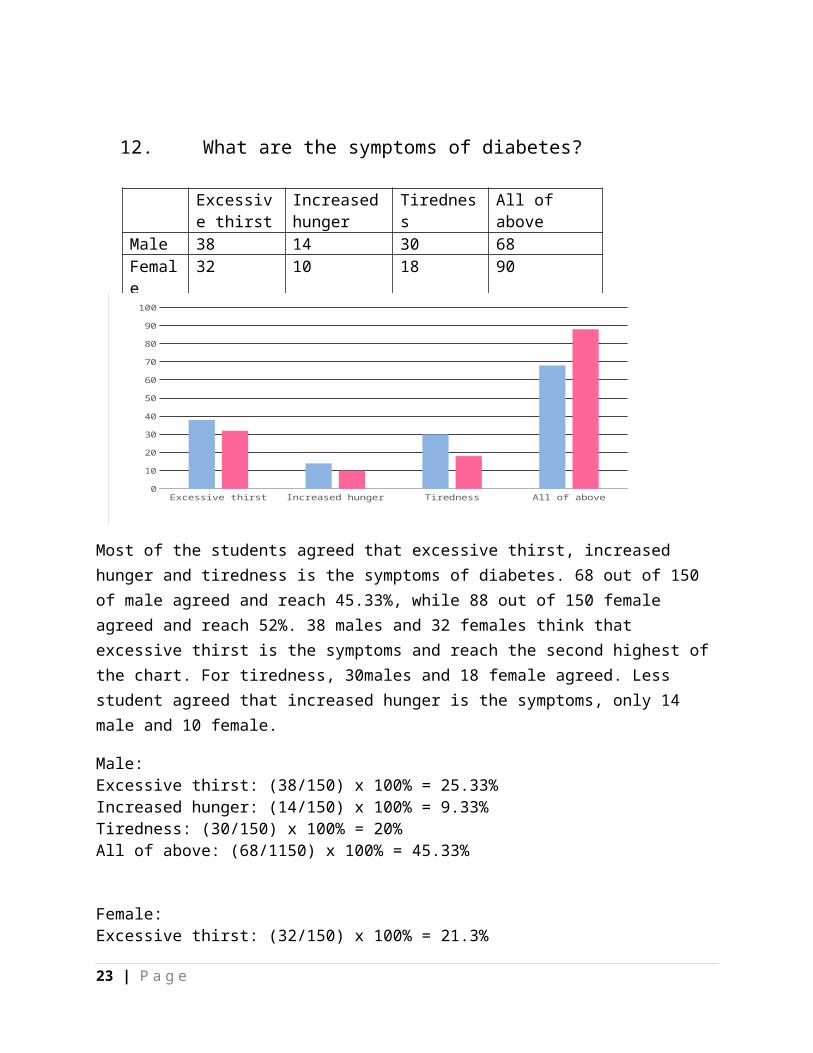
12. What are the symptoms of diabetes?
20 | P a g e
First Stage Second Stage Third Stage Fourth Stage Fifth Stage All Stage0
20
40
60
80
100
120
140
160
First Stage
Second Stage
Third Stage
Forth Stage
Fifth Stage
All Stage
Male 64 38 18 1 1 28Female
83 34 10 1 2 20
Excessive thirst
Increased hunger
Tiredness All of above
Male 38 14 30 68Female
32 10 18 90
Most of the
students agreed that excessive thirst, increased hunger and tiredness is the symptoms of diabetes. 68 out of 150 of male agreed and reach 45.33%, while 88 out of 150 female agreed and reach 52%. 38 males and 32 females think that excessive thirst is the symptoms and reach the second highest of the chart. For tiredness, 30males and 18 female agreed. Less student agreed that increased hunger is the symptoms, only 14 male and 10 female.
Male:Excessive thirst: (38/150) x 100% = 25.33%Increased hunger: (14/150) x 100% = 9.33%Tiredness: (30/150) x 100% = 20%All of above: (68/1150) x 100% = 45.33%
Female:Excessive thirst: (32/150) x 100% = 21.3%Increased hunger: (10/150) x 100% = 6.67%Tiredness: (18/150) x 100% = 12%All of above: (90/150) x 100% = 60%
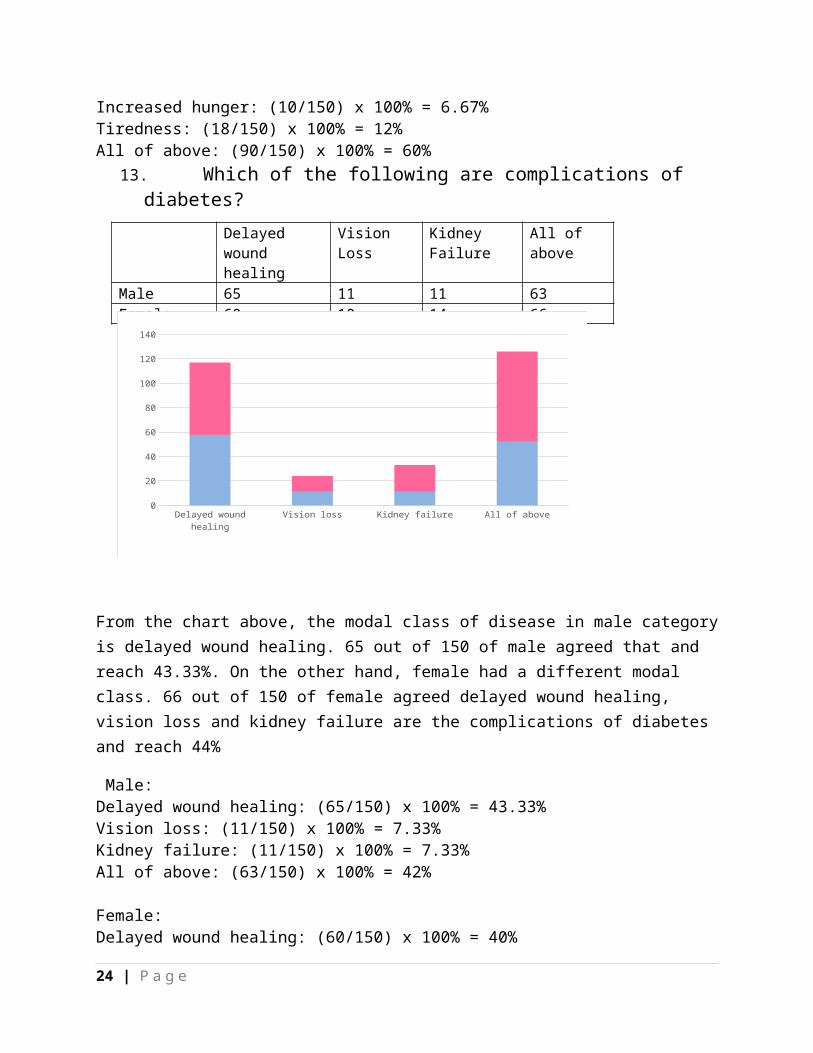
13. Which of the following are complications of diabetes?
21 | P a g e
Excessive thirst Increased hunger Tiredness All of above0
10
20
30
40
50
60
70
80
90
100
Delayed wound healing
Vision Loss
Kidney Failure
All of above
Male 65 11 11 63Female 60 10 14 66
From the chart above, the modal class of disease in male category is delayed wound healing. 65 out of 150 of male agreed that and reach 43.33%. On the other hand, female had a different modal class. 66 out of 150 of female agreed delayed wound healing, vision loss and kidney failure are the complications of diabetes and reach 44%
Male: Delayed wound healing: (65/150) x 100% = 43.33%Vision loss: (11/150) x 100% = 7.33%Kidney failure: (11/150) x 100% = 7.33%All of above: (63/150) x 100% = 42%
Female:Delayed wound healing: (60/150) x 100% = 40%Vision loss: (10/150) x 100% 6.67%Kidney failure: (14/150) x100% = 9.33%All of above: (66/150) x 100% = 44%
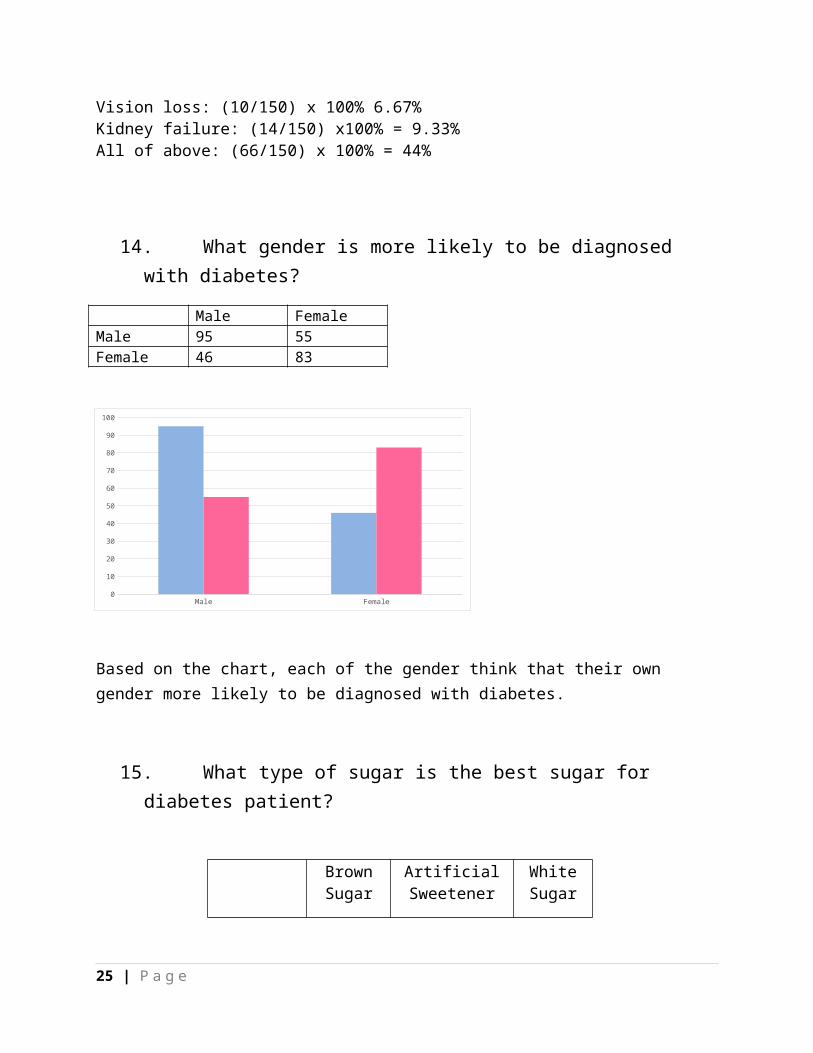
14. What gender is more likely to be diagnosed with diabetes?
Male FemaleMale 95 55Female 46 83
22 | P a g e
Delayed wound healing Vision loss Kidney failure All of above0
20
40
60
80
100
120
140
Based on the chart, each of the gender think that their own gender more likely to be diagnosed with diabetes.
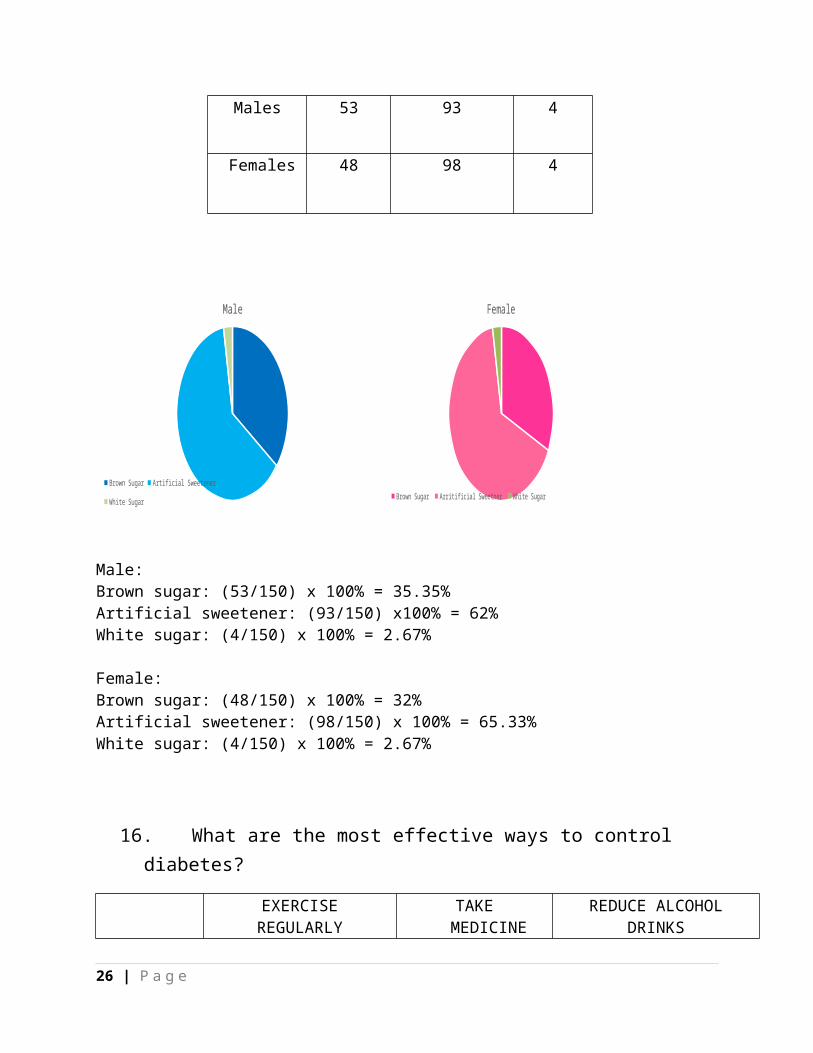
15. What type of sugar is the best sugar for diabetes patient?
Brown Sugar
Artificial Sweetener
White Sugar
Males 53 93 4
Females 48 98 4
23 | P a g e
Male Female0
10
20
30
40
50
60
70
80
90
100
Male:Brown sugar: (53/150) x 100% = 35.35%Artificial
sweetener: (93/150) x100% = 62%White sugar: (4/150) x 100% = 2.67%
Female:Brown sugar: (48/150) x 100% = 32%Artificial sweetener: (98/150) x 100% = 65.33%White sugar: (4/150) x 100% = 2.67%
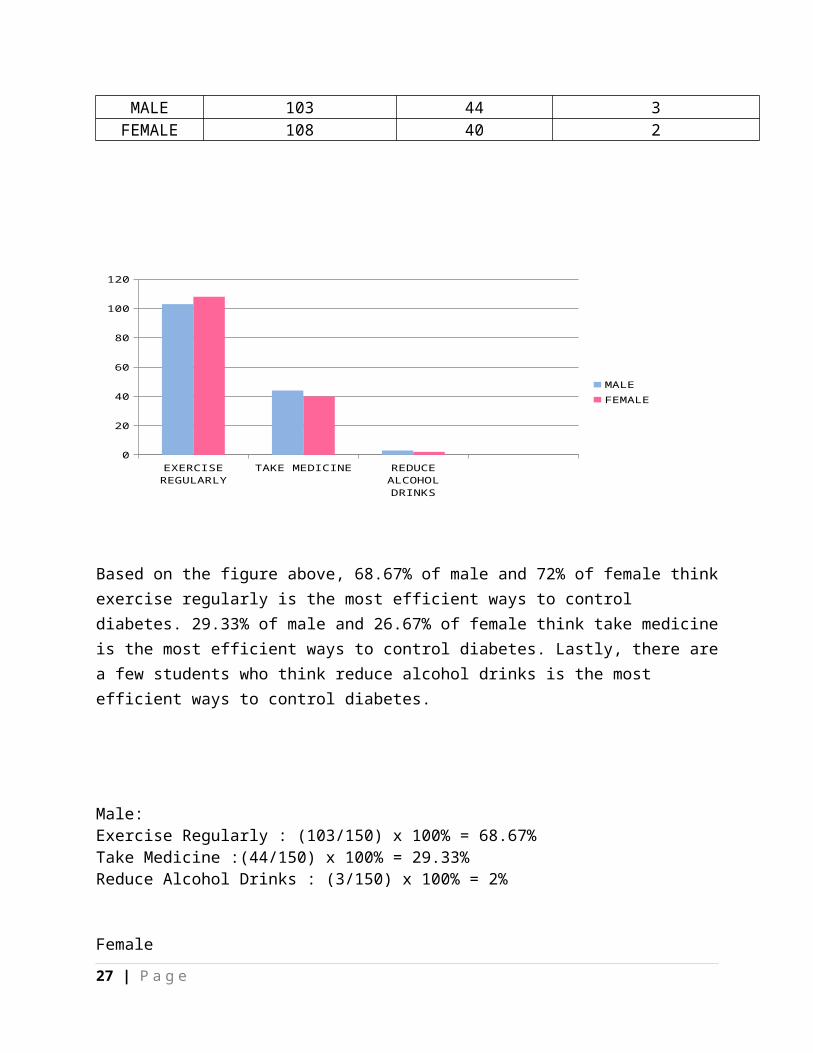
16. What are the most effective ways to control diabetes?
EXERCISE REGULARLY
TAKE MEDICINE
REDUCE ALCOHOL DRINKS
MALE 103 44 3FEMALE 108 40 2
24 | P a g e
Male
Brown Sugar Artificial Sweetener White Sugar
Female
Brown Sugar Arritificial Sweetner White Sugar
EXERCISE REGULARLY TAKE MEDICINE REDUCE ALCOHOL DRINKS
0
20
40
60
80
100
120
MALEFEMALE
Based on the figure above, 68.67% of male and 72% of female think exercise regularly is the most efficient ways to control diabetes. 29.33% of male and 26.67% of female think take medicine is the most efficient ways to control diabetes. Lastly, there are a few students who think reduce alcohol drinks is the most efficient ways to control diabetes.
Male:Exercise Regularly : (103/150) x 100% = 68.67%Take Medicine :(44/150) x 100% = 29.33%Reduce Alcohol Drinks : (3/150) x 100% = 2%
FemaleExercise Regularly: (108/150) x 100% = 72%Take Medicine :(40/150) x 100% = 26.67%Reduce Alcohol Drinks : (2/150) x 100% = 1.33%
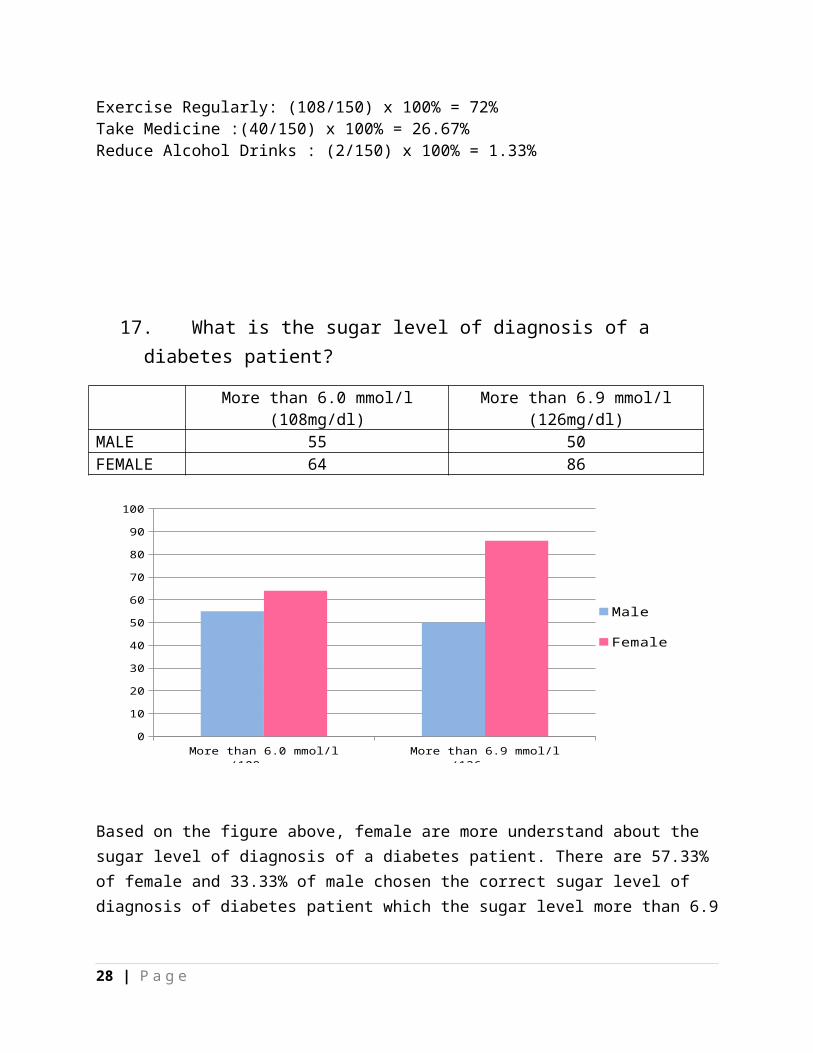
17. What is the sugar level of diagnosis of a diabetes patient?
25 | P a g e
More than 6.0 mmol/l (108mg/dl)
More than 6.9 mmol/l (126mg/dl)
MALE 55 50FEMALE 64 86
Based on the figure above, female are more understand about the sugar level of diagnosis of a diabetes patient. There are 57.33% of female and 33.33% of male chosen the correct sugar level of diagnosis of diabetes patient which the sugar level more than 6.9 mmol/l (126mg/dl). Besides, there are 42.67% of female and 36.67% of male chosen the wrong answer.
Male :More than 6.0 mmol/l (108mg/dl):(55/150) x 100% = 36.67%More than 6.9 mmol.l (126mg/dl):(50/150) x 100% = 33.33%
Female:More than 6.0 mmol/l (108mg/dl):(64/150) x 100% = 42.67%More than 6.9 mmol.l (126mg/dl):(86/150) x 100% = 57.33%
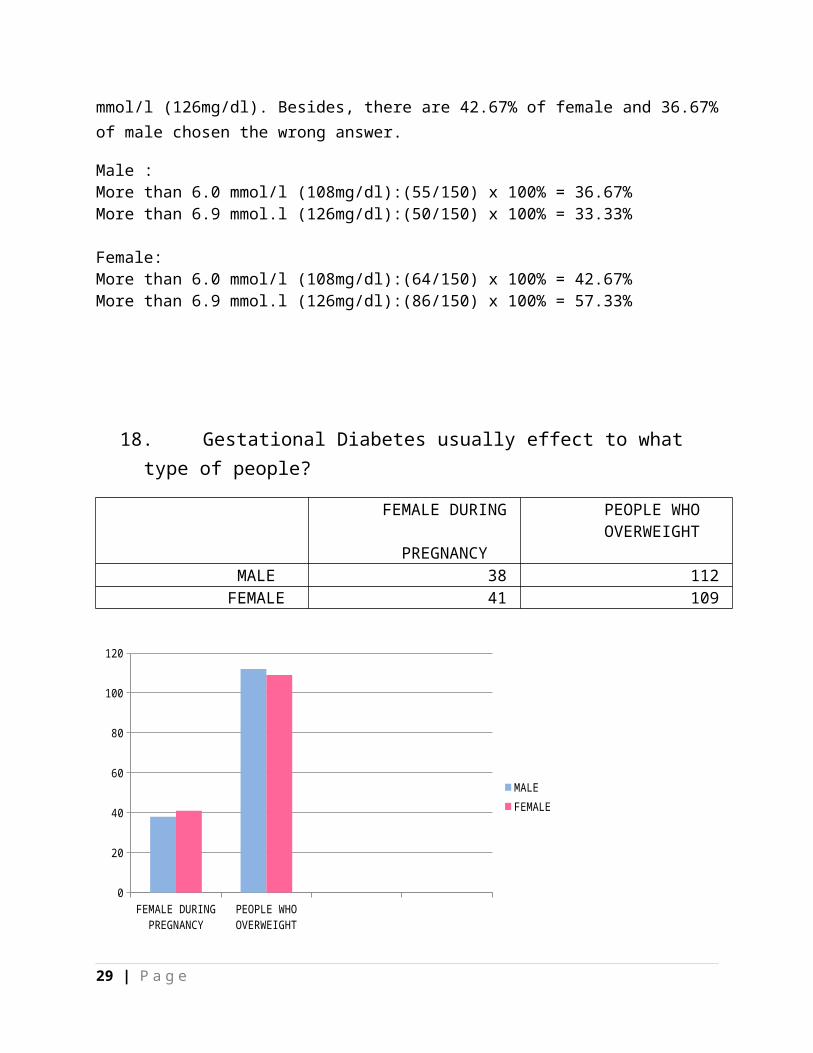
18. Gestational Diabetes usually effect to what type of people?
FEMALE DURING PEOPLE WHO OVERWEIGHT
26 | P a g e
More than 6.0 mmol/l (108mg/dl) More than 6.9 mmol/l (126mg/dl)0
10
20
30
40
50
60
70
80
90
100
Male
Female
PREGNANCY MALE 38 112 FEMALE 41 109
FEMALE DURING PREGNANCY
PEOPLE WHO OVERWEIGHT
0
20
40
60
80
100
120
MALEFEMALE
Based on the figure above, 25.33% of male and 27.33% of female think gestational diabetes usually effect to female during pregnancy. Therefore, 74.67% of male and 72.67% of female think gestational diabetes usually effect to people who are overweight.
Male Female during pregnancy : (38/150) x 100% = 25.33%People who overweight: (112/150) x 100% = 74.67%
FemaleFemale during pregnancy: (41/150) x 100% = 27.33%People who overweight: (109/150) x 100% = 72.67%
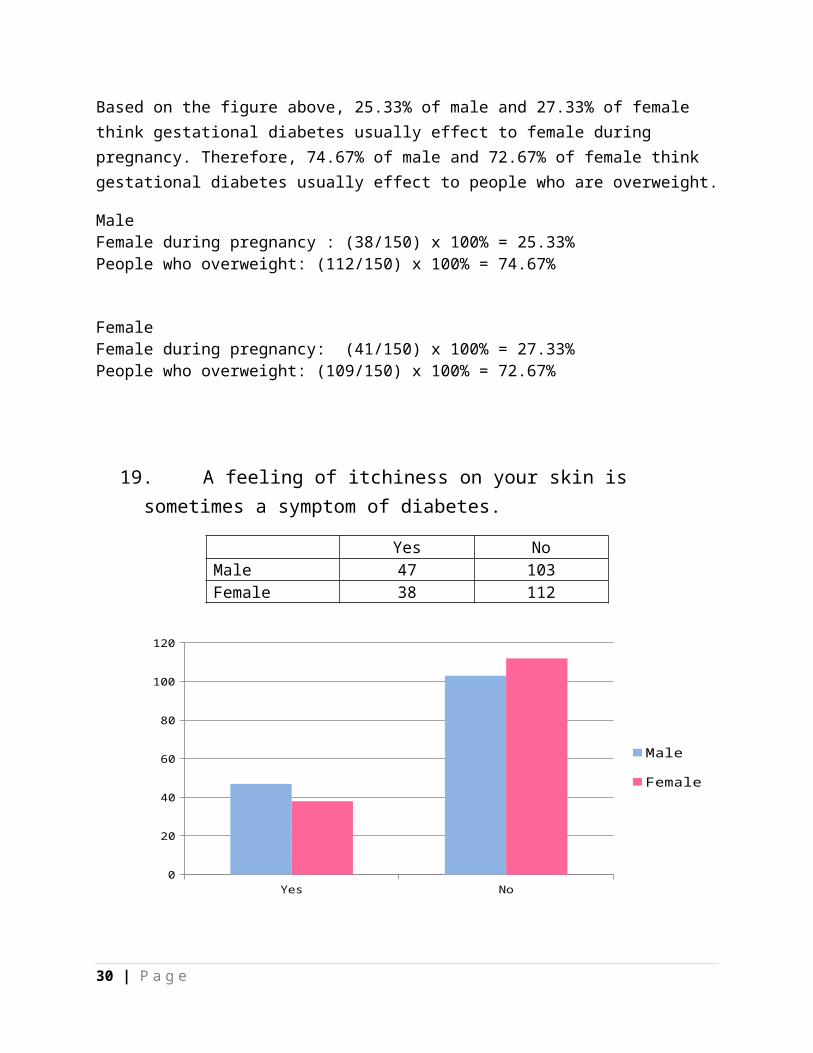
19. A feeling of itchiness on your skin is sometimes a symptom of diabetes.
Yes NoMale 47 103Female 38 112
27 | P a g e
Based on the figure, there are 31.33% of male and 25.33% of female chosen the answer of yes, while there are 68.67% of male and 74.67% of female chosen the answer of no. Most of the students think that a feeling of itchiness on your skin sometimes is not a symptom of diabetes. It shown that most of students misunderstand about diabetes. A feeling of itchiness on your skin sometimes is a symptom of diabetes.
Male:Yes: (47/150) x 100% = 31.33%No: (103/150) x 100% = 68.67%
Female:Yes: (38/150) x 100% = 25.33%No: (112/150) x 100% = 74.67%
20. Diabetes is a disease of blood sugar.
28 | P a g e
Yes No0
20
40
60
80
100
120
Male
Female
YES NO MALE 132 18 FEMALE 132 18
YES NO0
20
40
60
80
100
120
140
MALE FEMALE
Based on the figure above, there is 88% of male and female agreed that diabetes is a disease of blood sugar. Therefore, there is also 12% of male and female does not agree that diabetes is a disease of blood sugar. Most of the student misunderstand about diabetes is a disease of blood sugar. Hence, diabetes is NOT a disease of blood sugar, but rather a disorder of insulin and leptin signaling.
Male & Female:Yes : (264/300) x 100% = 88%No : (36/300) x 100% = 12%
Conclusion
In a nutshell, other than just collect and interpret statistical data, the
major purpose of this assignment is to investigate the understanding of the
students in Taylor’s University on the common chronic diseases in Malaysia.
In the same time, this survey also creates a schema and awareness to the
29 | P a g e
individuals in Malaysia especially the students on the top common chronic
diseases in Malaysia. Through this survey, we can also create an idea of the
understanding levels among the participants on their knowledge of diabetes.
In addition, not only participate student increase their knowledge as well as
we understand more about diabetes.
For the first step, we try to figure out what is the best question but we
know nothing about diabetes. So, each of us did some research and discover
what is diabetes. Basically, diabetes have three type. Type one is because
the body does not produce insulin while type two is because the body does
not produce enough insulin for proper function. Both of this type are similar
but gestational diabetes are totally different. Gestational Diabetes only
happened on female during pregnancy. The number of diabetes in Malaysia
is getting higher and is the number one country in ASEAN. Most importantly,
all stages have to control your blood sugar even though there’s no cure.
Through this survey, we had learnt many things such as communicate
with stranger, collecting data, analysis data, tabulating data, converting data
in to charts, apply statistic principle, design a poster but the most important
is teamwork. In this project, we work as a group so we have to cooperate and
tolerate each other, if not we can’t finish it on time.
Last but not least, we hope that through this survey more people we
know more about diabetes and create an awareness to themselves. Diabetes
is a non cure disease so we should prevent it. As the saying goes,
“prevention is better than cure.”
30 | P a g e


![Untitled-1 [] 2019/Fee_chart... · 2019-03-25 · IX = 4000 (Maths & English) X = 2800 (Maths) Maths & English) Amount (Maths & English) (Maths & English) Balance Fee Clerk's Sign](https://img.pdfslide.net/doc/110x75/5e6e31aa8f2b545f5d423876/untitled-1-2019feechart-2019-03-25-ix-4000-maths-english.jpg)