Embed Size (px)
Citation preview
MEASURE OF RELATIONSHIP:CORRELATION COEFFICIENTADVANCED MATHEMATICS PROGRAM 8
Prepared by:
Ms. Lady Asrah A. Carim

Correlation• In Statistics, this is commonly concerned to as the correlation
coefficient.• A value of correlation coefficient (r) represents the whole group
and tells a story the same with mean and standard deviation.• For instance, the weight-height relationship of fourth year high
school students in certain school has a correlation coefficient (r) of 0.89, high relationship. This means that the heavier the weight, the taller is the student and the lighter the weight, the short the student.

Smith/Davis (c) 2005 Prentice Hall
The Nature of Correlation• Often used as means for
prediction, correlation tells us how related two variables are.
• However, note that even though two variables may be highly correlated, you should not assume that one variable causes the other.
• CORRELATION DOES NOT IMPLY CAUSATION. • For example, there is the third
variable possibility (i.e., there may be additional variable(s) that are causing the two things you are investigating to be related to each other).
“There’s a significant NEGATIVE correlation between the number of mules and the number of academics in a state, but remember, correlation is not causation”

Measures of Correlation• These are used both in descriptive and experimental researches.• Some examples of descriptive researches on correlation are as
follows:1. Correlation Between Achievement and Economic Status of Fourth
Year High School Students
2. IQ and Personality Relationship of Fourth Year High School Students
3. Correlation Between Mathematics and English Achievements of Second Year Students

Measures of Correlation• Some examples of experimental researches on correlation are as
follows:1. Weight-Length Relationship of Mudcrab (Alimango) Cultured in the
Backyard Fishpond Using Bread Meal as Supplemental Feed
2. The Height-Weight Relationship of Bottle-Fed Infants Using the Same Milk Brand
3. Weight-Length Relationship of Tilapia Cultured in Backyard Fishpond Using Trash Fish as Supplemental Feed
Smith/Davis (c) 2005 Prentice Hall
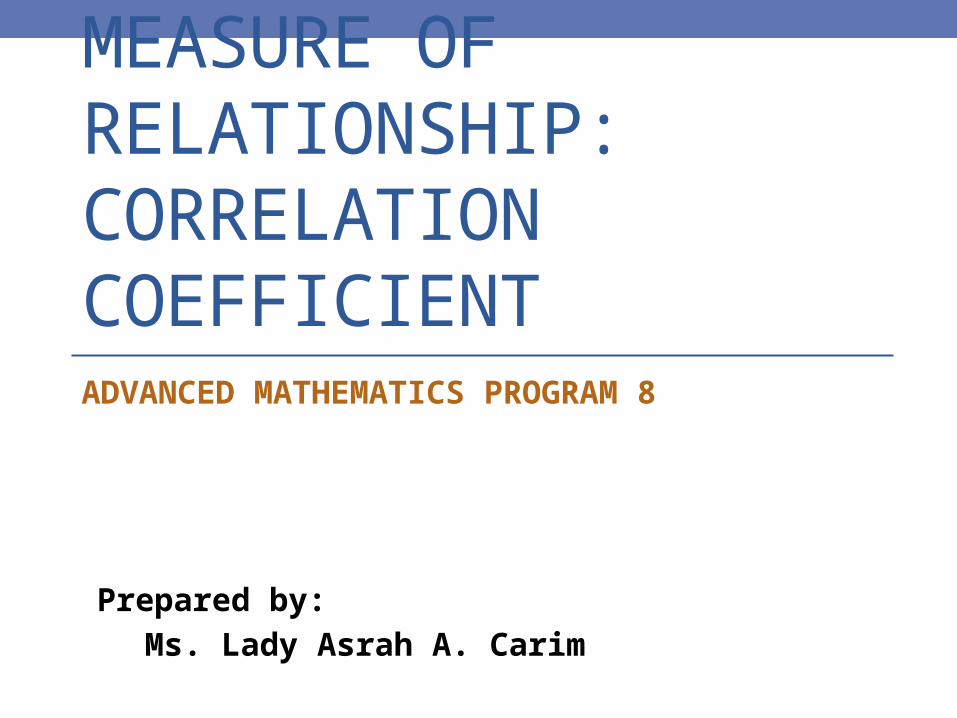
The Scatterplot: Graphing Correlations
• Also known as the scatter diagram, the scatterplot allows us to visually see the relation between two variables. • One variable is plotted on the ordinate and the
other on the abscissa. • Although you can list either variable on either axis, it is
common to place the variable you are attempting to predict on the ordinate. • Positive correlations – occur when both variables move
in the same direction (e.g., as NAT scores increase, so to do GPAs). • Negative Correlations – occur when one variable
increases, the other decreases (e.g., as age increases, the number of speeding tickets decrease).

Smith/Davis (c) 2005 Prentice Hall
The Range of r Values• The Range of r – correlation
coefficients can range in value
from -1.00 to +1.00. • Perfect positive correlation occurs
when you have a value of +1.00 and as we see an increase of one unit in one variable, we always see a proportional increase in the other variable.
• The existence of a perfect correlation indicates there are no other factors present that influence the relation we are measuring. This situation rarely occurs in real life.

Smith/Davis (c) 2005 Prentice Hall
The Range of r Values
• The Range of r – correlation coefficients can range in value from -1.00 to +1.00. • A correlation of -1.00 indicates a
perfect negative correlation between the two variables of interest. That is, whenever there is an increase of one unit in one variable, there is always the same proportional decrease in the other variable.
• There are traditionally assigned values ranging from -1 to +1.

Smith/Davis (c) 2005 Prentice Hall
The Range of r Values
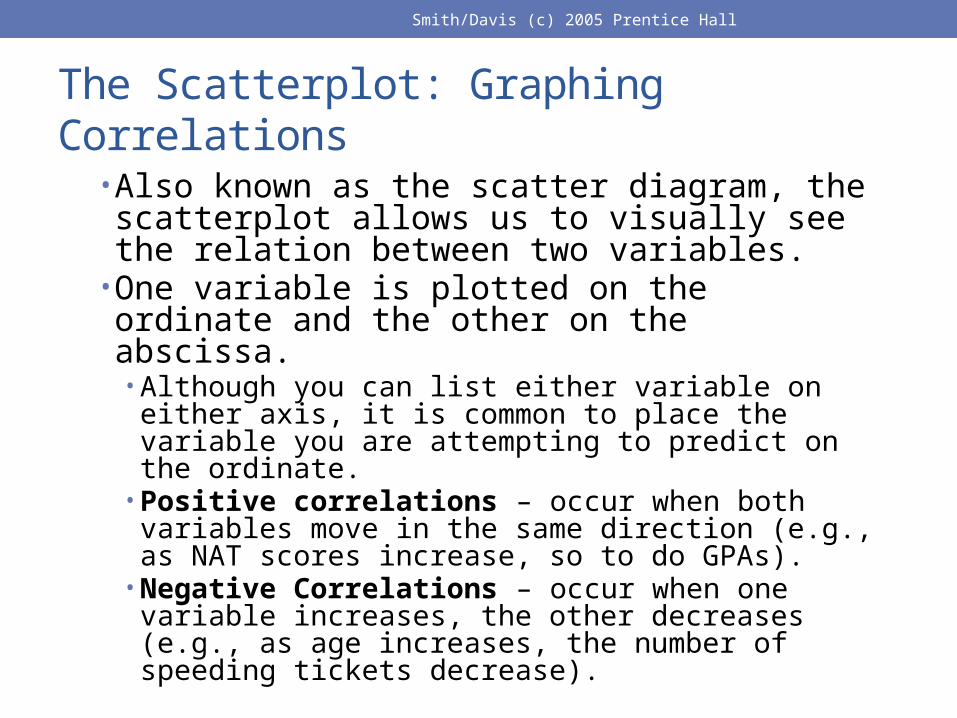
• The Range of r – correlation coefficients can range in value from -1.00 to +1.00. • A zero correlation means there is
little or no relation between the two variables. That is, as scores on one variable increase, scores on the other variable may increase, decrease, or not change at all.

Y
X
Y
X
Y
Y
X
X
Strong relationships Weak relationships
Linear Correlation
Slide from: Statistics for Managers Using Microsoft® Excel 4th Edition, 2004 Prentice-Hall
Linear Correlation
Y
X
Y
X
No relationship
Slide from: Statistics for Managers Using Microsoft® Excel 4th Edition, 2004 Prentice-Hall

Smith/Davis (c) 2005 Prentice Hall
The Pearson Product Moment Correlation Coefficient• The correlation coefficient is the single number that
represents the degree of relation between two variables. • The Pearson Product-Moment Correlation Coefficient
(symbolized by r) is the most common measure of correlation; researchers calculate it when both the X variable and the Y variable are interval or ration scale measurements.• The raw score formula for r is:

Interpretation:
Value of r Interpretation/Classification
0.00 to 0 negligible
0.21 to slight
0.41 to 0 moderate
0.71 to 0 high
0.91 to very high
Perfect