Embed Size (px)
Citation preview
Kohei Arai
International Journal of Applied Science (IJAS), Volume (2) : Issue (2) 21
Method for Estimation of Total Nitrogen and Fiber Contents in Tealeaves with Ground Based Network Cameras
Kohei Arai [email protected]
Graduate School of Science and Engineering Saga University 1 Honjo, Saga 840-8502 Japan
Abstract
Methods for estimation of total nitrogen and fiber contents in tealeaves with ground based network cameras are proposed. Due to a fact that Near Infrared: NIR camera data is proportional to total nitrogen while that shows negative correlation to fiber contents, it is possible to estimate nitrogen and fiber contents in tealeaves with ground based NIR camera data and remote sensing satellite data. Through regressive analysis between measured total nitrogen and fiber contents and NIR reflectance of tealeaves in tea estates, it is found that there is a good correlation between both then regressive equations are created. Also it is found that monitoring of total nitrogen and fiber contents in tealeaves measured with networks cameras is valid. Thus it is concluded that a monitoring of tea estates with network cameras of visible and NIR is appropriate.
Keywords: Nitrogen and Fiber Content, Tealeaf, Sensor Network, Visible and Near Infrared Network cameras, Tea Estate Monitoring
1. INTRODUCTION Vitality monitoring of vegetation is attempted with photographic cameras [1]. Grow rate monitoring is also attempted with spectral reflectance measurements [2]. Total nitrogen content corresponds to amid acid which is highly correlated to Theanine: 2-Amino-4-(ethylcarbamoyl) butyric acid so that total nitrogen can be used for a measure of the quality of tealeaves. It is well known that Theanine rich tealeaves taste good while fiber content in tealeaves is highly correlated to the grow rate of tealeaves. Both total nitrogen and fiber content in tealeaves are highly correlated to the reflectance in the visible and near infrared wavelength regions and vegetation index derived from visible and near infrared data so that it is possible to determine most appropriate tealeaf harvest date using the total nitrogen and fiber content in the tealeaves which are monitored with ground based visible and near infrared cameras and with visible and near infrared radiometers onboard remote sensing satellites. Namely the most appropriate time for harvesting tealeaves is whenever total nitrogen shows the maximum and fiber content shows the minimum. It, however, is not so easy because no one knows the minimum and maximum and because grow rate cannot be estimates with fiber content which is monitored with just cameras and radiometers perfectly. Therefore, it is required to monitor grow rate with the other method with a much precise manner. Tea estate monitoring system with network cameras together with remote sensing satellite data is proposed in the following section followed by proposed estimation methods for total nitrogen and fiber contents with network camera data together with some experimental results. Finally, concluding remarks is followed with some discussions.
Kohei Arai
International Journal of Applied Science (IJAS), Volume (2) : Issue (2) 22
2. PROPOSED METHOD
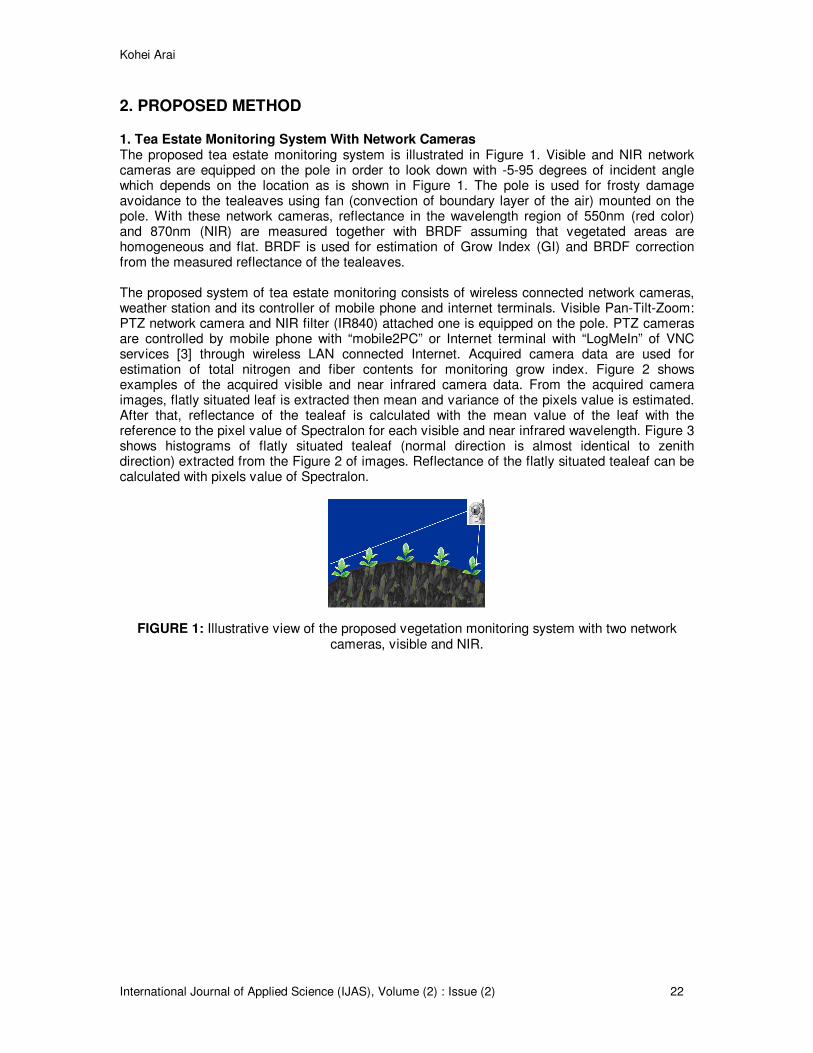
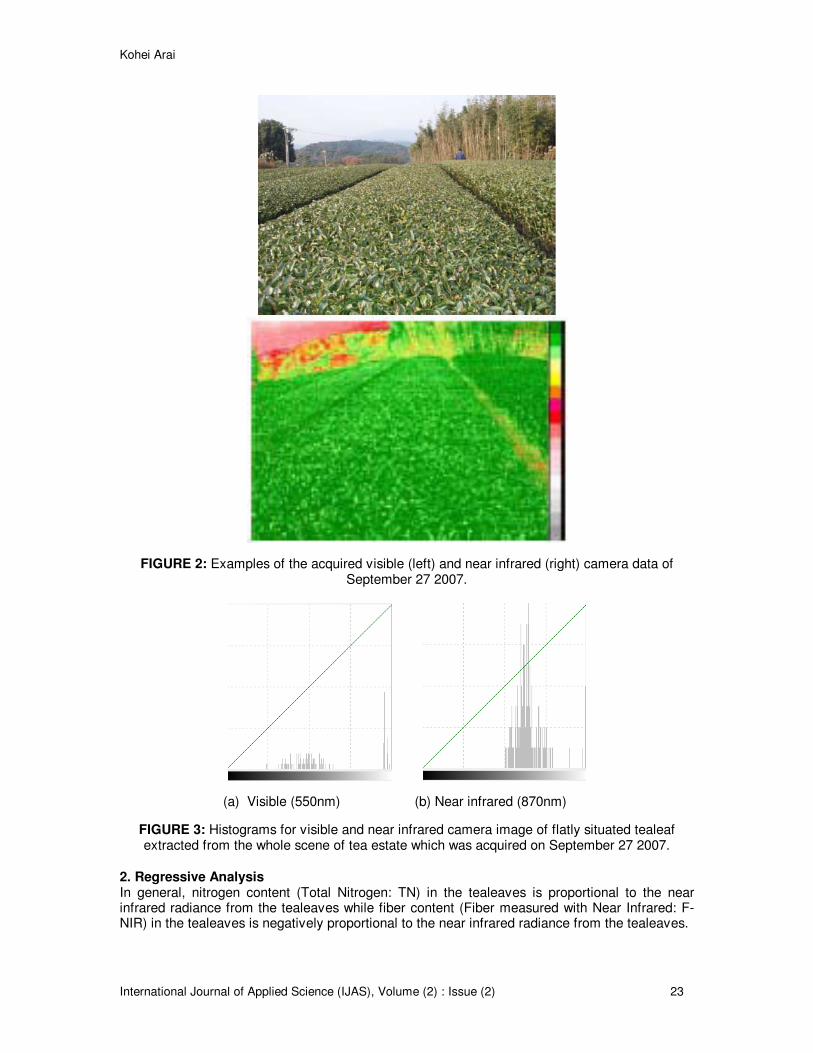
1. Tea Estate Monitoring System With Network Cameras The proposed tea estate monitoring system is illustrated in Figure 1. Visible and NIR network cameras are equipped on the pole in order to look down with -5-95 degrees of incident angle which depends on the location as is shown in Figure 1. The pole is used for frosty damage avoidance to the tealeaves using fan (convection of boundary layer of the air) mounted on the pole. With these network cameras, reflectance in the wavelength region of 550nm (red color) and 870nm (NIR) are measured together with BRDF assuming that vegetated areas are homogeneous and flat. BRDF is used for estimation of Grow Index (GI) and BRDF correction from the measured reflectance of the tealeaves. The proposed system of tea estate monitoring consists of wireless connected network cameras, weather station and its controller of mobile phone and internet terminals. Visible Pan-Tilt-Zoom: PTZ network camera and NIR filter (IR840) attached one is equipped on the pole. PTZ cameras are controlled by mobile phone with “mobile2PC” or Internet terminal with “LogMeIn” of VNC services [3] through wireless LAN connected Internet. Acquired camera data are used for estimation of total nitrogen and fiber contents for monitoring grow index. Figure 2 shows examples of the acquired visible and near infrared camera data. From the acquired camera images, flatly situated leaf is extracted then mean and variance of the pixels value is estimated. After that, reflectance of the tealeaf is calculated with the mean value of the leaf with the reference to the pixel value of Spectralon for each visible and near infrared wavelength. Figure 3 shows histograms of flatly situated tealeaf (normal direction is almost identical to zenith direction) extracted from the Figure 2 of images. Reflectance of the flatly situated tealeaf can be calculated with pixels value of Spectralon.
FIGURE 1: Illustrative view of the proposed vegetation monitoring system with two network cameras, visible and NIR.
Kohei Arai
International Journal of Applied Science (IJAS), Volume (2) : Issue (2) 23
FIGURE 2: Examples of the acquired visible (left) and near infrared (right) camera data of September 27 2007.
(a) Visible (550nm) (b) Near infrared (870nm)
FIGURE 3: Histograms for visible and near infrared camera image of flatly situated tealeaf extracted from the whole scene of tea estate which was acquired on September 27 2007.
2. Regressive Analysis In general, nitrogen content (Total Nitrogen: TN) in the tealeaves is proportional to the near infrared radiance from the tealeaves while fiber content (Fiber measured with Near Infrared: F-NIR) in the tealeaves is negatively proportional to the near infrared radiance from the tealeaves.

Kohei Arai
International Journal of Applied Science (IJAS), Volume (2) : Issue (2) 24
TN = a Ref870 + b (1) F-NIR= -c Ref870 +d (2) where a,b,c,d are regressive coefficients while Ref870 denotes reflectance at 870nm of wavelength. TN is measured by NIR method of measuring instrument, RT-85 manufactured by Shizuoka Seiki Co., Ltd. In order to check the measured TN, Kjeldahl method of chemical method is also used. Meanwhile F-NIR is Neutral Detergent Fiber: NDF which is also measured by NIR method of RT-85 for dried tealeaves. The date measured is as follows, 7/2,8/18,10/23,11/26,12/24 in 2007, 1/4,1/15,2/10,2/27,2/28,3.29,4/14,5/2, 5/16,6/1,7/1.7/3,8/4,8/20,9/5,10/8,11/7,12/10,12/26 in 2008, 1/11,2/12,2/28,3/16,4/17,6/20,7/6,8/7,8/23, 9/24,10/10,10/14,11/27,12/29 in 2009, and 1/30,2/17,3/3,3/19,4/4 in 2010, respectively. Total nitrogen, fiber contents are measured together with harvested amount for the following dates, 5/4,5/3,5/12,5/8,5/3&5/6&5/7 in 2008 for E1Yabukita, S5Oiwase, N12Benifuki, N3Okumidori, and N3Yabukita, respectively. 4/24,4/23,5/7,5/4,4/18&4/30 in 2009 for E1Yabukita, S5Oiwase, N12Benifuki, N3Okumidori, and N3Yabukita, respectively. 4/30,5/6,5/11,5/7,5/3 in 2010 for E1Yabukita, S5Oiwase, N12Benifuki, N3Okumidori, and N3Yabukita, respectively. Where E,S,N,W denote tea estate name while attached words are species of tealeaf. Usually, new tealeaves are harvested firstly in the late of April or in the begging of May. Also new tealeaves are harvested secondly in the middle of June, usually followed by the third harvesting in September. In terms of tea taste of the first harvested new tealeaves is the best followed by the secondly and thirdly harvested new tealeaves so that TN and F-NIR of the firstly harvested new tealeaves is mainly focused in this paper. Through regressive analysis between nitrogen and fiber contents in the tealeaves and the radiance from the corresponding tealeaves measured with visible and near infrared cameras, regressive coefficients of linear equation are estimated.
3. EXPERIMENTS
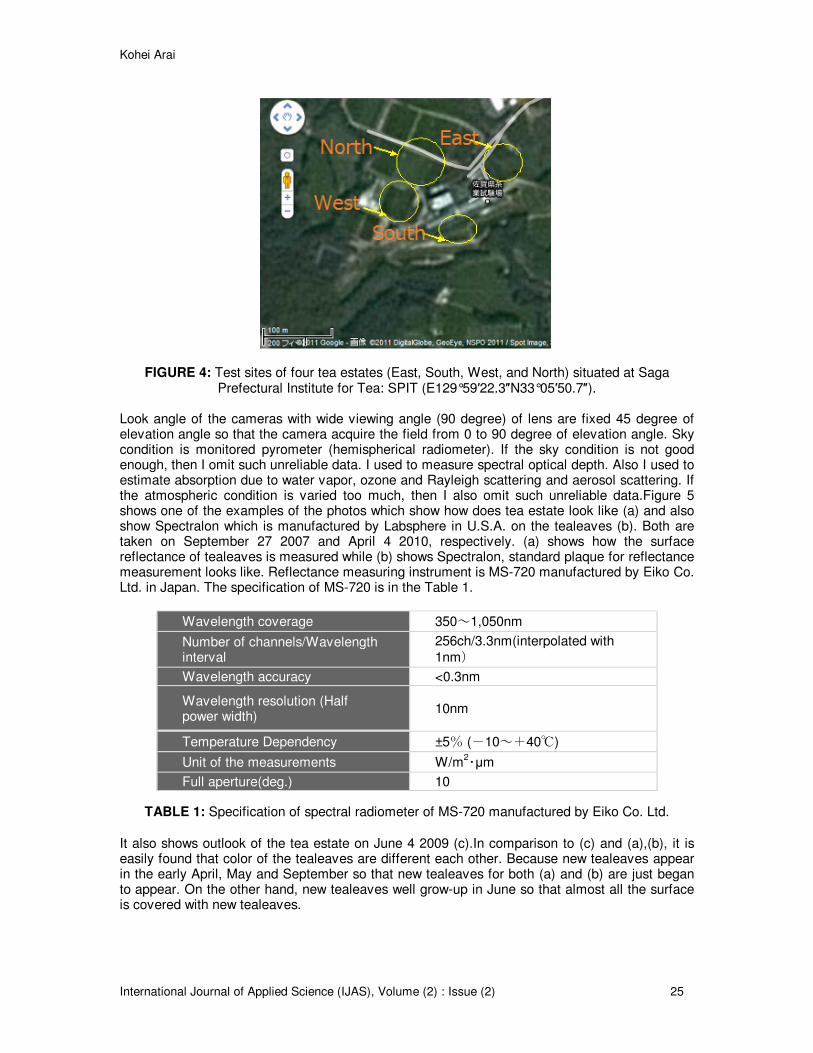
1. Experimental Conditions The monitor systems are equipped at four test sites of tea estates of the Saga Prefectural Institute of Tea: SPIT which is situated at 1870-5 Shimojuku, Ureshino city in Saga prefecture Japan. There are four tea estates at the institute, East, South, West and North tea fields. Species and ages are different each other among the four tea fields. Yabukita is situated at the eastern tea field, Oiwase for southern tea field, Benifuki for western tea field and Yabukita and Okumidori for northern tea field, respectively, as are shown in Figure 4.
Kohei Arai
International Journal of Applied Science (IJAS), Volume (2) : Issue (2) 25
FIGURE 4: Test sites of four tea estates (East, South, West, and North) situated at Saga Prefectural Institute for Tea: SPIT (E129°59′22.3″N33°05′50.7″).
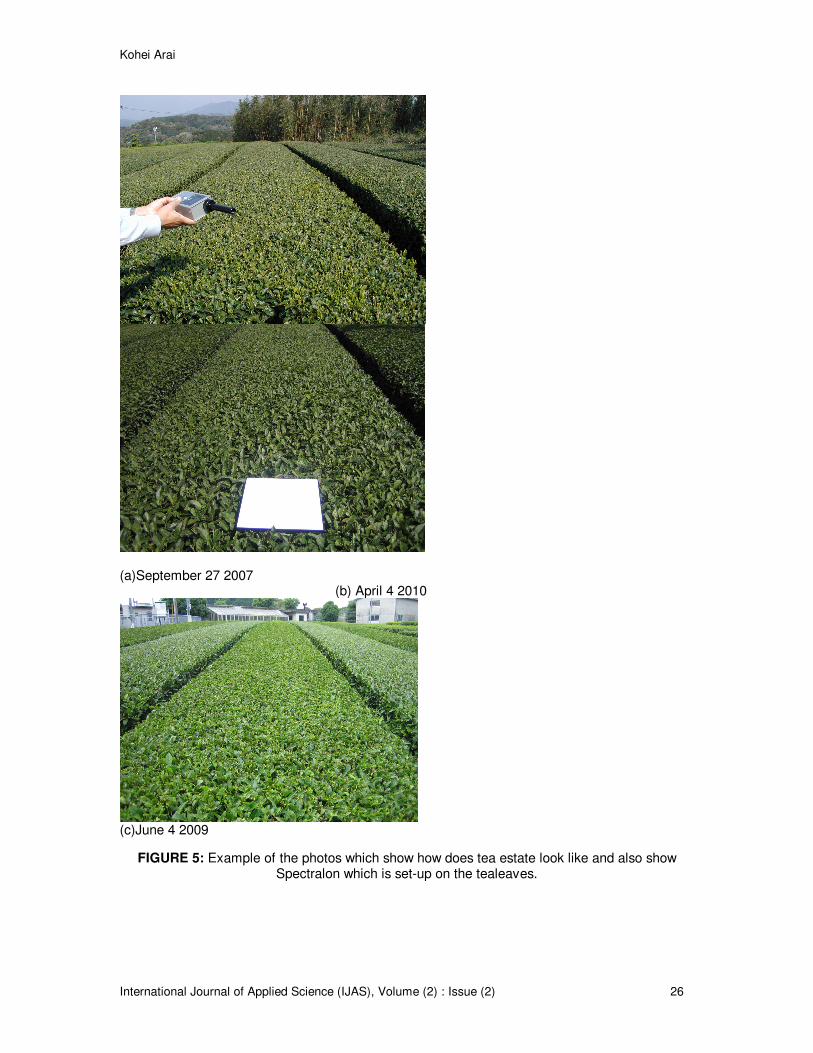
Look angle of the cameras with wide viewing angle (90 degree) of lens are fixed 45 degree of elevation angle so that the camera acquire the field from 0 to 90 degree of elevation angle. Sky condition is monitored pyrometer (hemispherical radiometer). If the sky condition is not good enough, then I omit such unreliable data. I used to measure spectral optical depth. Also I used to estimate absorption due to water vapor, ozone and Rayleigh scattering and aerosol scattering. If the atmospheric condition is varied too much, then I also omit such unreliable data.Figure 5 shows one of the examples of the photos which show how does tea estate look like (a) and also show Spectralon which is manufactured by Labsphere in U.S.A. on the tealeaves (b). Both are taken on September 27 2007 and April 4 2010, respectively. (a) shows how the surface reflectance of tealeaves is measured while (b) shows Spectralon, standard plaque for reflectance measurement looks like. Reflectance measuring instrument is MS-720 manufactured by Eiko Co. Ltd. in Japan. The specification of MS-720 is in the Table 1.
Wavelength coverage 350~1,050nm
Number of channels/Wavelength interval
256ch/3.3nm(interpolated with
1nm)
Wavelength accuracy <0.3nm
Wavelength resolution (Half power width)
10nm
Temperature Dependency ±5% (-10~+40℃)
Unit of the measurements W/m2・µm
Full aperture(deg.) 10
TABLE 1: Specification of spectral radiometer of MS-720 manufactured by Eiko Co. Ltd.
It also shows outlook of the tea estate on June 4 2009 (c).In comparison to (c) and (a),(b), it is easily found that color of the tealeaves are different each other. Because new tealeaves appear in the early April, May and September so that new tealeaves for both (a) and (b) are just began to appear. On the other hand, new tealeaves well grow-up in June so that almost all the surface is covered with new tealeaves.
Kohei Arai
International Journal of Applied Science (IJAS), Volume (2) : Issue (2) 26
(a)September 27 2007 (b) April 4 2010
(c)June 4 2009
FIGURE 5: Example of the photos which show how does tea estate look like and also show Spectralon which is set-up on the tealeaves.

Kohei Arai
International Journal of Applied Science (IJAS), Volume (2) : Issue (2) 27
2. Estimation Method for Total Nitrogen and Fiber Contents in Tealeaves Figure 6 shows typical new tealeaves grow process from the top view of tea estate. Typically, new tealeaves appear in the early April and are harvested in the late April or the early May. Then new tealeaves grow up again in June and are harvested in July. After that new tealeaves grow up again and are harvested in September or October. After all, old tealeaves are cut a little bit for preparation of cold winter season. The idea proposed here is to evaluate vitality of the tea trees through evaluation of total nitrogen and fiber contents by using network cameras monitored in the winter season after harvesting new tealeaves. Such method that allows estimation of vitality of the tea trees is to use measured reflectance at 870nm acquired with NIR network cameras. Reflectance at 550nm and 870nm together with GM: Green Meter value [4], Grow index, total nitrogen content, fiber content as well as water content are measured at the Prefectural tea research institute of Saga which is situated in Ureshino-city in April.
(a) New tealeaves appear (Mixed with old and new tealeaves) (b) New tealeaves all over the old tea leaves
FIGURE 6: Typical photos of new tealeaves grow process taken with network camera at tea estate of the prefectural tea research institute of Saga in the begging of April (a) and the late of
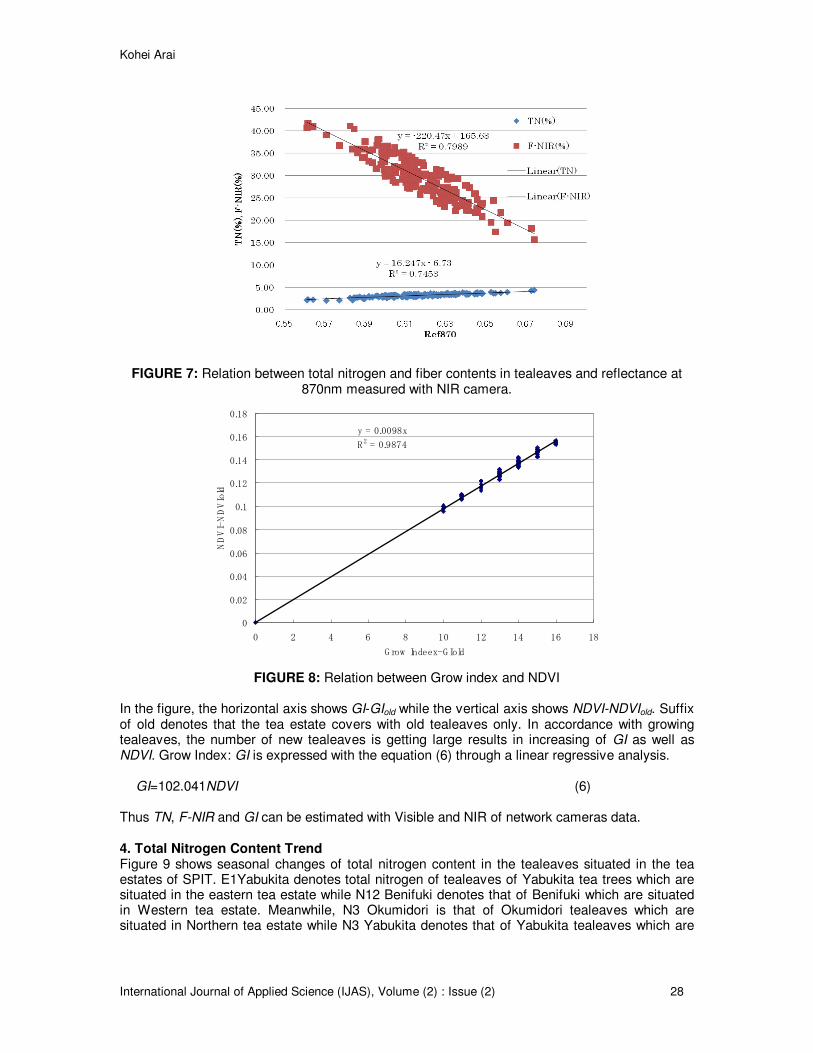
April (b). Through a comparison between measured total nitrogen and fiber content and estimated reflectance derived from the NIR camera data, Figure 7 of relationship is obtained. From this relation, the following equations are derived through linear regressive analysis,
TN=16.247Ref870 – 6.73 (3) F-NIR= - 220.47Ref870 + 165.63 (4)
where TN and F-NIR denote Total Nitrogen and Fiber content in tealeaves. R square value for TN is 0.7453 while that for F-NIR is 0.7989 so that it may say that TN and F-NIR can be estimated with reflectance at 870nm derived from NIR network camera. 3. Estimation of Grow Index With Measured Reflectance at 870nm On the other hand, grow index is also highly correlated to reflectance measured at 870nm. Grow index is defined as the ratio of the number of new tealeaves to the total number of tealeaves. In accordance with new tealeaves grow up, grow index is getting large. The grow index, essentially, highly correlated to Normalized Deviation of Vegetation Index: NDVI,
NDVI=(Ref870-Ref550)/(Ref550+Ref870) (5)
and GM. Figure 8 shows the relation between GI and NDVI where GIold=56 and Ref870=0.55518 as well as NDVI=0.562677.
Kohei Arai
International Journal of Applied Science (IJAS), Volume (2) : Issue (2) 28
FIGURE 7: Relation between total nitrogen and fiber contents in tealeaves and reflectance at 870nm measured with NIR camera.
y = 0.0098x
R 2 = 0.9874
0
0.02
0.04
0.06
0.08
0.1
0.12
0.14
0.16
0.18
0 2 4 6 8 10 12 14 16 18
G row Indeex-G Iold
NDVI-NDVIold
FIGURE 8: Relation between Grow index and NDVI
In the figure, the horizontal axis shows GI-GIold while the vertical axis shows NDVI-NDVIold. Suffix of old denotes that the tea estate covers with old tealeaves only. In accordance with growing tealeaves, the number of new tealeaves is getting large results in increasing of GI as well as NDVI. Grow Index: GI is expressed with the equation (6) through a linear regressive analysis.
GI=102.041NDVI (6)
Thus TN, F-NIR and GI can be estimated with Visible and NIR of network cameras data.
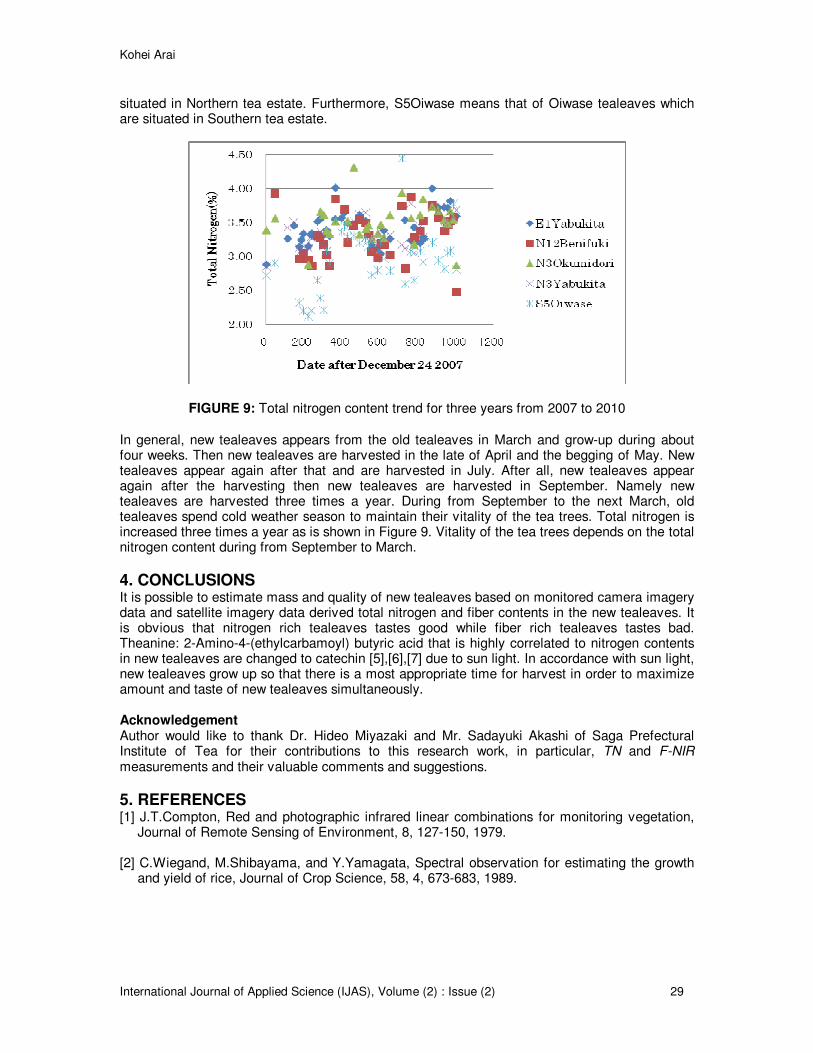
4. Total Nitrogen Content Trend Figure 9 shows seasonal changes of total nitrogen content in the tealeaves situated in the tea estates of SPIT. E1Yabukita denotes total nitrogen of tealeaves of Yabukita tea trees which are situated in the eastern tea estate while N12 Benifuki denotes that of Benifuki which are situated in Western tea estate. Meanwhile, N3 Okumidori is that of Okumidori tealeaves which are situated in Northern tea estate while N3 Yabukita denotes that of Yabukita tealeaves which are
Kohei Arai
International Journal of Applied Science (IJAS), Volume (2) : Issue (2) 29
situated in Northern tea estate. Furthermore, S5Oiwase means that of Oiwase tealeaves which are situated in Southern tea estate.
FIGURE 9: Total nitrogen content trend for three years from 2007 to 2010 In general, new tealeaves appears from the old tealeaves in March and grow-up during about four weeks. Then new tealeaves are harvested in the late of April and the begging of May. New tealeaves appear again after that and are harvested in July. After all, new tealeaves appear again after the harvesting then new tealeaves are harvested in September. Namely new tealeaves are harvested three times a year. During from September to the next March, old tealeaves spend cold weather season to maintain their vitality of the tea trees. Total nitrogen is increased three times a year as is shown in Figure 9. Vitality of the tea trees depends on the total nitrogen content during from September to March.
4. CONCLUSIONS It is possible to estimate mass and quality of new tealeaves based on monitored camera imagery data and satellite imagery data derived total nitrogen and fiber contents in the new tealeaves. It is obvious that nitrogen rich tealeaves tastes good while fiber rich tealeaves tastes bad. Theanine: 2-Amino-4-(ethylcarbamoyl) butyric acid that is highly correlated to nitrogen contents in new tealeaves are changed to catechin [5],[6],[7] due to sun light. In accordance with sun light, new tealeaves grow up so that there is a most appropriate time for harvest in order to maximize amount and taste of new tealeaves simultaneously. Acknowledgement Author would like to thank Dr. Hideo Miyazaki and Mr. Sadayuki Akashi of Saga Prefectural Institute of Tea for their contributions to this research work, in particular, TN and F-NIR measurements and their valuable comments and suggestions.
5. REFERENCES [1] J.T.Compton, Red and photographic infrared linear combinations for monitoring vegetation,
Journal of Remote Sensing of Environment, 8, 127-150, 1979. [2] C.Wiegand, M.Shibayama, and Y.Yamagata, Spectral observation for estimating the growth
and yield of rice, Journal of Crop Science, 58, 4, 673-683, 1989.

Kohei Arai
International Journal of Applied Science (IJAS), Volume (2) : Issue (2) 30
[3] J. F. Blinn. "Models of light reflection for computer synthesized pictures". Proc. 4th annual conference on computer graphics and interactive techniques: 192. doi:10.1145/563858.563893. http://portal.acm.org/citation.cfm?doid=563858.563893., 1977.
[4] http://www.geocities.co.jp/nettaikaju/Observation4-04.html (Access on Jan.5 2009) [5] J.E. Greivenkamp, Field Guide to Geometrical Optics. SPIE Field Guides vol. FG01. SPIE.
ISBN 0-8194-5294-7, 2004. [6] R. Seto, H. Nakamura, F. Nanjo, Y. Hara, Bioscience, Biotechnology, and
Biochemistry,Vol.61 issue9 1434-1439,1997. [7] M. Sano, M. Suzuki, T. Miyase, K. Yoshino, Maeda and M. Yamamoto, J. Agric. Food Chem.,
47 (5), 1906-1910 1999.