Embed Size (px)
Citation preview

How to Design and Evaluate Research in Education
By Jack R. Fraenkel and Norman E. Wallen
Chapter 1
The Nature of Research Ways of knowing
Sensory experience (incomplete/undependable) Agreement with others (common knowledge wrong) Experts’ opinion (they can be mistaken) Logic/reasoning things out (can be based on false premises)
Why research is of value Scientific research (using scientific method) is more trustworthy than expert/colleague opinion,
intuition, etc.
Chapter 1 - continued
The Nature of Research Scientific Method (testing ideas in the public arena) Put guesses (hypotheses) to tests and see how they hold up All aspects of investigations are public and described in detail so anyone who
questions results can repeat study for themselves Replication is a key component of scientific method
Chapter 1 - continued
The Nature of Research Scientific Method (requires freedom of thought and public procedures that can be
replicated) Identify the problem or question Clarify the problem Determine information needed and how to obtain it Organize the information obtained Interpret the results
All conclusions are tentative and subject to change as new evidence is uncovered (don’t PROVE things)
Chapter 1 - continued
The Nature of Research

Types of Research Experimental (most conclusive of methods)
Researcher tries different treatments (independent variable) to see their effects (dependent variable)
In simple experiments compare 2 methods and try to control all extraneous variables that might affect outcome
Need control over assignment to treatment and control groups (to make sure they are equivalent)
Sometimes use single subject research (intensive study of single individual or group over time)
Chapter 1 - continued
The Nature of Research (Types of Research continued)
Correlational Research Looks at existing relationships between 2 or more variables to make better predictions
Causal Comparative Research Intended to establish cause and effect but cannot assign subjects to trtmt/control Limited interpretations (could be common cause for both cause and effect…stress causes
smoking and cancer) Used for identifying possible causes; similar to correlation
Chapter 1 - continued
The Nature of Research (Types of Research continued)
Survey Research Determine/describe characteristics of a group Descriptive survey in writing or by interview Provides lots of information from large samples Three main problems: clarity of questions, honesty of respondents, return rates
Ethnographic research (qualitative) In depth research to answer WHY questions Some is historical (biography, phenomenology, case study, grounded theory)
Chapter 1 - continued
The Nature of Research (Types of Research continued)
Historical Research Study past, often using existing documents, to reconstruct what happened Establishing truth of documents is essential
Action Research (differs from above types) Not concerned with generalizations to other settings Focus on information to change conditions in a particular situation (may use all the above
methods)
Each of these methods is valuable for a different purpose

Chapter 1 - continued
The Nature of Research General Research Types Descriptive (describe state of affairs using surveys, ethnography, etc.) Associational (goes beyond description to see how things are related so can
better understand phenomena using correl/causal-comparative Intervention (try intervening to see effects using experiments)
Chapter 1 - continued
The Nature of Research Quantitative v. Qualitative
Quantitative (numbers) Facts/feelings separate World is single reality Researcher removed Established research design Experiment prototype Generalization emphasized
Chapter 1 - continued
The Nature of Research Meta-Analysis
Locate all the studies on a topic and synthesize results using statistical techniques (average the results)
Critical Analysis of Research (some say all research is flawed) Question of reality (are only individual perceptions of it) Question of communication (words are subjective) Question of values (no objectivity only social constructs) Question of unstated assumptions (researchers don’t clarify assumptions that guide them) Question of societal consequences (research serves political purposes that are conservative or
oppressive; preserve status quo)
Chapter 1 - continued
The Nature of Research
Overview of the Research Process (Fig. 1.4)
Introduction chapter Problem statement that includes some background info and justification for
study Exploratory question or hypothesis (relationship among variables clearly
defined); goes last in Ch. Definitions (in operational terms) Review of related literature (other studies of the topic read and summarized to
shed light on what is already known)

Chapter 1 - continued
The Nature of Research
Overview of the Research Process (Fig. 1.4)
Methods chapter Subjects (sample, population, method to select sample) Instruments (tests/measures described in detail and with rationale for their use) Procedures (what, when, where, how, and with whom);
Give schedule/dates, describe materials used, design of study, and possible biases/threats to validity
4. Data analysis (how data will be analyzed to answer research questions or test hypothesis)
Chapter 2
The Research Problem Statement of the Problem (identify a problem/area of concern to
investigate) Must be feasible, clear, significant, ethical
Research Questions (serve as focus of investigation, see p. 28 list) Some info must be collected that answers them (must be researchable) Cannot research “should” questions See diagram, p. 29
Chapter 2 - Continued
The Research Problem RQ should be feasible (can be investigated with available resources) RQ should be clear (specifically define terms used…operational needed, but give
both) Constitutive definitions (dictionary meaning) Operational definitions (specific actions/steps to measure term; IQ=time to solve puzzle,
where <20 sec. is high; 20-40 is med.; 40+ is low)
RQ should be significant (worth investigating; how does it contribute to field and who can use info)
RQs often investigate relationships (two characteristics/qualities tied together)
Chapter 3
Variables and Hypotheses Important to study relationships Sometimes just want to describe (use RQ)

Usually want to look for patterns/connections Hypothesis predicts the existence of a relationship
Variables (anything that can vary in measure; opposite of constant) Variables must be clearly defined Often investigate relationship between variables
Chapter 3 - Continued
Variables and Hypotheses Variable Classifications (Fig. 3.4, p. 42)
Quantitative (variables measured as a matter of degree, using real numbers; i.e. age, number kids)
Categorical (no variation…either in a category or not; i.e. gender, hair color) Independent: the cause (aka the manipulated, treatment or experimental variable) Dependent: the effect (aka outcome variable) Extraneous: uncontrolled IVs (see Fig. 3.2, p. 46)
All extraneous variables must be accounted for in an experiment
Chapter 3 - Continued
Variables and Hypotheses Hypotheses – predictions about possible outcome of a study; sometimes several hypotheses
from one RQ (Fig 3.3) RQ: Will athletes have a higher GPA that nonathletes?
H: Athletes will have higher GPAs that nonathletes
Advantages to stating a hypothesis as well as RQ Clarifies/focuses research to make prediction based on previous research/theory
Multiple supporting tests to confirm hypothesis strengthens it
Disadvantages Can lead to bias in methods (conscious or un) to try to support hypothesis
Sometimes miss other important info due to focus on hypothesis (peer review/replication is a check on this)
Chapter 3 - Continued
Variables and Hypotheses Some hypothesis more important than others Directional v. nondirectional Directional says which group will score higher/do better Nondirectional just indicates there will be a difference, but not who will score
higher/do better Directional more risky, so be careful/tentative in using directional ones
Chapter 4
Ethics and Research Examples of unethical practices Requiring participation from powerless (students) Using minors without parental permission

Deleting data that don’t agree w/ hypothesis Invading privacy of subjects Physically or psychologically harming subjects
APA statement of ethical principles in research Each student must sign one and have it signed by workplace supervisor
Chapter 4 - Continued
Ethics and Research Protecting participants from harm requires informed consent
Subjects must know the purpose of the study, possible benefits/harm; participation is voluntary and they can
w/draw without penalty any time (Fig. 4.3, p. 59)
Researchers should ask: Could subjects be harmed? Is there another way to get the info? Is the info valuable enough to justify study?
Researchers must ensure confidentiality of data (limit access; no names if possible; tell subjects confidential or anonymous)
Deceiving subjects is sometimes necessary (Milgram study), ask if results justify ethical lapse When deception used subjects they should be okay with it after (and they can refuse use of their data)
Chapter 4 - Continued
Ethics and Research Research with children
Parental consent required (signed permission from parents APA Ethics in Research Form addresses this also
Regulation of Research (National Research Act of 1974) If federal funding received must have an IRB to check: risks to subjects, informed consent
guidelines met, debriefing plans for subjects HHS made changes in 1981 so that educational research is exempt under certain conditions
Chapter 5
Review of the Literature Value of the Literature Review
Glean ideas from others interested in topic See results of related studies (must be able to evaluated those objectively)
Types of sources General References – indexes (of primary sources and abstracts (ERIC, Psych Abstracts) Primary Sources – publications where researchers report their results (peer reviewed/refereed
journals) Secondary Sources – publications where authors describe works of others (encyclopedias,
tradebooks, textbooks)
Chapter 5 - Continued
Review of the Literature Steps in the Literature Review (manual or electronic) See examples p.

74 Define problem precisely as possible Review some secondary sources* Review some general reference works* Formulate search terms (keywords/descriptors) Search general references for primary sources Obtain and read primary sources (make notes/summarize)
*May be based on existing knowledge or previous reading
Chapter 5 - Continued
Review of the Literature Making notes
Include problem/purpose; hypotheses/RQ; procedures w/ subjects/methods; findings/conclusions; citation!
Searching strategies…use Boolean operators (AND, OR, NOT) Searching www…be careful of reliability
Writing up the Literature Review Introduction - describes problem and justification for study;
Body – discuss related studies together (#2, p.88) Summary – ties literature together/give conclusions arising from literature
Reference list
Don’t replace a review of primary sources with meta-analysis (a combined review of all available research on a topic w/ results averaged)
End Part 1
Chapter 6
Sampling Sample – any group on which info is obtained Population – group that researcher is trying to represent Population must be defined first; more closely defined, easier to do, but less
generalizable Study a subset of the population because it is cheaper, faster, easier, and if
done right, get same results as a census (study of whole pop) Accessible population – the group you are able to realistically generalize to…may
differ from target population
Chapter 6 - Continued
Sampling (Random v. Nonrandom Sampling)
Random – every population element has an equal and independent chance to participate Uses names in a hat or table or random numbers Elimination of bias in selecting the sample is most important (meaning the

researcher does not influence who gets selected) Ensuring sufficient sample size is second most important
Nonrandom/purposive - troubles with representativeness/generalizing Chapter 6 - Continued
Sampling (Random Sampling Methods)
Simple random sampling Names in a hat or table of random numbers--p.99 Larger samples more likely to represent pop. Any difference between population and sample is random and small (called random sampling
error)
Stratified random sampling Ensures small subgroups (strata) are represented Normally proportional to their part of pop. Break pop into strata, then randomly select w/in strata Multistage sampling (see p. 94)
Chapter 6 - Continued
Sampling (Random Sampling Methods, cont.)
Cluster random sampling Select groups as sample units rather than individuals REQUIRES a large number of groups/clusters Multistage sampling (see p. 94)
Systematic (Nth) sampling Considered random is list if randomly ordered or nonrandom if systematic w/
random starting point Divide pop size by sample size to get N (ps/ss=N)
Chapter 6 - Continued
Sampling (Non-Random Sampling Methods)
Systematic can be nonrandom if list is ordered Convenience sampling
Using group that is handy/available (or volunteers) Avoid, if possible, since tend not to be representative due to homogeneity of groups Report large number of demographic factors to see likeliness of representativeness
Purposive sampling Using personal judgment to select sample that should be representative (i.e., this faculty
seems to represent all teachers) OR selecting those who are known to have needed info (interested in talking only to those in power)
Snowball is a type (used with hard to identify groups such as addicts)

Chapter 6 - Continued
Sampling Sample size affects accuracy of representation
Larger sample means less chance of error Minimum is 30; upper limit is 1,000 (see table)
External validity – how well sample generalizes to the population Representative sample is required (not the same thing as variety in a sample) High participation rate is needed Multiple replications enhance generalization when nonrandom sampling is used Ecological generalization (gen to other settings/conditions, such as using a method tested in
math for English class)
Video 17 Chapter 7
Instrumentation (Measurement)
Data – information researchers obtain about subjects Demographic data are characteristics of subjects such as age, gender, education level, etc. Assessment data are scores on tests, observations, etc. (the device used to measure these is
called the measurement instrument)
Key questions in data measurement/ instrumentation Where and when will data be collected How often will data be collected Who will collect the data
Chapter 7 - Continued
Instrumentation Validity – measures what it is supposed to (accurate) Reliability – a measure that consistently gives same readings
(repeatable) Objectivity – absence of subjective judgments (need to eliminate
subjectivity in measuring) Usability of instruments Consider ease of administration; time to administer; clarity of directions; ease of
scoring; cost; reliability/validity data availability
Chapter 7 - Continued
Instrumentation (Classifying Data Collection Instruments)

By the group providing the data Researcher instruments (researchers observes student performance and records) Subject instruments (subjects record data about themselves, such as taking test)
Others/Informants (3rd party reports about subjects such as teacher rates students)
By where instrument came from Preference is for existing ones (www.ericae.net, MMY
Can develop your own (requires time, effort, skill, testing; see p. 125)
By response type Written response – preferred – objective tests, rating checklist
Performance instruments – measure procedure, product
Chapter 7 - Continued
Instrumentation (Examples of Data Collection Instruments)
Researcher Completed Instruments Rating scales (mark a place on a continuum for example numeric rating 1=poor to 5=
excellent) Interview schedules (complete scales as interview takes place; use precoding; beware of
dishonesty) Tally sheets (for counting/recording frequency of behavior, remarks, activities, etc.) Flow charts (to record interactions in a room) Anecdotal records (need to be specific and factual) Time/Motion logs (record what took place and when)
Chapter 7 - Continued
Instrumentation (Examples of Data Collection Instruments)
Subject Completed Instruments Questionnaires (question clarity to reader essential) Self checklists Attitude scales (Likert is one type, how much subject agrees/disagrees with descriptive
statements about a topic indicates a positive/negative attitude toward topic) Semantic differential (good/bad; poor/excellent ratings) Personality profiles Achievement/Aptitude tests Performance tests Projective devices (Rorschach Ink Blot Test) Sociometric devises (peer ratings)
Chapter 7 - Continued
Instrumentation
Item Formats Selection items or closed response (T/F; Yes/No; Right/Wrong; Multiple choice) Supply items or open ended (short answer; essay) Unobtrusive measures (no intrusion into event… usually direct observation and recording)
Types of Scores Raw scores (initial score or count obtained…w/out context)

Derived scores (raw scores translated to meaningful usage with standardized process) Age/Grade equivalence; Percentile ranks; Standard scores (how far a score is from a given reference point,
i.e. z and T scores);
Which to use depends on the purpose; usually standard scores used
Chapter 7 - Continued
Instrumentation
Norm Referenced v. Criterion Referenced Tests Norm referenced scores give a score relative to a reference group (the norm
group) Criterion referenced scores determine if a criterion has been mastered
These are used to improve instruction since they indicate what students can or cannot do or do or do not know
Chapter 7 - Continued
Instrumentation (Measurement Scales)
Nominal (in name only) Numbers are only name tags, they have no mathematical value (gender: 1=male and 2= female OR race: 1=
Blk, 2=Wht, 3=other)
Ordinal (in name, plus relative order) Numbers show relative position, but not quantity (grade level, finishing place in a race)
Interval (in name w/ order AND equal distance) Numbers show quantity in equal intervals, but an arbitrary zero (can have negative numbers; degrees C or F)
Ratio (in name, w/ order, eq. distance AND absolute zero) Numbers show quantity with base of zero where zero means the construct is absent
Higher levels more precise…collect data at highest level possible; some statistics only work with higher level data
Chapter 7 - Continued
Instrumentation (Preparing for Data Analysis)
Scoring data – use exact same format for each test and describe scoring method in text
Tabulating and Coding – carefully transfer data from source documents to computer Give each test an ID number Any words must be coded with numerical values Report codes in text of research report
Video 18 Chapter 8
Validity and Reliability

(Quality of instruments is important)
Validity is most important aspect of measures Means accuracy, correctness, usefulness of instrument Validation is the process of collecting and analyzing evidence to support
inferences based on an instrument Test publishers usually give a statement of intended use as well as evidence to
support validity
Reliability (consistency in scoring) is part of validity
Chapter 8 - Continued
Validity and Reliability (Three ways to establish validity)
Content validity – is entire content of construct covered by test, are important parts emphasized? Established by expert judgment Facial validity is part of this
Criterion validity – is there consistency between the instrument and some predicted or concurrent criterion? Established by empirical evidence using validity coefficient (-1 to +1 scores) Correlate scores of the test with the criterion (SAT and GPA in college)
Chapter 8 - Continued
Validity and Reliability (Three ways to establish validity)
Construct validity – Does the measure correctly identify those with different levels of the construct Established with empirical evidence Correlate scores on test with known indicator of the construct (prisoners score
low on test of ethics)
Validity problems come from systematic error (also known as bias…something the research did wrong)
Chapter 8 - Continued
Validity and Reliability
Reliability means that scores are consistent from one time measuring to the next
Can have a reliable measure that may not be valid Must be reliable to be valid See p. 166, target shooting
Errors of measurement – there is always some variation from measure

to measure Look at reliability coefficient to determine reliability
Chapter 8 - Continued
Validity and Reliability (Three ways to establish reliability)
Test/Retest – give the same test (of enduring trait) to the same people at two times and correlate the scores
Equivalent forms – give two parallel forms of a test to the same people and correlate scores
Internal consistency – several methods Split halves (score two halves of test and correlate scores) KR-21 and Cronbach Alpha – Correlate each item to overall score
Chapter 8 - Continued
Validity and Reliability
Standard Error of Measurement – variations in measurement result in some error which is reported
Scoring Agreement – for subjective tests or direct observations (check of internal reliability)
Validity and Reliability should be addressed in all research (including qualitative)
Chapter 9
Internal Validity
(The IV really caused a change in the DV) Threats Subject characteristics/selection bias – when subjects in study or in trmt/cont
groups differ from each other (on age, gender, ability, etc) Loss of subj/Mortality – must address question of whether those dropping out
are different than those not Location/Experiment variables – characteristics of the school, classroom, etc.
may be interfere with the cause/effect relationship (keep constant for both groups)
Chapter 9 - Continued
Internal Validity

(The IV really caused a change in the DV) Threats (continued) Instrumentation – need constant application and scoring of instruments
Instrument decay – when scoring varies due to fatique Data collector characteristics (age, gender, etc.) influence results) … use same collector or
randomly assn Data collector bias – unconscious or conscious distortion of data (use single or double blind
technique)
5. Testing – pretest sensitization can occur or subjects can figure out acceptable answers
Chapter 9 - Continued
Internal Validity
(The IV really caused a change in the DV) Threats (continued) History – an external occurrence that interferes with relationship between IV and
DV Maturation – changes in relationship between IV and DV due to passage of
time/growth of subj Attitudes of Subjects – Hawthorne or guinea pig effects, novelty effects and
demoralization may occur Regression (toward the mean) – Low scorers do better in subsequent tests; high
scorers do worse Implementation – experiment differs for groups
Chapter 9 - Continued
Internal Validity
(The IV really caused a change in the DV) How to minimize threats: Standardized conditions Collect and report demogr characteristics of subj Identify/report details of study Select a design to minimize effects (true randomized experimental designs are
best)
See page 189, Fig. 9.10 for threats summary
End Part 2
Chapter 13
Experimental Research

Most powerful design Used to establish cause and effect by manipulating (influencing) an IV
(independent variable, aka treatment or experimental variable) to see its effect on a DV (dependent variable (aka criterion or outcome variable)
Goes beyond description and prediction
Chapter 13 - Continued
Experimental Research (Characteristics of Experimental Research)
Comparison of groups (at least two groups of subjects, called treatment and control groups) Manipulation of the IV (experimenter changes something for the treatment group that’s different
than the control group) Randomization (true experiments require random assignment into treatment/control
conditions…after random selection of subjects to participate in study) Assignment takes place at start of experiment
Do not use already formed groups Groups should be equivalent (any differences due to chance)
Randomization eliminates threats from extraneous variables Groups must be sufficiently large to be equivalent
Chapter 13 - Continued
Experimental Research (Control of Extraneous Variables)
All extraneous variables must be controlled to eliminate threats to validity/rival hypotheses Ensure groups are equivalent to begin using randomization Hold certain variables constant (i.e. age, IQ) or build them into to the design Use matching when necessary Use subjects as their own controls (treat same group first in control condition then in
treatment OR use pre-test/posttest on same group) Use analysis of covariance to statistically equate unequivalent groups
Chapter 13 - Continued
Experimental Research (Group Designs)
Weak Designs One Shot Case Study (X O)
One group exposed to treatment then DV is measured
No controls Example: Try new teaching method then see how students do on post test
One Group Pretest-Posttest Design (O X O) Adds a pretest but no control group
Static-Group Comparison Design X1 O Need control for diff subj characteristics X2 O
Static Group Pretest/Posttest Design (adds a pretest)

Chapter 13 - Continued
Experimental Research (Group Designs)
True Experimental Designs Randomized Posttest Only Design R X1 O (random assign to trtmt/cntrl, then posttest) R O Randomized Pretest/Posttest Control Group R O X1 O (controls history, maturation, etc.) R O X2 O Randomized Solomon 4-Group Design combines the above two (eliminates testing threat;
problem is number of subjects needed) Random Assignment w/ Matching
Match pairs on factors that influence DV then randomly assign to treatment or control (subjects limited by no
match elimination)
Statistical matching can be done using predicted scores
Chapter 13 - Continued
Experimental Research (Group Designs)
Quasi Experimental Designs Matching only – different from random assignment w/ matching (uses existing groups)
Match subjects in trmt and cntrl groups on known extraneous variables If possible, use multiple groups, and randomly assign them
Counterbalanced – Each group exposed to all the same treatments but in different order Time series – Repeated treatments and observations over a period of time (both before and
after treatment) Factoral designs – Multiple IVs or DVs investigated simultaneously (i.e. look for interactions
between 2 IVs)
Chapter 13 - Continued
Experimental Research (Controlling Threats to Internal Validity)
See Table 13.1, p. 284 for advantage/disadv. of each design To evaluate the likelihood of a threat to internal validity in experiments ask:
What are the known extraneous factors? Do the groups differ on them? How were they controlled?
Researchers need tight control for experiments to be successful See pp. 288-289 questions to evaluate published article See evaluation of selected article on pp. 290-299
Chapter 15

Correlation Research (Predicting Outcomes Through Association)
Correlational research involves study of existing relationships between two variables Descriptive in nature Often a precursor to experimental research Positive correlation is Hi/Hi and Lo/Lo (coeff. +r) Negative correlation is Hi/Lo and Lo/Hi (-r)
Purpose is to explain relationships or to predict outcomes
Chapter 15 - continued
-Correlation Research (Predicting Outcomes Through Association)
Explanatory studies examine relationship to identify possible cause/effect Relationship might or MIGHT NOT mean causation For causation: 1) A before B; 2) A and B related; 3) Rule out other causes of B (need
experiment)
Prediction studies identify predictors of criterions (i.e. HS GPA and College GPA) Scatterplots with regression line/equation predicts scores numerically The stronger the correlation the better the prediction
Chapter 15 – continued
Correlation Research (Predicting Outcomes Through Association)
Complex Correlation Techniques, such as multiple regression allow use of several predictors for one criterion Coefficient of multiple correlation (R) gives strength of correlation between predictors and
criterion Coefficient of determination (r2) is amount x and y vary together Descriminant function analysis is for non-quantitative criterion (predict which group someone
will be in) Other techniques also used (factor analysis, path analysis, structural modeling)
Chapter 15 - continued
Correlation Research (Steps in the process)
Problem selection – usually it’s are x and y related or how well does p predict c Sample – random selection of at least 30 Measurement – need quantitative data Design/Procedures – need two measures on each subject

Data collection – usually both measures close in time Data analysis – correlation coefficient, r, and plot (r is -1 to +1, and the closer to
plus or minus 1, the stronger the relationship)
Chapter 15 - continued
Correlation Research (Interpreting Correlation Coefficients)
General guideslines: +.75 to +1.0 Very strong relationship +.50 to +.75 Moderate strong relationship +.25 to +.50 Weak relationship +.00 to +.25 Low to no relationship
Need .5 or better for prediction of any use, and .65 for accurate predictions
Reliability coefficients should be .7 up Validity coefficients should be .5 up
Chapter 15 - continued
Correlation Research (Threats to Internal Validity in Correlation Research)
Remember correlation is not causation (lurking variables) Subject characteristics – may get different correl w/ different ability levels, gender, etc. (can
control with partial correlation) Location – testing conditions can impact results Instrumentation problems – helps to standardize instrument and data collection for both groups Testing – pretest interference and sensitization possible Mortality – be careful if have large loss from one group being tested
Chapter 15 - continued
Correlation Research (Questions to ask to avoid threats to internal validity)
What factors could affect the variables being studied? Does any factor affect BOTH variables? (this is where threats occur) Figure a way to control any lurking variables
Chapter 16
Causal Comparative Research (Ex Post Facto)
Determines cause (or effect) that has occurred and looks for effect (or cause) from it Start w/ differences in groups and examine them Examples: Difference in math abilities of male/female stu

No random assignment to treatment (it already occurred) Associational like correlation but primarily interested in cause/effect IV either cannot (ethnicity) or should not (smoking) be manipulated
Chapter 16 - continued
Causal Comparative Research (Ex Post Facto)
Often an alternative to experimental (faster and cheaper) Serious limitation is lack of control over threats to internal validity Need to remember the cause may be the effect; they may only be
related and there is some other variable that is the cause (lurker) Remember three canons of causation
Chapter 16 - continued
Causal Comparative (CC) Research (CC versus Correlational Research)
Both are associational (looking for relationship) Both are often prelude to experiments Neither involves manipulation of variables CC works with different groups; correl examines one group on different
variables Correlation is measured w/ coefficient while CC compares
means/medians/percents of group members
Chapter 16 - continued
Causal Comparative (CC) Research (CC versus Experimental Research)
Both compare group scores of some type In experimental the IV is manipulated, but not in CC (already took place) CC does not provide as strong evidence as experimental for cause and
effect
Chapter 16 - continued
Causal Comparative (CC) Research (Steps in CC Research)
Problem formation – identify phenomena and look for causes or consequences of it Sometimes several alternate hypotheses investigated
Sample – define (operationally) characteristics of study carefully, then select individuals who possess Groups should be homogeneous in regard to several important variables (to control for them as causes) then
match control/exp groups on one or more variables (smoking study matched on 19 variables)
Instruments – use any type to compare the groups Design – basic CC involves 2 or more grps that differ on variable of interest (basic design is one

group possesses trait (athlete) other doesn’t compare DV (GPA)
Chapter 16 - continued
Causal Comparative (CC) Research (Threats to Internal Validity in CC Research)
Subject characteristics – since don’t select subjects and form groups, there may be unidentified lurking variables Can use matching to control for any identified differences, but limits samples size Can find or create homogeneous groups (for example compare only high GPA students to
other high GPA students) on attitudes toward x Statistical matching – adjusts posttest scores based on some initial difference
Other threats – location, instrument, history, maturation, loss of subjects can be concerns Need to control as many as possible to eliminate alternate hypotheses
Chapter 16 - continued
Causal Comparative (CC) Research (Evaluating threats to Internal Validity in CC Research)
Questions to ask What factors are known to affect the variable being studied? What is the likelihood the comparison groups differ on these factors? How well did the design identify and control for these?
For example consider subject characteristics such as socioeconomic status, gender, ethnicity, job skills; mortality rates in groups; location (schools differ); instrument (differrent data collectors and/ or biases)
Data Analysis in CC – often compare means of groups; with 2 categorical use crosstabs (crossbreak tables) to compare percents by groups
Text gives example study
Chapter 17
Survey Research (Used to describe what people think/do/believe)
Types Cross sectional provide a snapshot in time Longitudinal collect data at different points in time to study changes over time
Trend study - random sample each year on same topic Cohort study - sample from same cohort members year after year Panel study - same individuals surveyed year after year (mortality a problem over long time
periods)
Often surveys are the data collection instrument in correlation (or cc/exp’l) studies
Chapter 17 - Continued
Survey Research (Steps to conduct survey research)

Define the problem Needs to be important enough respondents will invest their time to complete it Must be based on clear objectives
Identify the target population Defined by sample unit or unit of analysis Unit can be a person, school, classroom, district, etc.) Survey a sample or do a census of the population
Chapter 17 - Continued
Survey Research (Steps to conduct survey research)
Methods of data collection Direct administration to a group (such as at a meeting) - good response rate, limited
generaliz. Mail survey (inexpensive way to get large amount of data from widespread pop) - lower
response rates, not in-depth info, illiterate missed Telephone survey (cheap/fast) - response rates higher due to encouragement (“I’m not
selling…”); miss some pop members, interviewer bias possible Personal interviews (face-to-face has good response rate but time and cost high) - lack
anonymity, interviewer bias
Chapter 17 - Continued
Survey Research (Steps to conduct survey research)
Select the sample (randomly, but check to see respondents are qualified to answer) Pilot test can indicate likely response rate and problems with data collection or
sample
Prepare instrument (questionnaire and interview schedule) Appearance important - look short and easy Clarity in questions is essential
Chapter 17 - Continued
Survey Research (Steps to conduct survey research)
Question types (same questions need to be asked of all respondents) Closed ended (multiple choice) - easier to complete, score, analyze
Categories must be all inclusive, mutually exclusive
Open ended - easy to write, hard to analyze and hard on respondents See examples p. 403

Chapter 10
Descriptive Statistics (Tools to summarize data)
Descriptive statistics describe many scores with just one or two indices (such as mean or median) Sample of a pop is described w/ indices called statistics Entire pop is described w/ indices called parameters
Types of data (words or numbers) Quantitative data – scales measure how much (test scores, amount of money spent, etc.
Interval, Ratio, and sometimes Ordinal, variables
Categorical data – total number of objects in a category (ethnicity, gender, etc.) Nominal and sometimes Ordinal, variables
Chapter 10 - Continued
Descriptive Statistics (Summarizing Quantitative Data)
Frequency distributions or tables show the layout of the data (see text example p. 201) Frequency polygons – shows where most scores are and how spread out data
are Pay attention to shape (positive, negative skews) Normal curves – smoothed polygons – most scores in the center, fewer in the tails – many
variables follow a normal shape (height, weight, age, etc.) Normal curves are the foundation for inferential statistics
Chapter 10 - Continued
Descriptive Statistics (Summarizing Quantitative Data)
Averages – measures of of central tendency Three indices tell what is a typical score
Mode – most frequent score Median – middle score (50th percent)
Mean – takes into account all scores
Which to use depends on what you are trying to show See example pp. 205/206
Spreads – measures of variation or dispersion Three indices tell how closely scores cluster together
Range (highest – lowest); a crude indicator of spread
Standard deviation (average distance of each point from the mean) Smaller SD means less spread out, larger one means more spread out
Quartiles, percents, IQR, boxplots
SD and normal curves…68/95/99.7 rule
Chapter 10 - Continued
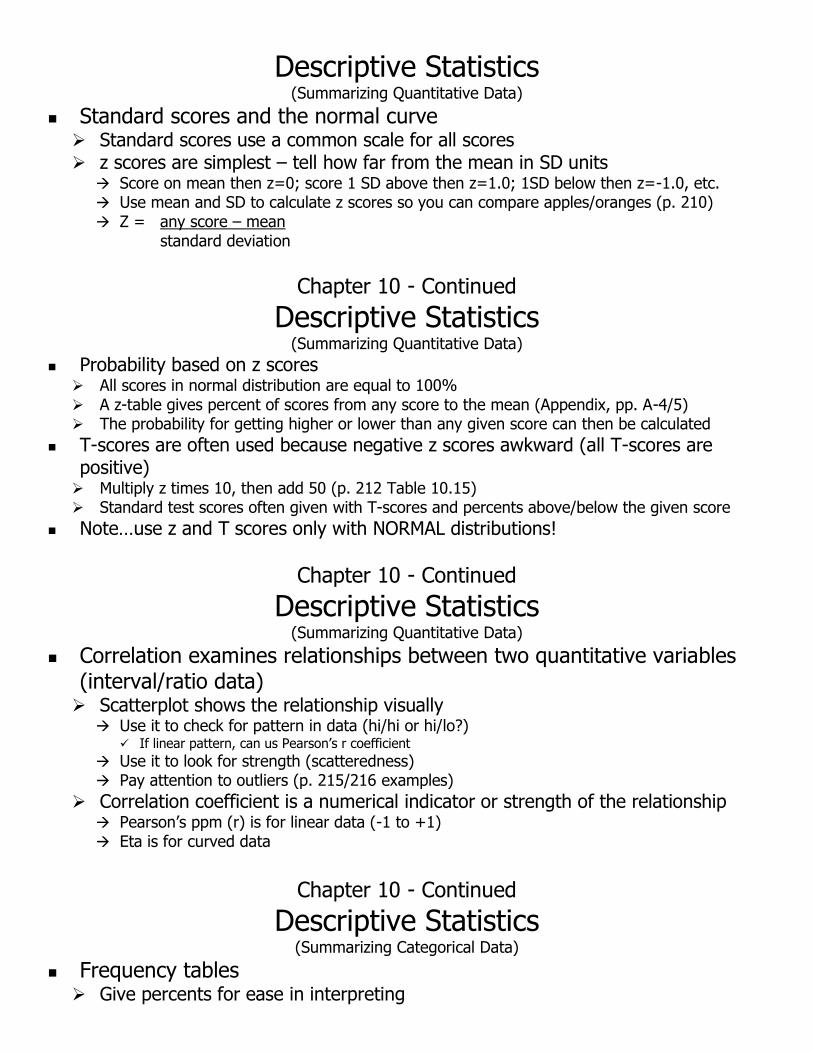
Descriptive Statistics (Summarizing Quantitative Data)
Standard scores and the normal curve Standard scores use a common scale for all scores z scores are simplest – tell how far from the mean in SD units
Score on mean then z=0; score 1 SD above then z=1.0; 1SD below then z=-1.0, etc. Use mean and SD to calculate z scores so you can compare apples/oranges (p. 210) Z = any score – mean
standard deviation
Chapter 10 - Continued
Descriptive Statistics (Summarizing Quantitative Data)
Probability based on z scores All scores in normal distribution are equal to 100% A z-table gives percent of scores from any score to the mean (Appendix, pp. A-4/5) The probability for getting higher or lower than any given score can then be calculated
T-scores are often used because negative z scores awkward (all T-scores are positive) Multiply z times 10, then add 50 (p. 212 Table 10.15) Standard test scores often given with T-scores and percents above/below the given score
Note…use z and T scores only with NORMAL distributions!
Chapter 10 - Continued
Descriptive Statistics (Summarizing Quantitative Data)
Correlation examines relationships between two quantitative variables (interval/ratio data) Scatterplot shows the relationship visually
Use it to check for pattern in data (hi/hi or hi/lo?) If linear pattern, can us Pearson’s r coefficient
Use it to look for strength (scatteredness) Pay attention to outliers (p. 215/216 examples)
Correlation coefficient is a numerical indicator or strength of the relationship Pearson’s ppm (r) is for linear data (-1 to +1) Eta is for curved data
Chapter 10 - Continued
Descriptive Statistics (Summarizing Categorical Data)
Frequency tables Give percents for ease in interpreting

Crossbreak or crosstabulations for relationships (IV goes on the side, then give row percents)
Bar charts and pie charts used Bars for ordered categories Pies for unordered categories
Chapter 11
Inferential Statistics
Inferences about a population based on data from a sample Answers questions about how likely a sample is to represent some
parameter about a population Inferential test used depends on the level of data (quantitative or
categorical) Chapter 11 - Continued
Inferential Statistics (The logic of inferential statistics)
Sampling error Samples differ from their parent populations (no two samples are the same) Difference is called sampling error
Distribution of sampling means (the sampling distribution) Large collections of random samples of at least 30 follow a normal curve pattern Its mean (mean of means) is the mean of the population Its SD (SD of means) is the standard error of the mean (SEM)
Chapter 11 - Continued
Inferential Statistics (The logic of inferential statistics)
Standard error of the mean (SEM) It’s the SD of the sampling distribution Since distribution is normal, then +1SEM has 68% of cases; +2SEM has 95%; +3SEM has
99.7% Once we can estimate the mean and SD of the sampling distribution can determine how likely it is that a
particular sample mean came from that population i.e. Mean of pop=100, SD=10 and draw a sample with a mean of 110, yes could be from that pop…but if
draw a sample with a mean of 140, most likely NOT from that pop…since is +4SEM from the mean (almost zero probability)
Express means as z scores; a z score move that 2SEM is going to occur less than 5% of the time (2.5% each side)
Chapter 11 - Continued
Inferential Statistics (The logic of inferential statistics)
Estimating the SEM It is estimated from the SD of the sample, adjusted for sample size: SEM=SD/√n-1

Confidence Intervals (CI) Use the SEM to indicate boundaries 95% of the time a pop mean will be within +2 SEM from the sample mean (actually + 1.96
SEM) If sample mean IQ=85 (& SEM=2) then 95% of the time the pop mean IQ will be 85+1.96(2)
or 85 +3.92 which is 81.08 to 88.92; 99% CI=79.84 to 90.16 Can be 95% confident that true pop mean is 81.08-88.92
Chapter 11 - Continued
Inferential Statistics (The logic of inferential statistics)
Probability is a predicted occurrence such as 5 in 100 times (5% or .05) In previous example, the probability of the population mean being outside the 95% CI (of
81.08 to 88.92) is 5%
Usually comparing more than one mean Examine difference in 2 sample means to see if how likely the difference in the sample is to
represent a true difference in the population…is it due to a true difference in the pop or only due to sampling error
The SEM of the difference between sample means, called the SED or standard error of the difference is used and w/in +1SED is 68%; +2 SED is 95%; +3 SED is 99%
Chapter 11 - Continued
Inferential Statistics (Hypothesis Testing)
A hypothesis is a predicted relationship Usually comparing means, proportions, or looking for correlations between
groups The heart of infer. stats…is the relationship found in the sample most likely due
to a relationship in the pop, or just due to random sampling error?
The null hypothesis is stated and tested THE NULL ALWAYS SAYS THERE IS NNOO RELATIONSHIP OR
DIFFERENCE!!! Chapter 11 - Continued
Inferential Statistics (Hypothesis Testing)
Research hypothesis is what you really think is going on; opposite of the null Example of hypothesis test
H0 (null) is that mean1=mean2, meaning the mean scores are equal OR the difference between the mean scores is 0
The distribution for a difference of zero between the means is a normal curve centered on zero
As diff between means gets larger, meaning further from the center (in SEM units), the more likely it is to represent a true diff in the pop means

If the prob is .05 or less, reject null…called a statistically significant difference (some fields use .01 or .001)
Chapter 11 - Continued
Inferential Statistics (Hypothesis Testing Process)
State the research hypothesis (Ha or Hr) State the null (H0) (Remember NO) Obtain the sample statistics (means, proportions, correlations) Determine the probability of getting the sample results just by chance if the null is true Small probability (p<.05) means reject null; there is a significant difference (or correlation) in
pop. Large probability (p>.05) means do not reject; there is no significant difference (or correl) in
pop. Note: Just because finding is statistically significant does not mean it is a practical difference
(given a large enough sample most are significant)
Chapter 11 - Continued
Inferential Statistics (Hypothesis Testing)
One tailed versus two tailed tests When literature strongly indicates the need for directional hypothesis then do a
one-tail In a one tail all 5% is on one side (2-tailed cutoff is 1.96SD while 1 tailed cutoff
is 1.65)
Type I (alpha) versus Type II error See Figure 11.16, p. 240 Type I – reject true null; Type II – accept a false Inversely related errors
Chapter 11 - Continued
Inferential Statistics (Inference Techniques)
Parametric tests (for quantitative I/R data from normal distributions of sample size 30+) t-tests compare means of two groups (can be independent or correlated/paired samples) ANOVA tests compare means of two or more groups (use post hoc)
Correlations t-test (with computers just use significance of r)
Nonparametric tests (for categorical data and I/R from non-normal pops or small samples) Mann Whitney U compares ranks of two groups
Kruskal Wallis Oneway ANOVA compares ranks of two plus groups Chi-square test (compares proportions)
Power of tests – use parametrics and increase sample size
Chapter 12
Statistics in Perspective

Approaches to research Either 2 or more groups compared OR variables in 1 group studied AND data are either
categorical or quantitative
Comparing groups on quantitative data Can compare freq distributions (histograms), m. of center, and m. of spread OR all three Interpretation – improves with experience…need to know when something statistically
significant is not practically significant Calculate effect size - look at size of difference or delta Δ…if it is greater than .5, practically
significant Use infer. stats judicially paying attention to size of diff. and sample size and method it is
based on
Chapter 12 - continued
Statistics in Perspective
Relating variables within group w/ quant data Scatterplot and correl coeff – examine plot carefully Beyond significance pay attn to size of r and especially to r-squared Examine how sample data collected
Comparing groups w/ categorical data Use freq and percent in crossbreak tables Look at summary stats carefully and pay attn to sample size
Relating variables within a group with categorical data – use one sample chi-square
Chapter 12 - continued
Statistics in Perspective
Recap Use graphics and numbers Pay attention to outliers Pay attention to magnitude of differences Use inference tests for generalizing purposes and examine sampling Use multiple techniques and CIs