Embed Size (px)
Citation preview
Oh the Production
Possibilities
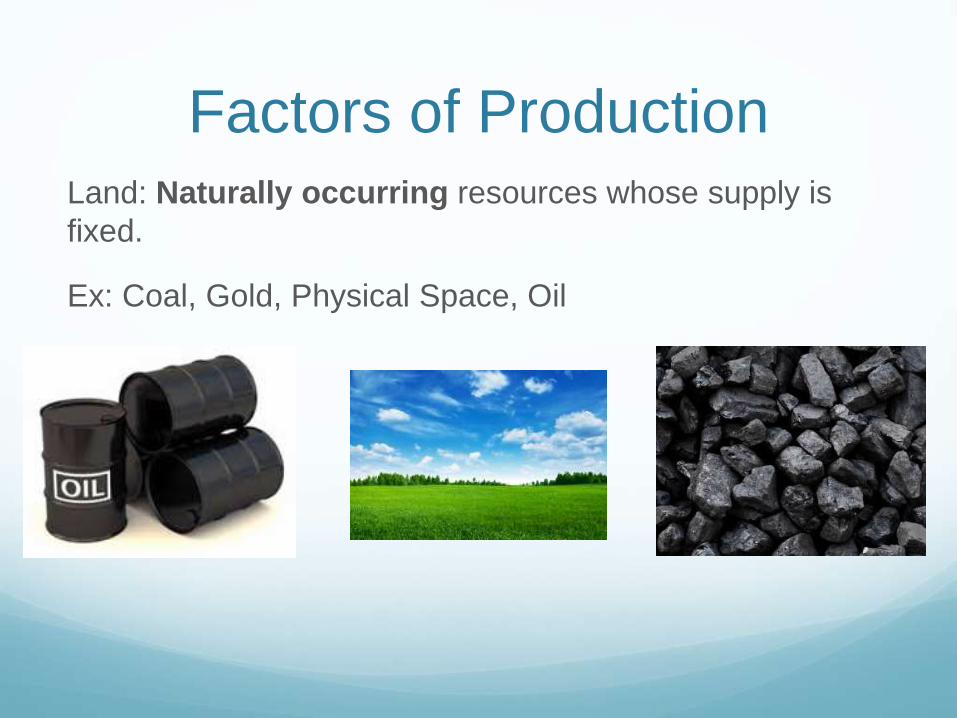
Factors of ProductionLand: Naturally occurring resources whose supply is
fixed.
Ex: Coal, Gold, Physical Space, Oil
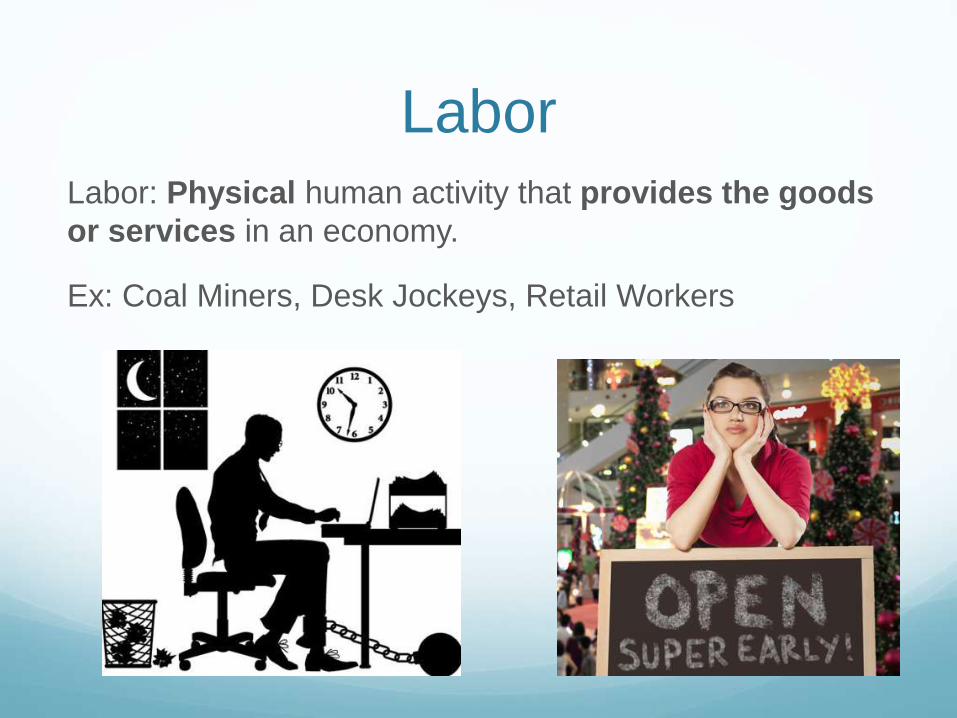
LaborLabor: Physical human activity that provides the goods
or services in an economy.
Ex: Coal Miners, Desk Jockeys, Retail Workers
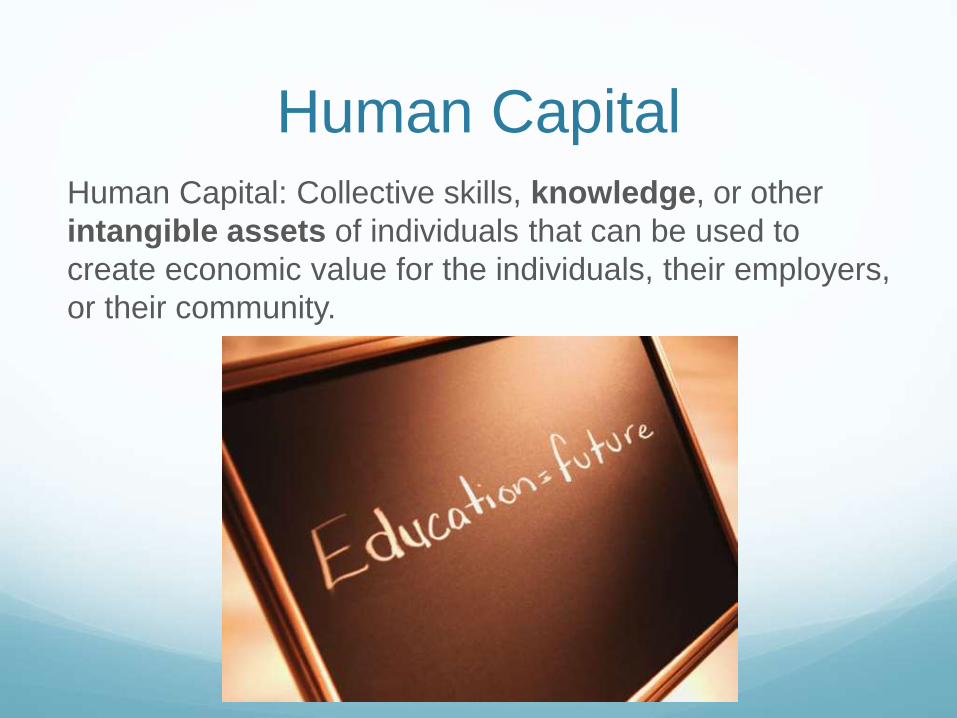
Human CapitalHuman Capital: Collective skills, knowledge, or other
intangible assets of individuals that can be used to
create economic value for the individuals, their employers,
or their community.
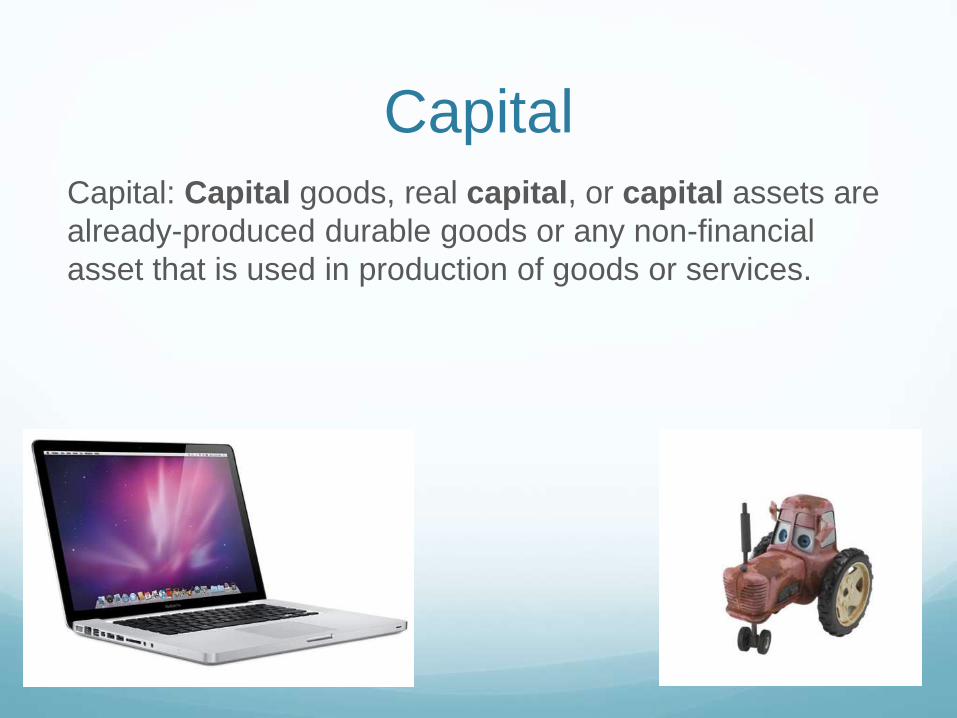
CapitalCapital: Capital goods, real capital, or capital assets are
already-produced durable goods or any non-financial
asset that is used in production of goods or services.
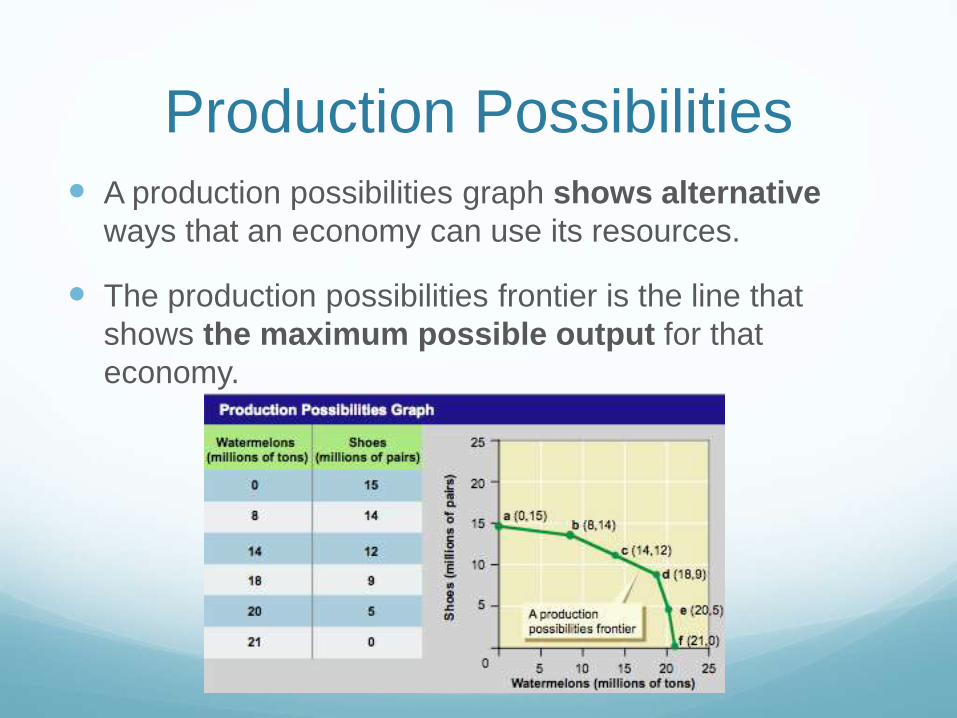
Production Possibilities A production possibilities graph shows alternative
ways that an economy can use its resources.
The production possibilities frontier is the line that
shows the maximum possible output for that
economy.
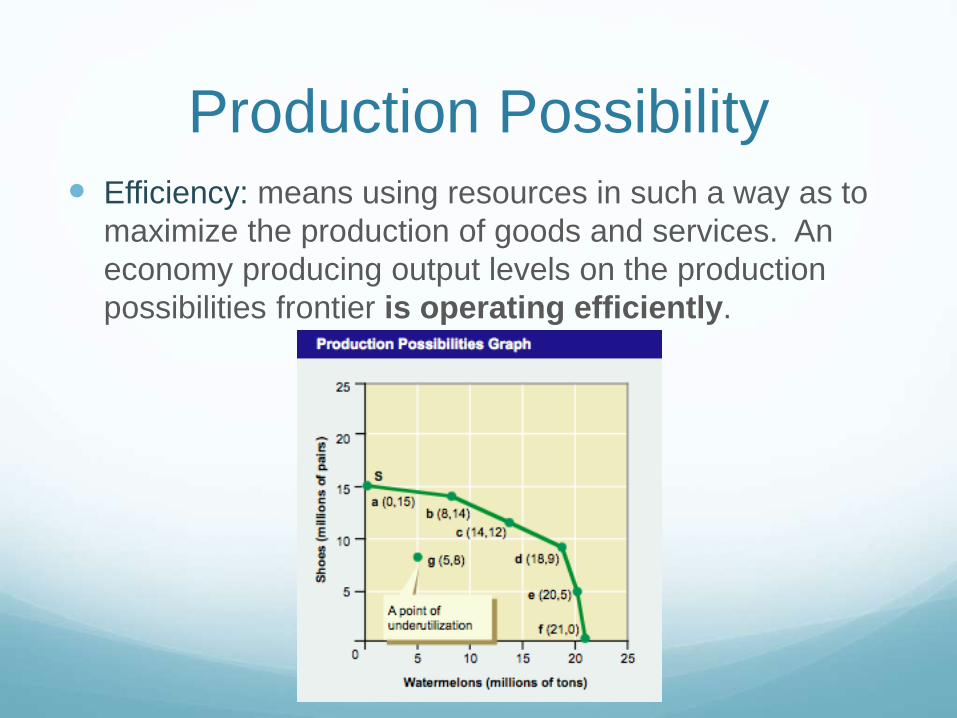
Production Possibility Efficiency: means using resources in such a way as to
maximize the production of goods and services. An
economy producing output levels on the production
possibilities frontier is operating efficiently.

Production Possibilities Growth If more resources become available, or if
technology improves, an economy can increase its
level of output and grow. When this happens, the
entire production possibilities curve “shifts to the
right.”
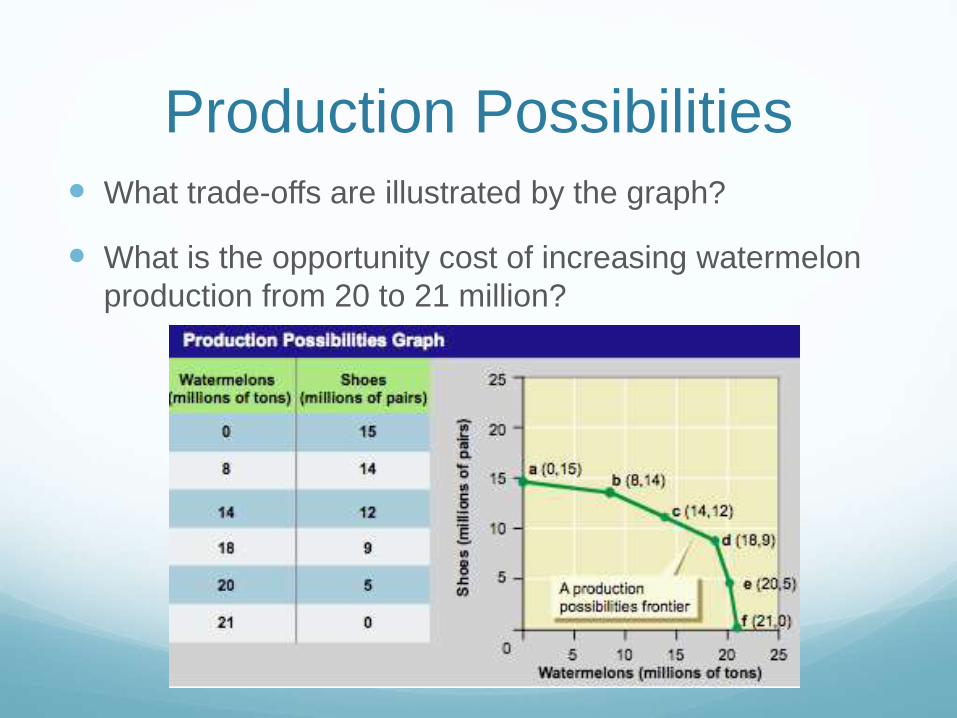
Production Possibilities What trade-offs are illustrated by the graph?
What is the opportunity cost of increasing watermelon
production from 20 to 21 million?

Opportunity Costs The opportunity cost of moving from a to b is…
The opportunity cost of moving from b to d is…
The opportunity cost of moving from d to b is…
The opportunity cost of moving from f to c is…
What can you say about point G?
Unattainable
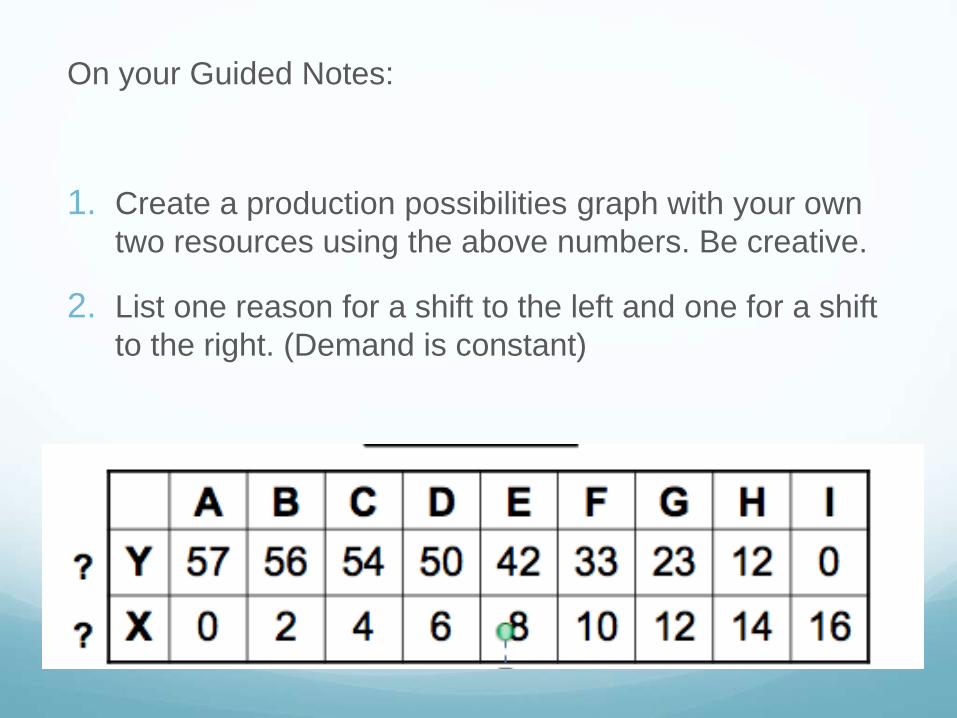
On your Guided Notes:
1. Create a production possibilities graph with your own
two resources using the above numbers. Be creative.
2. List one reason for a shift to the left and one for a shift
to the right. (Demand is constant)
Simulation: In Real LifeIn this simulation, students will become a “business owner” or a “provider.”
The “Business Owner” will receive money and a scenario sheet. They will have to map their own production possibility curve and figure out what they need (land ,labor, or resource capital) in order to shift their curve to the right. Then they will buy their factor of production. Once they have purchased their item they will graph another curve showing their shift.
“Providers” will have a sheet of information that tells the owner how much money they need to buy their factor of production as well as their own scenario. “Providers” will sell their products and read the scenario to the “business owners.”
Make that money!