Embed Size (px)
Citation preview
Our Climate for Academic Success:
What we’ve done to improve school climate at College Park High?
• The LCAP stipulates measuring school climate, including data such as surveys of pupil, teacher, and parent perceptions of school safety and connectedness.
• School climate lies at the very heart and purpose of the LCAP.
• Relates to all other priorities and overall goal of improving learning conditions and supports, stakeholder engagement, and student achievement.
• It’s what makes it possible to meet these priorities.
School Climate: An LCAP Priority
• The conditions and quality of the learning environment that affect the attitudes, behaviors, and performance of students, staff, and parents.
• How one experiences school life:
• The cultural: norms, values, expectations, beliefs• The social: interpersonal relationships• The organizational: instructional practices and leadership• The physical: building and property maintenance
• An umbrella concept to frame an integrated, comprehensive, effective approach to school improvement.
“Personality is to the individual what climate is to the school.”
What is School Climate?
• Engages youth in learning, promotes positive development and well-being, and creates conditions for success in school, career, and life through:
• Physical and emotional safety• Positive relationships among and between students, staff, & parents• High academic and behavioral expectations • Participatory opportunities and decision-making• A web of comprehensive supports that holistically address student needs
and the learning barriers they experience• Fostering of social-emotional as well as cognitive skills
What is a Positive School Climate (PSC)?
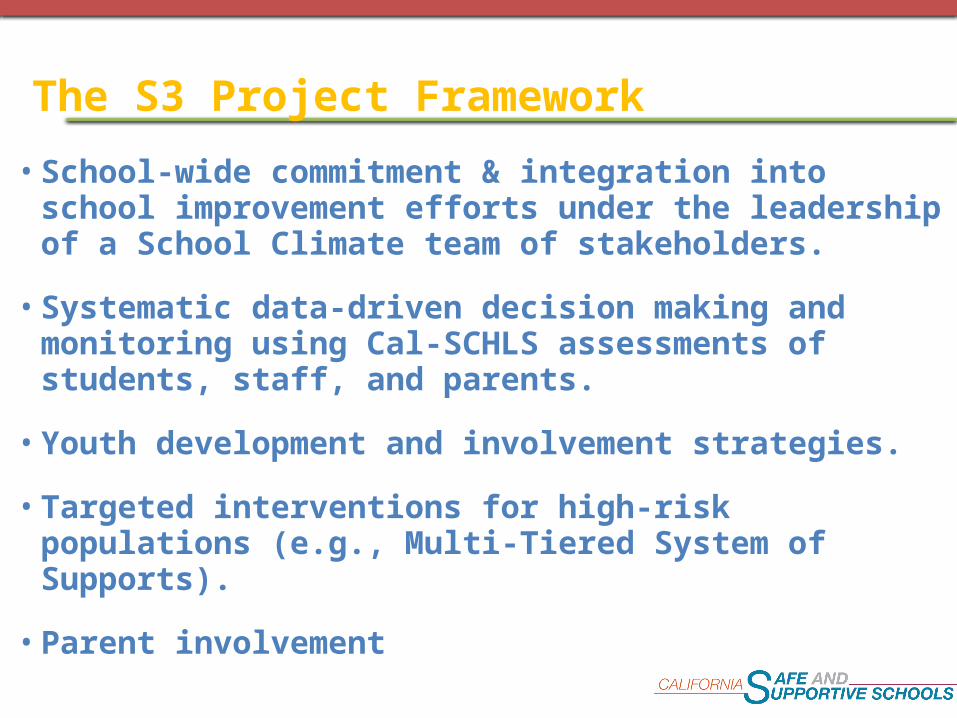
• School-wide commitment & integration into school improvement efforts under the leadership of a School Climate team of stakeholders.
• Systematic data-driven decision making and monitoring using Cal-SCHLS assessments of students, staff, and parents.
• Youth development and involvement strategies.
• Targeted interventions for high-risk populations (e.g., Multi-Tiered System of Supports).
• Parent involvement
The S3 Project Framework
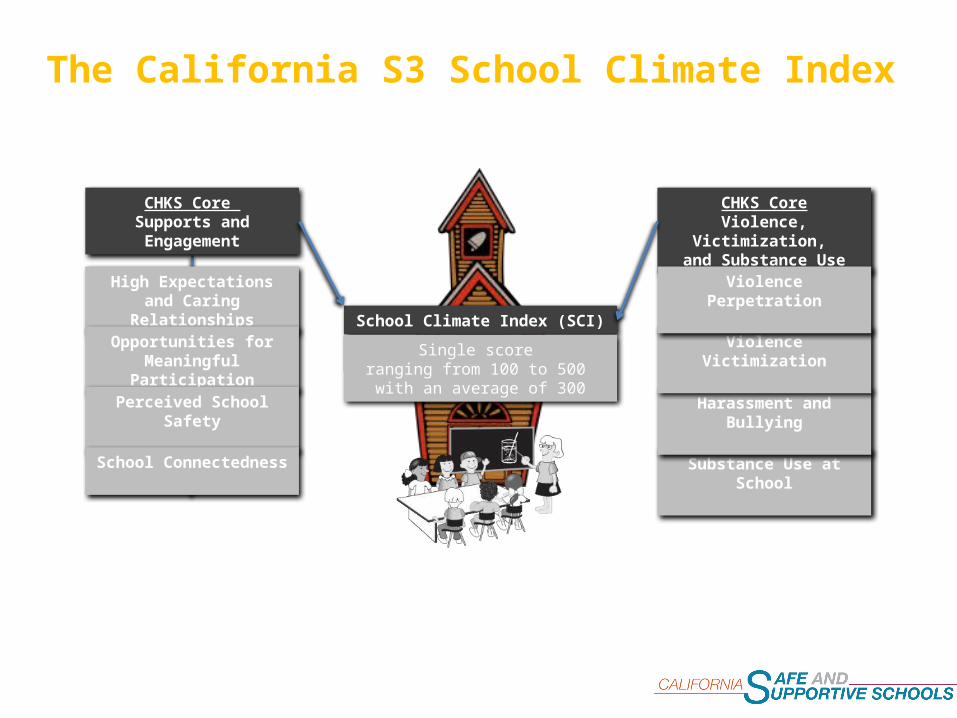
The California S3 School Climate Index
High Expectations and Caring Relationships
CHKS Core Supports and Engagement
CHKS CoreViolence, Victimization,
and Substance Use
Opportunities for Meaningful Participation
Perceived School Safety
Substance Use at School
Harassment and Bullying
Violence Victimization
Violence Perpetration
School Connectedness
School Climate
School Climate Index (SCI)
Single score ranging from 100 to 500 with an average of 300
279
290
300
311
318
307
296
286
271
269
267
265
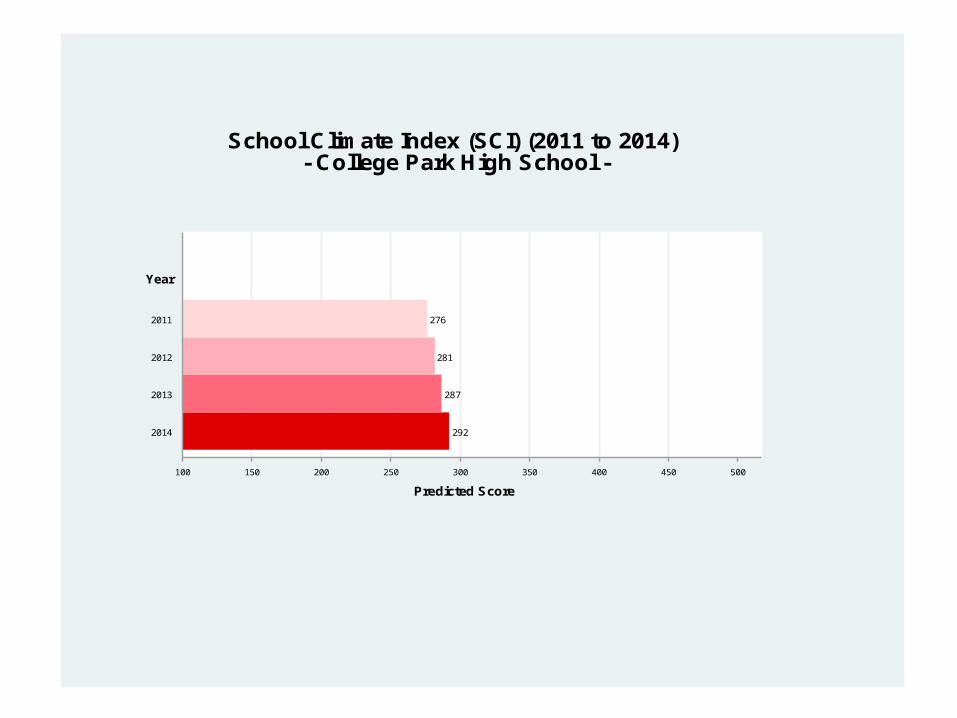
292
287
281
276
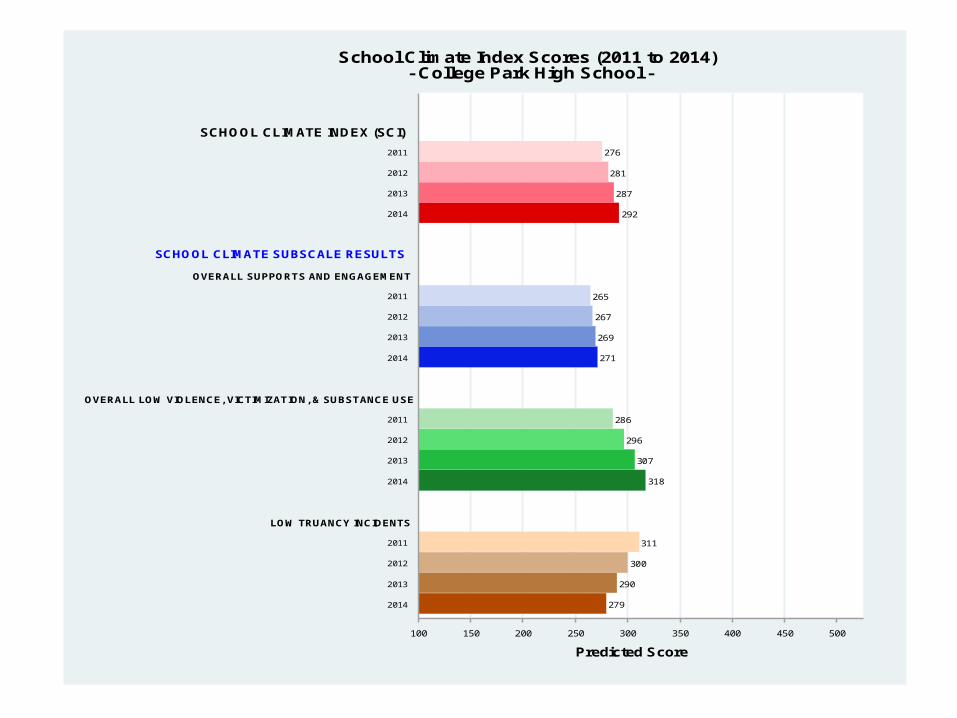
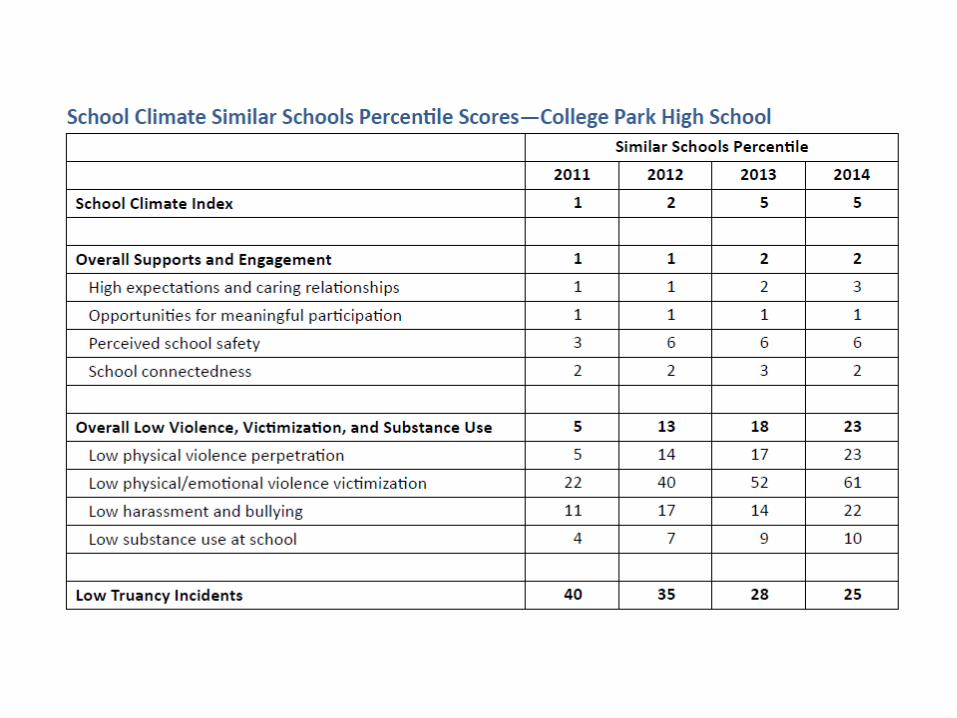
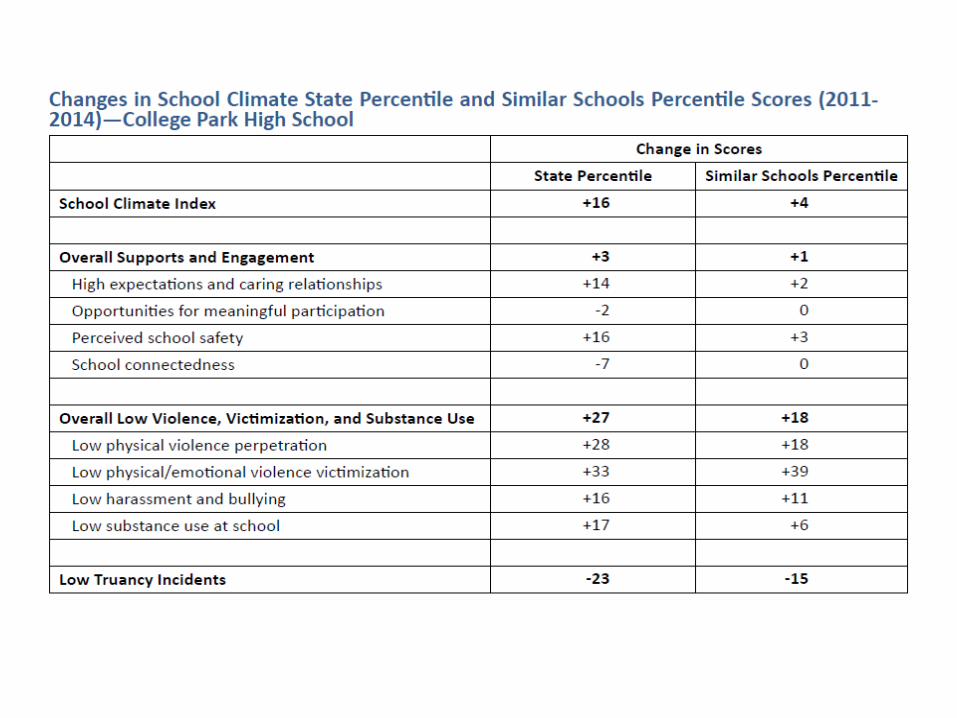
SCHOOL CLIMATE SUBSCALE RESULTS
100 150 200 250 300 350 400 450 500
Predicted Score
2014
2013
2012
2011
LOW TRUANCY INCIDENTS
2014
2013
2012
2011
OVERALL LOW VIOLENCE, VICTIMIZATION, & SUBSTANCE USE
2014
2013
2012
2011
OVERALL SUPPORTS AND ENGAGEMENT
2014
2013
2012
2011
SCHOOL CLIMATE INDEX (SCI)
School Climate Index Scores (2011 to 2014) - College Park High School -
292
287
281
276
100 150 200 250 300 350 400 450 500
Predicted Score
2014
2013
2012
2011
Year
School Climate Index (SCI) (2011 to 2014) - College Park High School -
256
260
264
268
301
295
289
283
250
251
252
254
254
243
231
220
271
269
267
265
100 150 200 250 300 350 400 450 500
Predicted Score
2014
2013
2012
2011
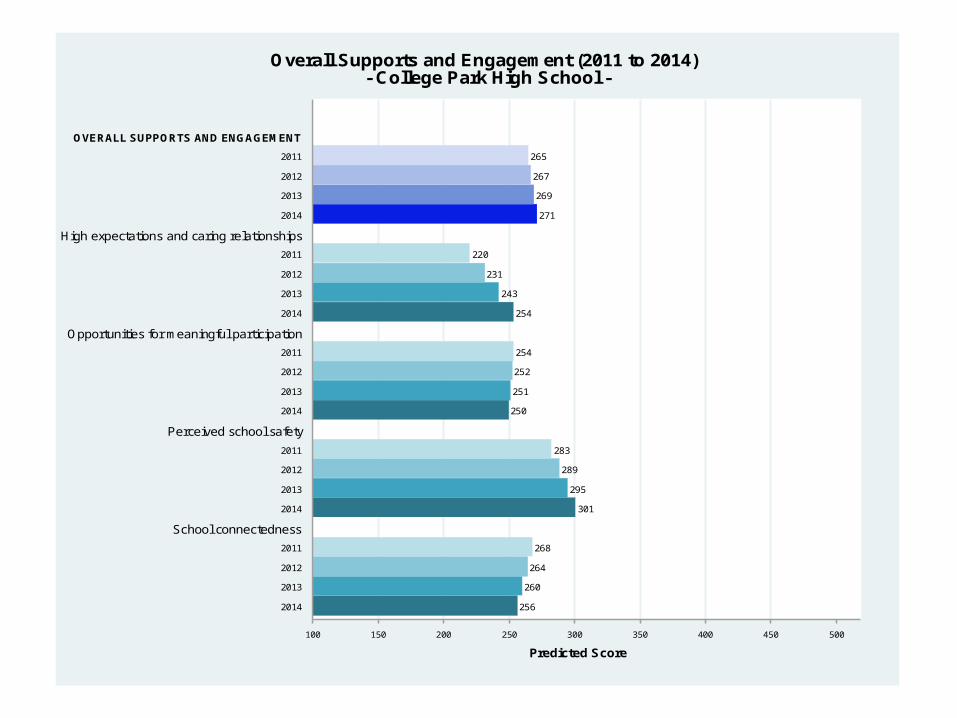
School connectedness
2014
2013
2012
2011
Perceived school safety
2014
2013
2012
2011
Opportunities for meaningful participation
2014
2013
2012
2011
High expectations and caring relationships
2014
2013
2012
2011
OVERALL SUPPORTS AND ENGAGEMENT
Overall Supports and Engagement (2011 to 2014) - College Park High School -
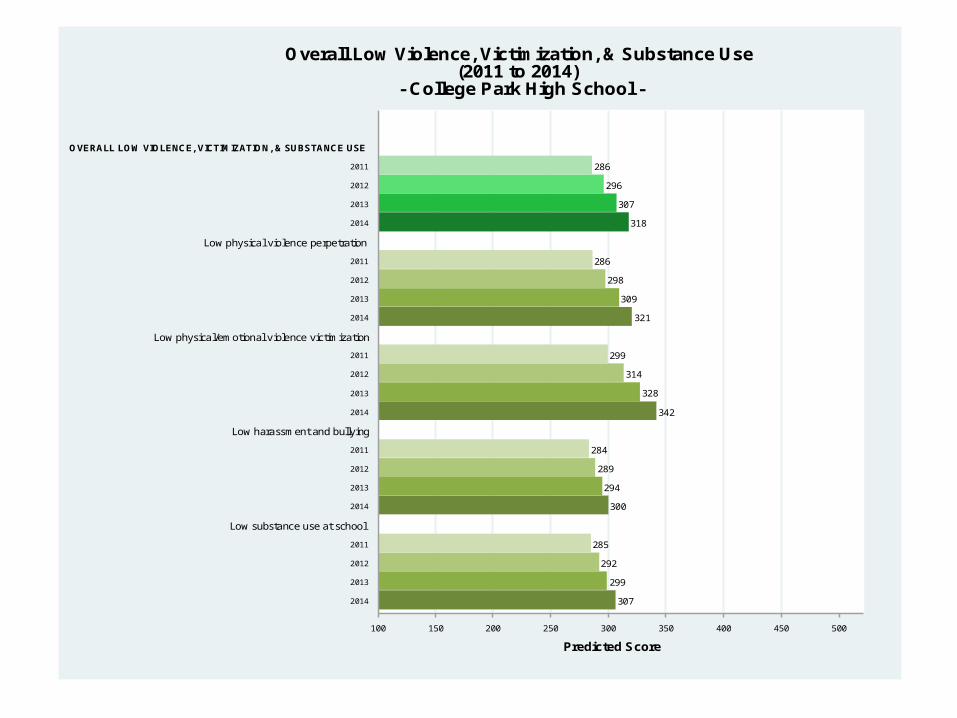
307
299
292
285
300
294
289
284
342
328
314
299
321
309
298
286
318
307
296
286
100 150 200 250 300 350 400 450 500
Predicted Score
2014
2013
2012
2011
Low substance use at school
2014
2013
2012
2011
Low harassment and bullying
2014
2013
2012
2011
Low physical/emotional violence victimization
2014
2013
2012
2011
Low physical violence perpetration
2014
2013
2012
2011
OVERALL LOW VIOLENCE, VICTIMIZATION, & SUBSTANCE USE
Overall Low Violence, Victimization, & Substance Use(2011 to 2014)
- College Park High School -
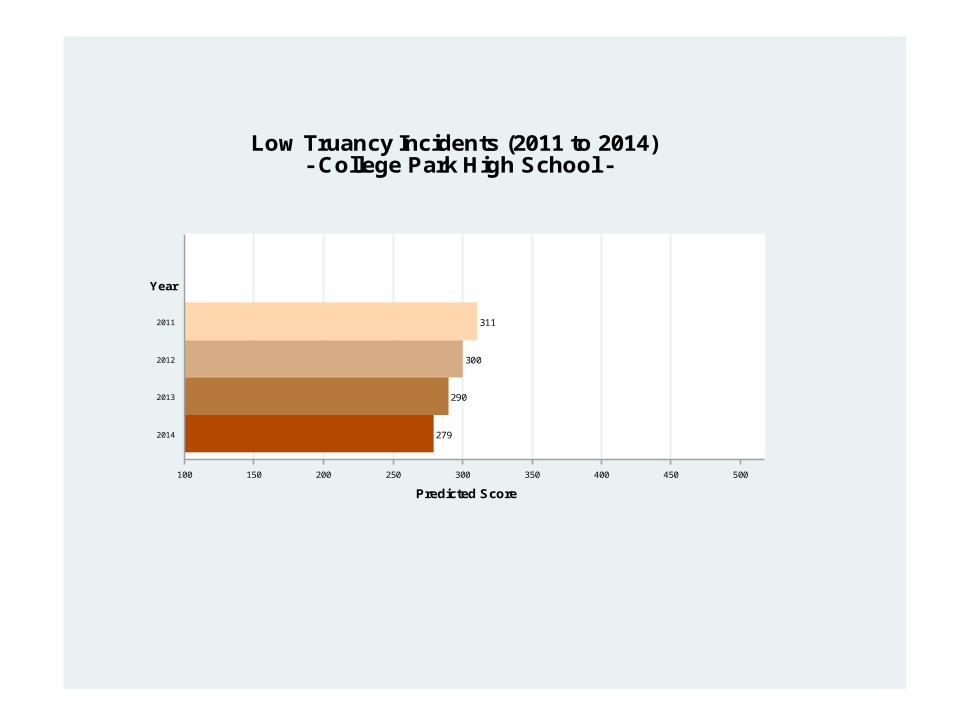
279
290
300
311
100 150 200 250 300 350 400 450 500
Predicted Score
2014
2013
2012
2011
Year
Low Truancy Incidents (2011 to 2014) - College Park High School -
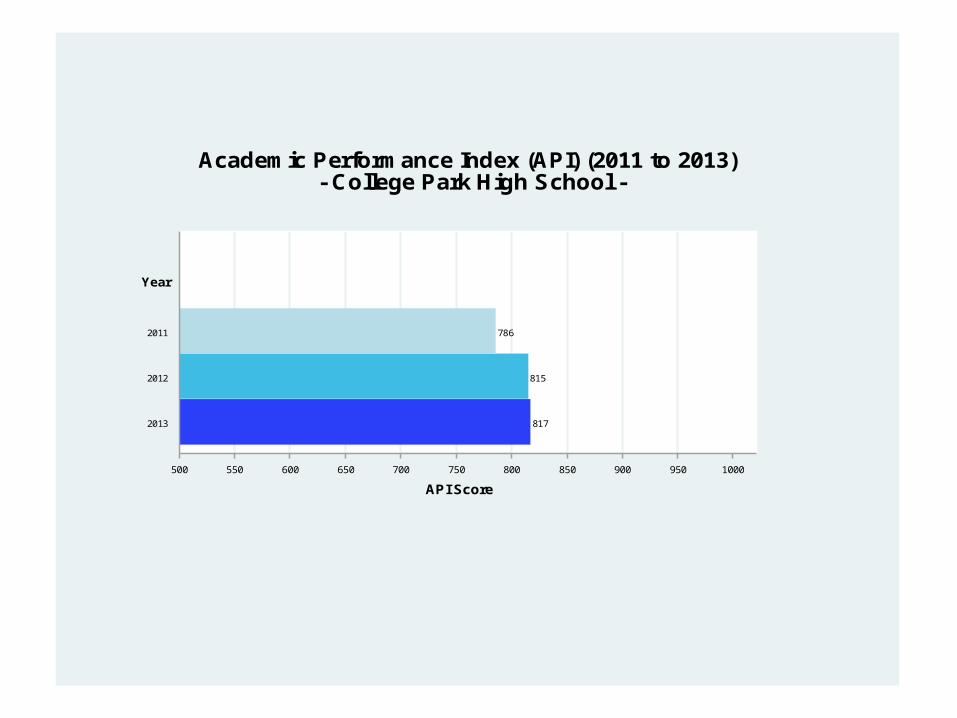
817
815
786
500 550 600 650 700 750 800 850 900 950 1000
API Score
2013
2012
2011
Year
Academic Performance Index (API) (2011 to 2013) - College Park High School -