Embed Size (px)
Citation preview
ดร.ธีทตั ตรีศิริโชติ
ดร.ธีทตั ตรีศิริโชติ Page 2
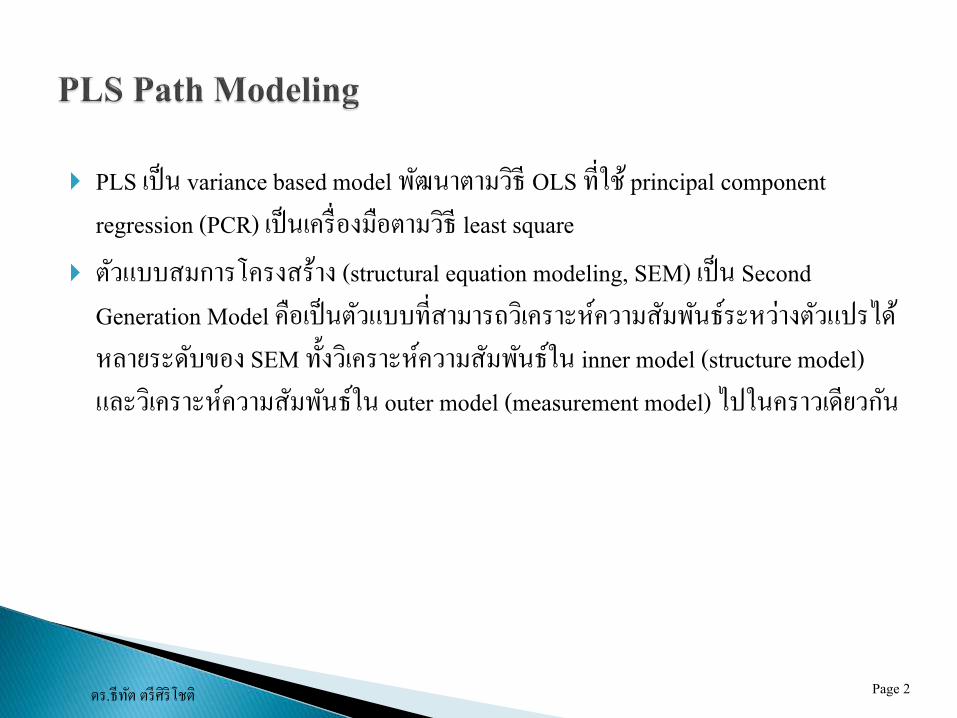
PLS เป็น variance based model พฒันาตามวิธี OLS ท่ีใช ้principal component regression (PCR) เป็นเคร่ืองมือตามวิธี least square
ตวัแบบสมการโครงสร้าง (structural equation modeling, SEM) เป็น Second Generation Model คือเป็นตวัแบบท่ีสามารถวิเคราะห์ความสมัพนัธ์ระหวา่งตวัแปรได้หลายระดบัของ SEM ทั้งวิเคราะห์ความสมัพนัธ์ใน inner model (structure model)และวิเคราะห์ความสมัพนัธ์ใน outer model (measurement model) ไปในคราวเดียวกนั
ดร.ธีทตั ตรีศิริโชติ Page 3
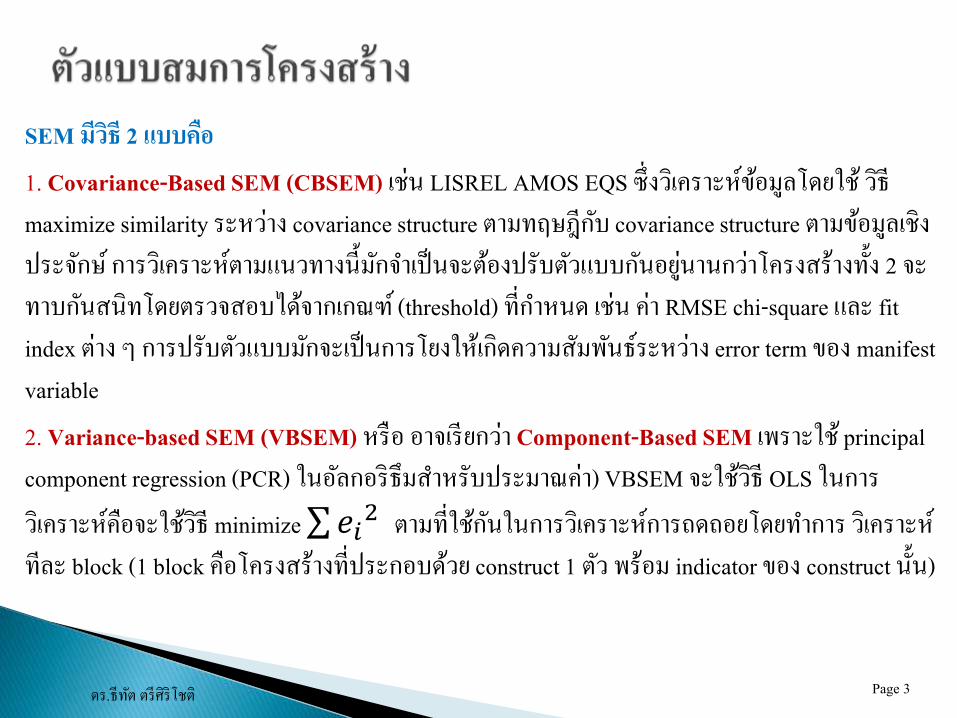
SEM มีวิธี 2 แบบคอื1. Covariance-Based SEM (CBSEM) เช่น LISREL AMOS EQS ซ่ึงวเิคราะห์ขอ้มูลโดยใช ้วธีิmaximize similarity ระหวา่ง covariance structure ตามทฤษฎีกบั covariance structure ตามขอ้มูลเชิงประจกัษ ์การวเิคราะห์ตามแนวทางน้ีมกัจ าเป็นจะตอ้งปรับตวัแบบกนัอยูน่านกวา่โครงสร้างทั้ง 2 จะทาบกนัสนิทโดยตรวจสอบไดจ้ากเกณฑ ์(threshold) ท่ีก าหนด เช่น ค่า RMSE chi-square และ fit index ต่าง ๆ การปรับตวัแบบมกัจะเป็นการโยงใหเ้กิดความสมัพนัธ์ระหวา่ง error term ของ manifest variable2. Variance-based SEM (VBSEM) หรือ อาจเรียกวา่ Component-Based SEM เพราะใช้ principal component regression (PCR) ในอลักอริธึมส าหรับประมาณค่า) VBSEM จะใชว้ธีิ OLS ในการวเิคราะห์คือจะใชว้ธีิ minimize 𝑒𝑖2 ตามท่ีใชก้นัในการวเิคราะห์การถดถอยโดยท าการ วเิคราะห์ทีละ block (1 block คือโครงสร้างท่ีประกอบดว้ย construct 1 ตวั พร้อม indicator ของ construct นั้น)

ดร.ธีทตั ตรีศิริโชติ Page 4
จากการติดตามการใช ้second generation modeling ในวารสารดา้น IS พบวา่มีการน า ซอฟทแ์วร์ PLS และ LISREL ไปใชใ้นงานวิจยั 39 % เท่ากนั ท่ีเหลืออีก 23% เป็นซอฟทแ์วร์ SEM อ่ืนเช่น AMOS EQS และอ่ืน ๆ (Gefen, Straub and Boudreau, 2000)
อา้งอิงจาก: มนตรี พิริยะกลุ, (2010). Partial Least Square Path Modeling (PLS Path Modeling)Chatelin, Y.M. (2002), Vinzi, V.E., and Tenenhons, M. (2002) State of Art on PLS Path Modeling through the available
software,Retreived Feb 12, 2010, from http://www.sinopai.com/sinopai2/repository/ppt/20041227005.pdf.Lauro, C. and V.E.Vinzi.(2004), Some Contributions to PLS Path Modeling and System for the European
Customer Satisfaction, Retrieved Jan 13,2010,from http://www.sis-statistica.it/files.pdf/atti/RMi0602p201-210.pdf.
ดร.ธีทตั ตรีศิริโชติ Page 5
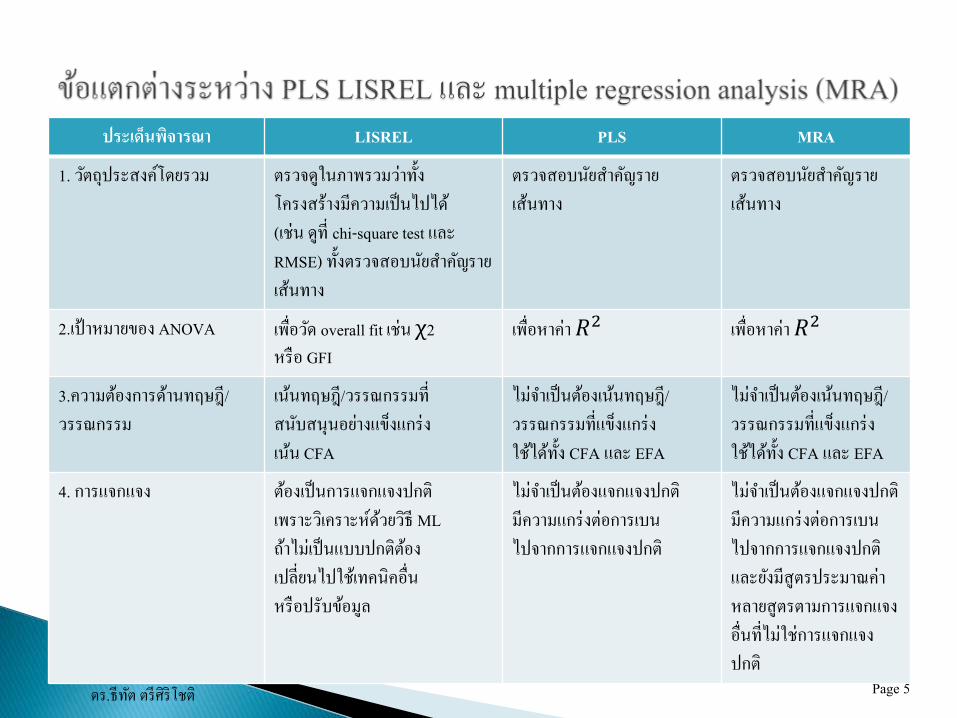
ประเด็นพจิารณา LISREL PLS MRA
1. วตัถุประสงคโ์ดยรวม ตรวจดูในภาพรวมวา่ทั้งโครงสร้างมีความเป็นไปได้(เช่น ดูท่ี chi-square test และ RMSE) ทั้งตรวจสอบนยัส าคญัรายเส้นทาง
ตรวจสอบนยัส าคญัรายเส้นทาง
ตรวจสอบนยัส าคญัรายเส้นทาง
2.เป้าหมายของ ANOVA เพื่อวดั overall fit เช่น χ2หรือ GFI
เพื่อหาค่า 𝑅2 เพื่อหาค่า 𝑅2
3.ความตอ้งการดา้นทฤษฎี/วรรณกรรม
เนน้ทฤษฎี/วรรณกรรมท่ีสนบัสนุนอยา่งแขง็แกร่งเนน้ CFA
ไม่จ าเป็นตอ้งเนน้ทฤษฎี/วรรณกรรมท่ีแขง็แกร่งใชไ้ดท้ั้ง CFA และ EFA
ไม่จ าเป็นตอ้งเนน้ทฤษฎี/วรรณกรรมท่ีแขง็แกร่งใชไ้ดท้ั้ง CFA และ EFA
4. การแจกแจง ตอ้งเป็นการแจกแจงปกติเพราะวเิคราะห์ดว้ยวธีิ MLถา้ไม่เป็นแบบปกติตอ้งเปล่ียนไปใชเ้ทคนิคอ่ืนหรือปรับขอ้มูล
ไม่จ าเป็นตอ้งแจกแจงปกติมีความแกร่งต่อการเบนไปจากการแจกแจงปกติ
ไม่จ าเป็นตอ้งแจกแจงปกติมีความแกร่งต่อการเบนไปจากการแจกแจงปกติและยงัมีสูตรประมาณค่าหลายสูตรตามการแจกแจงอ่ืนท่ีไม่ใช่การแจกแจงปกติ
ดร.ธีทตั ตรีศิริโชติ Page 6
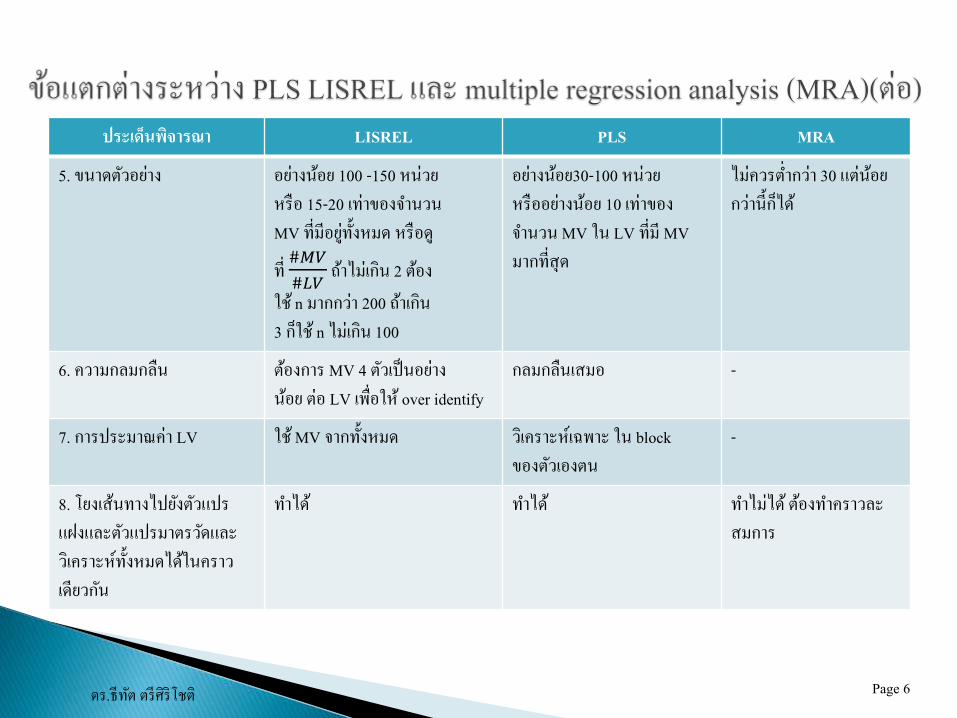
ประเด็นพจิารณา LISREL PLS MRA
5. ขนาดตวัอยา่ง อยา่งนอ้ย 100 -150 หน่วยหรือ 15-20 เท่าของจ านวนMV ท่ีมีอยูท่ ั้งหมด หรือดู
ท่ี#𝑀𝑉
#𝐿𝑉ถา้ไม่เกิน 2 ตอ้ง
ใช ้n มากกวา่ 200 ถา้เกิน3 กใ็ช ้n ไม่เกิน 100
อยา่งนอ้ย30-100 หน่วยหรืออยา่งนอ้ย 10 เท่าของจ านวน MV ใน LV ท่ีมี MVมากท่ีสุด
ไม่ควรต ่ากวา่ 30 แต่นอ้ยกวา่น้ีกไ็ด้
6. ความกลมกลืน ตอ้งการ MV 4 ตวัเป็นอยา่งนอ้ย ต่อ LV เพื่อให ้over identify
กลมกลืนเสมอ -
7. การประมาณค่า LV ใช ้MV จากทั้งหมด วเิคราะห์เฉพาะ ใน blockของตวัเองตน
-
8. โยงเส้นทางไปยงัตวัแปรแฝงและตวัแปรมาตรวดัและวเิคราะห์ทั้งหมดไดใ้นคราวเดียวกนั
ท าได้ ท าได้ ท าไม่ได ้ตอ้งท าคราวละสมการ
ดร.ธีทตั ตรีศิริโชติ Page 7
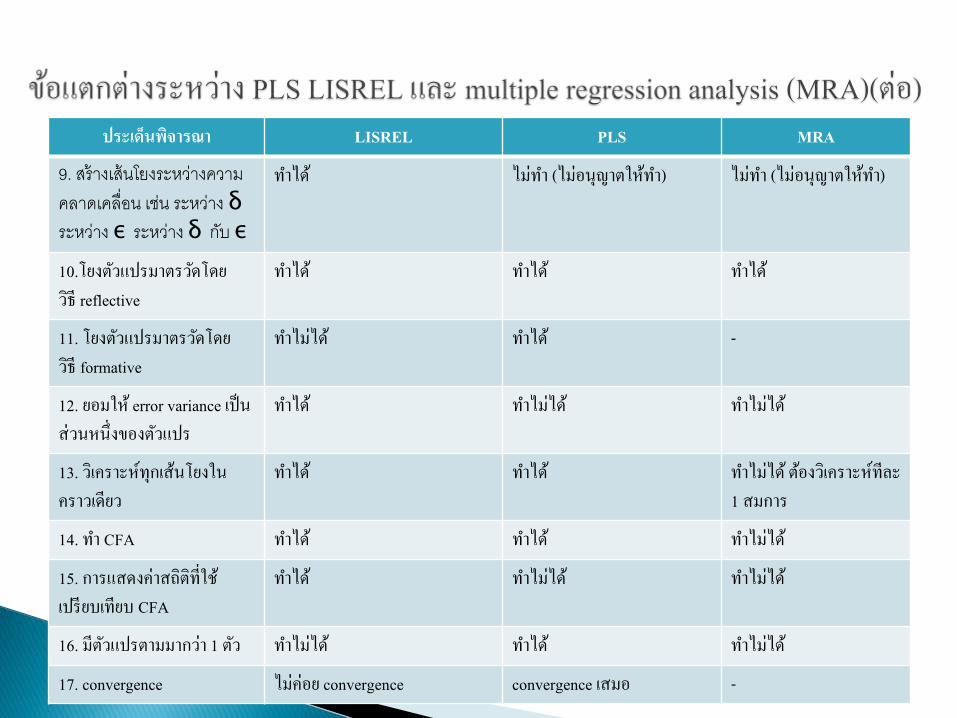
ประเด็นพจิารณา LISREL PLS MRA
9. สร้างเส้นโยงระหว่างความคลาดเคล่ือน เช่น ระหว่าง δระหว่าง ε ระหว่าง δ กบั ε
ท าได้ ไม่ท า (ไม่อนุญาตใหท้ า) ไม่ท า (ไม่อนุญาตใหท้ า)
10.โยงตวัแปรมาตรวดัโดยวธีิ reflective
ท าได้ ท าได้ ท าได้
11. โยงตวัแปรมาตรวดัโดยวธีิ formative
ท าไม่ได้ ท าได้ -
12. ยอมให ้error variance เป็นส่วนหน่ึงของตวัแปร
ท าได้ ท าไม่ได้ ท าไม่ได้
13. วเิคราะห์ทุกเส้นโยงในคราวเดียว
ท าได้ ท าได้ ท าไม่ได ้ตอ้งวเิคราะห์ทีละ1 สมการ
14. ท า CFA ท าได้ ท าได้ ท าไม่ได้
15. การแสดงค่าสถิติท่ีใช้เปรียบเทียบ CFA
ท าได้ ท าไม่ได้ ท าไม่ได้
16. มีตวัแปรตามมากวา่ 1 ตวั ท าไม่ได้ ท าได้ ท าไม่ได้
17. convergence ไม่ค่อย convergence convergence เสมอ -
ดร.ธีทตั ตรีศิริโชติ Page 8
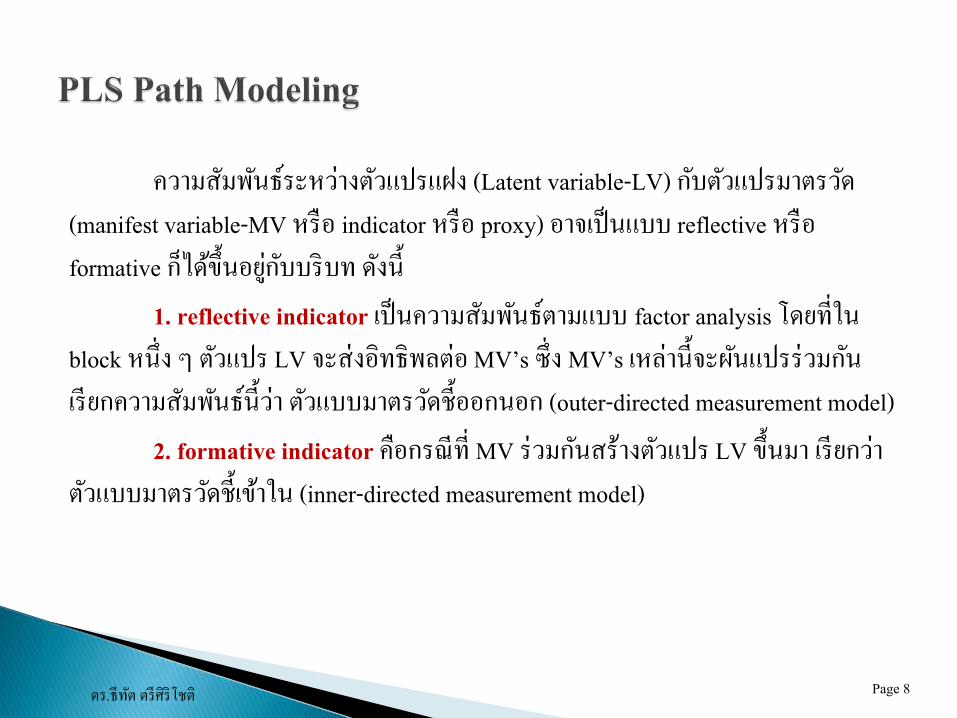
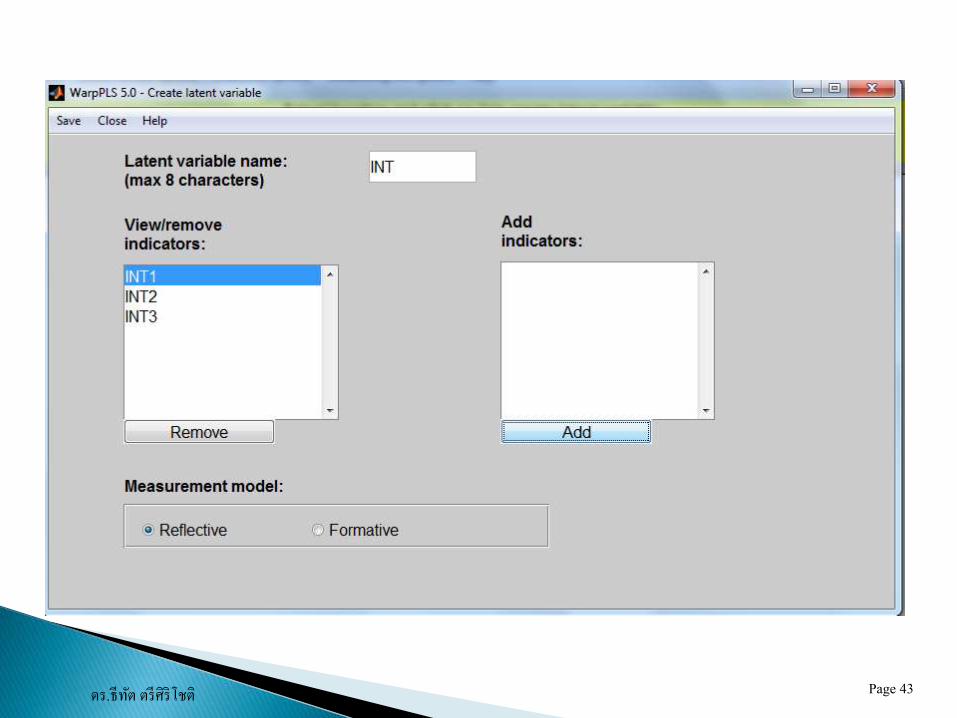
ความสัมพนัธ์ระหวา่งตวัแปรแฝง (Latent variable-LV) กบัตวัแปรมาตรวดั (manifest variable-MV หรือ indicator หรือ proxy) อาจเป็นแบบ reflective หรือ formative กไ็ดข้ึ้นอยูก่บับริบท ดงัน้ี
1. reflective indicator เป็นความสมัพนัธ์ตามแบบ factor analysis โดยท่ีใน block หน่ึง ๆ ตวัแปร LV จะส่งอิทธิพลต่อ MV’s ซ่ึง MV’s เหล่าน้ีจะผนัแปรร่วมกนั เรียกความสมัพนัธ์น้ีวา่ ตวัแบบมาตรวดัช้ีออกนอก (outer-directed measurement model)
2. formative indicator คือกรณีท่ี MV ร่วมกนัสร้างตวัแปร LV ข้ึนมา เรียกวา่ตวัแบบมาตรวดัช้ีเขา้ใน (inner-directed measurement model)
ดร.ธีทตั ตรีศิริโชติ Page 9
ดร.ธีทตั ตรีศิริโชติ Page 10
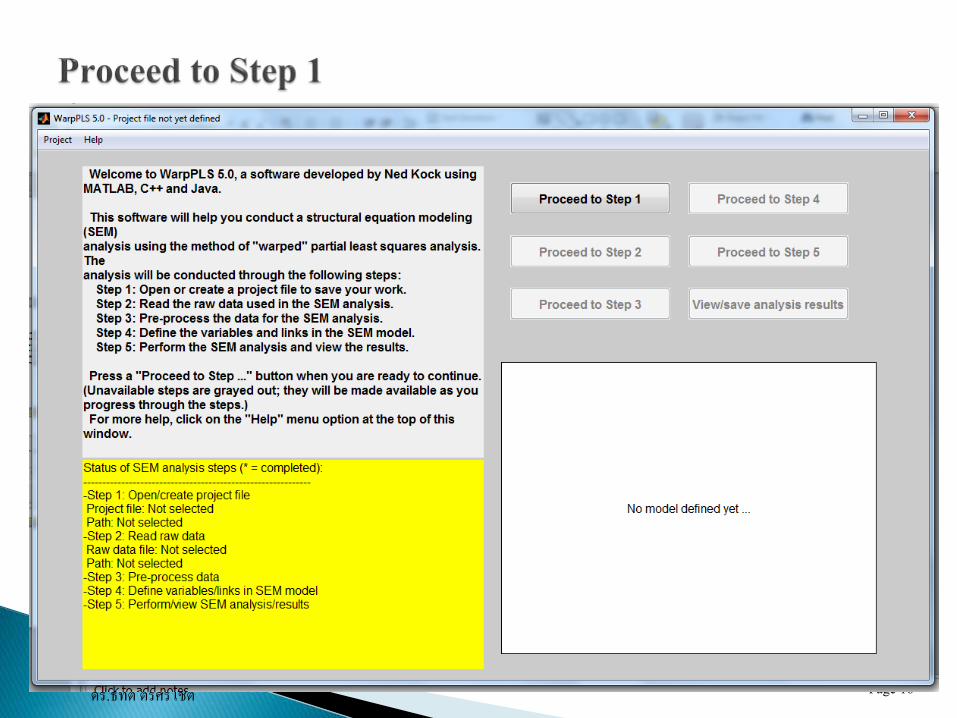
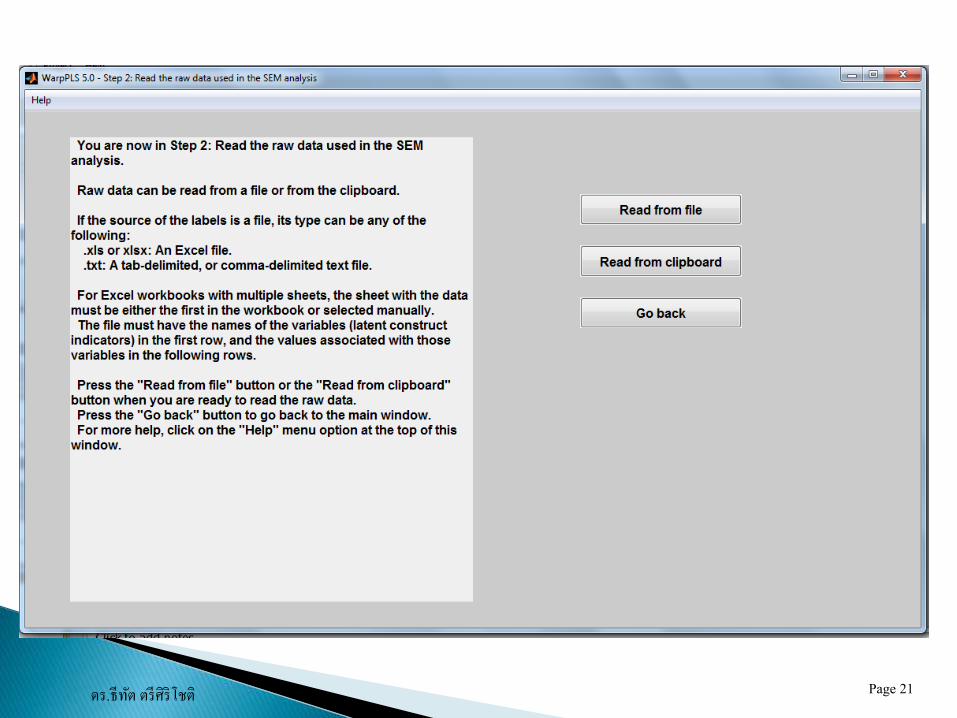
Structural equation modeling (SEM) employing the partial least squares (PLS) method, or PLS-based SEM for short, has been and continue being extensively used in a wide variety of fields.
Examples of fields in which PLS-based SEM is used are information systems (Guo et al., 2011; Kock & Lynn, 2012), marketing (Biong & Ulvnes, 2011), international business (Ketkar et al., 2012), nursing (Kim et al., 2012), medicine(Berglund et al., 2012), and global environmental change (Brewer et al., 2012).
ดร.ธีทตั ตรีศิริโชติ Page 11
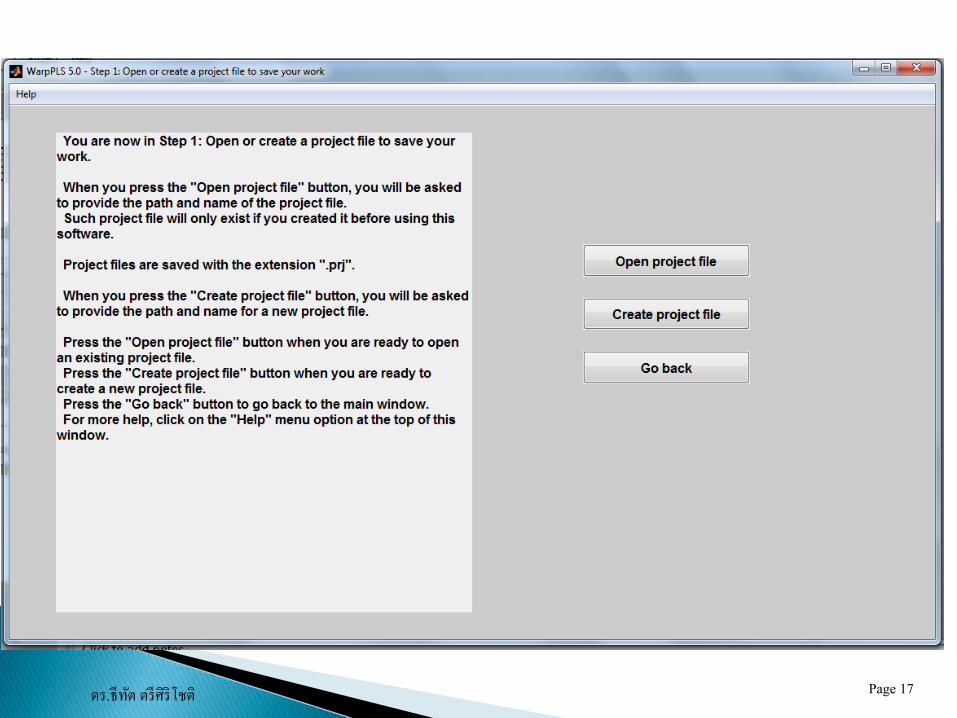
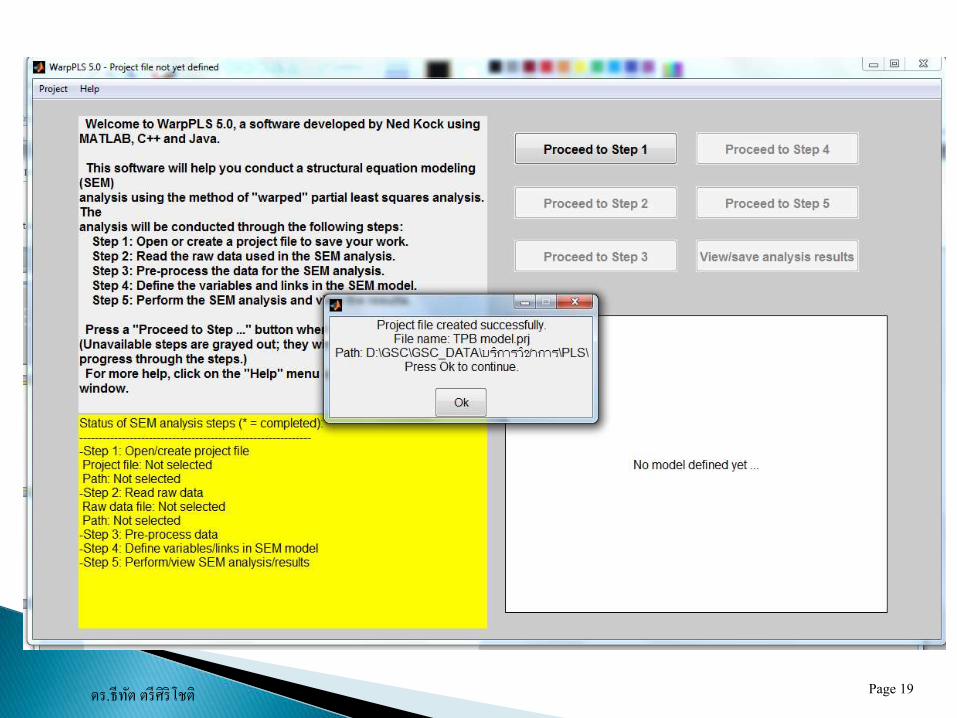
The software installs automatically from a self-extracting executable file. There are two components to the software: the MATLAB Compiler Runtime, and the main software (i.e., WarpPLS).
The MATLAB Compiler Runtime 7.14 is used in this version of WarpPLS.
ดร.ธีทตั ตรีศิริโชติ Page 12
This version was initially released as a beta version and was later upgraded to stable. As you will see below, it incorporates a large number of new features, when compared with the previous version. It has undergone extensive testing in-house prior to its release as a beta version, and has been in the hands of users for several months prior to its upgrade to stable. Nevertheless, given the large number of new features, and the inherent interconnectedness of features, it is very likely that this stable version will still contain some software bugs, which we expect to be minor.
ดร.ธีทตั ตรีศิริโชติ Page 13
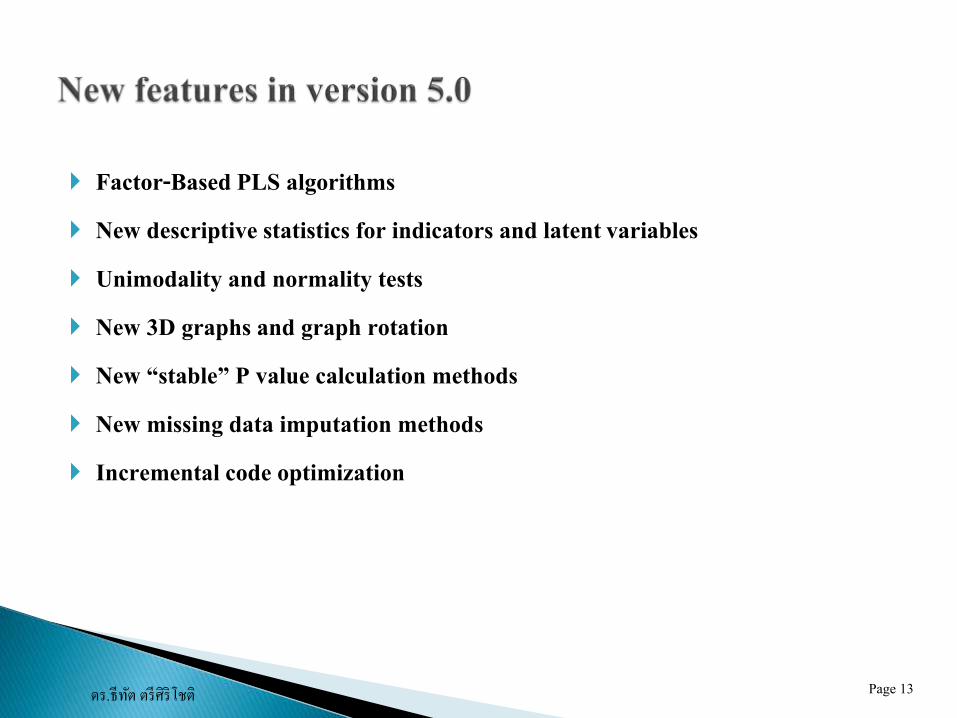
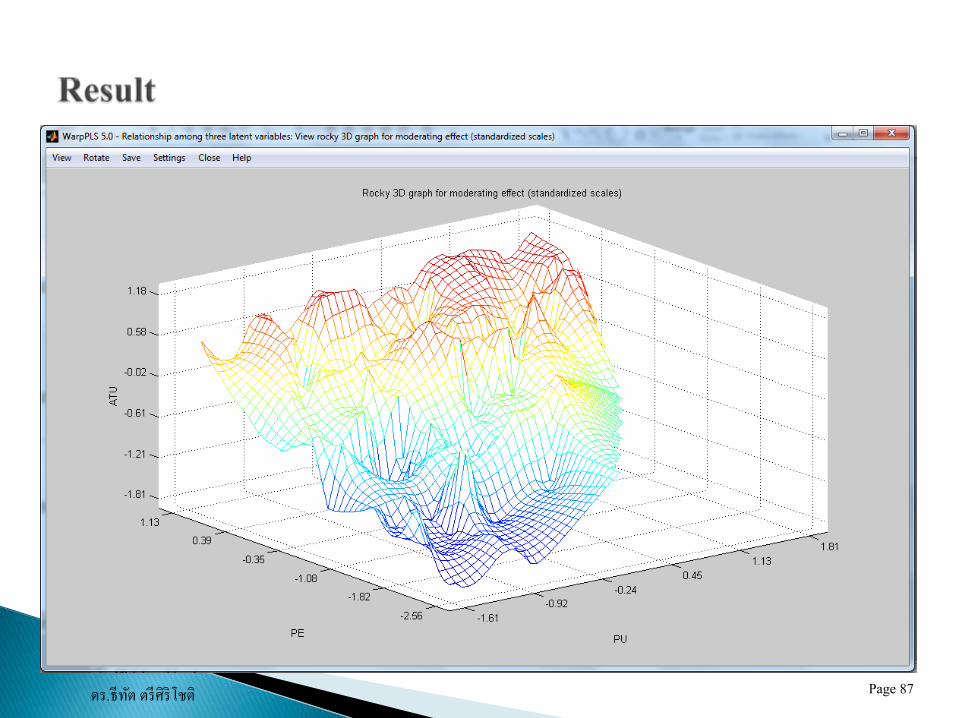
Factor-Based PLS algorithms New descriptive statistics for indicators and latent variables Unimodality and normality tests New 3D graphs and graph rotation New “stable” P value calculation methods New missing data imputation methods Incremental code optimization
ดร.ธีทตั ตรีศิริโชติ Page 14
Prior to displaying the software’s main window, a command prompt window may be shown and kept open for the duration of the SEM analysis session. Do not try to close this command prompt window, if it is shown, because it will list warnings and error messages that will likely be very useful in troubleshooting. Moreover, those warnings and error messages will indicate where in the source code they are happening, which will help the software developer correct any possible problems in future versions of the software.
ดร.ธีทตั ตรีศิริโชติ Page 15
ดร.ธีทตั ตรีศิริโชติ Page 16
ดร.ธีทตั ตรีศิริโชติ Page 17

ดร.ธีทตั ตรีศิริโชติ Page 18
ดร.ธีทตั ตรีศิริโชติ Page 19

ดร.ธีทตั ตรีศิริโชติ Page 20
ดร.ธีทตั ตรีศิริโชติ Page 21
ดร.ธีทตั ตรีศิริโชติ Page 22
ดร.ธีทตั ตรีศิริโชติ Page 23
ดร.ธีทตั ตรีศิริโชติ Page 24
ดร.ธีทตั ตรีศิริโชติ Page 25
ดร.ธีทตั ตรีศิริโชติ Page 26
ดร.ธีทตั ตรีศิริโชติ Page 27

ดร.ธีทตั ตรีศิริโชติ Page 28
ดร.ธีทตั ตรีศิริโชติ Page 29
ดร.ธีทตั ตรีศิริโชติ Page 30

ดร.ธีทตั ตรีศิริโชติ Page 31
ดร.ธีทตั ตรีศิริโชติ Page 32
ดร.ธีทตั ตรีศิริโชติ Page 33

ดร.ธีทตั ตรีศิริโชติ Page 34
ดร.ธีทตั ตรีศิริโชติ Page 35
ดร.ธีทตั ตรีศิริโชติ Page 36

ดร.ธีทตั ตรีศิริโชติ Page 37
ดร.ธีทตั ตรีศิริโชติ Page 38
ดร.ธีทตั ตรีศิริโชติ Page 39
ดร.ธีทตั ตรีศิริโชติ Page 40

ดร.ธีทตั ตรีศิริโชติ Page 41
ดร.ธีทตั ตรีศิริโชติ Page 42
ดร.ธีทตั ตรีศิริโชติ Page 43
ดร.ธีทตั ตรีศิริโชติ Page 44
ดร.ธีทตั ตรีศิริโชติ Page 45
ดร.ธีทตั ตรีศิริโชติ Page 46
ดร.ธีทตั ตรีศิริโชติ Page 47
ดร.ธีทตั ตรีศิริโชติ Page 48
ดร.ธีทตั ตรีศิริโชติ Page 49
ดร.ธีทตั ตรีศิริโชติ Page 50
ดร.ธีทตั ตรีศิริโชติ Page 51

ดร.ธีทตั ตรีศิริโชติ Page 52
ดร.ธีทตั ตรีศิริโชติ Page 53
ดร.ธีทตั ตรีศิริโชติ Page 54
ดร.ธีทตั ตรีศิริโชติ Page 55
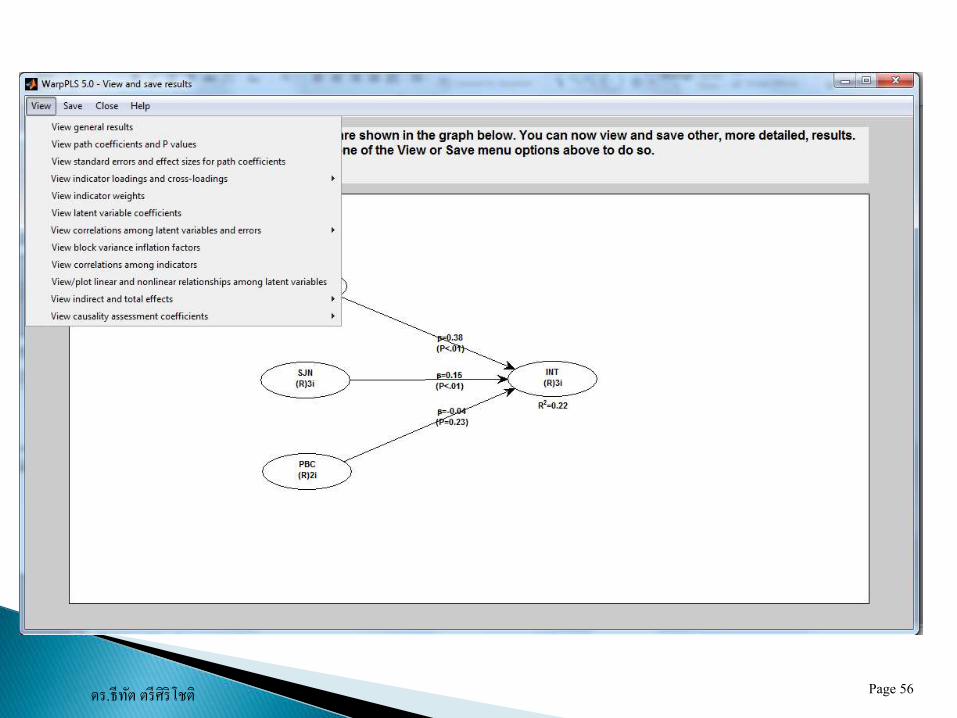
ดร.ธีทตั ตรีศิริโชติ Page 56

ดร.ธีทตั ตรีศิริโชติ Page 57
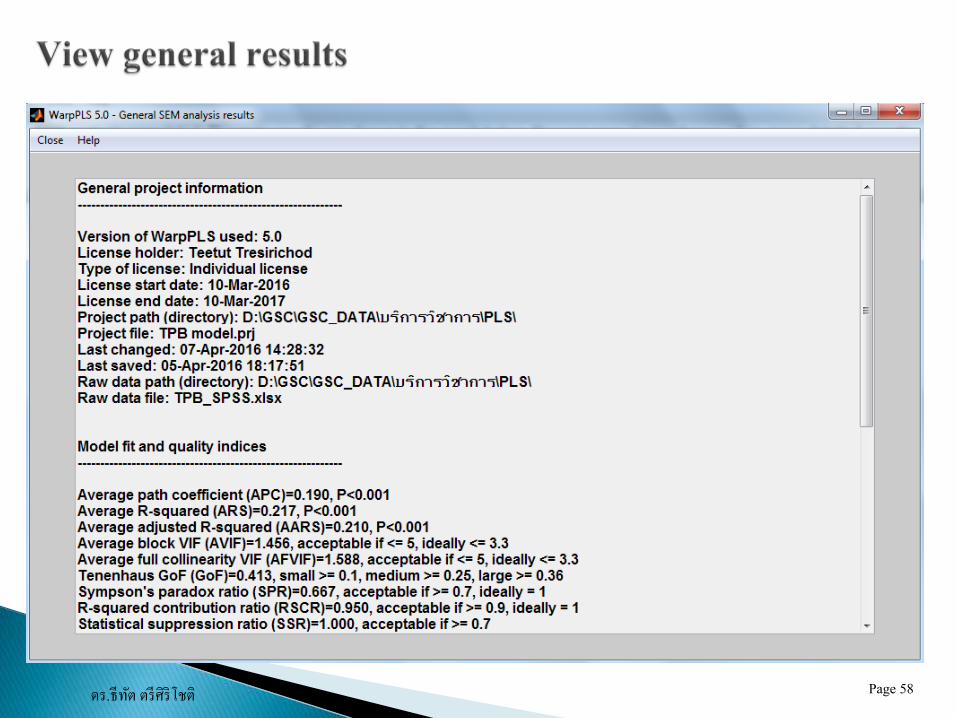
ดร.ธีทตั ตรีศิริโชติ Page 58
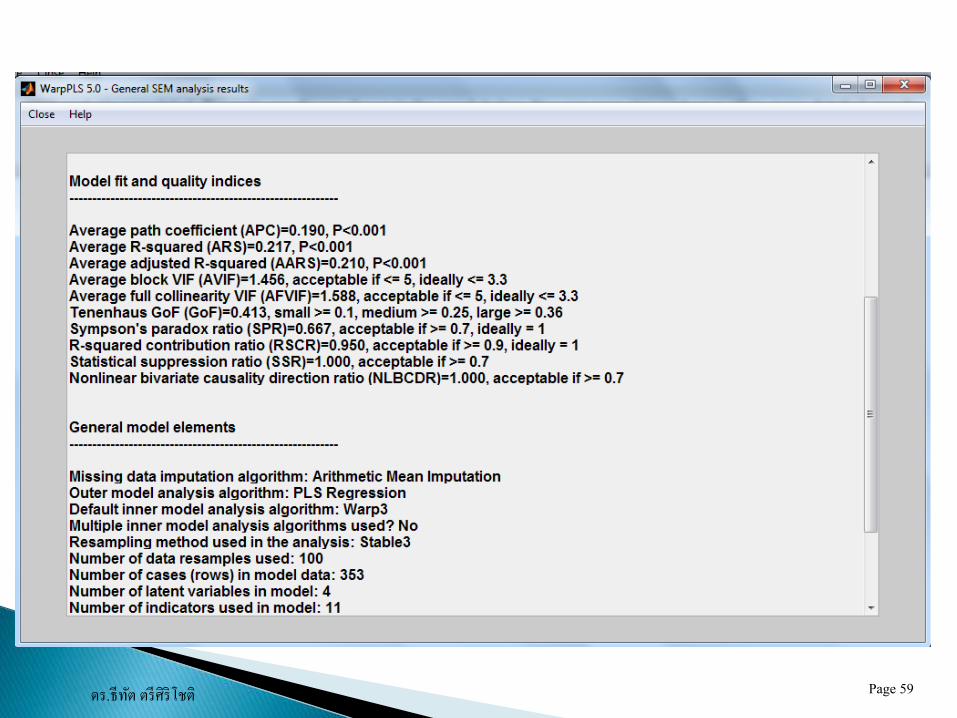
ดร.ธีทตั ตรีศิริโชติ Page 59
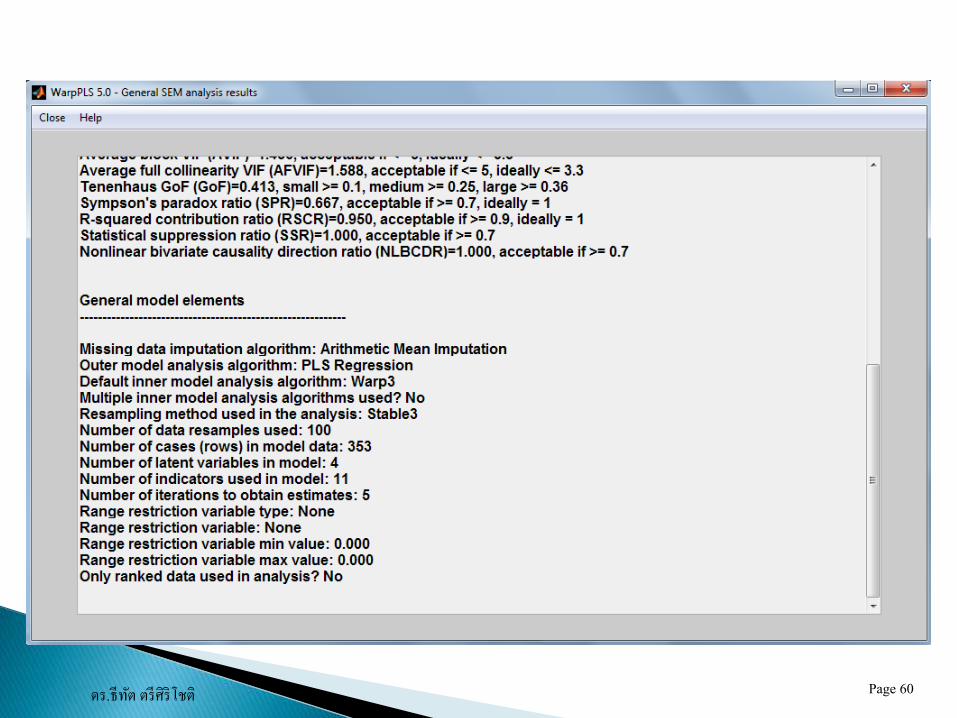
ดร.ธีทตั ตรีศิริโชติ Page 60
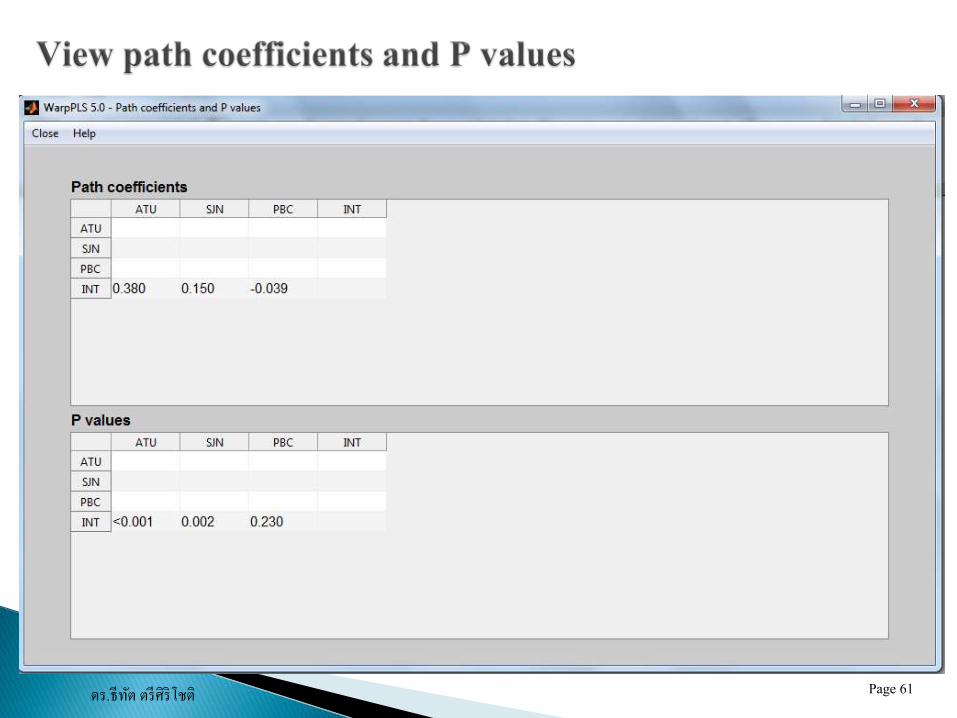
ดร.ธีทตั ตรีศิริโชติ Page 61
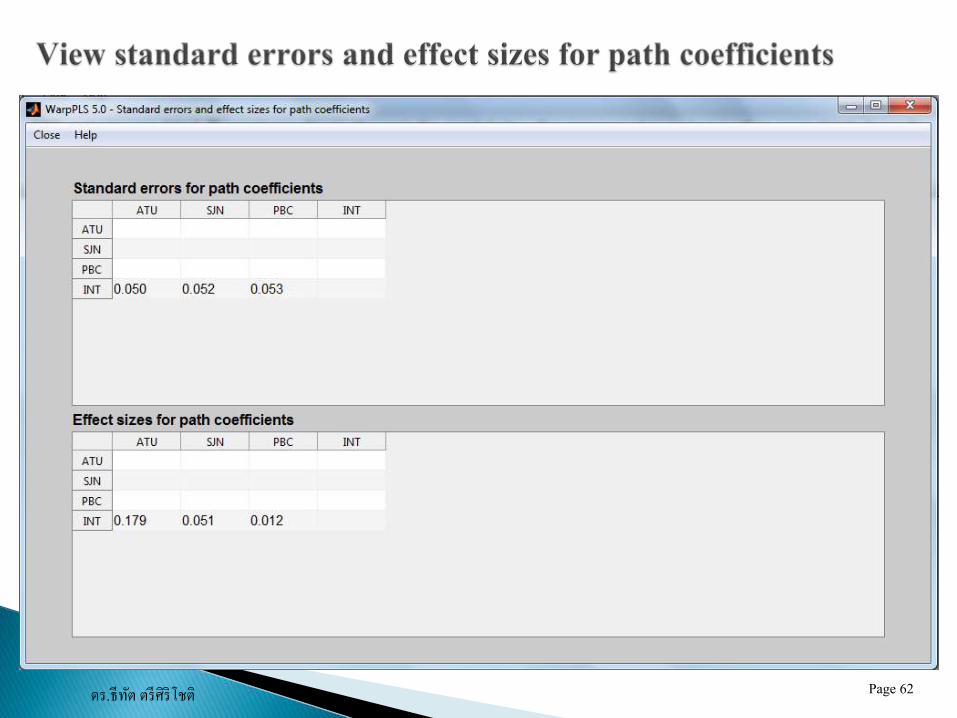
ดร.ธีทตั ตรีศิริโชติ Page 62
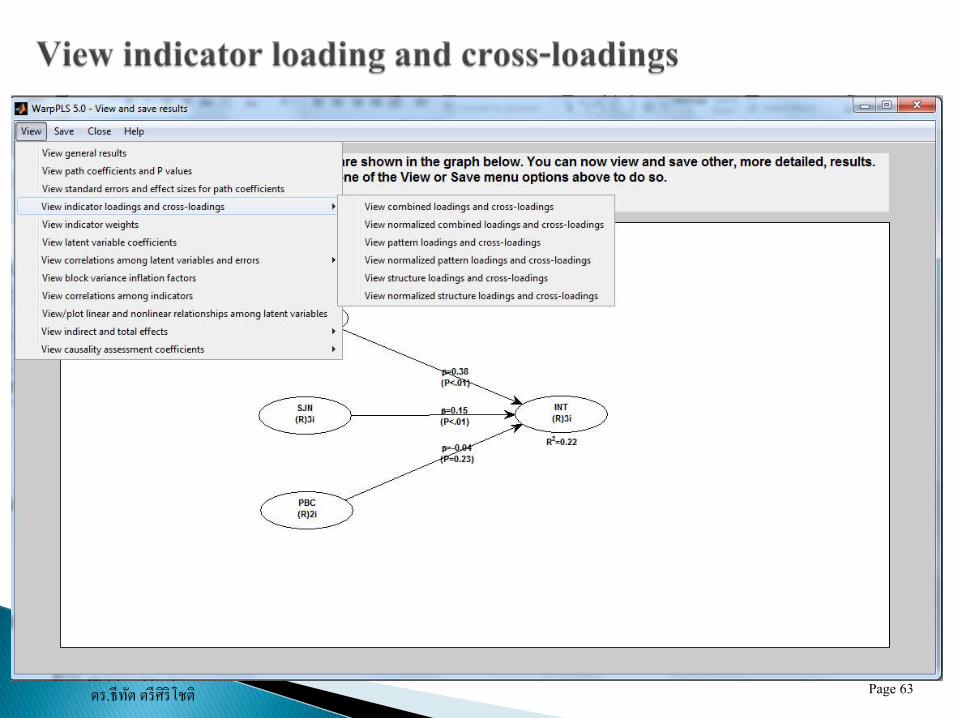
ดร.ธีทตั ตรีศิริโชติ Page 63
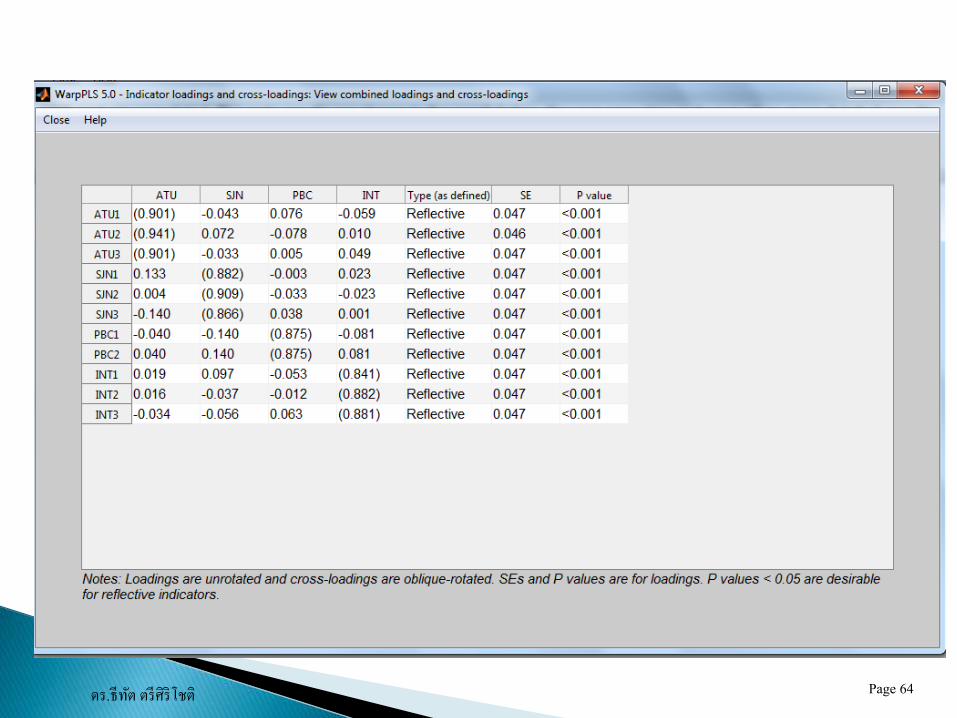
ดร.ธีทตั ตรีศิริโชติ Page 64
ดร.ธีทตั ตรีศิริโชติ Page 65

ดร.ธีทตั ตรีศิริโชติ Page 66

ดร.ธีทตั ตรีศิริโชติ Page 67

ดร.ธีทตั ตรีศิริโชติ Page 68
ดร.ธีทตั ตรีศิริโชติ Page 69
ดร.ธีทตั ตรีศิริโชติ Page 70
ดร.ธีทตั ตรีศิริโชติ Page 71

ดร.ธีทตั ตรีศิริโชติ Page 72
ดร.ธีทตั ตรีศิริโชติ Page 73
ดร.ธีทตั ตรีศิริโชติ Page 74
ดร.ธีทตั ตรีศิริโชติ Page 75
ดร.ธีทตั ตรีศิริโชติ Page 76
ดร.ธีทตั ตรีศิริโชติ Page 77

ดร.ธีทตั ตรีศิริโชติ Page 78
ดร.ธีทตั ตรีศิริโชติ Page 79
ดร.ธีทตั ตรีศิริโชติ Page 80
ดร.ธีทตั ตรีศิริโชติ Page 81
ดร.ธีทตั ตรีศิริโชติ Page 82

ดร.ธีทตั ตรีศิริโชติ Page 83
ดร.ธีทตั ตรีศิริโชติ Page 84
ดร.ธีทตั ตรีศิริโชติ Page 85
ดร.ธีทตั ตรีศิริโชติ Page 86
ดร.ธีทตั ตรีศิริโชติ Page 87
ดร.ธีทตั ตรีศิริโชติ Page 88
ดร.ธีทตั ตรีศิริโชติ Page 89
ดร.ธีทตั ตรีศิริโชติ Page 90

ดร.ธีทตั ตรีศิริโชติ Page 91
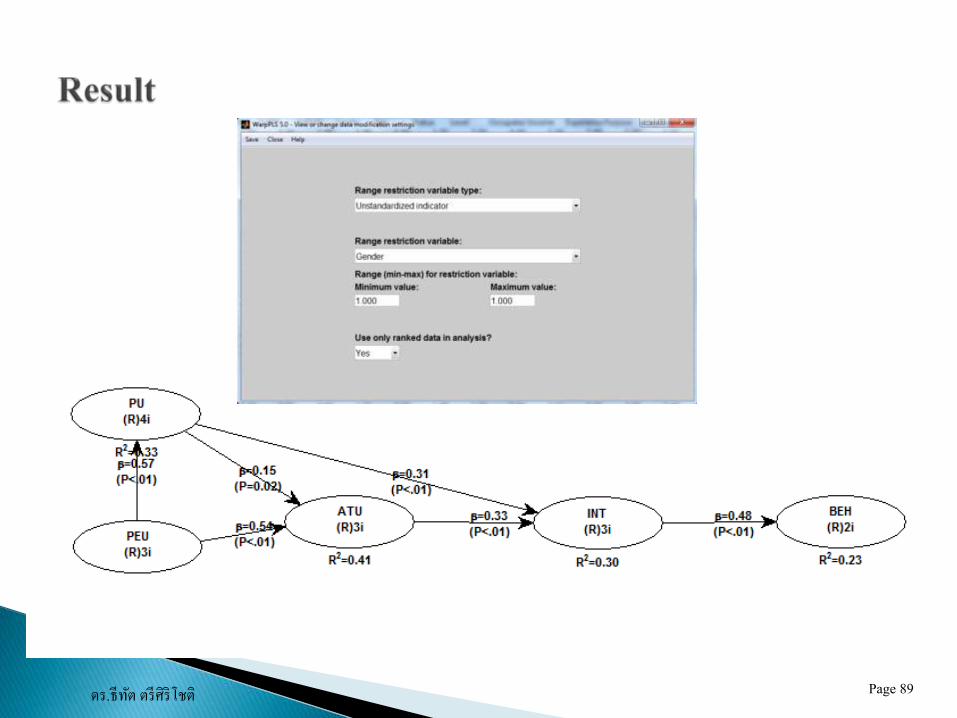
ชาย
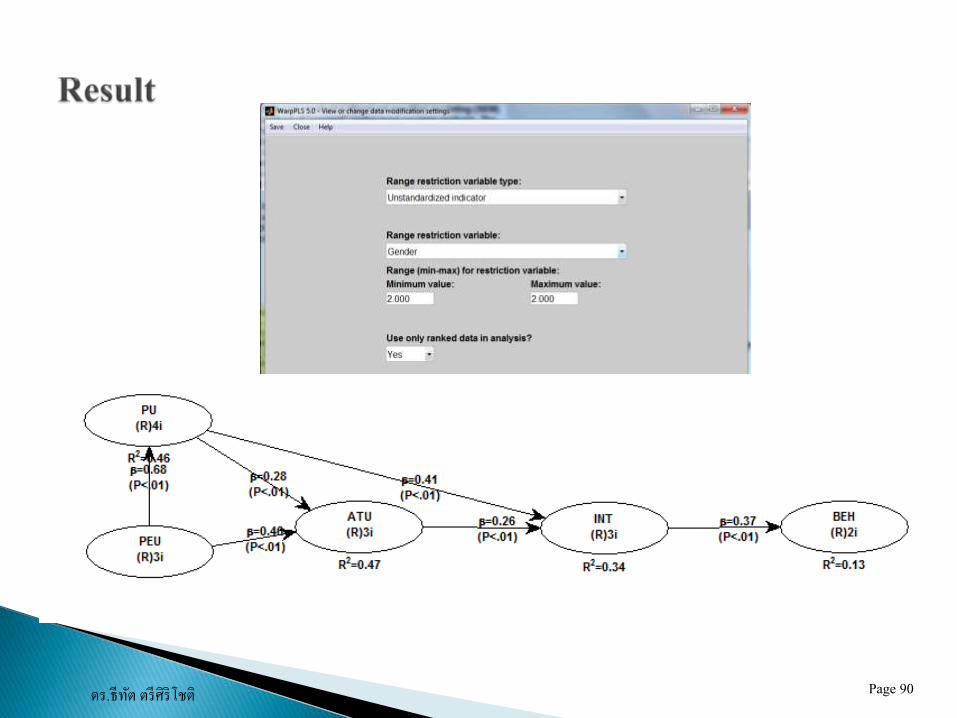
หญิง


![Partial Least Squares Modeling and Its Multi-collinearity ... 2018/IC… · [1] Yang Chunhua, Yang Ling. Partial least square modeling and analysis of multicollinearity inhibition](https://img.pdfslide.net/doc/110x75/6084e4121bda3f05bf325589/partial-least-squares-modeling-and-its-multi-collinearity-2018ic-1-yang.jpg)