Embed Size (px)
Citation preview
• Purpose of research
• Exemplary growth profiles
• Soft power index & aviation
• Relevant TTCI & comparison
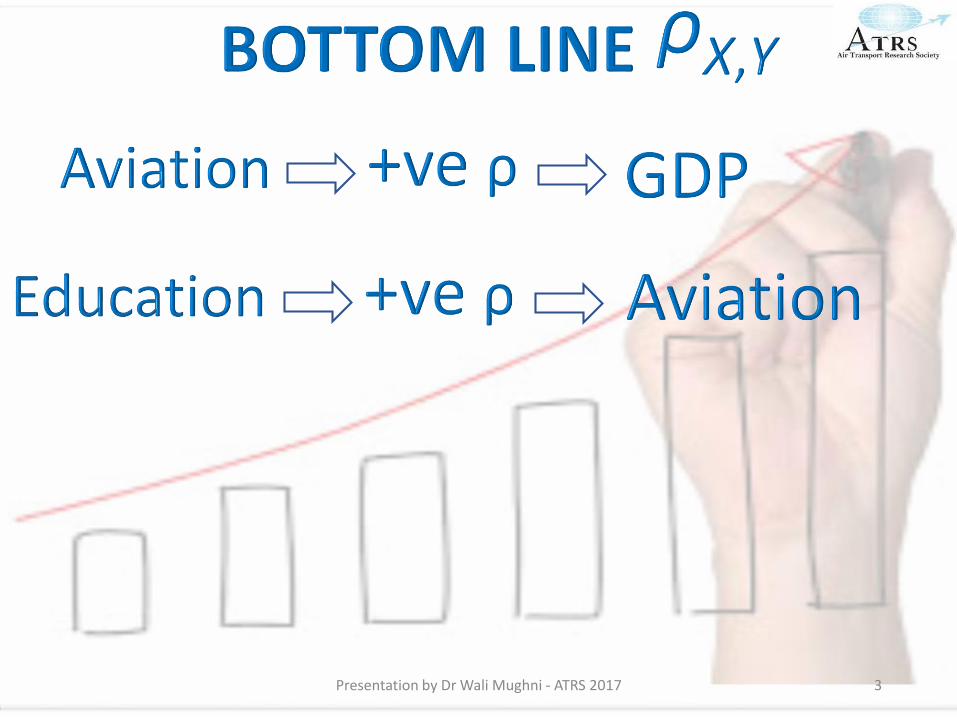
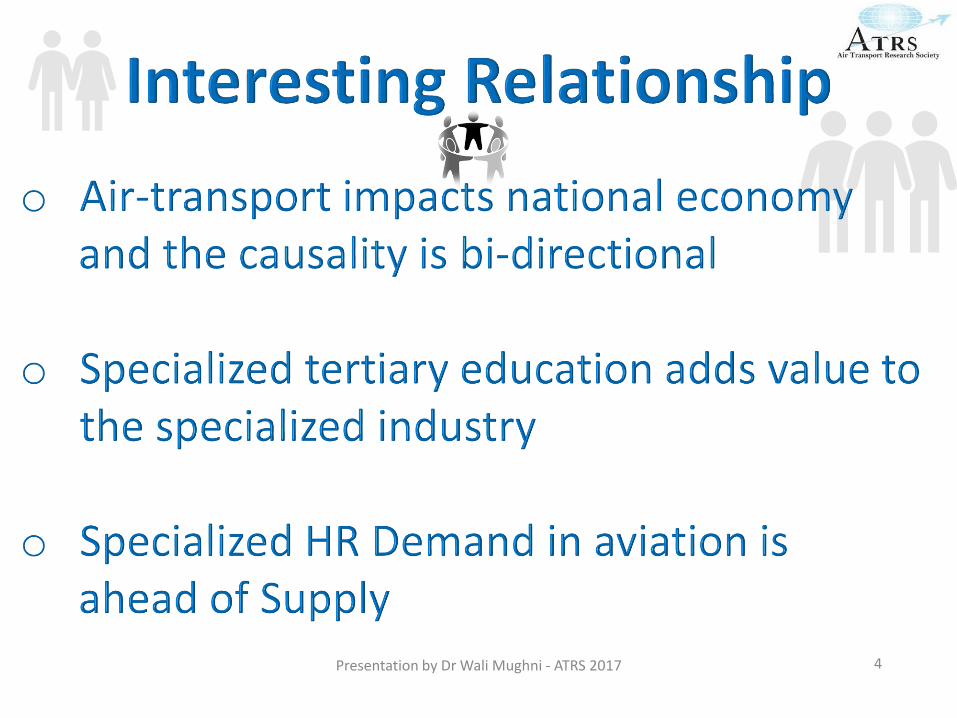
• Relationship: aviation-economy-education
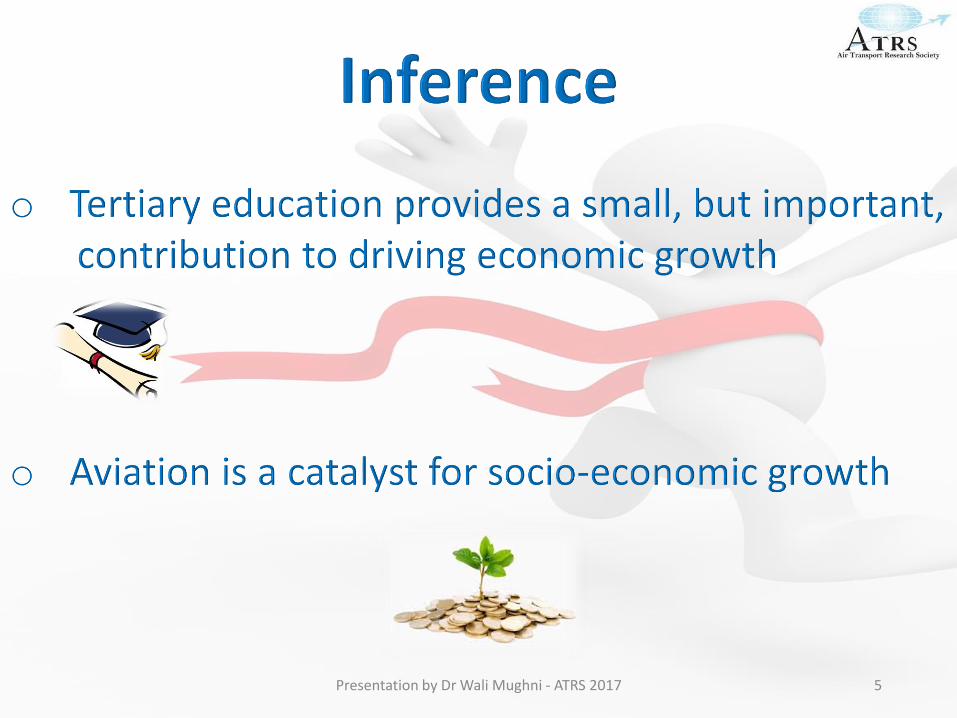
• Conclusion & recommendations
Presentation by Dr Wali Mughni - ATRS 2017 2
Presentation by Dr Wali Mughni - ATRS 2017 3
Presentation by Dr Wali Mughni - ATRS 2017 4
Presentation by Dr Wali Mughni - ATRS 2017 5
Presentation by Dr Wali Mughni - ATRS 2017 6
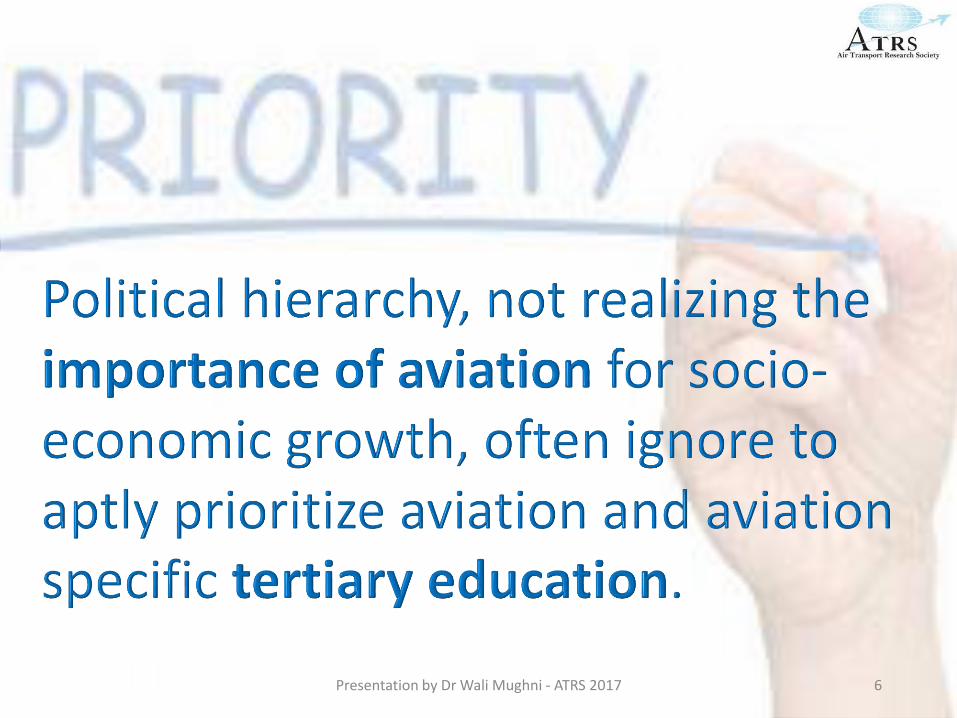
Lack of awareness leads tolow priority, which leads to low investment
in aviation specific infrastructure and tertiary education and… economic growth suffers
Presentation by Dr Wali Mughni - ATRS 2017 7
Visionary and forward-looking policies and strategies at national level
can lead to a path that canchange the destiny
of nations.
Presentation by Dr Wali Mughni - ATRS 2017 8
Presentation by Dr Wali Mughni - ATRS 2017 9
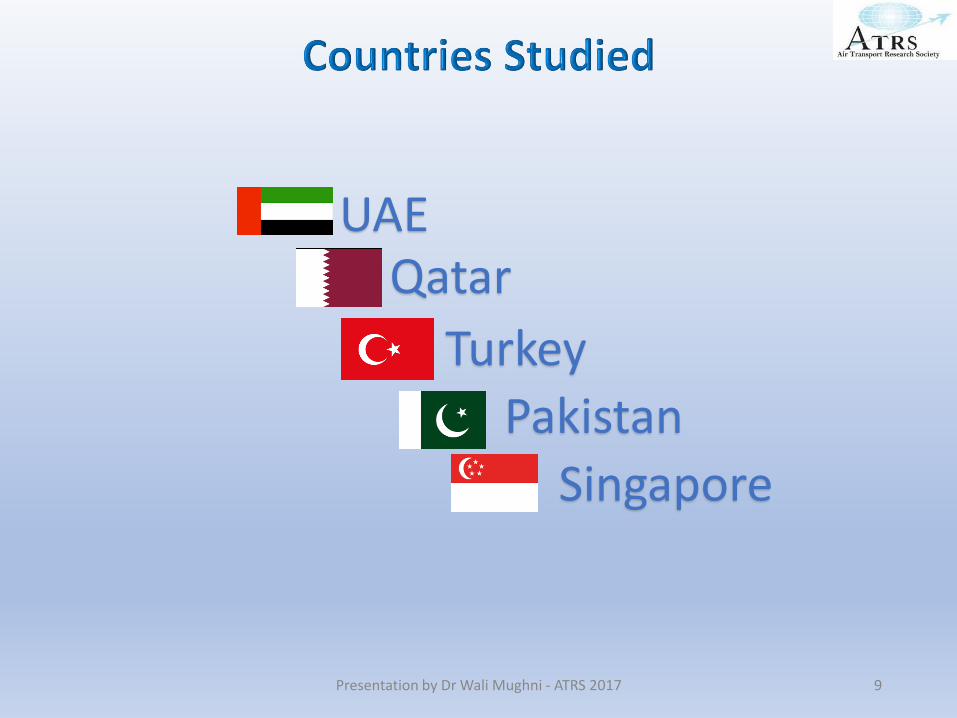
UAEQatar
Turkey
Pakistan
Singapore
Presentation by Dr Wali Mughni - ATRS 2017 10
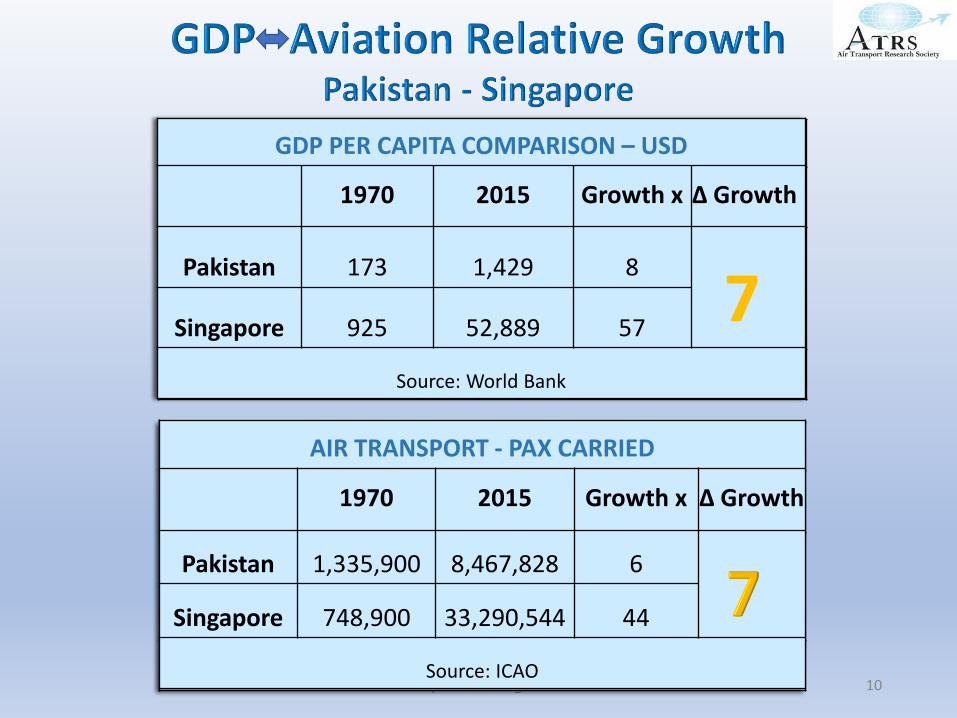
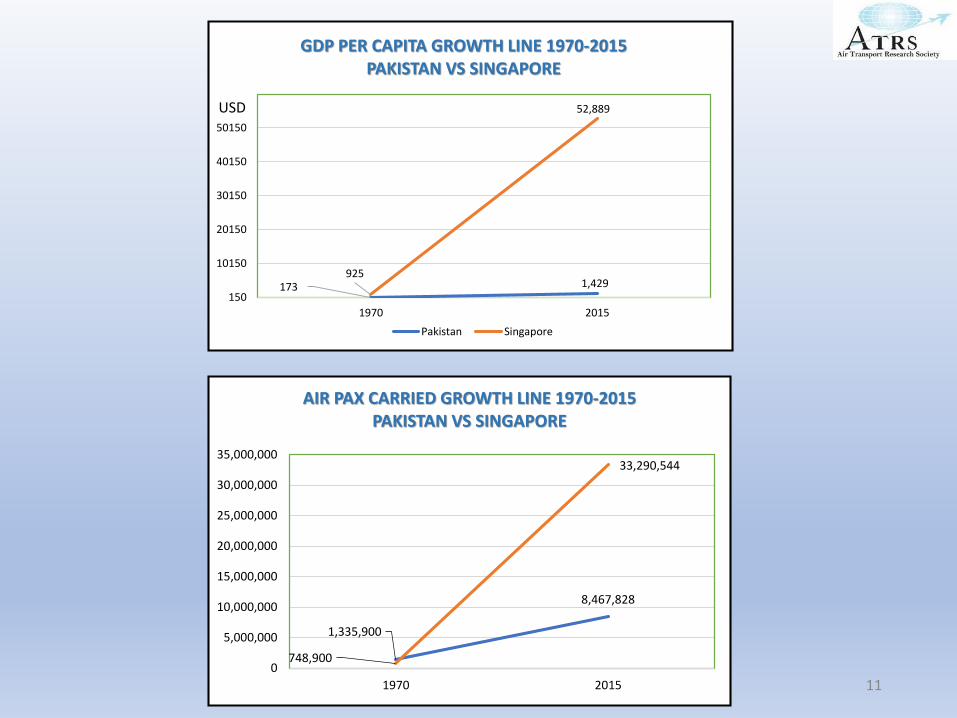
GDP PER CAPITA COMPARISON – USD
1970 2015
Pakistan 173 1,429
Singapore 925 52,889
Source: World Bank
AIR TRANSPORT - PAX CARRIED
1970 2015 Growth x ∆ Growth
Pakistan 1,335,900 8,467,828
Singapore 748,900 33,290,544
Source: ICAO
GDP PER CAPITA COMPARISON – USD
1970 2015 Growth x ∆ Growth
Pakistan 173 1,429 87
Singapore 925 52,889 57
Source: World Bank
AIR TRANSPORT - PAX CARRIED
1970 2015 Growth x ∆ Growth
Pakistan 1,335,900 8,467,828 67
Singapore 748,900 33,290,544 44
Source: ICAO
Presentation by Dr Wali Mughni - ATRS 2017 11
173 1,429 925
52,889
150
10150
20150
30150
40150
50150
1970 2015
GDP PER CAPITA GROWTH LINE 1970-2015PAKISTAN VS SINGAPORE
Pakistan Singapore
1,335,900
8,467,828
748,900
33,290,544
0
5,000,000
10,000,000
15,000,000
20,000,000
25,000,000
30,000,000
35,000,000
1970 2015
AIR PAX CARRIED GROWTH LINE 1970-2015PAKISTAN VS SINGAPORE
USD
Presentation by Dr Wali Mughni - ATRS 201712
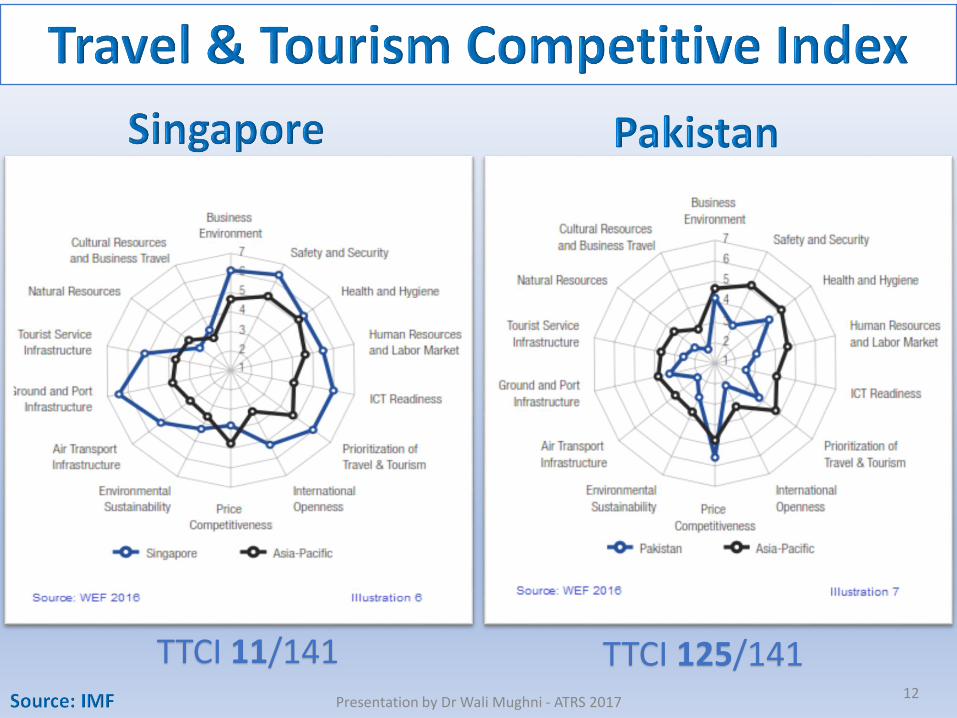
TTCI 11/141 TTCI 125/141
Presentation by Dr Wali Mughni - ATRS 2017 13
Presentation by Dr Wali Mughni - ATRS 2017 14
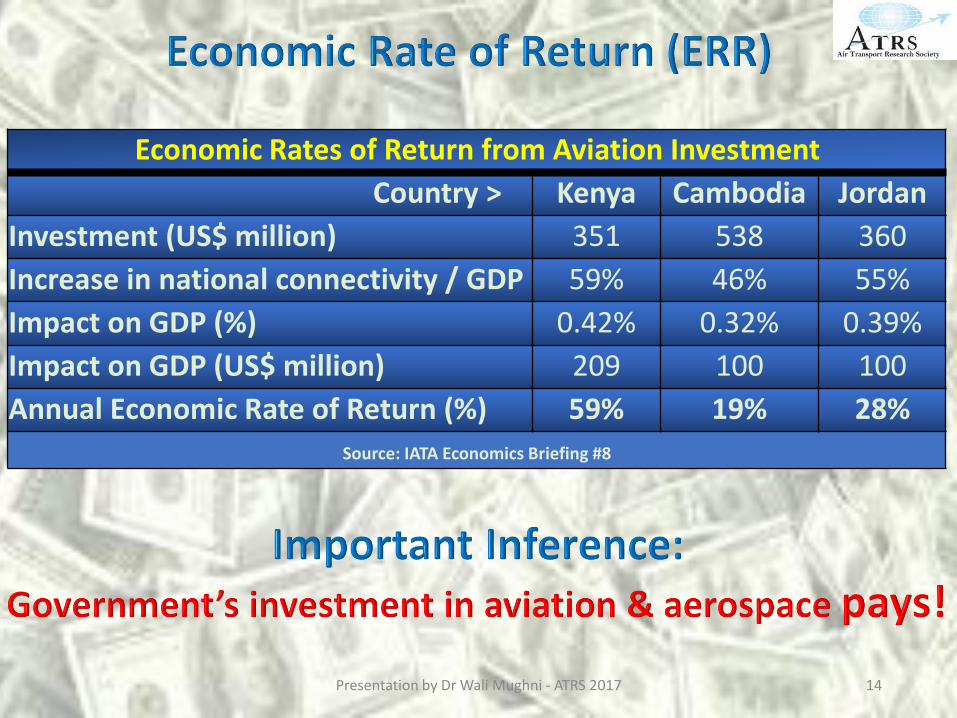
Economic Rates of Return from Aviation Investment
Country > Kenya Cambodia Jordan
Investment (US$ million) 351 538 360
Increase in national connectivity / GDP 59% 46% 55%
Impact on GDP (%) 0.42% 0.32% 0.39%
Impact on GDP (US$ million) 209 100 100
Annual Economic Rate of Return (%) 59% 19% 28%
Source: IATA Economics Briefing #8
Presentation by Dr Wali Mughni - ATRS 2017 15
Research & Development linked with tertiary education must form a core component of the
industry-academia relationship.
Presentation by Dr Wali Mughni - ATRS 2017 16