Embed Size (px)
Citation preview

An Overview of Performance Testing And JMeter
What is Performance testing?
Performance testing is an non-functional testing performed to determine how a system performs in terms of responsiveness and stability under a particular workload. It can also serve to investigate, measure, validate or verify other quality attributes of the system, such as scalability, reliability and resource usage
GOAL/OBJECTIVE IS TO FIND THE BOTTLE NECK IN THE SYSTEM

What are the types of Performance Testing?Load/Capacity Testing Stress Testing Volume Testing
Endurance/Soak Testing Spike Testing

Load / Capacity TestingLoad testing is the simplest form of performance testing. A load test is usually conducted to understand the behavior of the system under a specific expected load. This load can be the expected concurrent number of users on the application performing a specific number of transactions within the set duration.

Bottle neckA bottleneck is a phenomenon where the performance or capacity of an entire system is limited by a single or limited number of components or resources.
Your web application can consist of several modules used to process request. If one of them has technical limitation, it limits the performance of the whole system
Bottleneck in the application can be identified by performing the load test with the defined concurrent user load for various scenarios.

Stress TestingEvery system has a capacity limit. When the load goes beyond the limit, the web site starts responding very slowly and even produce errors.
The purpose of the stress testing is to find the capacity limit of the system. In we can verify at which point of time the system degrades or fails. Usually done by increasing the user load in the system.

Volume TestingVolume testing is done against the efficiency of the application. Huge amount of data is processed through the application (which is being tested) in order to check the extreme limitations of the system.
The limitation will be concluded upon the slow in the system performance and the failure in the application.

Endurance TestingThis type of testing is used to check that the system can withstand the load for a long or large number of transaction.
Test will be performed with defined set of concurrent users for a prolonged period of time, say for example 5 to 10 hours or 2 to 3 days.
Spike TestingSpike testing is done by suddenly increasing the number of load generated by, users by a very large amount and observing the behavior of the system. The goal is to determine the performance degrade, system failure or it will be able to handle dramatic changes in load.
Say for example, test will be initiated with 200 concurrent user for a certain period of time, suddenly the concurred user load will be increased to 1000 and the system performance will be monitored. Like wise the user load will be decreased to 200 concurrent users and verify the system returns to normal operation and retaining the performance as initiated.

Pre-requisites NFR document should be available – It will provide you the expected Response time
and required Concurrent user load, Scenarios to be tested and other performance attributes.
Dedicated Performance test environment should be ready in place.
Scalability on the test environment to the actual production environment should be available.
Gather the environment details like App, Web and DB servers configurations and their capacity.
Performance Test approach document should be ready and sing-off from the stake holders.

Load Testing Toolso JMeter, an open source tool from Appache
o Load Runner, commercial load testing tool from HP
o RPT, commercial load test tool from IBM
o NeoLoad, commercial, for Windows, Linux, Solaris
o Microsoft Visual Studio Team System 2010, commercial, for Windows, which includes Load Test Analyzer and Load Test Monitor tools.
o OpenLoad, commercial load testing tool and hosted service
o OpenSTA, an open source tool
o PureLoad, commercial, multiplatform load testing tool
o PushToTest TestMaker, an open source testing framework (load testing and more)
o QEngine, free and commercial, from AdventNet (free edition supports 5 virtual users)
o SQLQueryStress Performance Testing Tool, free, for testing SQL Server StressIT, commercial and free
o The Grinder, an open source tool
o Flood, open source from and for Apache
o WAPT, Web Application Testing tool, a commercial product, for Windows
o WatchMouse, commercial hosted load testing service
o WebKing, commercial, multiplatform
o WebServer Stress Tool, commercial and free, from Paessler

Why JMeter? It is an Open source tool.
Can load and performance test many different server types:
Web - HTTP, HTTPS
SOAP
Database via JDBC
LDAP
JMS
Mail - POP3(S) and IMAP(S)
User friendly GUI Design compare to other tools.
Full multithreading framework allows concurrent sampling by many threads and simultaneous sampling of different functions by separate thread groups.
Caching and Cookies can be enabled and it impact as such as it is executing in the web browser.
Controllers are configurable and can monitor the server performance.
Test results are more reliable compare to other open source tools.
Test results can be captured in various format like summary report, Graph, Aggregate report, Aggregate graph, Results in tree and Results in Table.

Installing Jmeter Install Java (1.6 or higher)
Download Latest Jmeter: http://jmeter.apache.org/download_jmeter.cgi
Add path of java installation in environment path variables.

Running JMeter In Windows Open command prompt (user administrative mode to avoid unnecessary hassle).
Traverse to jmeter installation path]\bin
Run Jmeter.bat

Elements of Test Plans Thread Group
Setup number of thread
Set up ramp up period
No. of times test executes
Controllers
Sampler (Send Request to Server)
Logical Controller (Customize logic to send request)
Listener
Graph Result
View Results Tree and many more.
Timers
Delay next request for certain amount of time
Elements of Test Plans (Continued…) Assertions
Allow you to assert fact about responses received from HTTP request
Configuration Elements
Allow you configure settings
Preprocessor
Execute prior to sampler request
Post Processor
Execute some action after sampler request

Creating web test plan

Adding Thread group to Test plan

Adding controllers to the Thread group

Adding users 5 users send 2 requests on google.com and repeat it twice. (5 users x 2 requests x 2 repeat = 20
requests)
Right click on test note >> Add >> Thread (users) >> Thread Group

Add default http request You can add default http request setting from ADD >> Config Element >> HTTP request
default.
This will let you define default http parameter for every request.
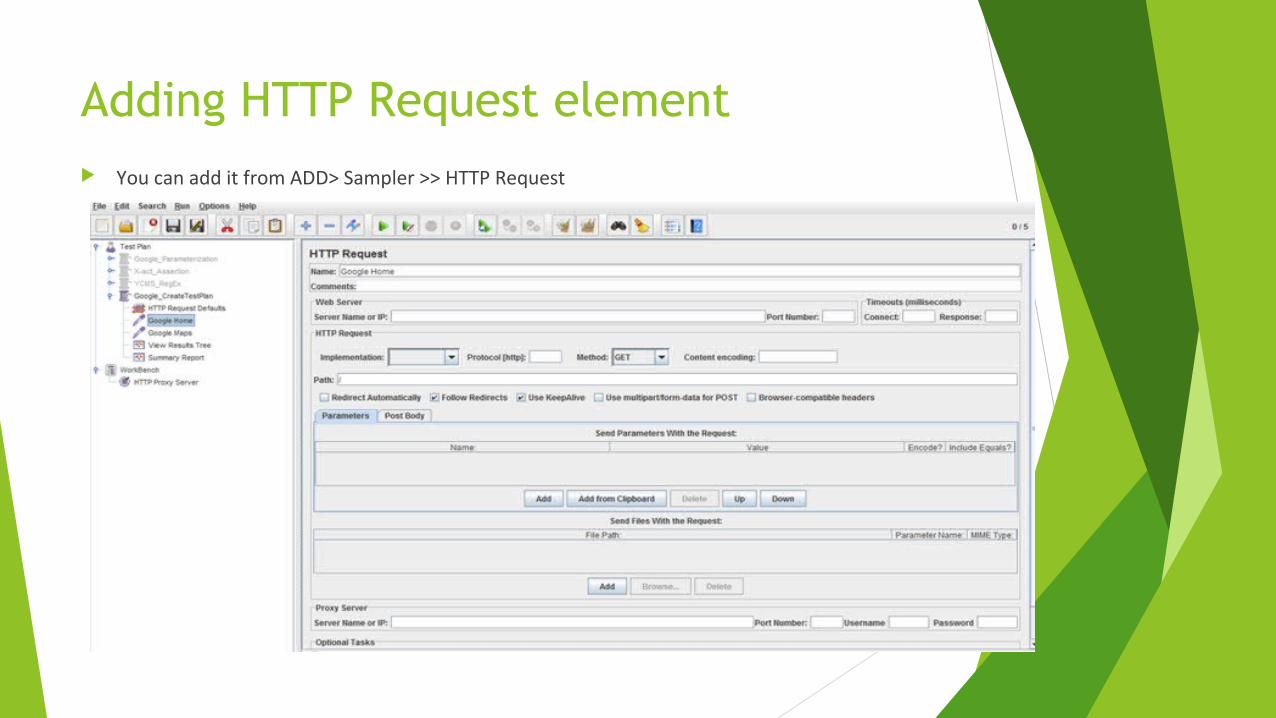
Adding HTTP Request element You can add it from ADD> Sampler >> HTTP Request

Adding Listener to view Result
Listener responsible for storing all of the results of our HTTP request and presenting in Visualize mode.
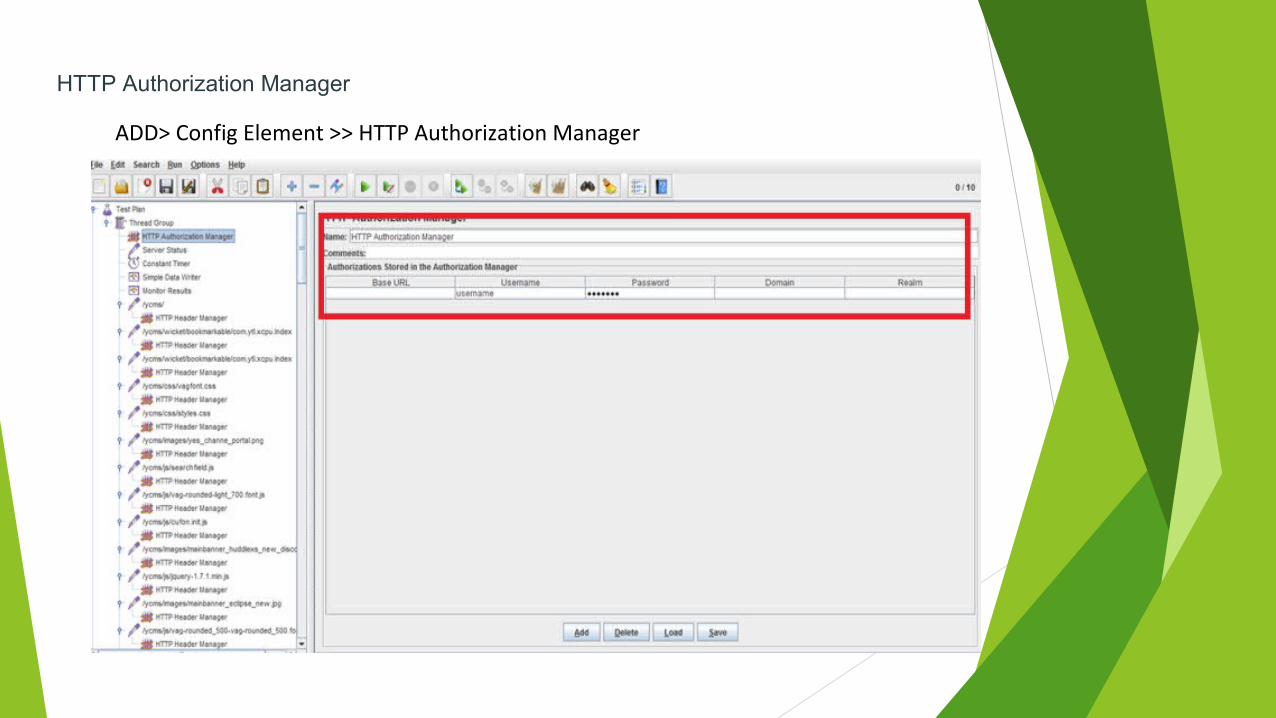
HTTP Authorization Manager
ADD> Config Element >> HTTP Authorization Manager

DEMO
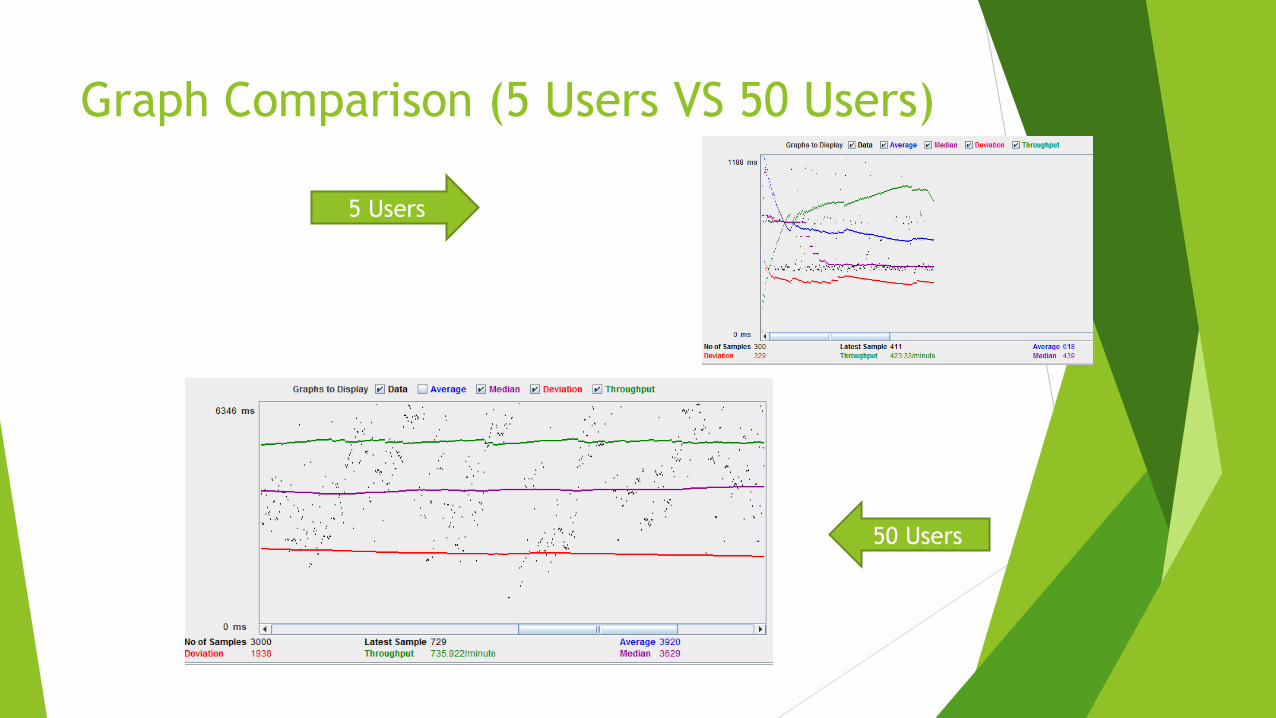
Graph Comparison (5 Users VS 50 Users)
5 Users
50 Users

Test Summary5 Users
50 Users

Recording your Test Plan
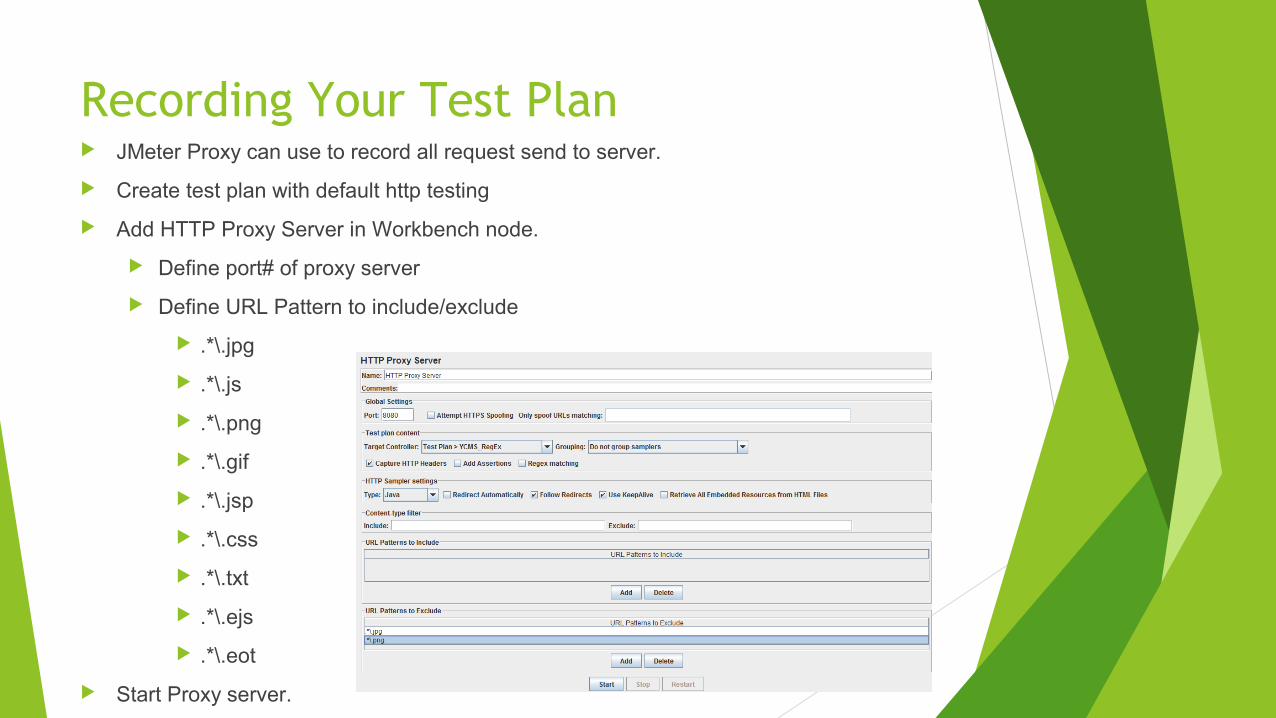
Recording Your Test Plan JMeter Proxy can use to record all request send to server.
Create test plan with default http testing
Add HTTP Proxy Server in Workbench node.
Define port# of proxy server
Define URL Pattern to include/exclude
.*\.jpg
.*\.js
.*\.png
.*\.gif
.*\.jsp
.*\.css
.*\.txt
.*\.ejs
.*\.eot
Start Proxy server.

Recording Your Test Plan Setup Proxy server on your browser.
Start Recording using the Web Browser.
All the Request will be captured in the Test plan.

Controlling request logic
Logic Controllers can be used to control flow.

Parameterization
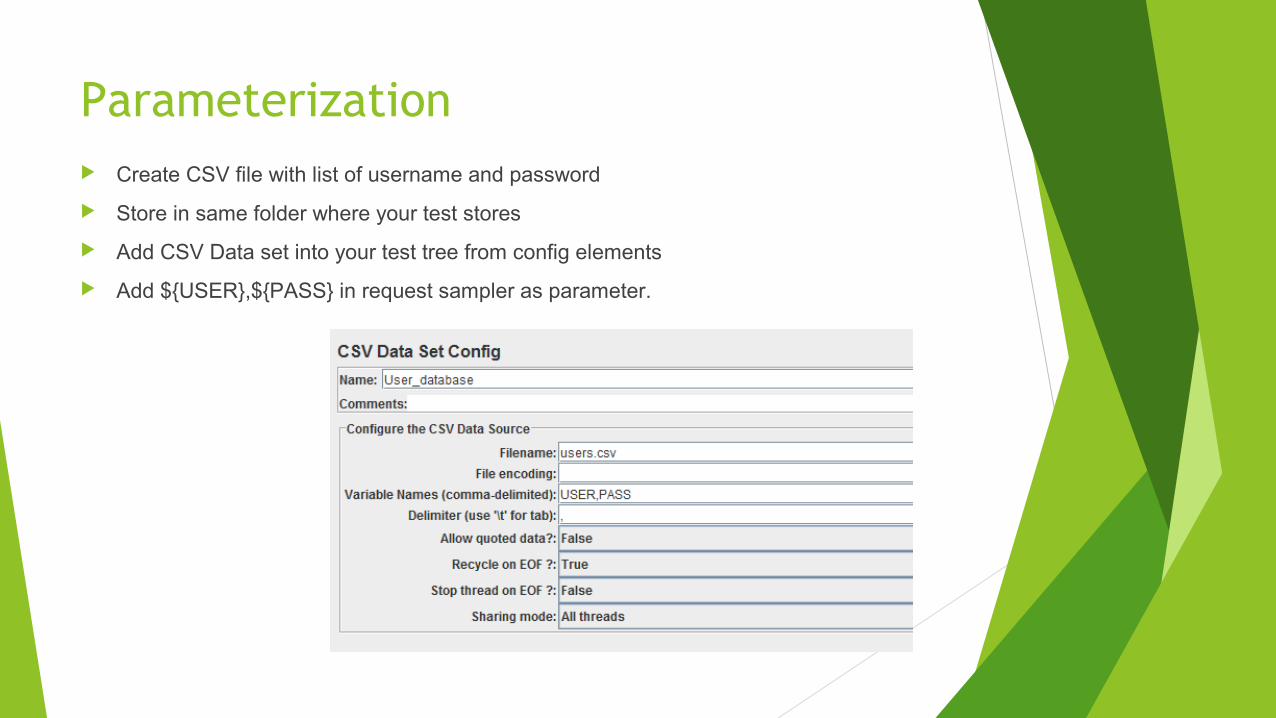
Parameterization Create CSV file with list of username and password
Store in same folder where your test stores
Add CSV Data set into your test tree from config elements
Add ${USER},${PASS} in request sampler as parameter.

Correlation

Correlation Correlation is used to obtain data which is unique for each run of your test script (ex:
session ids). While recording, these dynamic values are hard-coded in your script causing the script to fail during playback. Correlation is a technique where dynamic values are not hard-coded in your script but are extracted at run-time to avoid failure
Correlation will be done using the Regular Expression Extractor in Jmeter.
Sample of Regular Expression and Usage:
([^"]+) to correlate whole url/dynamic id
Ex: Edmiijkn11124mmk
SessionID=(.+?)& to correlate the url/dynamic id between 2 parameter. Here it’s between ‘SessionID=‘ and ‘&’ Need to be use if
EX: SessionID=jkjoujn434897h3jh35y9h&OrderID=ikikikke99874kmnjhh2

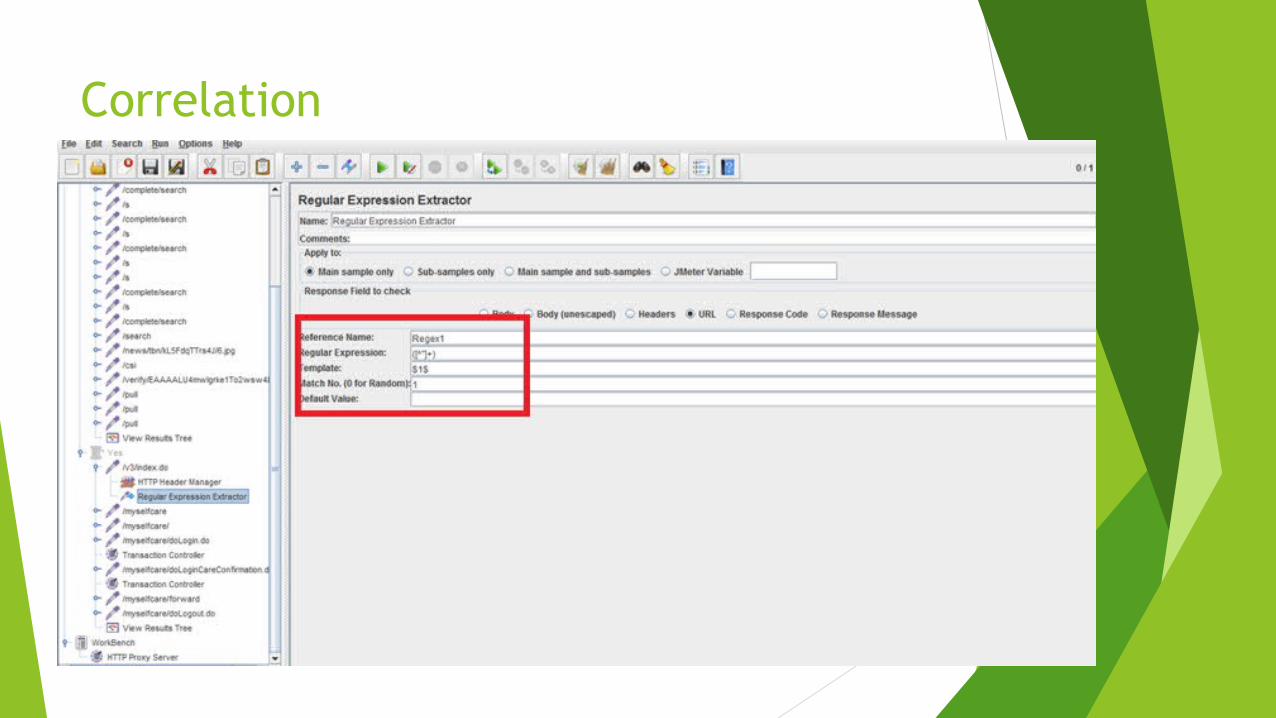
Correlation - Regular Expression Extractor
Right click the node/url > Add > Post Processor > Regular Expression Extractor
Defining Regular Expression Extractor:
Reference name: Regex
Regular Expression : ([^"]+)
Template : $1$
Match no : 1
Hint:
1. Need to tag/replace the reference name Regex by ${Regex} in the URL /Dynamic Id.
2. Regular expression can be done before URL where the Dynamic Id/URL you found.
Correlation

Assertion

• Allow you to assert fact about responses received from HTTP request ADD> Assertion >> Response Assertion
Response Assertion
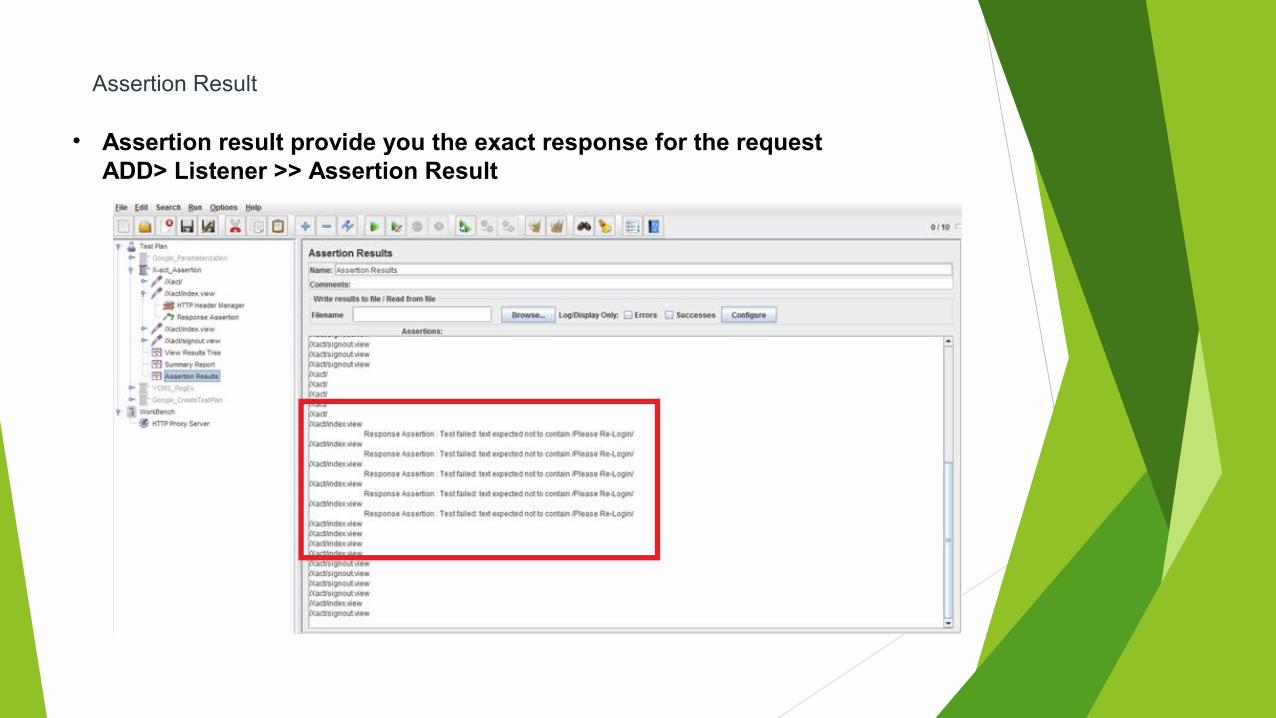
• Assertion result provide you the exact response for the requestADD> Listener >> Assertion Result
Assertion Result

Monitor Sever Performance

App/DB/Web Server configuration
ADD> Sampler >> HTTP Request•Name the http request as Server Status, Provide the server IP and port•Mention “/manager/status” in the path
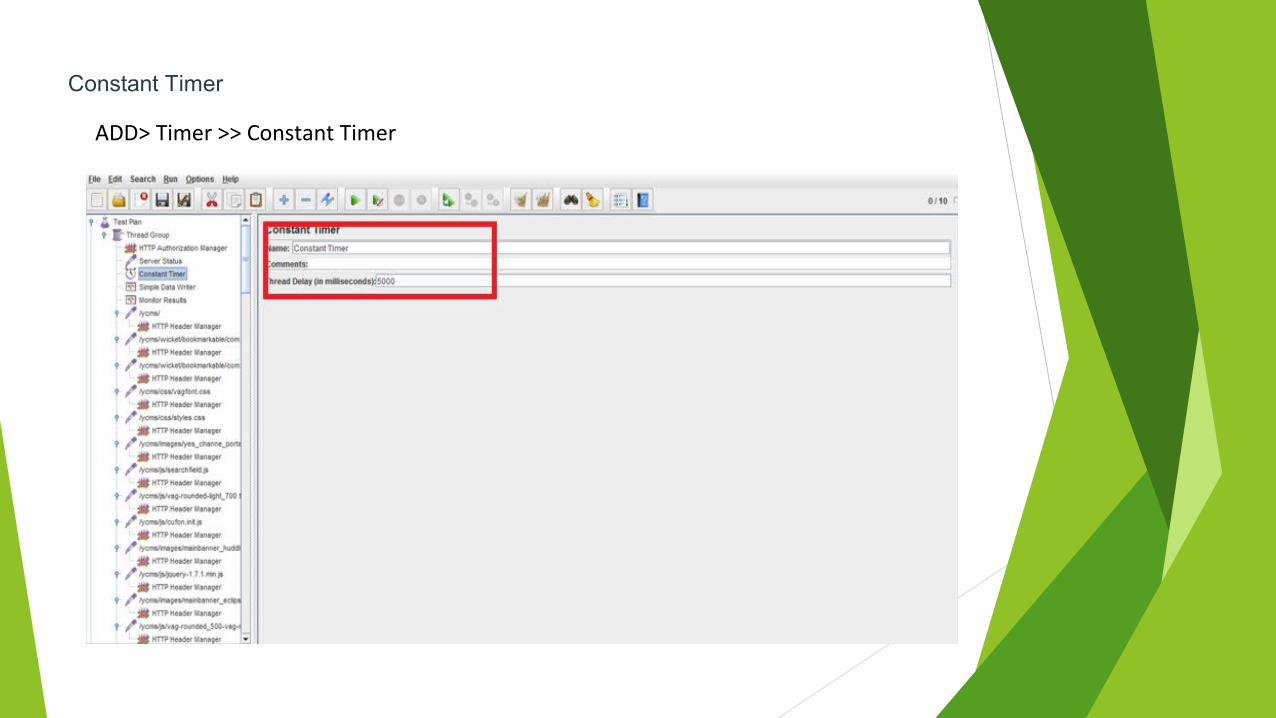
Constant Timer
ADD> Timer >> Constant Timer
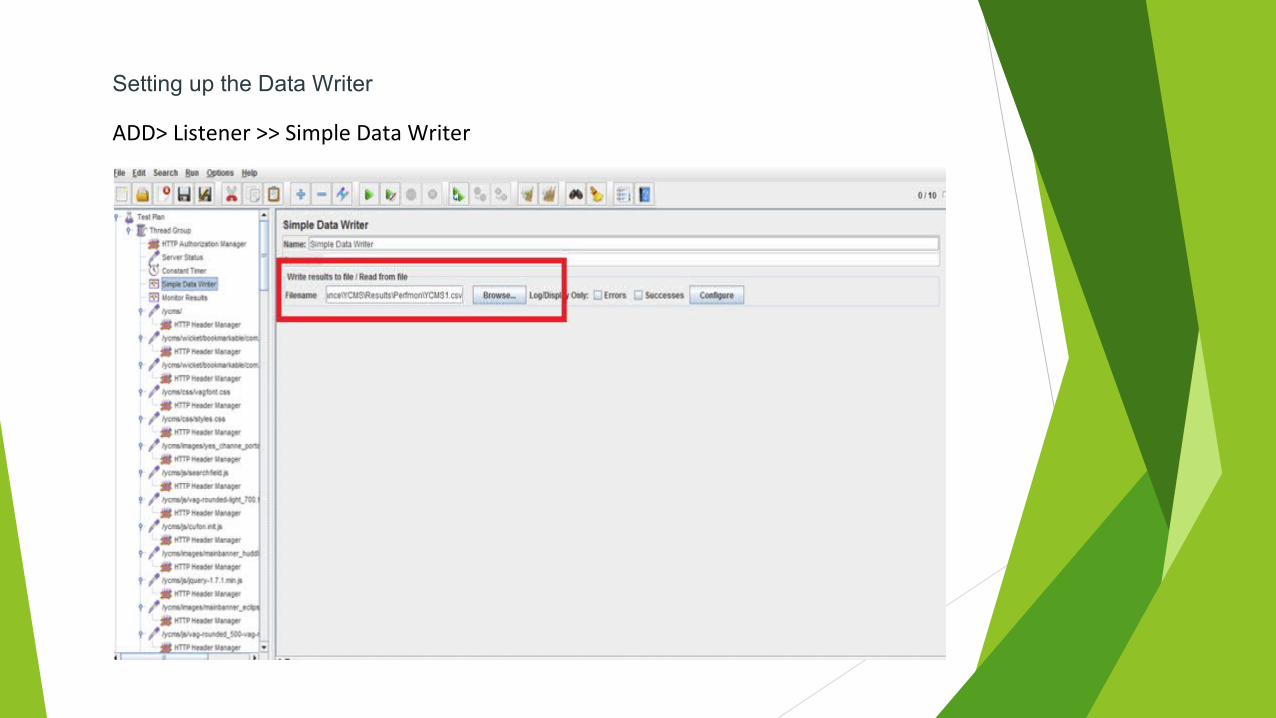
Setting up the Data Writer
ADD> Listener >> Simple Data Writer

Setting up monitor results
ADD> Listener >> Monitor Results

Distributed Testing
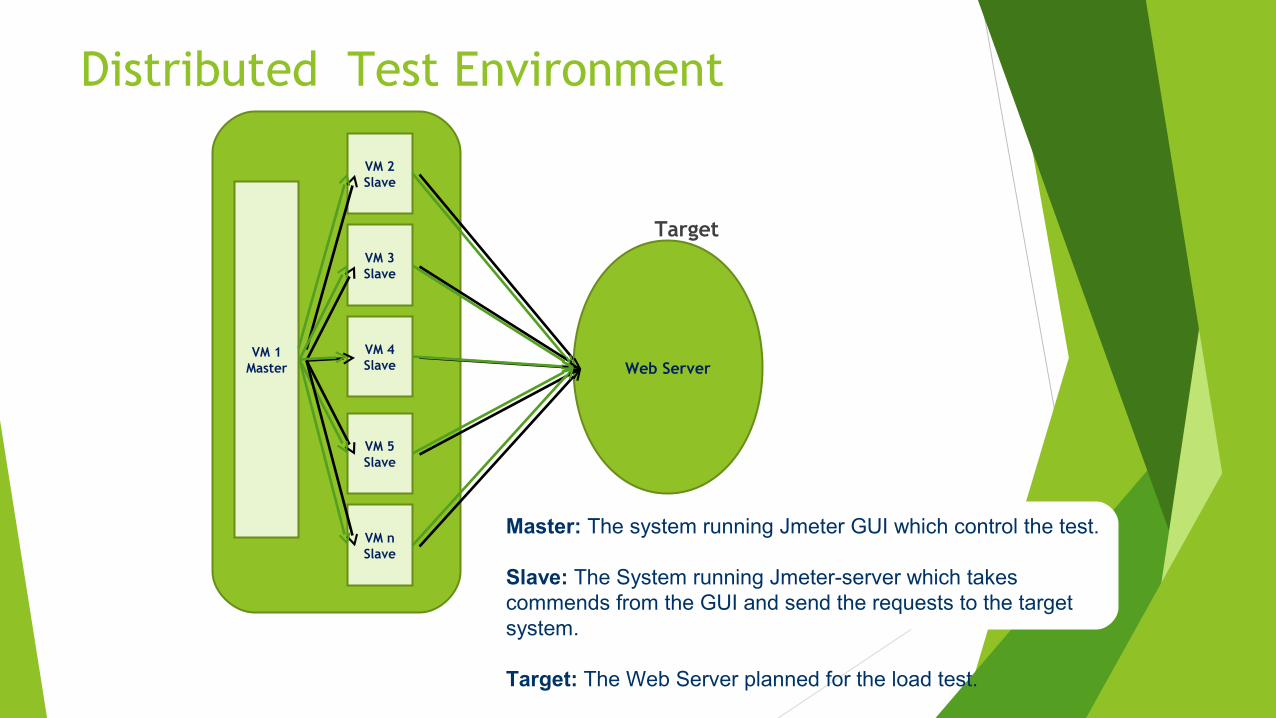
Distributed Test Environment
Target
VM 1 Master
VM 2 Slave
VM 3 Slave
VM 4 Slave
VM 5 Slave
VM n Slave
Web Server
Master: The system running Jmeter GUI which control the test.
Slave: The System running Jmeter-server which takes commends from the GUI and send the requests to the target system.
Target: The Web Server planned for the load test.

Jmeter Distributed Testing
JMeter client machine may not able to simulate enough users to stress server.
Control multiple machine to run JMeter without copying test samples to different machine.
Configuration:
Copy same version of JMeter to different computer.
Add remote node IP in JMeter.proeprties file.
Run JMeter on remote machine using /JMETER_HOME/bin/jmeter-server (in command prompt)
Start JMeter GUI in host machine.
Select any test plan.
Go to Run >> Remote Start >> Remote IP Address.

Thank you