Embed Size (px)
Citation preview

RESEARCH ARTICLE
SOCIAL MEDIA, TRADITIONAL MEDIA, AND MUSIC SALES1
Sanjeev DewanPaul Merage School of Business, University of California, Irvine,
Irvine, CA 92697 U.S.A. {[email protected]}
Jui RamaprasadDesautels Faculty of Management, McGill University,
Montreal, QC H3A 1G5 CANADA {[email protected]}
Motivated by the growing importance of social media, this paper examines the relationship between new media,old media, and sales in the context of the music industry. In particular, we study the interplay between blogbuzz, radio play, and music sales at both the album and song levels of analysis. We employ the panel vectorautoregression (PVAR) methodology, an extension of vector autoregression to panel data. We find that radioplay is consistently and positively related to future sales at both the song and album levels. Blog buzz, however,is not related to album sales and negatively related to song sales, suggesting that sales displacement due to freeonline sampling dominates any positive word-of-mouth effects of song buzz on sales. Further, the negativerelationship between song buzz and sales is stronger for niche music relative to mainstream music, and for lesspopular songs within albums. We discuss the implications of these results for both research and practiceregarding the role of new media in the music industry.
Keywords: Social media, traditional media, music industry, panel vector auto-regression, blog buzz, musicsales
Introduction1
New media driven by user-generated content is starting todisplace traditional media in terms of the way consumerslearn about products and services, and even how theyconsume them. The music industry is a bellwether for thisrevolution, where social media are increasingly used forsharing information about music albums and songs—and alsofor the sharing of the music itself. Traditionally, users dis-covered music either through radio play or from their friends,and consumed it through album purchases (see Peitz andWaelbroeck 2004). Now, users are increasingly discoveringmusic through social media (such as music blogs and onlinemusic services) and consuming digital versions of songs andalbums, often made available online by other consumers. These dynamics are not only changing consumer behavior but
also impacting the size and shape of music sales (see Dewanand Ramaprasad 2008, 2012). Our objective in this study isto examine the interaction between new media, traditionalmedia, and sales as it applies to the music industry.
The recent disruption of the music industry can be traced backto the arrival of online peer-to-peer technologies such asNapster. The key to the disruption were two characteristicsof music: the information goods nature of the product andthat it is an experience good. The fact that songs are infor-mation goods makes them shareable, free, and able to bedistributed unbundled from the album. With the arrival ofsocial media, people have many alternatives for discoveringnew artists, sharing recommendations, and consuming music. Discovery and sharing now often go hand-in-hand, whereindividuals can not only share their recommendations, but canshare the actual music and allow others to sample it. Many ofthese interactions between individuals have been enabledthrough social media, including individual blogs, sites such as
1Ravi Bapna was the accepting senior editor for this paper. Gautam Rayserved as the associate editor.
MIS Quarterly Vol. 38 No. 1, pp. 101-121/March 2014 101
Dewan and Ramaprasad/Social Media, Traditional Media, and Music Sales
Last.fm, the Hype Machine, Mog, and Pandora, and videostreaming sites like YouTube.
The decline of sales in the music industry over the last decadehas often been attributed to peer-to-peer sharing of musiconline (Siwek 2007), with record labels arguing that this hascost the record industry $55 billion in revenue over the lastdecade (Ehlrich 2011). In 2010 alone, revenues from globalrecorded music fell by over 8 percent, amounting to almost$1.5 billion. The increase in digital sales of 5.3 percent ($4.6billion) did not compensate for the decline in physical sales of14.2 percent or $10.4 billion.2 Looking at just the UnitedStates shows a similar story: overall shipments of recordedmusic in the United States fell 11 percent to $6.9 billion,while growth in digital formats only partially offset a declineof 20 percent by value in physical formats. Our empiricalanalysis addresses in part the impact of new media on musicsales, both at the album and song level. Specifically, ourresearch questions are
• What are the relative impacts of social versus traditionalmedia on music sales?
• How do these impacts vary at the song-level versus thealbum-level, and for mainstream versus niche music?
To address these questions, we have assembled music albumand song sales data from Nielsen SoundScan, and obtainedradio play data from the same source as well. Our socialmedia variables are constructed from the volume of blog postsabout the album or song in question, which we call blog buzz,and it is measured using Google Blog Search. This is consis-tent with the approach of Stephen and Galak (2012) and Dharand Chang (2009) who also operationalize online buzzthrough measures of volume of postings online. Our blogbuzz measure captures—among other things—music blogactivity, which is arguably the primary mechanism by whichconsumers share music and music-related information witheach other. While blog buzz is no doubt a narrower measurethan social media buzz (which includes music sharing onFacebook, Twitter, MySpace, etc.), we find that blog buzz ishighly correlated with other online music activity, such asLast.fm listens and Amazon music sales rank, suggesting thatblog buzz is likely a good proxy for overall social mediamusic interaction.
Our empirical analysis is conducted using the panel vectorautoregression (PVAR) model, which is an extension of tradi-tional VAR for panel data. The advantages of using thePVAR approach, as opposed to traditional multiple regres-sion, are as follows: First, we are able to treat all of the key
variables (buzz, radio play, and sales) as jointly endogenous,and assess the nature of bidirectional causality between allpairs of variables. Second, the model allows for lagged ef-fects within and across time series, so we can understand thedynamic relationships between all variables. Third, we areable to illustrate the effects of a shock in one variable on othervariables as a function of time, using impulse responsefunctions.
A summary of our findings is as follows: We find that therelationship between traditional media and sales and socialmedia and sales differ from each other. These relationshipsare also different at the song level versus the album level. Specifically, we find that traditional media (radio play) has apositive relationship with both song and album sales.Interestingly, the relationship between social media (blogbuzz) and album sales is largely insignificant, while the rela-tionship between social media and sales at the song level isnegative. Further, this negative relationship is more signifi-cant for niche music as compared to mainstream music andfor the less popular songs in an album.
Our explanation for this surprising negative relative relation-ship between song buzz and song sales centers on the dualnature of social media, as a platform for sharing not justinformation and opinions about music, but also for sharing themusic itself. A spike in blog buzz about a piece of music istypically accompanied by a contemporaneous spike in thesupply of free shareable music online. The negative associa-tion between song buzz and sales is likely due to the fact thatthe sales displacement caused by free online samplingdominates any potential incremental sales due to positiveword-of-mouth influence of buzz on sales. It is important tonote that our results reflect short-term dynamics between buzzand sales, and they do not rule out the possibility of positiveimpacts of song/album buzz on sales in the long term.
The rest of the paper is structured as follows. The nextsection provides an overview of the relevant prior literatureand lays out the theoretical underpinnings of our work. Wethen develop our PVAR empirical specification, after whichwe describe the data we have assembled for this study anddiscuss our results and robustness checks. In the final section,we provide some discussion and concluding remarks.
Background and Prior Literature
Related Prior Work
Our analysis draws from and contributes to the literaturedealing with (1) social media and market outcomes and2http://76.74.24.142/DB3D7CCB-1E88-03DF-387D-E0F1FBBC4775.pdf.
102 MIS Quarterly Vol. 38 No. 1/March 2014

Dewan and Ramaprasad/Social Media, Traditional Media, and Music Sales
(2) impact of social media in the music industry. A key issueaddressed in the first stream of the literature has to do with theinfluence of consumer opinions (reviews, recommendations)and actions (consumption choices) on product sales. A num-ber of papers have examined the influence of product reviewson sales, such as Godes and Mayzlin (2004) for TV showratings, Chevalier and Mayzlin (2006) for books, andChintagunta et al. (2010), Dellarocas et al. (2007), Duan etal. (2008), Liu (2006), and Moon et al. (2010) for movies.
Typical results in this body of work are as follow: productsales are positively related to the volume and valence (e.g.,star rating) of reviews; negative reviews are more influentialthan positive ones; consumer word of mouth is more impor-tant for niche products; featured reviews and reviews postedby reputable reviewers are more impactful (Forman et al.2008); and the actual text of reviews offers incrementalexplanatory power beyond the average ratings (Ghose andIpeirotis 2011). In a different context, Dewan and Hsu (2004)studied the impact of seller ratings (a product of word-of-mouth) on probability of sale and price in online auctions oneBay. Finally, some studies have looked at the role of obser-vational learning, or learning from the past actions of otherconsumers, on product sales; for example, Chen et al. (2010)found that the display of product popularity information onAmazon is associated with increased incremental sales.
More recent research has examined the association betweensocial media activity and market outcomes. For example,Onishi and Manchanda (2012) look at the impact of bloggingon product sales of three products in Japan: green tea drinks,movies, and cellular phone subscriptions. They find a clearlink between blogging volume and valence on product sales.They also examine the interaction between new media andtraditional media and find that TV advertising has the effectof spurring additional blogging activity, especially in the pre-release period. Rui et al. (2011) examine the relationshipbetween Twitter messages and sales, finding that valence ofthe tweet, influence level of the tweeter, and the intentionexpressed by the tweeter to watch a specific film all matterwhen examining the influence on sales. The study closest toour research questions, Dhar and Chang (2009), asks whetherblog “chatter” is predictive of future album sales. Sales areimputed from Amazon album sales rank and blog chatter ismeasured by the total number of blog posts about the albumusing Technorati blog search. The results suggest that blogchatter is predictive of future sales, as is the volume of main-stream reviews, but the number of MySpace friends is notsignificant. While our study has similar goals to Dhar andChang, there are a number of key differences. We haveobtained actual music sales data (from Nielsen SoundScan) atboth the album and song level. Further, we look at blog buzz
at both the album and song levels. Our analysis incorporatesboth new media (blog buzz) and traditional media (radio play)and examines the possibility of bidirectional causality usingGranger causality and panel vector autoregression (PVAR).
Our research also contributes to the literature that hasexamined the impact of emerging technologies on the musicindustry. Given the decline in music sales, there is significantresearch attention given to questions of whether and to whatextent new technologies and media are responsible for thesales decline. With respect to peer-to-peer music sharingtechnologies, Rob and Waldfogel (2006) estimate that eachalbum download displaces purchases by 0.2 albums. Simi-larly, Zentner (2006) finds that peer-to-peer usage reduces theprobability of buying music by 30 percent. In a more recentstudy, Waldfogel (2010) reexamines the issue of sales dis-placement due to illegal file sharing in the presence of a legaldownload service: iTunes. The real-world experiment, whichused University of Pennsylvania undergraduates as subjects,found that an additional song illegally downloaded reducespaid consumption by between a third and a sixth of a song,which is similar in magnitude to the earlier study. The studyby Liebowitz (2004) similarly found that file sharing and mp3downloads have resulted in sales displacement at the rate of15 to 20 percent.
Other research is examining the impact of social media onmusic sales, of which the Dhar and Chang study is oneexample. In the same vein, Morales-Arroyo and Pandey(2010) and Abel et al. (2010) also examine the value ofelectronic word-of-mouth (WOM) and online chatter, respec-tively, in predicting future music album sales. Chellappa andChen (2009) show that sampling on MySpace has a positiverelationship with music purchases. Chen et al. (2011) alsolook at MySpace data and find that music sales are positivelyrelated with bulletins and friend’s updates on the artist’sprofile pages. These effects are amplified by the number offriends that the artist has on MySpace.
Dewan and Ramaprasad (2012) shift the focus from sales toa different form of music consumption, which is full-trackonline sampling, a form of free consumption enabled by theability of users to upload and share digital versions of songs(see also Peitz and Waelbroeck 2006). Based on data fromone of the largest music blog aggregators, and motivated bytheories of observational learning, Dewan and Ramaprasad(2012) document robust empirical results showing that musicsampling is positively associated with music and blog popu-larity, and these effects are stronger for niche music as com-pared to mainstream music, raising some intriguing questionsabout the potential long-tailing of music sampling and sales.Dewan and Ramaprasad (2008) is similar in spirit to the
MIS Quarterly Vol. 38 No. 1/March 2014 103

Dewan and Ramaprasad/Social Media, Traditional Media, and Music Sales
present study, but the research design is limited to albums (notsongs) and social media alone (not radio play).
Theoretical Background
The objective of this paper, as illustrated in the conceptualframework of Figure 1, is to understand the interactionsbetween new media (blog buzz), traditional media (radioplay), and music sales at both the album and song levels. Weare also interested in understanding how these interactions aremoderated by music characteristics such as niche versusmainstream music, as indicated by the type of record label(major or independent) and artist reputation. Within thisbroad framework, we are most interested in the effect of buzzon music sales, which is where we start our discussion.
We can posit both a positive and a negative associationbetween social media buzz and music sales. The positiveeffect of buzz on sales is due to the WOM effect, wherebysocial interactions and influence between consumers affectconsumer decision making. The blogging and sharing of apiece of music implicitly conveys a positive opinion about thepiece, potentially influencing other consumers to not onlysample the music, usually through full-track streaming(Dewan and Ramaprasad 2012), but to purchase it as well(Dhar and Chang 2009). Indeed, a recent music consumersurvey (Nielsen 2012) indicates that positive recommen-dations from a friend and positive feedback from a blog orchat room are among the most likely factors to influencemusic purchase decisions, which is consistent with King andBalasubramanian’s (1994) argument that other-based prefer-ence formation is particularly important for experience goods. In the aggregate, the higher the buzz about a piece of music,the greater the potential influence on consumers, whichshould ultimately translate into higher sales of the music thatis blogged about.
We turn now to the potential negative effect of buzz on sales,which on the face of it appears quite counterintuitive. It arisesfrom the information goods nature of music and the dualnature of social media, not only as a disseminator of infor-mation about music (i.e., a source of WOM) but as a platformfor sharing the music as well. Here, music is typically con-sumed through the use of full-track streaming, which we havereferred to as sampling in prior work (see Dewan and Rama-prasad 2012). In other words, social media such as musicblogs can be used by consumers not only to share musicconsumption choices and opinions, but also to share the actualmusic itself. Indeed, the typical music blog post includes adiscussion of songs, albums, or artists along with mp3 links
for the streaming of specific songs that the blogger chooses toshare. It is not uncommon for an entire blog post to consist ofa listing of mp3 links for all of the songs from an album. Thus, a spike in buzz about a piece of music increases thevolume of information about it, and at the same time the spikein buzz also results in a jump in the supply of free music thatis easily accessible by interested consumers. Indeed, musicconsumption through full-track streaming is a free substitutefor consumption through sales, and this sampling-driven salesdisplacement leads to the negative effect of buzz on sales. Whether or not this negative effect dominates the afore-mentioned positive WOM effect is ultimately an empiricalquestion, which we hope to answer through our analysis.
The next question of theoretical interest is how the rela-tionship between buzz and sales is different across differentcategories of music characteristics. The key characteristicsthat we focus on are music preference (mainstream or niche)and consumption preference (albums or songs). Table 1 sum-marizes how these characteristics interact to affect the modesof music discovery (traditional media or social media) andconsumption (CDs or digital downloads). Mainstream musicis that music preferred by the mass market, and thus morelikely to be publicized and discovered through traditionalmedia, while niche music has an inherently smaller market ofinterested consumers. Niche music is almost exclusivelydiscovered through social media, not only through blog posts,but also through videos on YouTube or recommendationsthrough online music sites. This is because niche music doesnot get the attention of traditional media unless it becomeswildly popular (see Stephen and Galak 2012). In terms ofconsumption, albums tend to be consumed in the form ofCDs—60 percent of purchased albums are physical CDs―although digital downloads of entire albums is catching upbecause it is seen as a better value than physical CDs (Nielsen2012). Songs, on the other hand, are almost exclusivelyconsumed via digital downloads (Nielsen 2012).
Thus, given that songs are discovered and consumed online,whereas the majority of this process is offline for albums, andsince free sampling is a closer substitute for digital down-loads, we expect that the sales displacement effect will bestronger at the song level as compared to the album level. Onthe other hand, these differences between albums and songsdo not affect the impact of positive WOM, and therefore theWOM effect would be comparable for albums and songs. Together, we can predict a positive association between buzzand sales for albums, but the corresponding prediction at thesong level is ambiguous, due to the countervailing positiveWOM effect and negative free online consumption effect.
104 MIS Quarterly Vol. 38 No. 1/March 2014

Dewan and Ramaprasad/Social Media, Traditional Media, and Music Sales
Song Buzz
Album Buzz
Song Sales
Album Sales
Radio Play
MusicCharacteristics
Figure 1. Conceptual Framework
Table 1. Primary Modes of Music Discovery and Consumption
ConsumptionPreference
MusicPreference
Albums Songs
MainstreamTraditional Media Social and Traditional Media
CD’s Digital Downloads
NicheSocial Media Social Media
CD’s Digital Downloads
Note: In each quadrant, the top and bottom cells indicate the modes of music discovery and consumption, respectively.
The scenario at the song level may become less ambiguouswhen distinguishing between mainstream versus niche songs. Indeed, as Table 1 shows, the difference between the twotypes of songs is that whereas the most popular mainstreamsongs might be discovered via traditional media, niche songsare almost always discovered via social media. Thus, forniche songs, music discovery and consumption are bothonline (usually separated by a single click), but for main-stream songs, discovery and consumption are less synchro-nized and typically occur on different media. Therefore, it isreasonable to conclude that the sales displacement effect offree sampling would be stronger for niche songs as comparedto mainstream songs, and we can more confidently predict anegative relationship between buzz and sales for niche songsrelative to mainstream songs.
The different effect of social media versus traditional mediaon market outcomes is also one that has been recently ex-
plored. Trusov et al. (2009) find that the WOM effect lastslonger than the effects of traditional marketing when lookingat the impact on sign-ups to a social networking site. Stephenand Galak (2012) find that social media activity does impactsales (loans on Kiva.org), but only through the effect thatsocial media has on traditional media. In the case of music,while the effect of social media on song sales is uncertain, asdiscussed above, we would expect a positive relationshipbetween traditional media (radio play) and sales, due to thetremendous exposure enjoyed by the select few songs singledout to be played on radio, TV, cable, or other traditionalmedia. Accordingly, we expect differences in the impact oftraditional and social media on music consumption, which wehope to tease out in our analysis.
Our study is more comprehensive in scope than prior studiesin at least three ways. First, we look at the relationship be-tween buzz and sales at both the album and song levels, while
MIS Quarterly Vol. 38 No. 1/March 2014 105

Dewan and Ramaprasad/Social Media, Traditional Media, and Music Sales
allowing for interactions across the levels. This is clearlyimportant given the dramatic shift in music sales from albumsto songs. Second, our research design incorporates both newmedia (social media) and traditional media (radio play), andthereby isolates the effect of social media beyond the effectsof mainstream media. Finally, while prior work has beenfocused solely on the role of social media as a word of mouthplatform, our study brings out the dual role of social media asboth a disseminator of music information, and as a mechanismfor sharing music in digital form.
We employ the PVAR method for our empirical analysis.The PVAR model is suitable for studying the relationshipsbetween a system of interdependent variables without im-posing ad hoc model restrictions; for example, assumingexogeneity of some of the variables, which other econometricmodeling techniques require (Adomavicius et al. 2012). Inother words, this method allows us to treat all of the keyvariables as jointly endogenous, and to explicate dynamiceffects, such as the impact of a shock in one variable on othervariables over time. While the use of PVAR is fairly nascent,it has recently been employed in the management literature,particularly in Finance and Marketing. In Finance, Love andZicchino (2006) examine the relationships between a coun-try’s financial development and its dynamic investmentbehavior, and Stanca and Gallegati (1999) study the link be-tween firms’ financial decisions and their investment deci-sions. In Marketing, PVAR has been used to study the per-sistent effects of marketing investments on sales (Dekimpeand Hanssens 1995), the differential impact of marketing-induced versus WOM-induced customer acquisition (Villa-nueva et al. 2008), and the effects of WOM versus traditionalmarketing (Trusov et al. 2009). Chen et al. (2011) also usethe PVAR approach to examine artists’ MySpace broadcastson music sales as imputed from Amazon Sales Rank. Thefollowing section provides a detailed discussion of how weuse the PVAR method for the problem at hand.
Empirical Methodology
We examine the interactions between social media, traditionalmedia, and sales (see Figure 1) at both the song and albumlevels. To do this, we first conduct Granger causality tests toexamine the potential endogeneity between pairs of each ofour three key variables, first at the song level and then at thealbum level. Next, we conduct the PVAR analysis, whichallows us to understand the dynamic relationships between allvariables. In examining the results of the PVAR analysis, weestimate and interpret the regression coefficients, create andanalyze impulse response functions, and calculate elasticities
between our key variables. As in traditional VAR, PVARallows us to treat all variables as endogenous, but PVAR alsoallows estimation for multiple cross sections of data—some-thing not possible in traditional VAR. The panel nature of thedata allows us to handle unobserved individual heterogeneity,while treating all variables as endogenous (Love and Zicchino2006).
Our PVAR model is specified (for each song or album) asfollows:
(1)
S
B
R
S
B
R
t
t
t
j
J
t j t j t j
r j t j t j
t j t j t j
t j
t j
t j
S t
B t
R t
=
+
=
− − −
− − −
− − −
−
−
−
1
11 12 13
21 22 23
31 32 33
π π ππ π ππ π π
εεε
,
,
,
where St, Bt, and Rt denote weekly song sales, weekly songbuzz, and weekly radio play, in week t(t = 1, 3, …, T),respectively. J is the order of the model, which may bedetermined using Akaike’s information criterion (AIC). Forthe analysis at the album level, the variables St and Bt arereplaced by their album-level counterparts. Thus, in the song-level (album-level) analysis, song (album) sales is a functionof past song (album) sales, past song (album) buzz, past radioplay, and an error term. In the PVAR model, the coefficientsrepresent the relationship between the lagged values of eachof the variables (song sales, radio play, and buzz) and thevariable on the left-hand side. When looking at the impact onsong sales, for example, the coefficient on the first lag ofradio play indicates the percentage increase in song sales inthe following week corresponding to a 1 percent increase inradio play in the current week. Details of the variable opera-tionalization are provided in the “Data” section.
We determine the appropriate lag length J using Akaike’sinformation criterion (AIC), following the standard approachin the VAR literature (see Holtz-Eakin et al. 1988; Love andZicchino 2006). Specifically, we calculate AIC for each crosssection and take the modal value of the optimal lag lengthamong all cross sections. We performed two transformationsto the main variables. First, we took the natural log of thebuzz, sales, and radio play variables. In order to remove indi-vidual fixed effects that might affect our relationship ofinterest (such as song or album quality and advertisingbudgets), we performed the Helmert transformation on thesong buzz, album buzz, song sales, and radio play variablesfollowing Arellano and Bover (1995) and Love and Zicchino(2006). The Helmert transformation involves the forwardmean-differencing of the variables; that is, fixed effects areremoved by subtracting the mean of all future observationsavailable for each song-week. This transformation ensures
106 MIS Quarterly Vol. 38 No. 1/March 2014

Dewan and Ramaprasad/Social Media, Traditional Media, and Music Sales
orthogonality between the forward-differenced variables andtheir lagged values (see Love and Zicchino 2006). Therefore,to address the issue of simultaneity, the lagged regressors areused as instruments for the forward-differenced variables andthe system GMM estimator is used to allow for errorcorrelation across equations.
The PVAR analysis is supplemented with the analysis ofimpulse response functions (IRFs) to elucidate the dynamicsin the relationships of interest. IRFs show the response of onevariable to an exogenous shock (i.e., a one standard deviationshock) to another variable in the system, while holding allother shocks at zero. Using IRFs, we are able to visualize thedynamics of the pairwise relationships. In other words, wecan isolate the reaction of song (album) sales to an orthogonalshock in the song (album) buzz while holding radio play con-stant; similarly, we can isolate the reaction of song (album)sales to an orthogonal shock in radio play, while holding buzzconstant. Together, PVAR and impulse response functionsallow us to gain a comprehensive understanding of the rela-tionships between traditional media, social media, and sales.
In addition to the full-sample analysis described above, weconducted a set of subsample analyses in order to understandthe nuances in the set of the relationships represented in theconceptual model of Figure 1. That is, we are interested inunderstanding whether the relationships we observe are con-sistent for different types of music—music that is consideredmore and less niche. To do this, we conduct subsampleanalyses based on record label (major versus independent)and artist reputation (high and low).
Data
To conduct the PVAR analysis, we use two panel datasets. Atthe song level, we have a dataset including approximately1,000 cross sections across 24 time periods (weeks). That is,for a set of approximately 1,000 songs, we have obtainedweekly data on the volume of song-level blog buzz fromGoogle Blog search (used also in Stephen and Galak), song-level unit sales, and radio play (measured by the number of“spins”) from Nielsen SoundScan, for a period of 24 weeksin 2006. Specifically, the data covers the period of June 19,2006, to December 3, 2006. At the album level, we havecreated a panel of 594 albums across 24 weeks, using thealbums that correspond to the songs in the song-level dataset.To construct this dataset, we obtained weekly data on thevolume of album-level blog buzz using Google Blog Searchas well as album unit sales from Nielsen SoundScan. Tocreate the album-level radio play variable, we aggregated thesong radio play data in the song-level dataset to the album
level. We have supplemented these datasets to include infor-mation on record label and release date from allmusic.comand Amazon.com.
The blog buzz data was collected through Google BlogSearch, and is measured by the number of blogs that men-tioned both the exact artist name along with the exact songname (for song level) or the exact artist name and the exactalbum name (for album level) in a given week.3 This weeklyblog buzz data is matched with corresponding weekly songand album sales from Nielsen SoundScan. This data includesboth offline and online sales and is used to create theBillboard music charts. In doing this analysis, we includedonly songs and albums that have both sales and buzz obser-vations different from zero for at least one week during thespan of the 24 weeks we are analyzing.
We supplement this data with additional variables includingrecord label (independent versus major label) and artist repu-tation; these variables do not vary over time. Artist reputationis a dummy variable, indicating whether the artist was on theBillboard “Top Artists of the Year” in any of the yearsbetween 2002 and 2006 or if the artist was on the “All-TimeHot 100 Artists” list. If the artist was on either one of thesecharts in the years mentioned, the “artist reputation” variableis set to one; otherwise, it is zero. Summary statistics are pre-sented in Tables 2 and 3, at the song and album levels, respec-tively. At the song level, we see that the average number ofradio spins and the average song sales are higher for songsreleased by independent labels, although average song buzzis higher for songs and albums that are released by majorlabels. Radio play and song sales are higher for songs re-leased by artists who have a high artist reputation, while songbuzz is higher for songs released by artists who have a lowerartist reputation. At the album level, we see that radio play ishigher for independently released music, although album salesare lower. Album buzz is marginally higher for independentmusic. Turning to artist reputation, we see that radio play,album buzz, and album sales are all higher for albumsreleased by high reputation artists as compared to albumsreleased by artists who have not established themselves.
Results
At the outset, we tested our data for stationarity: to conductboth Granger causality and PVAR analysis, the variables mustbe stationary. We use the Harris-Tzavalis test (Harris and
3Song-level posts occasionally mention the corresponding album, and vice-versa, but this overlap is small and does not affect the qualitative nature ofour results (more on this in the subsection “Robustness Checks”).
MIS Quarterly Vol. 38 No. 1/March 2014 107

Dewan and Ramaprasad/Social Media, Traditional Media, and Music Sales
Table 2. Summary Statistics—Song Level
Full Sample Major Label Independent LabelHigh Artist Reputation
Low Artist Reputation
Radio Play (# spins)
60.197(487.843)
55.553(323.731)
70.238(725.193)
226.512(1157.973)
37.552(289.138)
Song Buzz(# blog posts)
768.327(7724.130)
934.972(9251.646)
407.970(1844.706)
311.3789(1512.064)
830.543(8212.332)
Song Sales (# units)
359.402(3295.174)
322.685(2092.771)
439.075(4986.696)
1227.048(8004.678)
241.324(1870.009)
No. ofobservations
23832(993 songs)
16296(679 songs)
7536(314 songs)
2856(119 songs)
20976(874 songs)
Table 3. Summary Statistics—Album Level
Full Sample Major Label Independent LabelHigh Artist Reputation
Low Artist Reputation
Album Radio Play 100.759(832.314)
88.724(412.519)
131.278(1420.182)
441.883(2325.136)
61.719(372.610)
Album Buzz(# blog posts)
27.685(142.795)
26.666(114.647)
29.207(196.899)
45.830(106.970)
25.274(146.192)
Album Sales(# units)
985.931(4594.503)
1145.933(5049.051)
580.213(3130.61)
2139.344(7634.342)
853.927(4086.542)
No. ofobservations
14256(594 albums)
10224(426 albums)
4032(168 albums)
1464(61 albums)
12792(533 albums)
Table 4. Harris-Tzavalis Unit Root Test
Rho Statistic Z p-value
Song Sales 0.674 -48.789 0.000
Song Buzz 0.101 -1.9e02 0.000
Song Airplay 0.421 -1.1e02 0.000
Album Sales 0.784 -17.029 0.000
Album Buzz 0.084 -1.5e02 0.000
Album Airplay 0.468 -76.377 0.000
Notes: The Harris-Tzavalis unit root test is appropriate for samples with a large number of cross-sections and comparatively fewer panels. The test here is conducted
on logged, Helmert transformed variables. The null hypothesis that the panels contain unit roots is rejected for all variables.
Table 5. Granger Causality Tests (Song-Level)
Dependent Variable
Song Sales Airplay Song Buzz
Song Sales — 17.32 (0.00) 9.15 (0.00)
Airplay 16.84 (0.00) — 3.35 (0.00)
Song Buzz 5.73(0.00) 4.60 (0.00) —
Notes: The results reported are the F-statistic with the p-value in parentheses. Granger Causality tests are performed with six lags for consistency with the PVAR
models (as selected by AIC).
108 MIS Quarterly Vol. 38 No. 1/March 2014

Dewan and Ramaprasad/Social Media, Traditional Media, and Music Sales
Table 6. Granger Causality Tests (Album-Level)
Dependent Variable
Album Sales Album Buzz Album Airplay
Album Sales — 9.75 (0.00) 12.81 (0.00)
Album Buzz 11.97 (0.00) — 2.66 (0.01)
Album Airplay 27.80 (0.00) 1.78 (0.10) —
Notes: The results reported are the F-statistic with the p-value in parentheses. Granger Causality tests are performed with 6 lags for consistency with the PVAR models(as selected by AIC).
Tzavalis 1999) for panel data. Results of this test arereported in Table 4 and indicate that all of the variables arestationary. Next, we conducted Granger causality tests. Theresults for these tests are reported in Tables 5 and 6 andshow clear evidence of bidirectional causality in each pair ofvariables, at both the song level and the album level. Thissupports our approach of analyzing the variables as a fulldynamic system (Trusov et al. 2009) through PVARanalysis. The results of this analysis are reported below.
Main Results
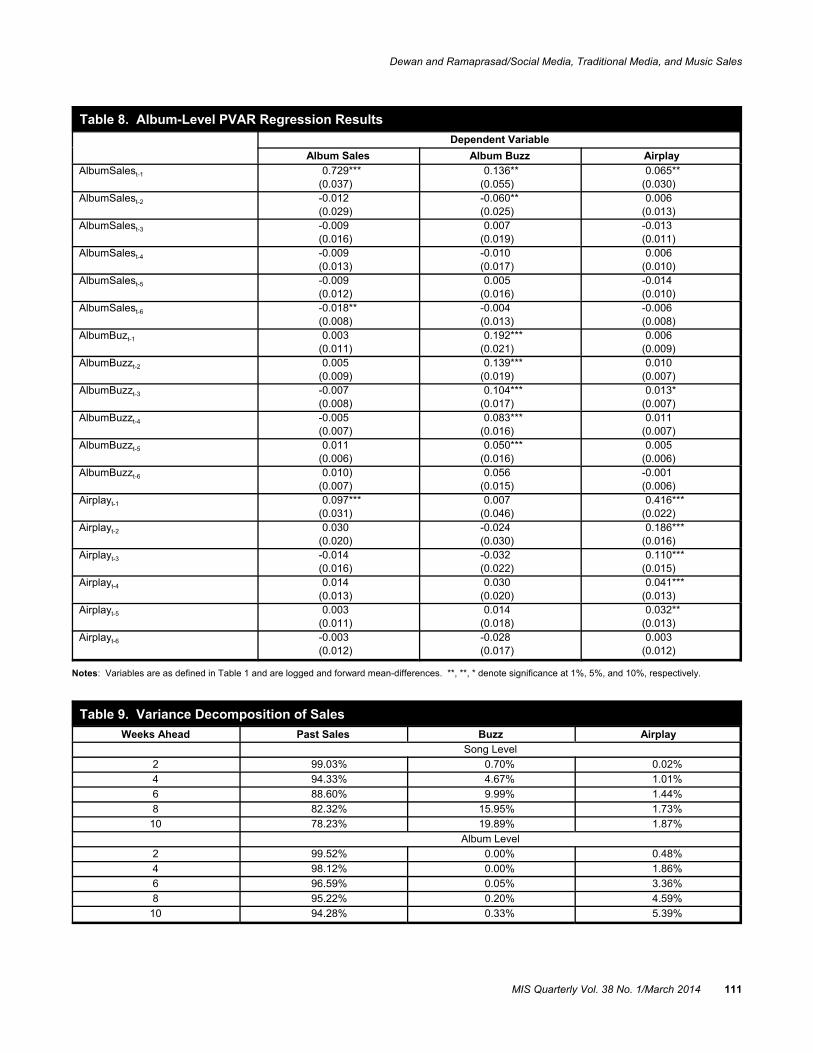
The results from our PVAR analysis (Equation 1) arereported in Tables 7 and 8, for the song and album levels,respectively. We first examine the results for the regressionswith sales as the dependent variable. Looking at the coeffi-cient estimates on the radio play variables, we see that theresults are fairly consistent at the song and album level: radio play has a short-term positive relationship with sales,as shown by the positive and significant coefficient on thefirst lag (album level) or two (song level) and insignificantcoefficients for the subsequent lags.
However, looking at the coefficient estimates on the laggedbuzz variables shows different relationships at the song andalbum levels. At the album level, we see that the coefficientestimates are insignificant across all lags, indicating thatbuzz at the album level does not have any discernible asso-ciation with sales, possibly because the positive and negativeeffects of buzz on sales balance each other out. At the songlevel, however, we see that the coefficient estimates on all ofthe lags are negative and significant suggesting that at thesong level buzz is negatively related to sales. These con-trasting results are interesting and suggest that blog buzzpotentially plays different roles in terms of predicting songversus album sales, as we discussed in the subsection“Theoretical Background.”
To further quantify the relative predictive power of each ofthe covariates for explaining the variance of sales, we con-duct a variance decomposition analysis, reported in Table 9.The table shows the decomposition for different number of
weeks ahead. What we see is that past sales are obviouslythe best predictor of future sales. However, the predictivepower of buzz increases over time at the song level, so thatabout 10 percent of the variance in sales is explained by buzzat Week 6 and almost 20 percent in Week 10. By com-parison, the explanatory power of album buzz is very weak. The predictive power of airplay is limited due to the fact thatmost songs do not get any air time, and therefore there isvery little variation in the airplay variable across songs (i.e.,most values are 0). Nonetheless, the predictive value ofairplay is higher for albums as compared to songs, and risesto a little over 5 percent by Week 10.
Now we turn to the analysis of the relationships betweensales, airplay, and buzz. When buzz is the dependent vari-able (Tables 7 and 8), we see fairly consistent results. Thatis, at the song level, the coefficients on the sales variablesare largely negative and significant although at the albumlevel there is no discernible pattern. Together, we see thatthe song-level results differ from the album-level results andthat, contrary to expectations given our knowledge of thepositive impact of positive word-of-mouth, buzz may notalways drive consumption.
An explanation for the negative association between songbuzz and song sales, based on our earlier theoretical discus-sion, is that the positive WOM effect of buzz on sales isdominated by the negative sales displacement effect of freesampling. Given this, one might wonder if the sales dis-placement effect varies across songs in an album as a func-tion of song popularity. This is a pertinent question sinceconsumers’ relative preference for buying versus freelysampling might depend on the popularity of the song. Speci-fically, consumers might be more willing to buy popularsongs, but would rather freely sample (rather than buy) theless popular songs.
To address this question, we characterized song popularityon the basis of Last.fm listens.4 We put every song in our
4We used Last.fm listens to rank song popularity because we do not havesales numbers for all songs from an album. Further Last.fm listens is highlycorrelated with Amazon Sales rank, so it seems a valid measure ofpopularity.
MIS Quarterly Vol. 38 No. 1/March 2014 109

Dewan and Ramaprasad/Social Media, Traditional Media, and Music Sales
Table 7. Song-Level PVAR Regression Results
Dependent Variable
Song Sales Song Buzz Airplay
SongSalest-1 0.575***(0.026)
-0.002(0.018)
0.052***(0.015)
SongSalest-2 0.065***(0.011)
-0.016*(0.010)
-0.000(0.008)
SongSalest-3 0.037***(0.009)
-0.017**(0.008)
-0.018**(0.008)
SongSalest-4 0.002(0.008)
-0.017**(0.008)
-0.011(0.007)
SongSalest-5 -0.011(0.008)
0.002(0.008)
0.000(0.007)
SongSalest-6 -0.024***(0.009)
-0.017**(0.007)
-0.0182***(0.006)
SongBuzzt-1 -0.101**(0.045)
0.186**(0.036)
-0.069**(0.029)
SongBuzzt-2 -0.087***(0.032)
0.107***(0.026)
-0.047**(0.021)
SongBuzzt-3 -0.616***(0.023)
0.075***(0.020)
-0.041**(0.016)
SongBuzzt-4 -0.048***(0.018)
0.041**(0.016)
-0.032**(0.013)
SongBuzzt-5 -0.046***(0.019)
0.079***(0.016)
-0.031**(0.013)
SongBuzzt-6 -0.054***(0.015)
0.130***(0.014)
-0.019*(0.011)
Airplayt-1 0.069***(0.020)
0.022(0.022)
0.390***(0.014)
Airplayt-2 0.047***(0.014)
0.010(0.014)
0.201***(0.011)
Airplayt-3 -0.007(0.012)
0.013(0.011)
0.116***(0.011)
Airplayt-4 -0.006(0.011)
0.005(0.010)
0.046***(0.010)
Airplayt-5 0.003(0.011)
-0.003(0.010)
0.042***(0.010)
Airplayt-6 0.004(0.010)
-0.017**(0.007)
0.024***(0.009)
Notes: Variables are as defined in Table 1 and are logged and forward mean-differences. **, **, * denote significance at 1%, 5%, and 10%,respectively.
110 MIS Quarterly Vol. 38 No. 1/March 2014
Dewan and Ramaprasad/Social Media, Traditional Media, and Music Sales
Table 8. Album-Level PVAR Regression Results
Dependent Variable
Album Sales Album Buzz Airplay
AlbumSalest-1 0.729***(0.037)
0.136**(0.055)
0.065**(0.030)
AlbumSalest-2 -0.012(0.029)
-0.060**(0.025)
0.006(0.013)
AlbumSalest-3 -0.009(0.016)
0.007(0.019)
-0.013(0.011)
AlbumSalest-4 -0.009(0.013)
-0.010(0.017)
0.006(0.010)
AlbumSalest-5 -0.009(0.012)
0.005(0.016)
-0.014(0.010)
AlbumSalest-6 -0.018**(0.008)
-0.004(0.013)
-0.006(0.008)
AlbumBuzt-1 0.003(0.011)
0.192***(0.021)
0.006(0.009)
AlbumBuzzt-2 0.005(0.009)
0.139***(0.019)
0.010(0.007)
AlbumBuzzt-3 -0.007(0.008)
0.104***(0.017)
0.013*(0.007)
AlbumBuzzt-4 -0.005(0.007)
0.083***(0.016)
0.011(0.007)
AlbumBuzzt-5 0.011(0.006)
0.050***(0.016)
0.005(0.006)
AlbumBuzzt-6 0.010)(0.007)
0.056(0.015)
-0.001(0.006)
Airplayt-1 0.097***(0.031)
0.007(0.046)
0.416***(0.022)
Airplayt-2 0.030(0.020)
-0.024(0.030)
0.186***(0.016)
Airplayt-3 -0.014(0.016)
-0.032(0.022)
0.110***(0.015)
Airplayt-4 0.014(0.013)
0.030(0.020)
0.041***(0.013)
Airplayt-5 0.003(0.011)
0.014(0.018)
0.032**(0.013)
Airplayt-6 -0.003(0.012)
-0.028(0.017)
0.003(0.012)
Notes: Variables are as defined in Table 1 and are logged and forward mean-differences. **, **, * denote significance at 1%, 5%, and 10%, respectively.
Table 9. Variance Decomposition of Sales
Weeks Ahead Past Sales Buzz Airplay
Song Level
2 99.03% 0.70% 0.02%
4 94.33% 4.67% 1.01%
6 88.60% 9.99% 1.44%
8 82.32% 15.95% 1.73%
10 78.23% 19.89% 1.87%
Album Level
2 99.52% 0.00% 0.48%
4 98.12% 0.00% 1.86%
6 96.59% 0.05% 3.36%
8 95.22% 0.20% 4.59%
10 94.28% 0.33% 5.39%
MIS Quarterly Vol. 38 No. 1/March 2014 111

Dewan and Ramaprasad/Social Media, Traditional Media, and Music Sales
Table 10. PVAR Regression Results for Different Song Subsamples
Dependent Variable: Song Sales
All Songs Top Three Songs Top Song
SongSalest-1 0.575***(0.026)
0.603***(0.035)
0.635***(0.040)
SongSalest-2 0.065***(0.011)
0.064***(0.015)
0.080***(0.025)
SongSalest-3 0.037***(0.009)
0.042**(0.019)
0.058***(0.019)
SongSalest-4 0.002(0.008)
0.014(0.011)
0.018(0.017)
SongSalest-5 -0.011(0.008)
-0.017(0.011)
-0.023(0.015)
SongSalest-6 -0.024***(0.009)
-0.010(0.10)
0.028***(0.012)
SongBuzzt-1 -0.101**(0.045)
-0.056(0.045)
0.014(0.055)
SongBuzzt-2 -0.087***(0.032)
-0.056*(0.031)
-0.012(0.038)
SongBuzzt-3 -0.616***(0.023)
-0.037(0.024)
-0.015(0.030)
SongBuzzt-4 -0.048***(0.018)
-0.015(0.017)
0.010(0.023)
SongBuzzt-5 -0.046***(0.019)
-0.024(0.018)
-0.0001(0.024)
SongBuzzt-6 -0.054***(0.015)
-0.032**(0.014)
-0.016(0.018)
Airplayt-1 0.069***(0.020)
0.070**(0.028)
0.096***(0.037)
Airplayt-2 0.047***(0.014)
0.043(0.019)
0.027(0.025)
Airplayt-3 -0.007(0.012)
-0.009(0.017)
-0.027(0.022)
Airplayt-4 -0.006(0.011)
-0.021(0.014)
-0.014(0.018)
Airplayt-5 0.003(0.011)
-0.004(0.014)
-0.001(0.016)
Airplayt-6 0.004(0.010)
-0.005(0.013)
-0.027*(0.016)
Notes: Variables are as defined in Table 1 and are logged and forward mean-differenced. **, **, * denote significance at 1%, 5% and 10%,respectively.
data set into one of four categories, corresponding to whetherthe song was the first, second, third, or lower than third rankin terms of Last.fm listens across all songs in the album.Based on this classification, we conducted a comparativeanalysis of three subsamples of songs, as reported in Table10: all songs, top three songs, and the top song. We focus onjust song sales as the dependent variable, since that is whatresulted in the most surprising result so far.
Comparing the results in the three columns of Table 10, wesee that while all of the song buzz variables are negative andsignificant for the full sample of songs, only two of the coeffi-
cients are negative and significant for the top three songs sub-sample, and none of the coefficients are significant for the topsong subsample. This is consistent with the notion that, in-deed, consumers do have a greater willingness to pay for themore popular songs in the album, to the point where, for themost popular song in the album, the negative sales displace-ment effect is weak enough, so as to be counter-balanced bythe positive WOM effects. Thus, song popularity does ex-plain some of the variation in the effect of buzz on sales. Next, we consider the moderating role of other musiccharacteristics.
112 MIS Quarterly Vol. 38 No. 1/March 2014

Dewan and Ramaprasad/Social Media, Traditional Media, and Music Sales
Sample Split Analysis
We continue our analysis by exploring how the nature ofrelationships in Figure 1 vary based on the type of music(mainstream versus niche) using sample split analyses ofrecord label (independent versus major) and artist reputation(high versus low).5 The results are reported in Tables 11 and12. Looking first at the record-label sample split (Table 11),we find some interesting patterns. The radio play coefficientsfor both major label and independently released music at thesong level are consistent with our main results, in that radioplay has a short-term positive relationship with sales. At thealbum level, we note that this relationship is significant forindependently released music, but not for major labels. Forsongs, both sets of radio play coefficients are significant,although the magnitude of the coefficients for independent-label music is larger than the corresponding coefficients formajor-label music. That is, radio play has a stronger effect onsales of independent music, as compared to major label music,at both the song and album levels. However, the sales boostappears to be short term, as the coefficients older than thesecond lag are insignificant.
There are also interesting differences in the estimates for thebuzz variables depending on the record label. For major-labelmusic, the relationship between song buzz and sales is insig-nificant throughout. For independent music, all of the buzzcoefficients are negative and significant. So the salesdisplacement effect due to a spike in song buzz is long-lived,lasting at least 6 weeks. At the album-level, the insignificantrelationship that we found in the main results persists here.
Looking at the results of the sample split on artist reputation(Table 12), we see similar results for the relationship betweenbuzz and sales as we did with the sample split on record label.Here, it is clear that the relationship between song buzz andsong sales that we saw in the main results at both the song andalbum levels are driven by music released by artists who havenot yet established a high reputation. Again, airplay has ashort-term positive effect on sales, but in this sample split wesee these results for low reputation artists only; there is nosignificant relationship between radio play and sales for highreputation artists at either the song level or the album level.Taken together, the record label and artist reputation samplesplits provide evidence that it is perhaps less well-knownmusic and artists whose sales are most impacted by the salesdisplacement effect of free sampling.
Impulse Response Functions
We supplement the regression estimates with the analysis ofthe corresponding impulse response functions (IRFs). TheIRFs allow us to examine the response of one variable to ashock in another variable, and to check whether the impact istransitory or longer term. Figures 2 through 5 highlight selec-tive IRFs so we can examine the response of song sales andalbum sales to a shock in airplay (Figures 2 and 3) and to ashock in buzz (Figures 4 and 5), respectively. Looking atFigure 2, we see that the reaction of song sales to a shock inradio play is positive, although the effect attenuates quicklyover time. In contrast, the reaction of song sales to a shock insong buzz (Figure 4) is initially close to zero and becomesmore negative over time. At the album level, we see thatthere does not seem to be an immediate reaction of albumsales to a shock in radio play (Figure 3), although after onetime period the reaction increases and stays positive overtime; it only marginally decreases by the sixth time period.Additionally, we see the insignificant relationship betweenalbum buzz and album sales reflected again in the corre-sponding IRFs (Figure 5)—the reaction of album sales to ashock in album buzz hovers around 0 for the six periods.Overall, comparing song versus album level reaction of salesto buzz, it is evident that while album sales have virtually noreaction to a shock in album buzz, song sales have a negativeand increasingly negative reaction to a shock in song buzz.Further, the reaction of sales to radio play is positive at boththe song level and the album level, peaking quickly and thendeclining over time.
From the results of the IRFs, we are able to calculate theelasticity of sales with respect to buzz and airplay. Theseelasticities are presented in Tables 13 (song-level) and Table14 (album-level). We see that overall, the elasticity of songsales with respect to airplay is positive and fairly consistentover time, while the elasticity of song sales with respect tosong buzz is negative and increases in magnitude over time. This indicates that as time progresses, song sales becomemore sensitive to a shift in song buzz. At the album-level wefind that the elasticity of album sales with respect to airplayis positive and increases in magnitude over time, while theelasticity of album sales with respect to album buzz is almostzero. Both the results presented in the IRFs and the elasticityresults are consistent with the original PVAR regressionresults reported earlier.
Robustness Checks
Our basic specifications so far did not include the crosseffects of album buzz and sales on song sales, and vice versa.6
5We also conduct a sample split analysis based on genre, although our resultshere indicate that the relationships do not vary based on genre alone. 6We thank an anonymous reviewer for suggesting this point.
MIS Quarterly Vol. 38 No. 1/March 2014 113

Dewan and Ramaprasad/Social Media, Traditional Media, and Music Sales
Table 11. PVAR Regression Results (Sample Split on Label)
Dependent VariableSong Sales Album Sales
Major Independent Major Independent Buzzt-1 -0.010
(0.040)-0.385***(0.166)
-0.004(0.013)
0.033(0.025)
Buzzt-2 -0.016(0.027)
-0.322***(0.127)
0.007(0.010)
0.014(0.021)
Buzzt-3 -0.010(0.195)
-.240***(0.095)
-0.011(0.009)
0.003(0.019)
Buzzt-4 -0.177(0.154)
-0.181***(0.774)
-0.005(0.008)
0.000(0.018)
Buzzt-5 -0.003(0.153)
-0.209***(0.809)
0.013(0.008)
0.006(0.016)
Buzzt-6 -0.022(0.012)
-0.183***(0.066)
0.001(0.007)
0.030*(0.016)
Airplayt-1 0.082***(0.031)
0.254***(0.089)
0.073(0.040)
0.153***(0.044)
Airplayt-2 0.050***(0.019)
0.143***(0.053)
0.002(0.026)
0.086***(0.031)
Airplayt-3 -0.004(0.014)
0.010(0.307)
-0.012(0.020)
-0.008(0.027)
Airplayt-4 0.006(0.013)
-0.023(0.025)
0.007(0.016)
0.036(0.022)
Airplayt-5 -0.014(0.013)
0.049*(0.027)
0.027**(0.014)
-0.032(0.020)
Airplayt-6 -0.011(0.012)
0.048*(0.026)
0.002(0.016)
-0.008(0.018)
Notes: Variables are as defined in Table 1 and are logged and forward mean-differenced. **, **, * denote significance at 1%, 5% and 10%, respectively. Note thatBuzz refers to Song Buzz when looking at the Song Sales results and refers to Album Buzz when looking at the Album Sales results.
Table 12. PVAR Regression Results (Sample Split on Artist Reputation)Dependent Variable
Song Sales Album Sales
High Artist Reputation
Low ArtistReputation
High ArtistReputation
Low ArtistReputation
Buzzt-1 0.023(0.119)
-0.105***(0.045)
-0.141(0.325)
0.007(0.012)
Buzzt-2 -0.009(0.069)
-0.089***(0.033)
-0.110(0.240)
0.009(0.010)
Buzzt-3 -0.006(0.040)
-0.067***(0.025)
-0.095(0.174)
-0.005(0.009)
Buzzt-4 0.002(0.030)
-0.054***(0.020)
-0.085(0.182)
-0.003(0.008)
Buzzt-5 0.013(0.033)
-0.051***(0.020)
-0.061(0.145)
0.013(0.008)
Buzzt-6 -0.039(0.030)
-0.053***(0.016)
-0.051(0.083)
0.013*(0.008)
Airplayt-1 0.075(0.081)
0.070***(0.021)
0.213(0.345)
0.103***(0.034)
Airplayt-2 0.034(0.048)
0.049***(0.015)
0.137(0.387)
0.035(0.021)
Airplayt-3 0.037(0.052)
-0.017(0.013)
0.063(0.192)
-0.014(0.017)
Airplayt-4 -0.003(0.041)
-0.007(0.012)
0.057(0.134)
0.015(0.014)
Airplayt-5 -0.010(0.036)
0.003(0.012)
0.053(0.160)
0.004(0.012)
Airplayt-6 0.031(0.028)
0.002(0.011)
0.065(0.183)
-0.002(0.013)
Notes: Variables are as defined in Table 1 and are logged and forward mean-differenced. **, **, * denote significance at 1%, 5% and 10%, respectively.
114 MIS Quarterly Vol. 38 No. 1/March 2014

Dewan and Ramaprasad/Social Media, Traditional Media, and Music Sales
Note: Errors are 5% on each side generated by Monte Carlo with 500 repetitions.
Figure 2. Impulse Response Function: Response of Song Sales to Airplay
Note: Errors are 5% on each side generated by Monte Carlo with 500 repetitions.
Figure 3. Impulse Response Function: Response of Album Sales to Airplay
Note: Errors are 5% on each side generated by Monte Carlo with 500 repetitions.
Figure 4. Impulse Response Function: Response of Song Sales to Song Buzz
MIS Quarterly Vol. 38 No. 1/March 2014 115

Dewan and Ramaprasad/Social Media, Traditional Media, and Music Sales
Note: Errors are 5% on each side generated by Monte Carlo with 500 repetitions.
Figure 5. Impulse Response Function: Response of Song Sales to Album Buzz
Table 13. Elasticity of Song Sales with Respect to Song Buzz and Airplay
One Week Three Weeks Six Weeks
Song Buzz -0.021 -0.044 -0.059
Airplay 0.006 0.009 0.008
Table 14. Elasticity of Album Sales with Respect to Album Buzz and Airplay
One Week Three Weeks Six Weeks
Album Buzz 0.001 0.001 0.000
Airplay 0.005 0.008 0.008
These cross effects could be important since blog posts thatcontain song names also contain album names, and thusinfluence album sales along with song sales—and vice versa. In other words, variation in the song (album) buzz variable tosome extent captures variation in album (song) buzz as well. If these cross effects are significant, then ignoring them mightlead to biased results. Accordingly, we expanded our songand album specifications to include album and song variables,respectively. The PVAR estimation results for these ex-panded specifications are provided Table 15, where we focusjust on song and album sales as the dependent variables. Wesee that the qualitative nature of our baseline results isunchanged. That is, airplay has a positive association withboth album and song sales. Song buzz has a negative associa-tion with song sales, while the coefficients on album buzz inthe album sales regression have mixed signs. In terms of thecross effects, album buzz appears to have a positive associa-tion with song sales, whereas the coefficients on song buzz inthe album sales regression are negative and significant. Thelatter result reflects the fact that free sampling of songs hurts
not just song sales, but corresponding album sales as well.The coefficients on album sales in the song sales regressionhave mixed signs, whereas song sales appear to have a nega-tive association with album sales (i.e., when people buy asong they tend not to buy the corresponding album).
Next, we explore the idea that perhaps there is an “over-hype”effect that may explain the negative effect of song buzz onsong sales. In other words, we explore whether the largevolume of song buzz, particularly for some of the mostbuzzed about or “hyped” songs, is overwhelming the smallervolume of song sales, driving the negative relationshipbetween the two. To see if this is the case, we divide thesample based on the ratio of song buzz to song sales,including the songs in the top 99th percentile mean buzz tosales ratio in the high hype group and the others in the lowhype group. These results are reported in Table 16. It is clearthat, even after excluding the most hyped songs, our resultsare consistent. We do the same exercise with the airplay tosong sales ratio and, again, find that our results are consistent.
116 MIS Quarterly Vol. 38 No. 1/March 2014

Dewan and Ramaprasad/Social Media, Traditional Media, and Music Sales
Table 15. PVAR Regression Results (Both Song and Album Variables) Dependent Variable
Song Sales Album SalesSongSalest-1 0.532***
(0.025)-0.059***(0.020)
SongSalest-2 0.099***(0.013)
0.011(0.013)
SongSalest-3 0.039***(0.010)
0.017(0.011)
SongSalest-4 -0.003(0.009)
0.006(0.011)
SongSalest-5 0.005(0.009)
0.001(0.009)
SongSalest-6 -0.016*(0.009)
-0.031***(0.009)
SongBuzzt-1 -0.082*(0.049)
-0.113***(0.029)
SongBuzzt-2 -0.067*(0.025)
-0.069**(0.028)
SongBuzzt-3 -0.049*(0.026)
-0.046***(0.016)
SongBuzzt-4 -0.035*(0.020)
-0.032*(0.017)
SongBuzzt-5 -0.033(0.021)
-0.029**(0.013)
SongBuzzt-6 -0.046***(0.017)
-0.029***(0.013)
SongAirplayt-1 0.051**(0.020)
0.084***(0.021)
SongAirplayt-2 0.035**(0.015)
0.021(0.014)
SongAirplayt-3 -0.008(0.012)
-0.009(0.011)
SongAirplayt-4 -0.007(0.011)
0.014(0.009)
SongAirplayt-5 0.003(0.011)
0.010(0.009)
SongAirplayt-6 0.007(0.010)
0.007(0.009)
AlbumBuzzt-1 -0.007(0.012)
-0.005(0.011)
AlbumBuzzt-2 -0.009(0.009)
0.005(0.009)
AlbumBuzzt-3 -0.012(0.008)
-0.017**(0.007)
AlbumBuzzt-4 0.023***(0.007)
-0.005(0.006)
AlbumBuzzt-5 -0.001(0.007)
0.014**(0.006)
AlbumBuzzt-6 -0.001(0.007)
0.012**(0.006)
AlbumSalest-2 -0.128***(0.019)
-0.047*(0.025)
AlbumSalest-3 -0.016(0.013)
-0.008(0.015)
AlbumSalest-4 0.035***(0.013)
-0.001(0.012)
AlbumSalest-5 -0.043***(0.012)
-0.019*(0.011)
AlbumSalest-6 0.006(0.009)
-0.011(0.007)
Notes: Variables are as defined in Table 1 and are logged and forward mean-differenced. **, **, * denote significance at 1%, 5% and 10%, respectively.
MIS Quarterly Vol. 38 No. 1/March 2014 117

Dewan and Ramaprasad/Social Media, Traditional Media, and Music Sales
Table 16. PVAR Regression Results (Robustness for the “Over-Hype” Effect)Song Sales
Low Buzz: Sales High Buzz: Sales Low Airplay: Sales High Airplay: SalesBuzzt-1 -0.758*
(0.040)0.839
(0.736)-0.098**(0.043)
0.150***(0.346)
Buzzt-2 -0.692**(0.029)
0.382(0.526)
-0.086***(0.031)
0.116(0.257)
Buzzt-3 -0.048**(0.021)
-0.441(0.568)
-0.060***(0.022)
0.045(0.236)
Buzzt-4 -0.038**(0.016)
-0.661(0.494)
-0.047***(0.018)
0.038(0.163)
Buzzt-5 -0.036**(0.017)
-0.304(0.504)
-0.046**(0.018)
0.180(0.125)
Buzzt-6 -0.047***(0.013)
-0.594(0.423)
-0.055***(0.015)
0.004(0.120)
Airplayt-2 0.074***(0.019)
0.359(0.416)
0.072***(0.018)
-0.053(1.049)
Airplayt-2 0.049***(0.014)
0.132(0.173)
0.048***(0.013)
-0.121(0.462)
Airplayt-3 -0.008(0.012)
-0.012(0.179)
-0.009(0.012)
0.489(0.702)
Airplayt-4 -0.009(0.011)
-0.015(0.249)
-0.008(0.010)
0.071(0.517)
Airplayt-5 -0.000(0.010)
0.162(0.167)
0.003(0.010)
-0.334(0.568)
Airplayt-6 0.0001(0.009)
0.101(0.176)
0.000(0.009)
0.304(0.391)
Notes: Variables are as defined in Table 1 and are logged and forward mean-differenced. **, **, * denote significance at 1%, 5% and 10%, respectively.
Finally, we conduct a robustness check on the number of lagsincluded in the PVAR specification. The AIC criterion indi-cated that six or seven lags might be best, although thedifference in the AIC magnitudes was small. We decided toinclude six lags for the sake of parsimony. Table 17 showsthe main results when seven lags of all variables are includedand, as can be, seen the qualitative nature of the results isunchanged.
Discussion and Conclusions
Our analysis of the dynamic relationships between socialmedia, traditional media, and sales found interesting differ-ences at the song and album level and within different musicsubsamples. We find that at the song level, the impact ofradio play on sales is positive and declines rapidly over time,and the impact of song buzz is negative and becomes morenegative over time. By contrast, at the album level, both radioplay and buzz have a moderate and consistent positiverelationship with sales. This analysis suggests that the impactof social media, and the buzz therein, is different at the songlevel and at the album level, and for mainstream versus nichemusic. As mentioned earlier, it is important to note that ourresults reflect short-term dynamics between buzz and sales,
and they do not rule out the possibility of positive impacts ofsong/album buzz on sales in the long term.
A potential explanation for the contrasting effects of buzz onalbum versus song sales highlights the dual role of socialmedia as a platform for sharing not just information andopinions about music, but for sharing the music itself—whichhas not been addressed in prior research. A shock in blogbuzz is typically accompanied by a contemporaneous shockin the supply of free, shareable music in the form of streamingmp3 links. Indeed, in a majority of blog posts at the songlevel, we find that the bloggers provide a mechanism for usersto sample the music via streaming. As a result, any potentialpositive effects of blog buzz on song sales appears to beswamped by the negative effect of free sampling on sales.Interestingly, we find this net negative result at the song leveland not at the album level. This might be due to the fact thatwith the trend in unbundling of albums, this media sharinghappens largely at the song level, not at the album level. Inaddition, it is also possible that individuals who consumealbums are different from those who consume songs in theirpropensity to sample versus purchase music. Anecdotal evi-dence suggests that those who consume albums are mostlikely to purchase physical albums (Nielsen 2012), whilethose interested in songs are digital consumers, who are morelikely to sample music online.
118 MIS Quarterly Vol. 38 No. 1/March 2014

Dewan and Ramaprasad/Social Media, Traditional Media, and Music Sales
Table 17. PVAR Regression Results (Seven Lags)
Dependent Variable
Song Sales Album SalesSalest-1 0.520***
(0.032)0.700***
(0.044)Salest-2 0.066***
(0.012)-0.010(0.031)
Salest-3 0.031***(0.009)
-0.004(0.017)
Salest-4 0.007(0.008)
-0.011(0.013)
Salest-5 -0.013(0.009)
-0.0100.012)
Salest-6 -0.002(0.008)
-0.005(0.011)
Salest-7 -0.038***(0.010)
-0.017**(0.009)
Buzzt-1 -0.136***(0.050)
0.001(0.011)
Buzzt-2 -0.115***(0.036)
0.003(0.009)
Buzzt-3 -0.092***(0.028)
-0.011(0.008)
Buzzt-4 -0.059***(0.020
-0.005(0.007)
Buzzt-5 -0.047***(0.017)
0.007(0.007)
Buzzt-6 -0.063***(0.016)
0.009(0.007)
Buzzt-7 -0.006(0.010)
0.002(0.006)
Airplayt-1 0.067***(0.021)
0.089**(0.031)
Airplayt-2 0.044***(0.014)
0.028(0.021)
Airplayt-3 -0.010(0.013)
-0.021(0.016)
Airplayt-4 -0.010(0.011)
0.006(0.014)
Airplayt-5 0.010(0.011)
0.003(0.011)
Airplayt-6 0.009(0.010)
-0.001(0.066)
Airplayt-7 0.004(0.010)
0.003(0.011)
Our analysis has a number of implications for both researchand practice. The evidence of bidirectional causality calls forcaution when analyzing buzz and sales data. Unless propermodels are used to explicitly allow for two-way causaleffects, estimates of the impact of buzz on sales might bebiased and therefore misleading. With respect to the impactof buzz on sales, our results highlight the multifaceted role ofsocial media in the music context. These media are used toshare information about music items—but also to share themusic itself. Any positive effects of the first type of sharingmight be cancelled and reversed by the negative effects of thesecond type of sharing (i.e., the music itself) on sales. There-
fore, a study of the word-of-mouth effects of social mediamust also account for the use of this media for sharing digitalgoods. From a practical standpoint, our findings suggest thatbuzz marketing campaigns might have different results whentargeted at the album versus song level. Further the design ofthe campaigns must account for the confounding effects ofword-of-mouth social influence versus the sharing of music.
It is clear that the results we found here are unlikely if musicwere not an information good. The digitization of productshas made them more accessible to consumers, through bothlegitimate and illegitimate means. The online music land-
MIS Quarterly Vol. 38 No. 1/March 2014 119

Dewan and Ramaprasad/Social Media, Traditional Media, and Music Sales
scape is continually growing, with a large variety of sitesavailable to stream and download music, including sites suchas Last.fm and Spotify. As individuals begin to have accessto music through such sites, which enable consumption with-out purchase, the relationship between sampling and salesbecomes even more important. Our results demonstrate thatcreating awareness of such goods, through online venues suchas social media, may not have a direct, positive effect onsales; in fact, it may lead people to access the good for free.While this may be concerning for those operating and seekingto make money from digital goods, it is important to note thatthis ability to consume the good for free (i.e., sample it) mayprovide incentive for consumers to purchase complementaryproducts. The insights that are generated from our analysisare applicable to other information goods, where samplingand sales are both viable mechanisms for consumption. Thusour overall framework and insights are applicable to software,print, and film, although the distinction between an album andsingle songs may not be relevant in these contexts.
This study does have some limitations. We have data on onlyone type of social media—blog posts—and not Facebook,MySpace, and other media. Also, we have data on onlyvolume of word-of-mouth, not valence. However, we believethis is not very limiting in the music blog context, due to thefact that almost all music blog posts implicitly represent apositive opinion so that there is no variation in valence here. Another issue with the measurement of buzz is that it justcounts album and song mentions, which combines word-of-mouth effects with media sharing effects. Thus, we are onlyable to observe the net impact of the two factors; it may beinteresting for future research to separately measure the twoeffects, so their individual contributions can be distinguishedfrom one another. Another limitation is that our researchdesign includes just one traditional media, namely radio play. However, Peitz and Waelbroeck (2004) note that radio playis the single most important traditional channel through whichusers discover music. Overcoming these limitations canprovide fruitful directions for further research. Overall, thisstudy sheds new light on the impact of new versus traditionalmedia on music album and song sales, and the results haveimplications for the design of both academic studies and buzzmarketing campaigns in practice.
Acknowledgments
The order of authors is alphabetical and they contributed equally. The authors thank Debbie Schwartz at Nielsen SoundScan forfacilitating the access to essential data for this project. They alsothank the editorial team and seminar participants at the Universityof Minnesota, New York University, Hong Kong University of
Science and Technology, Beijing University, and SCECR 2011 fortheir helpful comments and suggestions.
References
Abel, F., Diaz-Aviles, E., Henze, N., Krause, D. and Siehndel, P.2010. “Analyzing the Blogosphere for Predicting the Success ofMusic and Movie Products,” in Proceedings of the 2010 Inter-national Conference on Advances in Social Networks Analysisand Mining, Odense, Denmark, August 9-11.
Adomavicius, G., Bockstedt, J., and Gupta, A. 2012. “ModelingSupply-Side Dynamics of IT Components, Products, andInfrastructure: An Empirical Analysis Using Vector Auto-regression,” Information Systems Research (23:2), pp. 397- 417.
Arellano, M., and Bover, O. 1995. “Another Look at the Instru-mental Variable Estimation of Error Component Models,”Journal of Econometrics (68:1), pp. 29-51.
Chellappa, R., and Chen, C. 2009. “MySpace Killed the RadioStar? The Impact of Online Sampling on Song Sales,” inProceedings of the 13th International Conference on InformationSystems, Phoenix, AZ, December 15-18.
Chen, H., De, P., and Hu Yu. 2011. “IT-Enabled Broadcasting inSocial Media: An Empirical Study of Artists’ Activities andMusic Sales,” paper presented at the Workshop on InformationSystems and Economics, Shanghai, China.
Chen, Y., Wang, Q., and Xie, J. 2010. “Online Social Interactions:A Natural Experiment on Word of Mouth Versus ObservationalLearning,” Working Paper, University of Arizona.
Chevalier, J. A., and Mayzlin, D. 2006. “The Effect of Word ofMouth on Sales: Online Book Reviews,” Journal of MarketingResearch (43:3), pp. 345-354.
Chintagunta, P. K., Gopinath, S., and Venkataraman, S. 2010. “TheEffects of Online User Reviews on Movie Box Office Perfor-mance: Accounting for Sequential Rollout and AggregationAcross Local Markets,” Marketing Science (29:5), pp. 944-957.
Dekimpe, M. G., and Hanssens, D. M. 1995. “The Persistence ofMarketing Effects on Sales,” Marketing Science (14:1), pp. 1-21.
Dellarocas, C., Awad, N., and Zhang, X. 2007. “Exploring theValue of Online Product Reviews in Forecasting Sales: The Caseof Motion Pictures,” Journal of Interactive Marketing (21:4), pp.23-45.
Dewan, S., and Hsu, V. 2004. “Adverse Selection in ElectronicMarkets: Evidence from Online Stamp Auctions,” Journal ofIndustrial Economics (LII:4), pp. 497-516.
Dewan, S., and Ramaprasad, J. 2008. “Chicken and Egg? InterplayBetween Music Blog Buzz and Album Sales,” paper presented atWorkshop on Information Systems Economics, Paris, France.
Dewan, S., and Ramaprasad, J. 2012. “Music Blogging, OnlineSampling, and the Long Tail,” Information Systems Research(23:3), pp. 1056-1067.
Dhar, V., and Chang, E. A. 2009. “Does Chatter Matter? TheImpact of User-Generated Content on Music Sales,” Journal ofInteractive Marketing (23), pp. 300-307.
Duan, W., Gu, B., and Whinston, A. B. 2008. “The Dynamics ofOnline Word of Mouth and Product Sales—An EmpiricalInvestigation of the Movie Industry,” Decision Support Systems(84:2), pp. 233-242.
120 MIS Quarterly Vol. 38 No. 1/March 2014

Dewan and Ramaprasad/Social Media, Traditional Media, and Music Sales
Ehlrich, B. 2011. “What Would the Music Industry Look Like ifNapster Never Existed?,” Mashable.com, April 8 (http://mashable.com/2011/04/08/napster-never-existed/).
Forman, C., Ghose, A., and Weisenfeld, B. 2008. “Examining theRelationship Between Reviews and Sales: The Role of ReviewerIdentity Disclosure in Electronic Markets,” Information SystemsResearch (19:3), pp. 291-313.
Ghose, A., and Ipeirotis, P. G. 2011. “Estimating the Helpfulnessand Economic Impact of Product Reviews: Mining Text andReviewer Characteristics,” IEEE Transactions on Knowledge andData Engineering (23:10), pp. 1498-1512.
Godes, D., and Mayzlin, D. 2004. “Using Online Conversations toStudy Word of Mouth Communication,” Marketing Science(23:4), pp. 545-560.
Harris, R. D. F., and Tzavalis, E. 1999. “Inference for Unit Rootsin Dynamic Panels Where the Time Dimension is Fixed” Journalof Econometrics (91:2), pp. 201-226.
Holtz-Eakin, D., Newey, W., and Rosen, H. S. 1988. “EstimatingVector Autoregressions with Panel Data,” Econometrica (56:6),pp. 1371-1395.
King, M. F., and Balasubramanian, S. K. 1994. “The Effects ofExpertise, End Goal, and Product Type on Adoption of Prefer-ence Formation Strategy,” Journal of the Academy of MarketingScience (22:2), pp. 146-159.
Liebowitz, S. 2004. “Will MP3 Downloads Annihilate the RecordIndustry? The Evidence so Far,” Advances in the Study of Entre-preneurship, Innovation and Economic Growth (15), pp.229-260.
Liu, Y. 2006. “Word of Mouth for Movies: It’s Dynamics andImpact on Box Office Revenues,” Journal of Marketing (70:7),pp. 74-89.
Love, I., and Zicchino, L. 2006. “Financial Development andDynamic Investment Behavior: Evidence from Panel VAR,” TheQuarterly Review of Economics and Finance (46:2), May, pp.190-210.
Moon, S, Bergey, P. K., and Iacobucci, D. 2010. “Dynamic EffectsAmong Movie Ratings, Movie Revenues, and Viewer Satis-faction” Journal of Marketing (74:1), pp. 108-121.
Morales-Arroyo, M., and Pandey, T. 2010. “Identification ofCritical eWOM Dimensions for Music Albums,” in Proceedingsof the 5th IEEE International Conference on Management ofInnovation and Technology, Singapore, June 2-5.
Nielsen Company. 2012. “Nielsen Music 3600,” partial reportavailable upon request and full report available upon licenseretrieval from The Nielsen Company.
Onishi, H., and Manchanda, P. 2012. “Marketing Activity,Blogging and Sales,” International Journal of Research inMarketing, (29:3), pp. 221-234.
Peitz, M., and Waelbroeck, P. 2004. “An Economist’s Guide toDigital Music,” CESifo Working Paper 1333, CESIfo GroupMunich.
Peitz, M., and Waelbroeck, P. 2006. “Why the Music Industry MayGain from Free Downloading—The Role of Sampling,”International Journal of Industrial Organization (24:5), pp.907-913.
Rob, R., and Waldfogel, J. 2006. “Piracy on the High C’s: MusicDownloading, Sales Displacement, and Social Welfare in aSample of College Students,” The Journal of Law and Economics(49:1), pp. 29-62.
Rui, H., Liu, Y., and Whinston, A. B. 2011. “Whose and WhatChatter Matters? The Impact of Tweets on Music Sales,”Working Paper No. 8, Zwick Center for Food and ResourcePolicy, University of Connecticut, Storrs, CT.
Siwek, S. E. 2007. “The True Cost of Sound Recording Piracy tothe U.S. Economy,” Policy Report 188, Institute for PolicyInnovation, Lewisville, TX.
Stanca, L., and Gallegati, M. 1999. “The Dynamic RelationBetween Financial Positions and Investment: Evidence fromCompany Account Data,” Industrial and Corporate Change(8:3), pp. 551-572.
Stephen, A. T., and Galak, J. 2012. “The Effects of Traditional andSocial Earned Media on Sales: A Study of a Microlending Mar-ketplace,” Journal of Marketing Research (49:5), pp. 624-639.
Trusov, M., Bucklin, R. E., and Pauwels, K. 2009. “Effects ofWord-of-Mouth Versus Traditional Marketing: Findings from anInternet Social Networking Site,” Journal of Marketing (73:9),pp. 90-102.
Villanueva, J., Yoo, S., and Hanssens, D. M. 2008. “The Impact ofMarketing-Induced Versus Word-of-Mouth Consumer Acquisi-tion on Customer Equity Growth,” Journal of MarketingResearch (45:1), pp. 48-59.
Waldfogel, J. 2010. “Music File Sharing and Sales Displacementin the iTunes Era,” Information Economics and Policy (22:4), pp.306-314.
Zentner, A. 2006. “Piracy and File Sharing: Measuring the Effectof Music Downloads on Music Purchases,” The Journal of Lawand Economics (49:1), pp. 63-90.
About the Authors
Sanjeev Dewan is a professor at the the Paul Merage School ofBusiness, University of California, Irvine. Prior to joining UCIrvine in 2001, he served on the faculties of the business schools atthe University of Washington, Seattle, and George Mason Univer-sity. He received his Ph.D. in Business Administration in 1991 fromthe Simon School at the University of Rochester, in the area ofInformation Systems. His current research interests are in the areasof the impact of online social media, business value of IT invest-ments, and electronic commerce. He has served as a senior editorat Information Systems Research and associate editor at Manage-ment Science.
Jui Ramaprasad is currently an assistant professor at the DesautelsFaculty of Management at McGill University. She received herdoctorate in information systems from the Paul Merage School ofBusiness at the University of California, Irvine, and holds a B.S.from the University of Southern California. Her main researchinterests lie in the impacts of online social media, the musicindustry, and electronic markets. She cochaired the 2012 StatisticalChallenges in eCommerce Research (SCECR) conference held atMcGill University in Montreal, Canada, and has served on a numberof other conference program committees.
MIS Quarterly Vol. 38 No. 1/March 2014 121

122 MIS Quarterly Vol. 38 No. 1/March 2014


![Reading workshop slides v2 (2) [Read-Only] · Reading workshop Reading at school Reading for pleasure Banded books Parental involvement Reading Fluency. Reading at school ... reading](https://img.pdfslide.net/doc/110x75/5fd880651dec7c1e8e4a37df/reading-workshop-slides-v2-2-read-only-reading-workshop-reading-at-school-reading.jpg)