Embed Size (px)
Citation preview

RISK MANAGEMENT
Risk and Return
Presented by: AsHra ReHmat
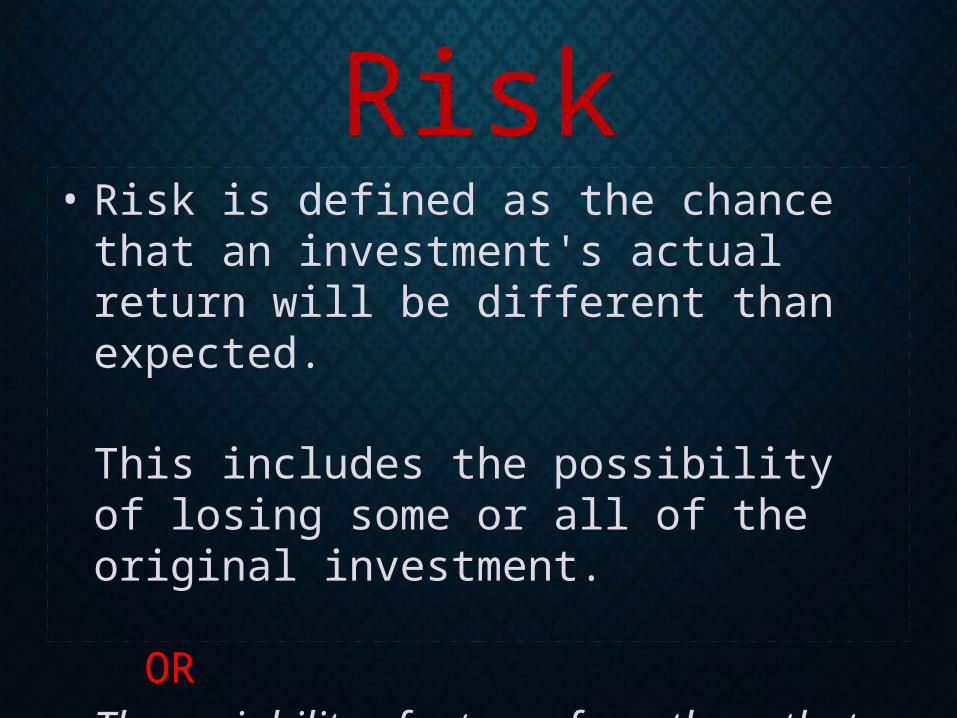
Risk• Risk is defined as the chance that an
investment's actual return will be different than expected.
This includes the possibility of losing some or all of the original investment. OR
• The variability of returns from those that are expected.

Return• Income received on an investment plus any
change in market price, usually expressed as a percent of the beginning market price of the investment.
Dt + (Pt - Pt-1 )
Pt-1
R =
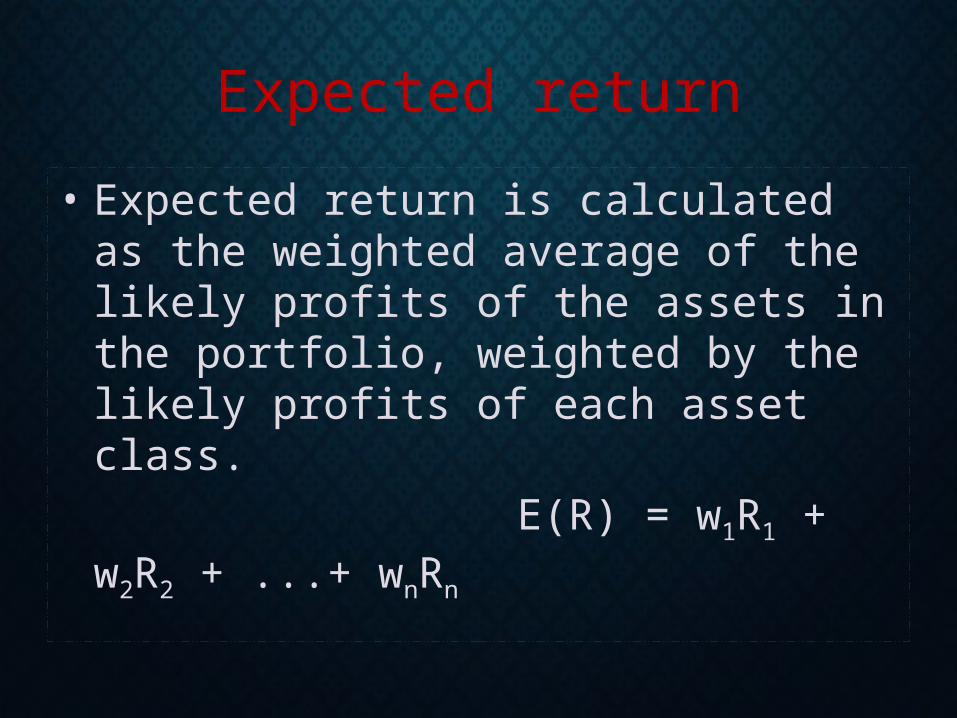
Expected return
• Expected return is calculated as the weighted average of the likely profits of the assets in the portfolio, weighted by the likely profits of each asset class.
E(R) = w1R1 + w2R2 + ...+ wnRn
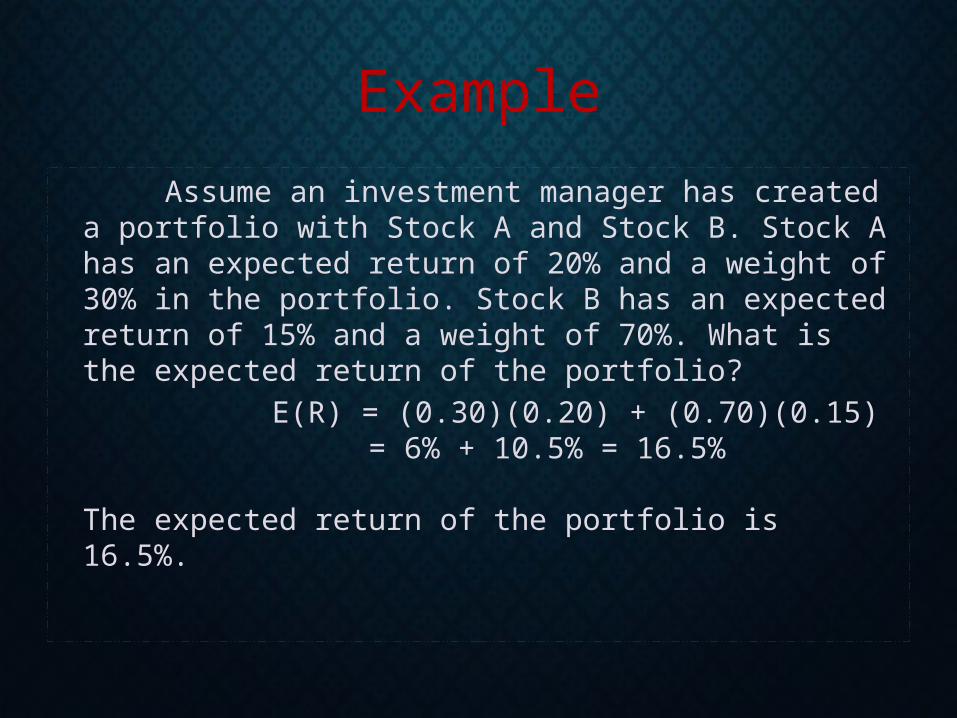
Example
Assume an investment manager has created a portfolio with Stock A and Stock B. Stock A has an expected return of 20% and a weight of 30% in the portfolio. Stock B has an expected return of 15% and a weight of 70%. What is the expected return of the portfolio?
E(R) = (0.30)(0.20) + (0.70)(0.15) = 6% + 10.5% = 16.5%
The expected return of the portfolio is 16.5%.

Portfolio• A portfolio is a grouping of financial assets such as stocks,
bonds and cash equivalents.• Portfolios are held directly by investors or managed by
financial professionals. • Investors should construct an investment portfolio in
accordance with their risk tolerance and investing objectives. • Think of an investment portfolio as a pie that is divided into
pieces of varying sizes representing different asset classes and/or types of investments to accomplish an appropriate risk-return portfolio allocation.

Variance
Variance (σ2) is a measure of the dispersion of a set of data points around their mean value.
It is computed by finding the probability-weighted average of squared deviations from the expected value.
Variance measures the variability from an average (volatility). Volatility is a measure of risk, so this statistic can help determine the risk an investor might take on when purchasing a specific security.

Example: Variance Assume that an analyst writes a report on a company and, based on
the research, assigns the following probabilities to next year's sales:
The analyst's expected value for next year's sales is (0.1)*(16.0) + (0.3)*(15.0) + (0.3)*(14.0) + (0.3)*(13.0) = $14.2 million.
Scenario Probability(P)
Sales ($ Millions)E(R)
1 0.10 $16
2 0.30 $153 0.30 $14
4 0.30 $13

Calculating variance starts by computing the difference in each potential sales outcome from $14.2 million, then squaring:
Scenario Probability(P)
Deviation from Expected Value( R-R )
Squared
1 0.10 (16.0 - 14.2) = 1.8 3.24
2 0.30 (15.0 - 14.2) = 0.8 0.64
3 0.30 (14.0 - 14.2) = - 0.2 0.04
4 0.30 (13.0 - 14.2) = - 1.2 1.44
Variance then weights each squared deviation by its probability, giving us the following calculation: (0.1)*(3.24) + (0.3)*(0.64) + (0.3)*(0.04) + (0.3)*(1.44) = 0.96

Correlation Coefficient
A standardized statistical measure of the linear relationship between two variables.
Its range is from -1.0 (perfect negative correlation), through 0 (no correlation), to
+1.0 (perfect positive correlation).
A standardized statistical measure of the linear relationship between two variables.
Its range is from -1.0 (perfect negative correlation), through 0 (no correlation), to
+1.0 (perfect positive correlation).

'Diversification'
• A risk management technique that mixes a wide variety of investments within a portfolio.
“Don’t put all your eggs in
one basket”

Diversification and the Correlation Coefficient
INVE
STM
ENT
RETU
RN
TIME TIMETIME
SECURITY E SECURITY FCombination
E and F
Combining securities that are negatively correlated reduces risk.

Total Risk = Systematic Risk + Unsystematic Risk
Systematic Risk is the variability of return on stocks or portfolios associated with changes in return on
the market as a whole.
Unsystematic Risk is a risk unique to a particular company or industry; it is independent of
economic, political and other factors that affect all securities in a systematic manner.
It is avoidable through diversification.
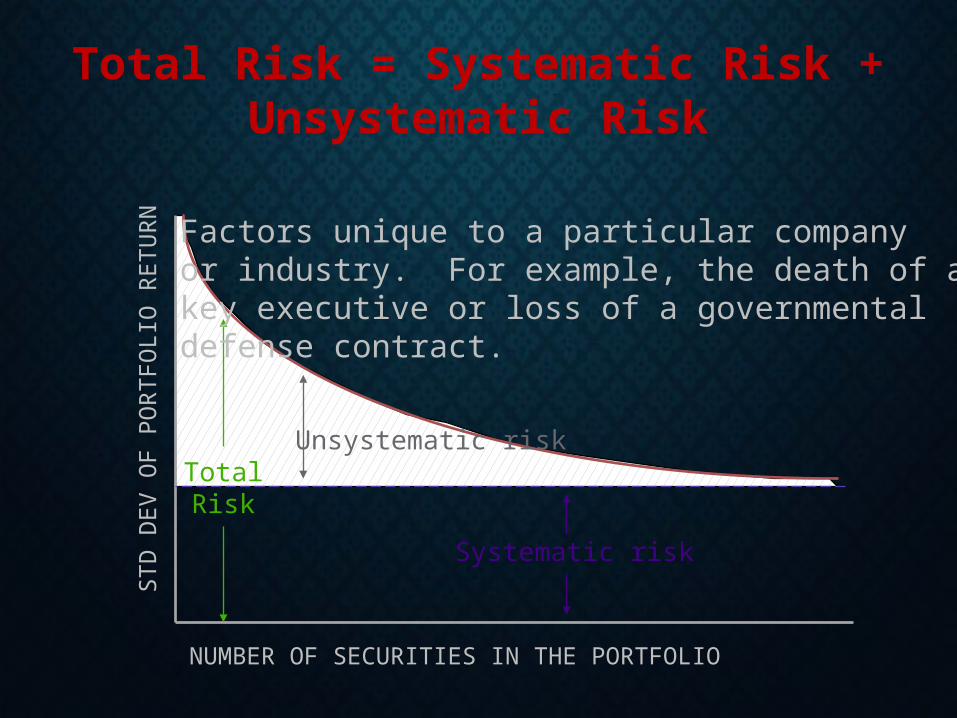
Total Risk = Systematic Risk + Unsystematic Risk

Total Risk = Systematic Risk + Unsystematic Risk
TotalRisk
Unsystematic risk
Systematic risk
STD
DEV
OF
PORT
FOLI
O R
ETU
RN
NUMBER OF SECURITIES IN THE PORTFOLIO
Factors such as changes in nation’s economy, tax reform by the Congress,or a change in the world situation.
Total Risk = Systematic Risk + Unsystematic Risk
TotalRisk
Unsystematic risk
Systematic risk
NUMBER OF SECURITIES IN THE PORTFOLIO
STD
DEV
OF
PORT
FOLI
O R
ETU
RN
Factors unique to a particular companyor industry. For example, the death of akey executive or loss of a governmentaldefense contract.
Capital Asset Pricing Model (CAPM)
• This model was developed in 1960s by Nobel Laureate William Sharpe.
• CAPM is a model that describes the relationship between risk and expected (required) return; in this model, a security’s expected (required) return is the risk-free rate plus a premium based on the systematic risk of the security.

Characteristic Line
EXCESS RETURNON STOCK
EXCESS RETURNON MARKET PORTFOLIO
Beta
Narrower spreadis higher correlation
Characteristic Line

What is Beta?
An index of systematic risk.
It measures the sensitivity of a stock’s returns to changes in returns on the market portfolio.
The beta for a portfolio is simply a weighted average of the individual stock betas in the
portfolio.

Characteristic Lines and Different Betas
EXCESS RETURNON STOCK
EXCESS RETURNON MARKET PORTFOLIO
Beta < 1(defensive)
Beta = 1
Beta > 1(aggressive)
Each characteristic line has a
different slope.

Security Market Line
Rj = Rf + bj(RM - Rf)Rj is the required rate of return for stock j,
Rf is the risk-free rate of return,
bj is the beta of stock j (measures systematic risk of stock j),
RM is the expected return for the market portfolio.

Security Market Line
Rj = Rf + bj(RM - Rf)
bM = 1.0
Systematic Risk (Beta)
Rf
RM
Requ
ired
Retu
rn
RiskPremium
Risk-freeReturn

Determination of the Required Rate of Return
Lisa Miller at Basket Wonders is attempting to determine the rate of return required by their stock investors. Lisa is using a 6% Rf and a long-term market expected rate of return of 10%. A stock analyst following the firm has calculated that the firm beta is 1.2. What is the required rate of return on the stock of Basket Wonders?

BWs Required Rate of Return
RBW = Rf + bj(RM - Rf)
RBW = 6% + 1.2(10% - 6%)
RBW = 10.8%
The required rate of return exceeds the market rate of return as BW’s beta exceeds the market
beta (1.0).

Thank You