Embed Size (px)
Citation preview

Presented by Eng. Safa Mazahreh
NCARE
Advanced training course on digital soil mapping for the near east and north africa region (NENA)
6 Dec , 2015
Site selection and Water
harvesting suitability analysis
in Badia of Jordan
Community – Based Optimization of the
Management of Scarce Water Resources in
Agriculture in West Asia and
North Africa Badia Water Benchmark Site(Options for coping with increased water scarcity in
Agriculture in WANA)
Badia benchmark site in Jordan with satellite sites
in Saudi Arabia and Libya

Team:
Team Leader: Dr. Feras Ziazdat: UOJ
NCARE Team:
Eng. Safa Mazahreh
Eng. Lubna Al-Mahasneh
Eng. Doaa Abuhamoor
The study consists of three
components:
1- Site selection
2- Biophysical Characterization of
Muhareb watershed\
3- Suitability for water harvesting
The main activity :
•Develop methods for the identification of
potential sites and suitable techniques for water
harvesting using remote sensing, GIS and
ground data.
• The whole approach demonstrates how GIS can
be used at different scales, using whatever data are
available, to help select fields that are suitable for
implementing new land-use alternatives.

Site selection

Objective
The aim of the siteselection process is tochoose therepresentative site(watershed) for theBadia zone in Jordan tocarry out the project
activities and outscalethe results to othersimilar areas withinJordan and outside thecountry.
Badia Zone:
100-250
mm
226 watersheds

The site selection process has been
undertaken in three stages using
remote sensing, GIS and ground
data.
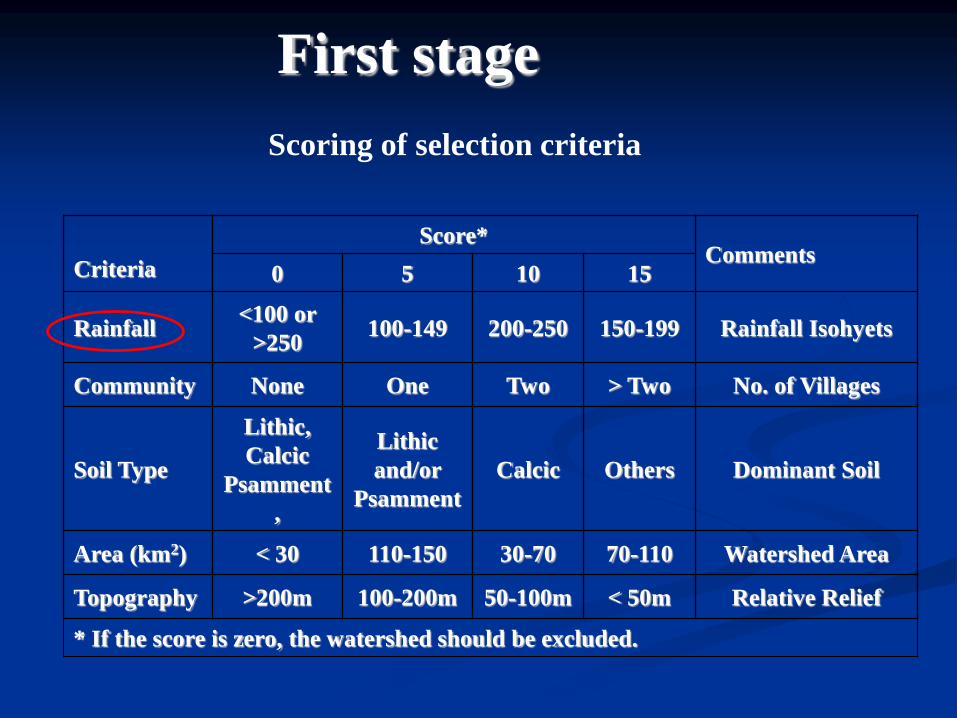
First stage
CommentsScore*
Criteria 151050
Rainfall Isohyets150-199200-250100-149<100 or
>250Rainfall
No. of Villages> TwoTwoOneNoneCommunity
Dominant SoilOthersCalcic
Lithic
and/or
Psamment
Lithic,
Calcic
Psamment
,
Soil Type
Watershed Area70-11030-70110-150< 30Area (km2)
Relative Relief< 50m50-100m100-200m>200mTopography
* If the score is zero, the watershed should be excluded.
Scoring of selection criteria
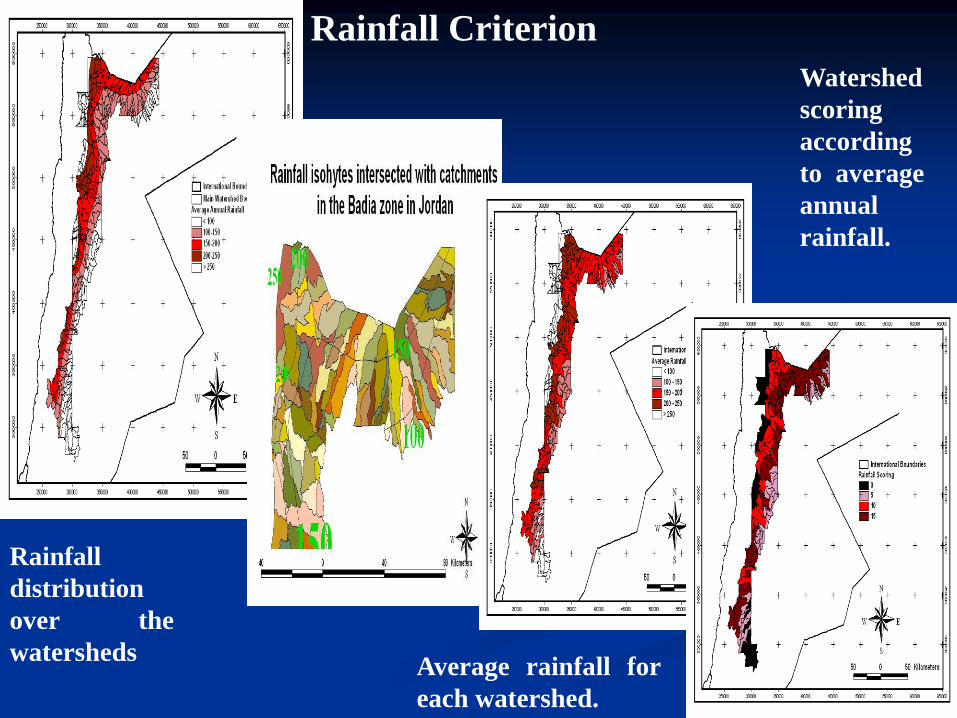
Rainfall Criterion
Rainfall
distribution
over the
watershedsAverage rainfall for
each watershed.
Watershed
scoring
according
to average
annual
rainfall.

Watershed scoring according to
community.Distribution of villages over the
watersheds
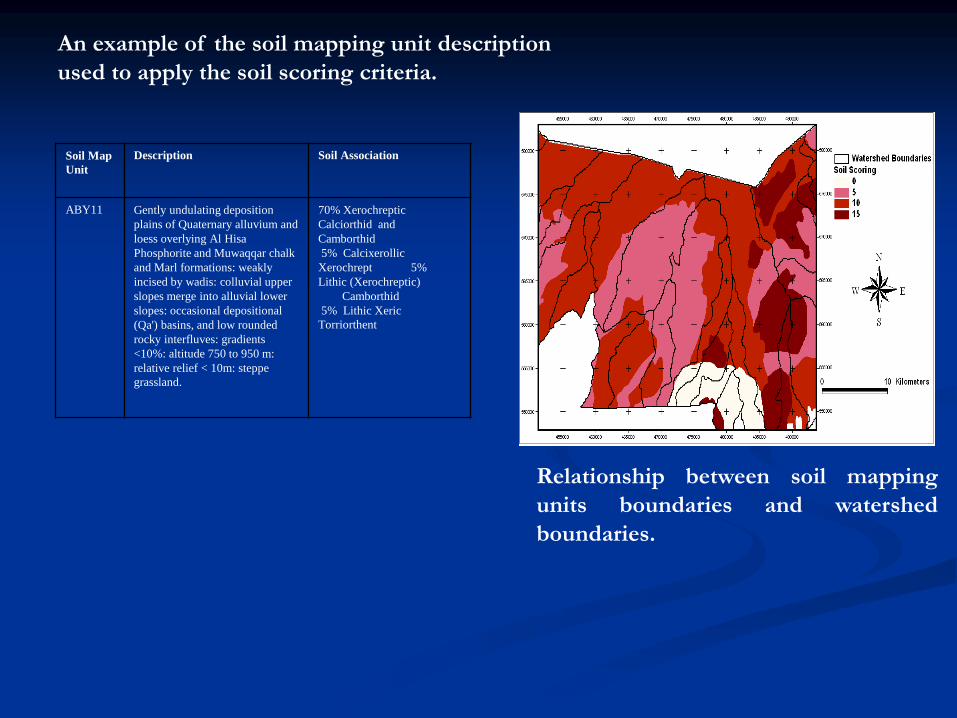
Soil AssociationDescriptionSoil Map
Unit
70% Xerochreptic
Calciorthid and
Camborthid
5% Calcixerollic
Xerochrept 5%
Lithic (Xerochreptic)
Camborthid
5% Lithic Xeric
Torriorthent
Gently undulating deposition
plains of Quaternary alluvium and
loess overlying Al Hisa
Phosphorite and Muwaqqar chalk
and Marl formations: weakly
incised by wadis: colluvial upper
slopes merge into alluvial lower
slopes: occasional depositional
(Qa') basins, and low rounded
rocky interfluves: gradients
<10%: altitude 750 to 950 m:
relative relief < 10m: steppe
grassland.
ABY11
An example of the soil mapping unit description
used to apply the soil scoring criteria.
Relationship between soil mapping
units boundaries and watershed
boundaries.
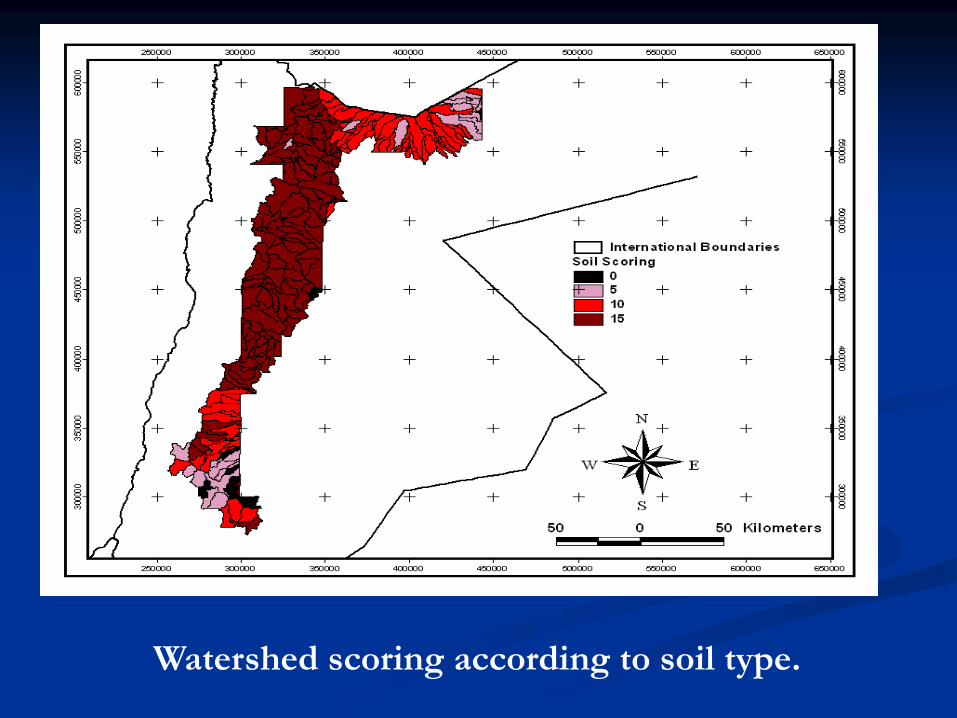
Watershed scoring according to soil type.

Watershed scoring according to area.
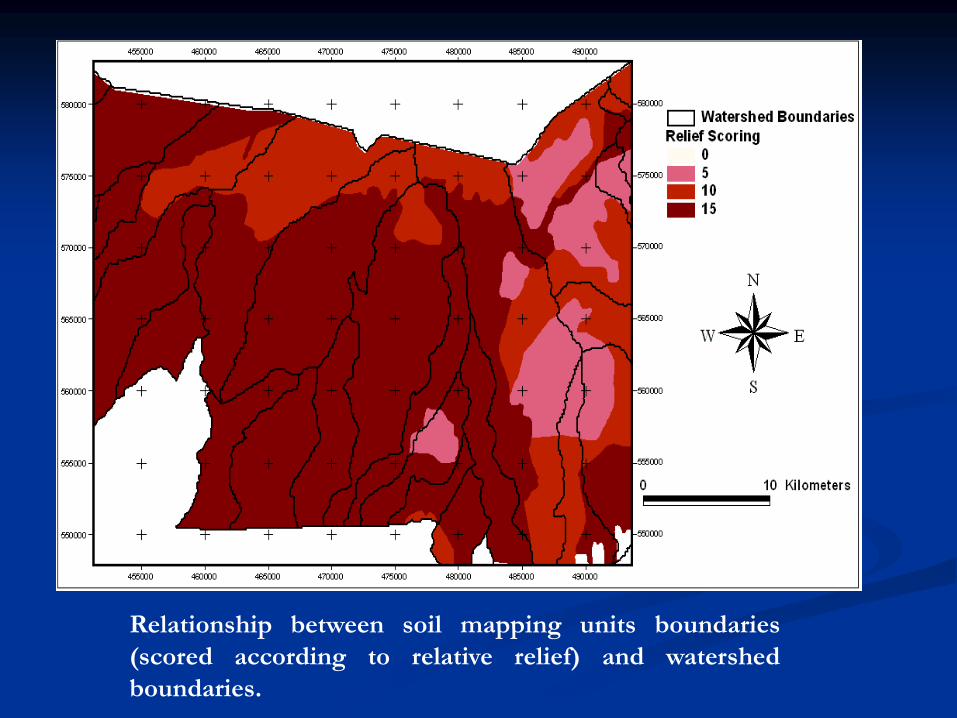
Relationship between soil mapping units boundaries
(scored according to relative relief) and watershed
boundaries.
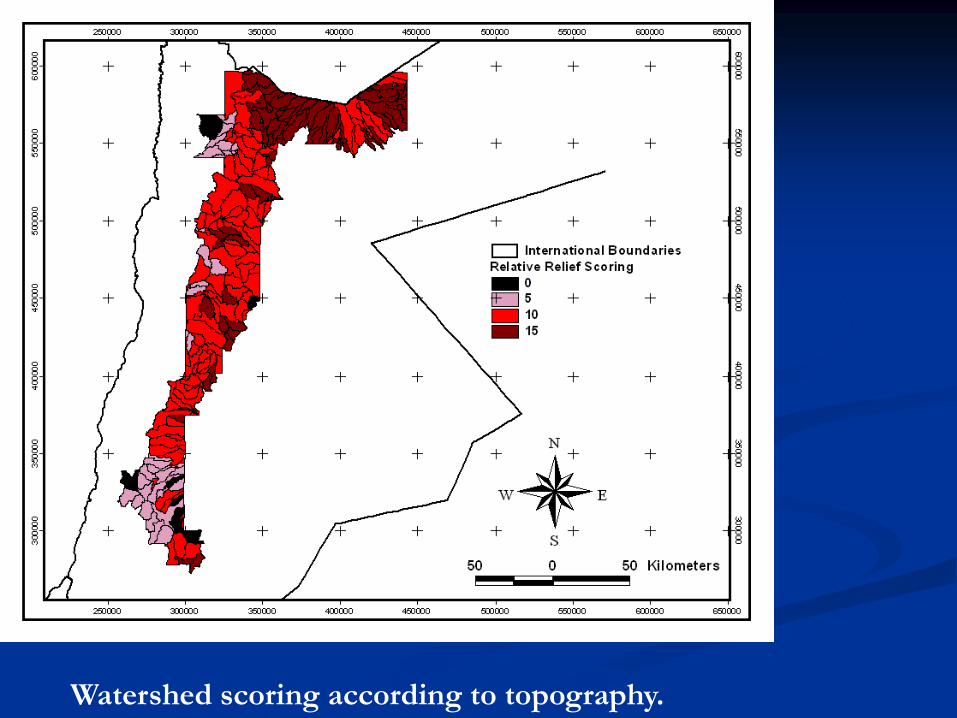
Watershed scoring according to topography.
Final Scoring
Topogr
aphy
Scorin
g
Soil
Scorin
g
Comm
unity
Scorin
g
Rainfal
l
Scorin
g
Area
Scorin
g
Watersh
ed
Number
00150005
0515100106
0515150107
0515150108
0105101009
010151010010
01015010011
01015510012
60101515101013
01015015014
5510151510515
6015155101516
60101510151017
70101515151518
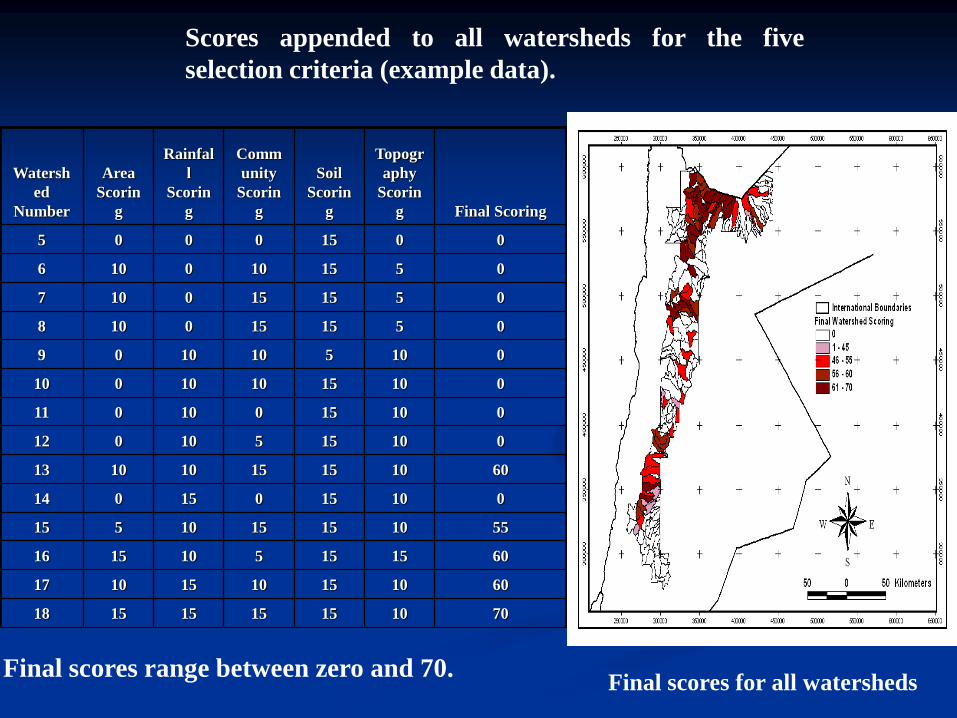
Scores appended to all watersheds for the five
selection criteria (example data).
Final scores range between zero and 70. Final scores for all watersheds
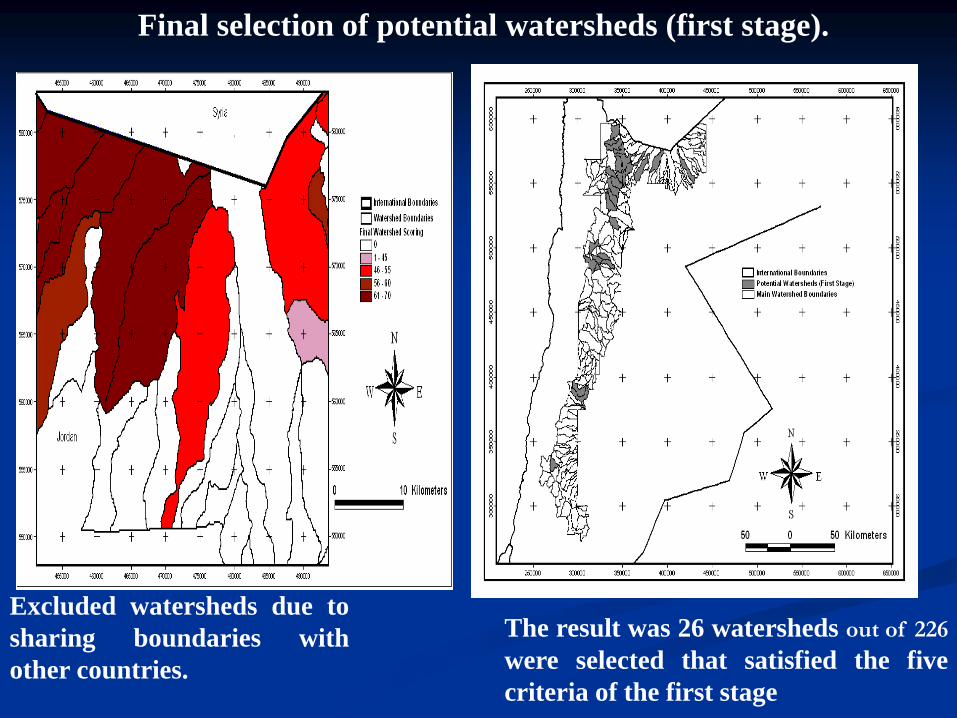
Final selection of potential watersheds (first stage).
The result was 26 watersheds out of 226
were selected that satisfied the five
criteria of the first stage
Excluded watersheds due to
sharing boundaries with
other countries.

Second Stage
More detailed criteria were applied on the selected
watersheds (26) resulted from the first stage and
consequently, proposing the most potential watershed
to carry out project activities.
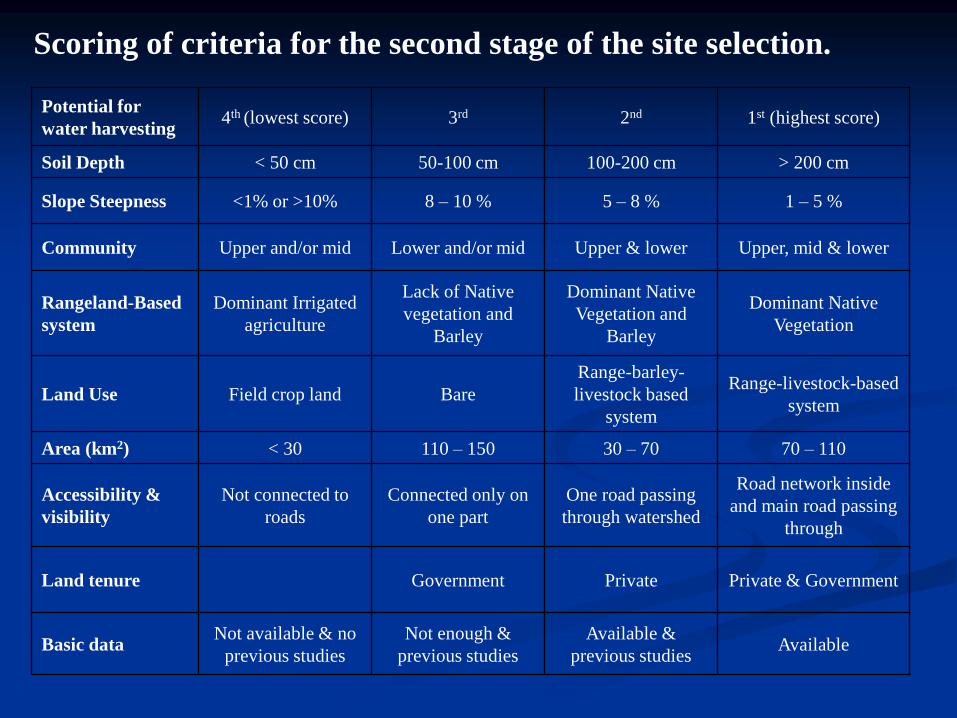
Potential for
water harvesting4th (lowest score) 3rd 2nd 1st (highest score)
Soil Depth < 50 cm 50-100 cm 100-200 cm > 200 cm
Slope Steepness <1% or >10% 8 – 10 % 5 – 8 % 1 – 5 %
Community Upper and/or mid Lower and/or mid Upper & lower Upper, mid & lower
Rangeland-Based
system
Dominant Irrigated
agriculture
Lack of Native
vegetation and
Barley
Dominant Native
Vegetation and
Barley
Dominant Native
Vegetation
Land Use Field crop land Bare
Range-barley-
livestock based
system
Range-livestock-based
system
Area (km2) < 30 110 – 150 30 – 70 70 – 110
Accessibility &
visibility
Not connected to
roads
Connected only on
one part
One road passing
through watershed
Road network inside
and main road passing
through
Land tenure Government Private Private & Government
Basic dataNot available & no
previous studies
Not enough &
previous studies
Available &
previous studiesAvailable
Scoring of criteria for the second stage of the site selection.
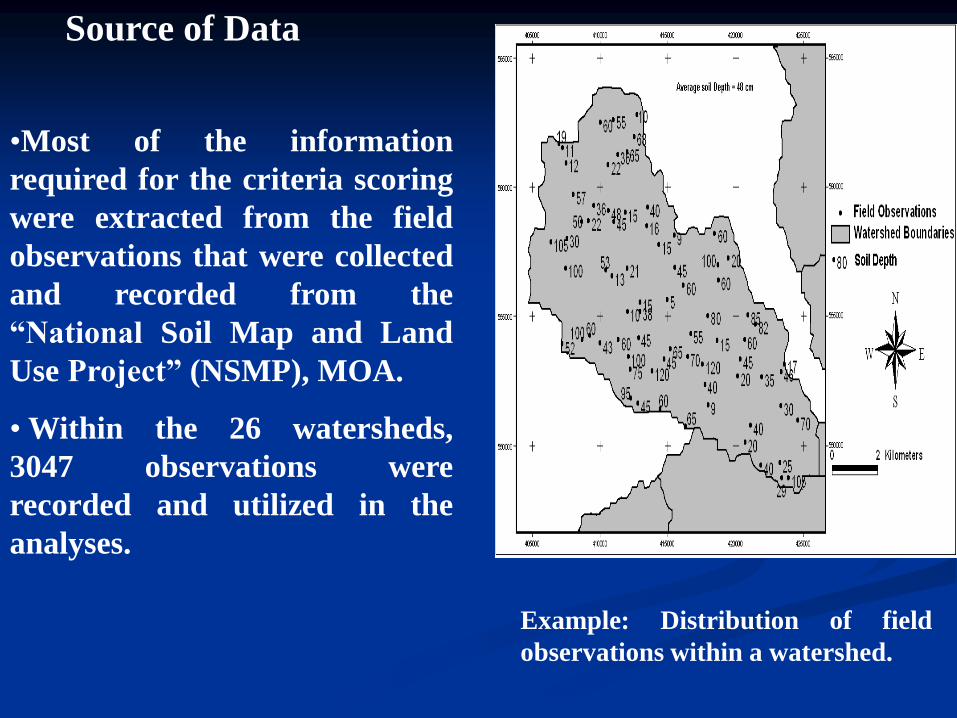
•Most of the information
required for the criteria scoring
were extracted from the field
observations that were collected
and recorded from the
“National Soil Map and Land
Use Project” (NSMP), MOA.
• Within the 26 watersheds,
3047 observations were
recorded and utilized in the
analyses.
Source of Data
Example: Distribution of field
observations within a watershed.
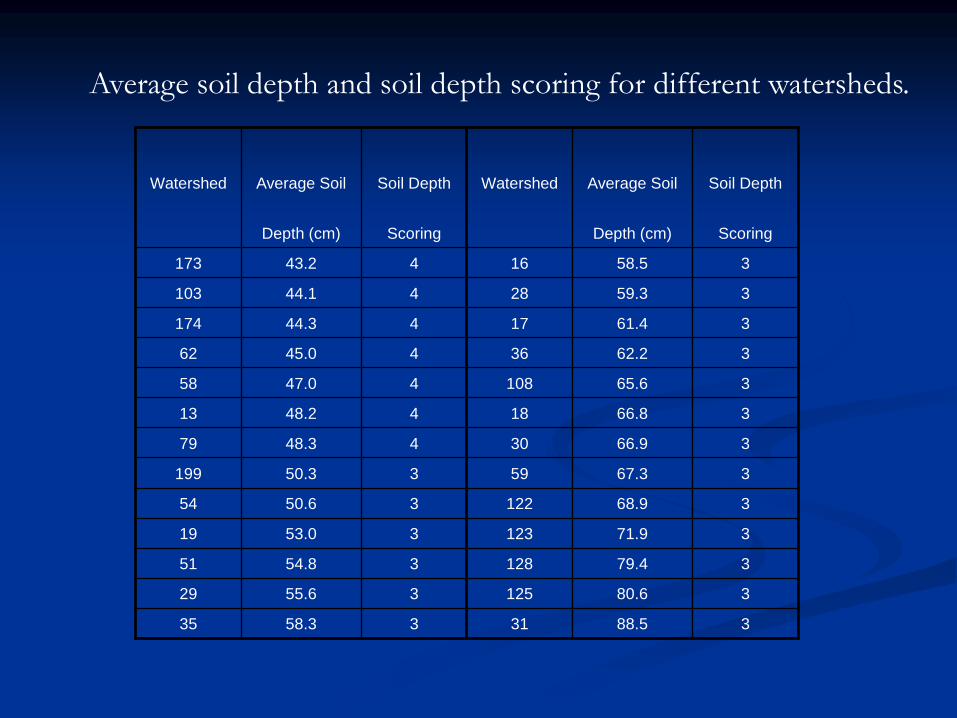
Average soil depth and soil depth scoring for different watersheds.
Soil DepthAverage SoilWatershedSoil DepthAverage SoilWatershed
ScoringDepth (cm)ScoringDepth (cm)
358.516443.2173
359.328444.1103
361.417444.3174
362.236445.062
365.6108447.058
366.818448.213
366.930448.379
367.359350.3199
368.9122350.654
371.9123353.019
379.4128354.851
380.6125355.629
388.531358.335
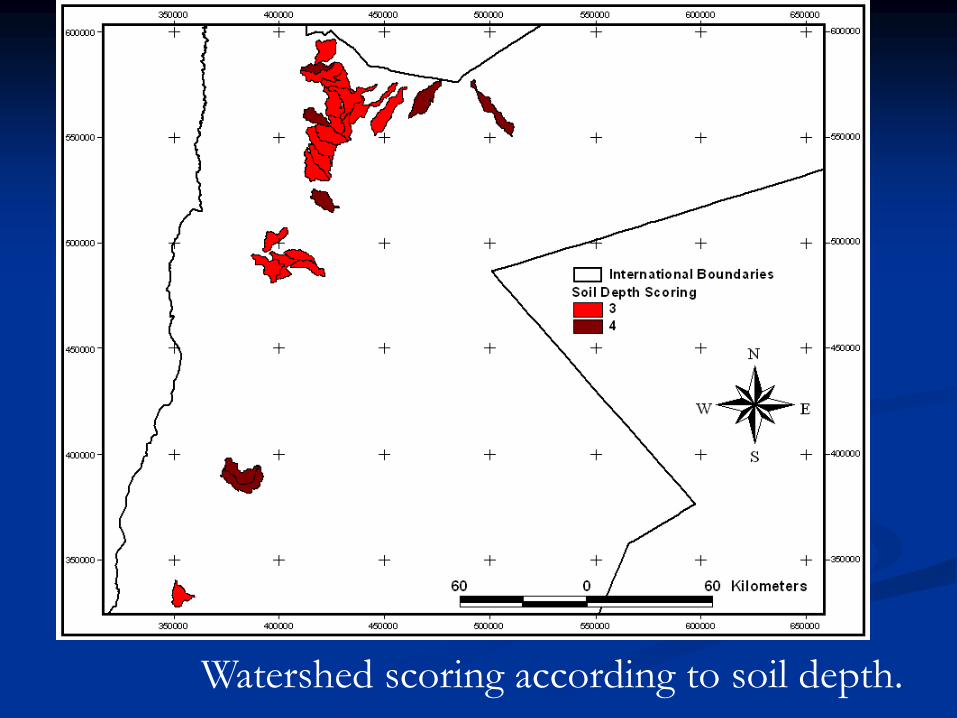
Watershed scoring according to soil depth.
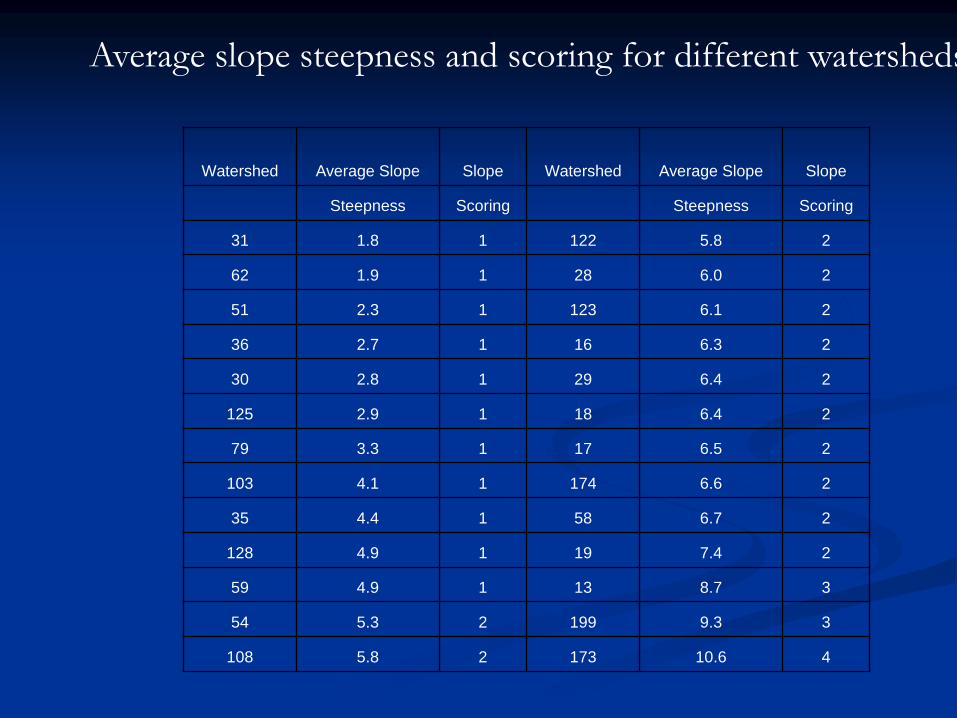
Average slope steepness and scoring for different watersheds.
Slope Average SlopeWatershedSlope Average SlopeWatershed
ScoringSteepnessScoringSteepness
25.812211.831
26.02811.962
26.112312.351
26.31612.736
26.42912.830
26.41812.9125
26.51713.379
26.617414.1103
26.75814.435
27.41914.9128
38.71314.959
39.319925.354
410.617325.8108
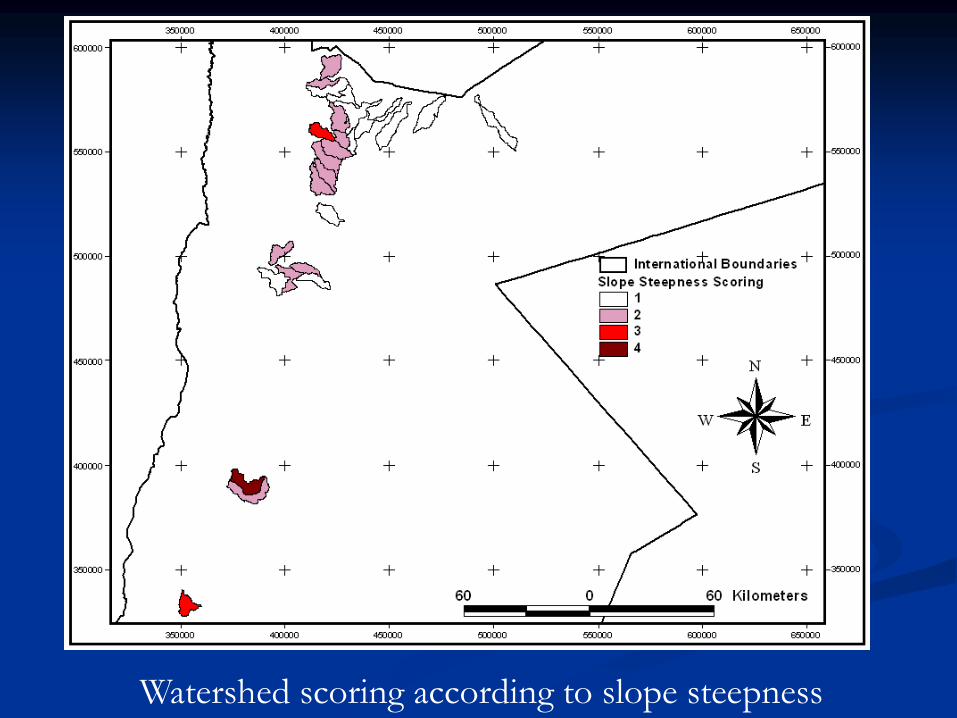
Watershed scoring according to slope steepness
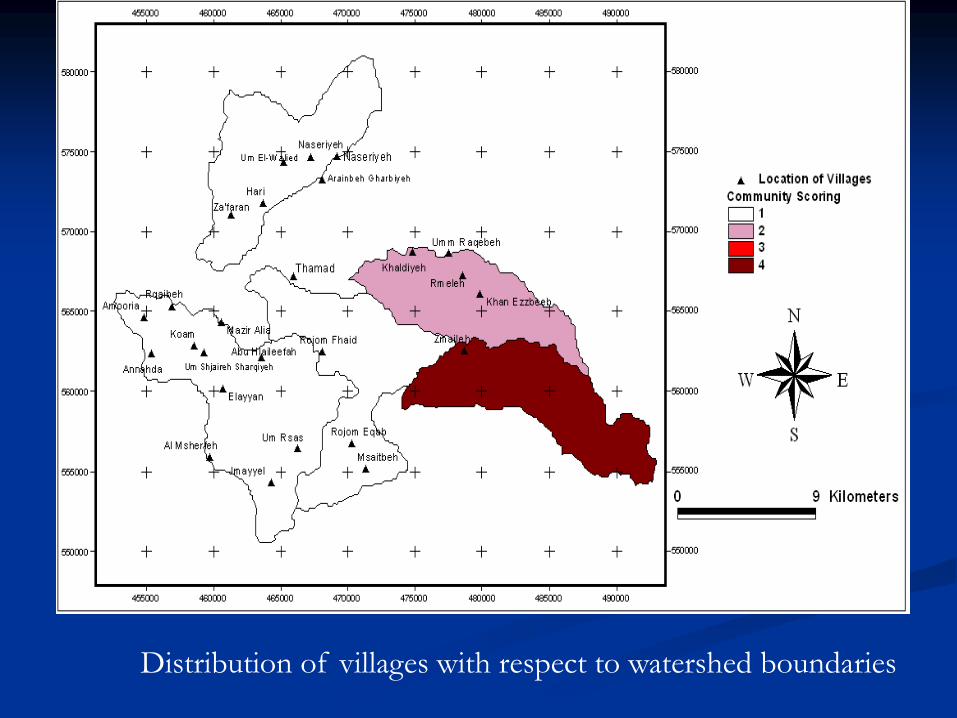
Distribution of villages with respect to watershed boundaries
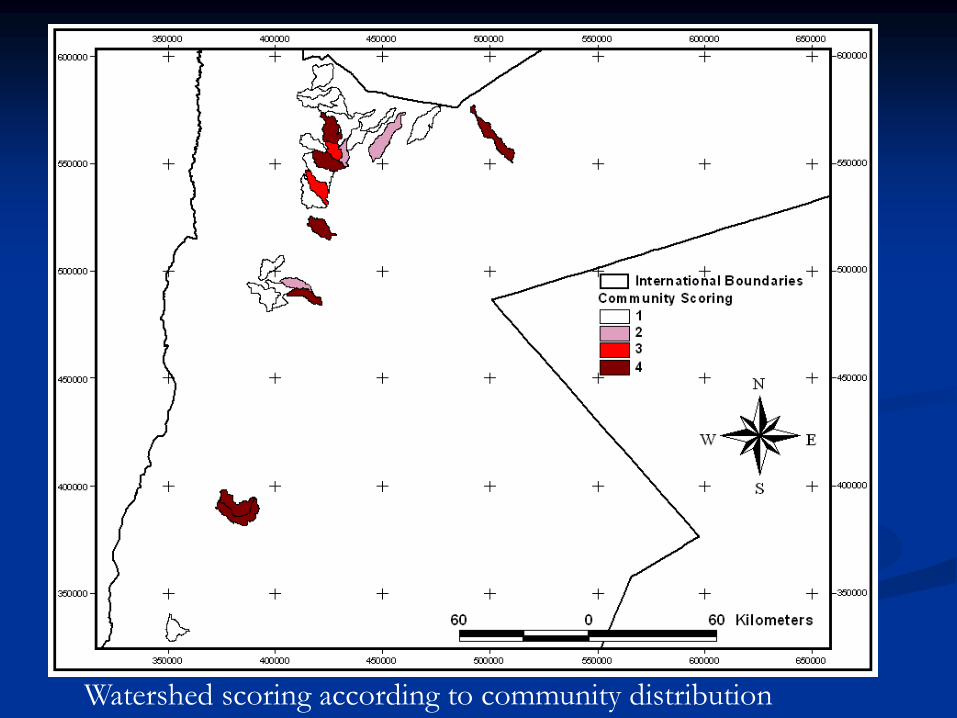
Watershed scoring according to community distribution

An example illustrating the scoring of a watershed according to the criteria
rangeland-based system.
Watershed Number 13
Summary
Percentage
CountClassificationVegetation type
PercentClass1710NativeGrasses
73Native 127NativeYenton
8Barley106NativeThistle
18Irrigated85NativeAdo
85BarleyBarley
1Score85NativeKhurfaish
74IrrigatedOlives
53NativeShia
32NativeGaisum
32NativeSerra
32NativeSheih
21IrrigatedBarseem
21IrrigatedCabbage
21IrrigatedCauliflow.
21IrrigatedClover
21IrrigatedFlowers
21NativeJarger
21NativeKheiss
21IrrigatedMaize
21IrrigatedPeach
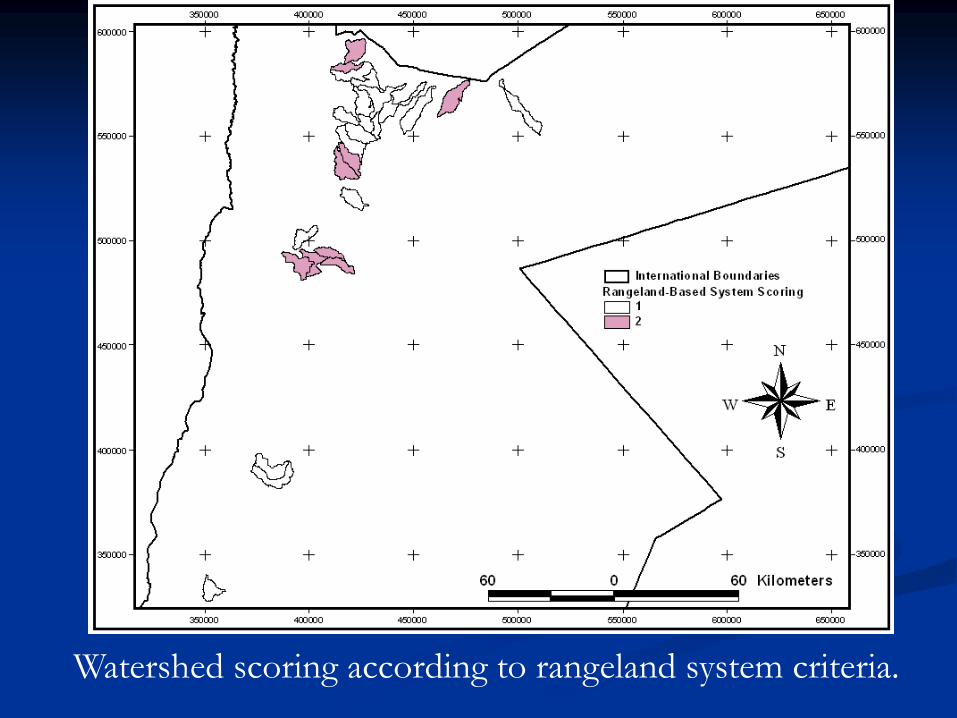
Watershed scoring according to rangeland system criteria.
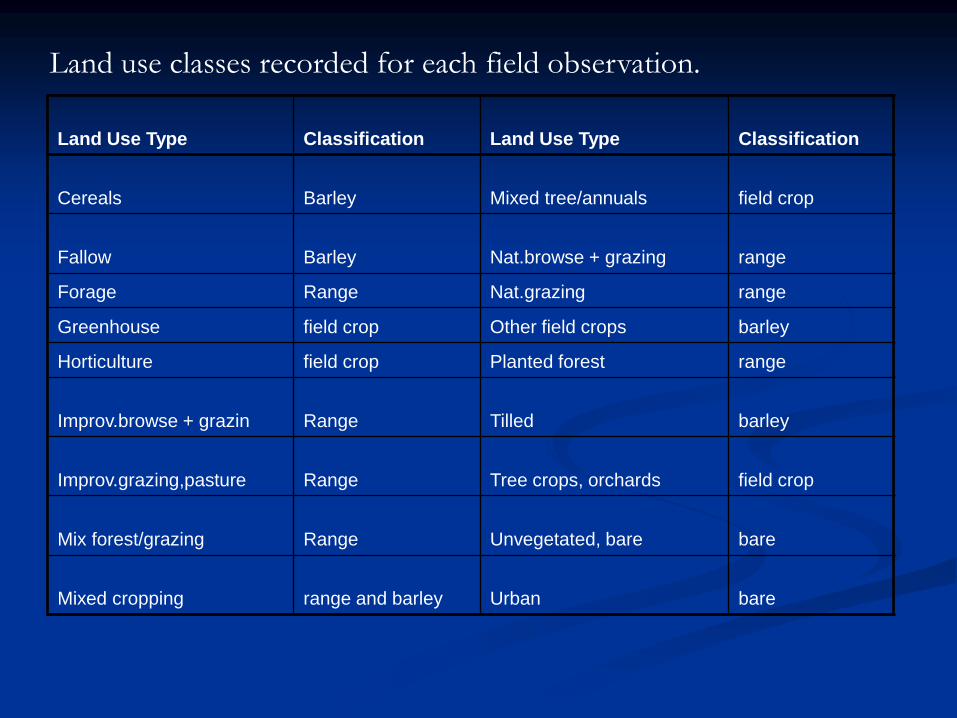
Land use classes recorded for each field observation.
ClassificationLand Use TypeClassificationLand Use Type
field cropMixed tree/annualsBarleyCereals
rangeNat.browse + grazingBarleyFallow
rangeNat.grazingRangeForage
barleyOther field cropsfield cropGreenhouse
rangePlanted forestfield cropHorticulture
barleyTilledRangeImprov.browse + grazin
field cropTree crops, orchardsRangeImprov.grazing,pasture
bareUnvegetated, bareRangeMix forest/grazing
bareUrbanrange and barleyMixed cropping
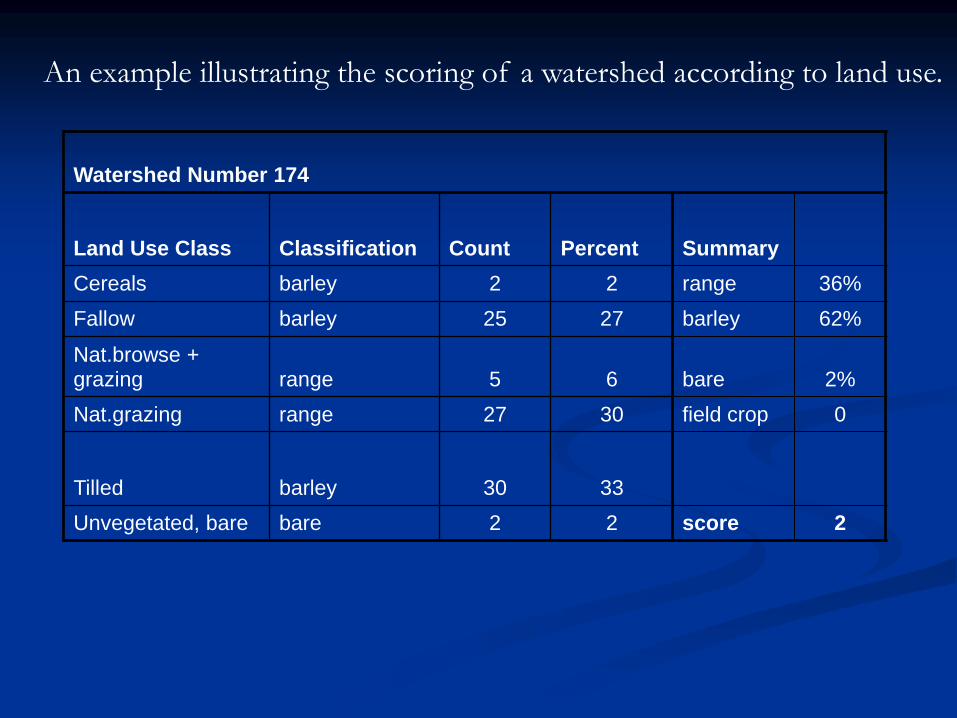
An example illustrating the scoring of a watershed according to land use.
Watershed Number 174
SummaryPercentCountClassificationLand Use Class
36%range22barleyCereals
62%barley2725barleyFallow
2%bare65rangeNat.browse + grazing
0field crop3027rangeNat.grazing
3330barleyTilled
2score22bareUnvegetated, bare
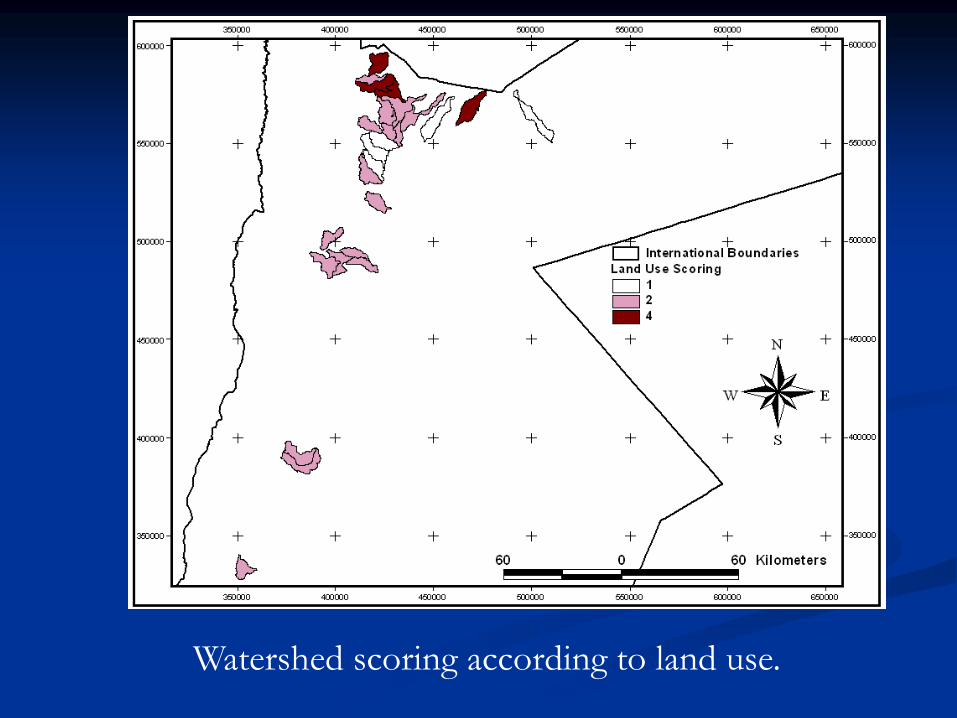
Watershed scoring according to land use.

Scoring according to watershed area
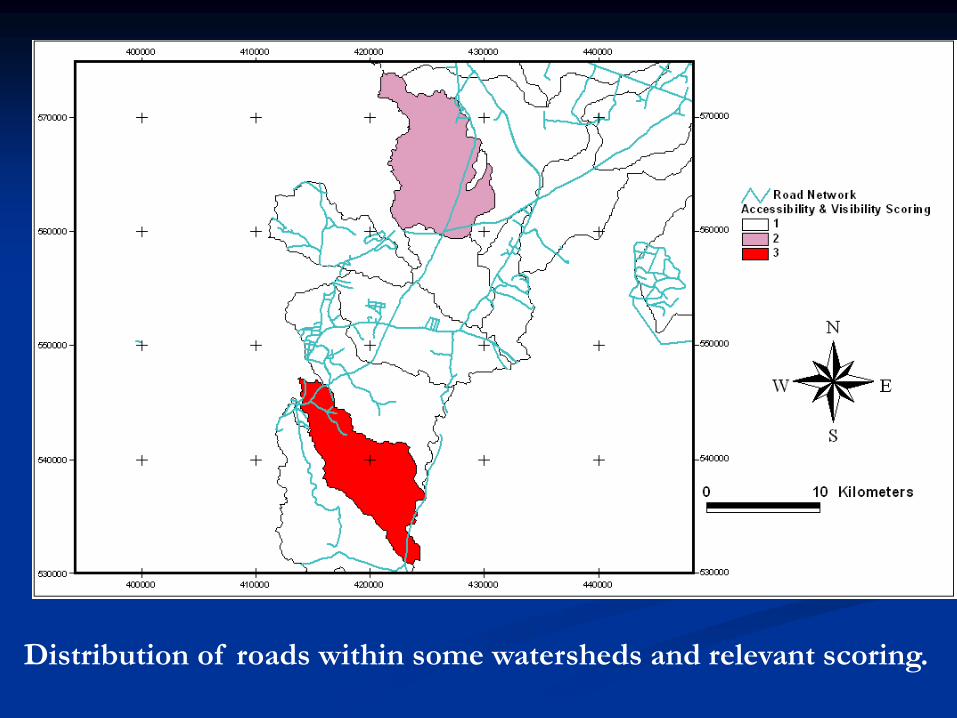
Distribution of roads within some watersheds and relevant scoring.
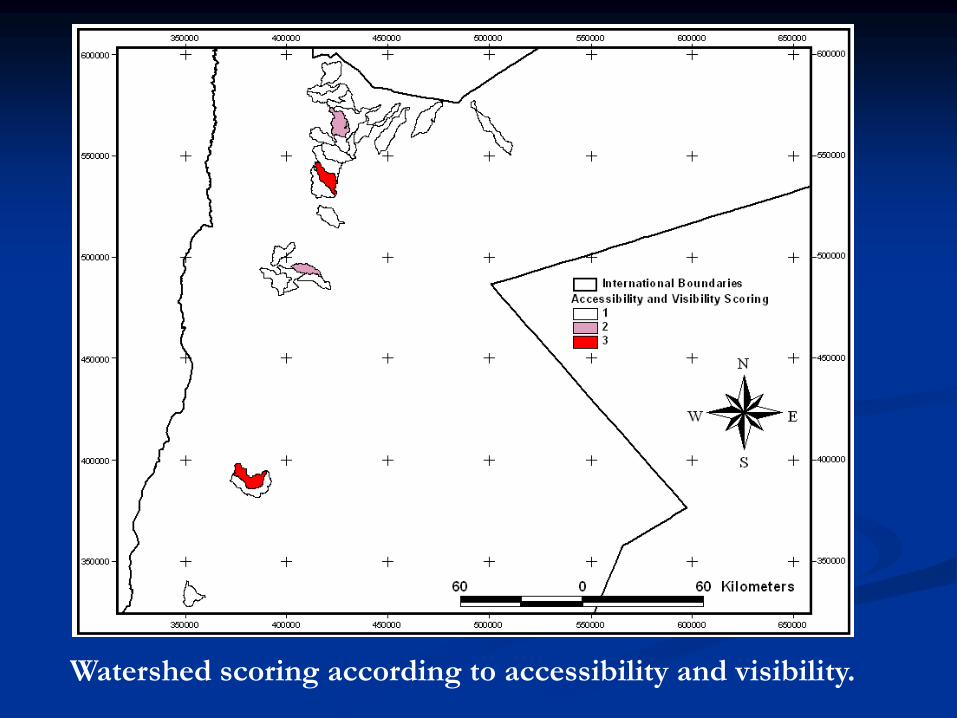
Watershed scoring according to accessibility and visibility.
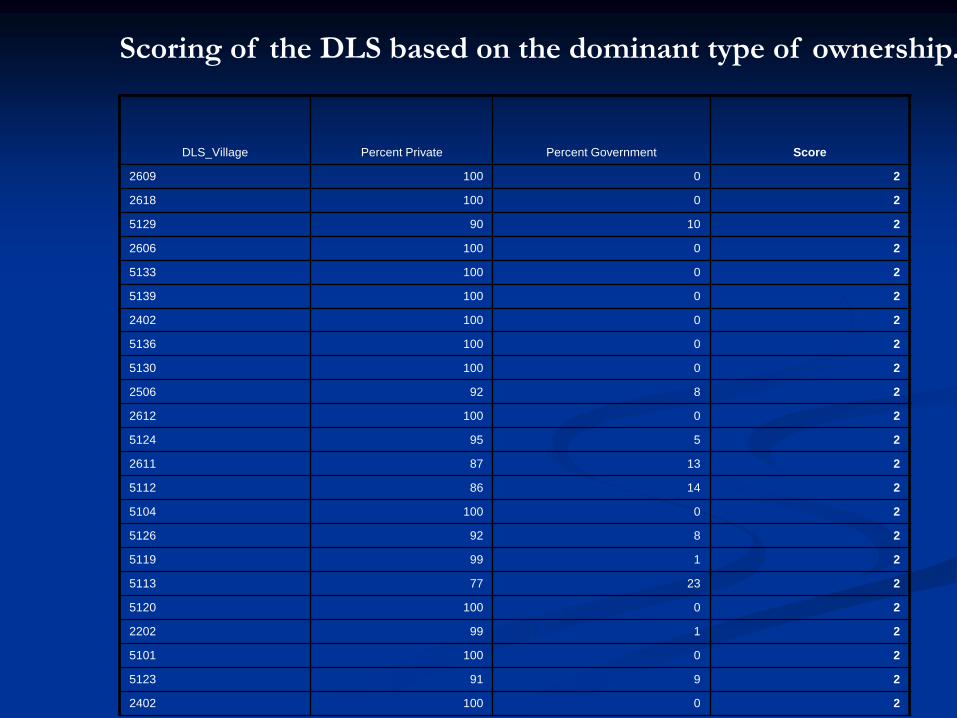
ScorePercent GovernmentPercent PrivateDLS_Village
201002609
201002618
210905129
201002606
201005133
201005139
201002402
201005136
201005130
28922506
201002612
25955124
213872611
214865112
201005104
28925126
21995119
223775113
201005120
21992202
201005101
29915123
201002402
Scoring of the DLS based on the dominant type of ownership.

Example of the relationship between DLS villages classified
according to land tenure and watershed boundaries.

Watershed scoring according to land tenure.

Final scores for the second stage selection.
Final*LandLanduse RangelandWatershedAccessibilityCommunity SlopeSoilWatershed
ScoresTenure System Area & Visibility SteepnessDepth Number
122111112319
122211111336
1212211113128
1312121123108
142221112328
142213111330
142212121335
142113121351
142411111359
152111142318
152412111331
152111141479
1522221123123
1522121133199
162212113413
162212132317
162421112354
162222112458
162421111462
1622111414103
172211242316
172121332329
* Low scores indicate higher
potential for water harvesting.

Distribution of watersheds with different
final scores (second stage).
The result:
9 watersheds out of 26
(scoring12, 13, 14) were
selected which satisfied
the criteria of the 2nd
stage

Inter-disciplinary discussion
• The final results were exposed for discussion. Experts, from various
relevant disciplines, contributed and enriched the decision for the
final selection of the potential watersheds especially those who have
long experience in the Badia.
•The decision was to select the 9 watersheds based on the discussion
and to expose these watersheds for field visits.
•A multi-disciplinary team, including land use planning specialists,
agronomists, water harvesting specialists, rangeland specialists,
hydrologists and socio-economists, were involved in these visits.
•The main aims of these visits were: first, to verify the selection
process, since all activities were undertaken using maps within GIS
environment, and secondly, to record any relevant features that were
not considered in the selection process.
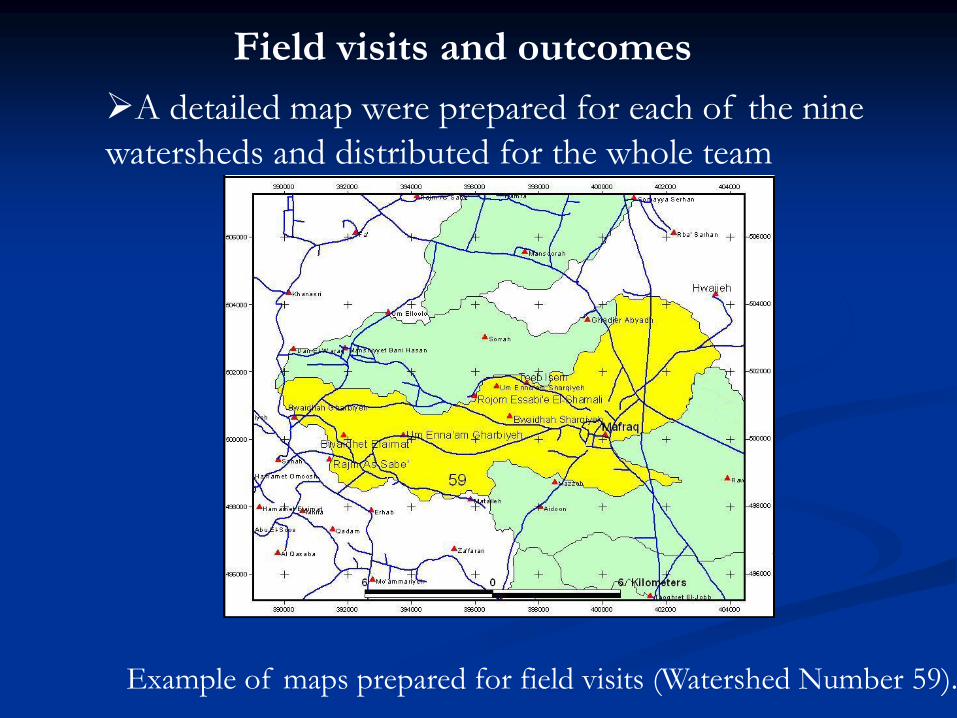
Field visits and outcomes
A detailed map were prepared for each of the nine
watersheds and distributed for the whole team
Example of maps prepared for field visits (Watershed Number 59).
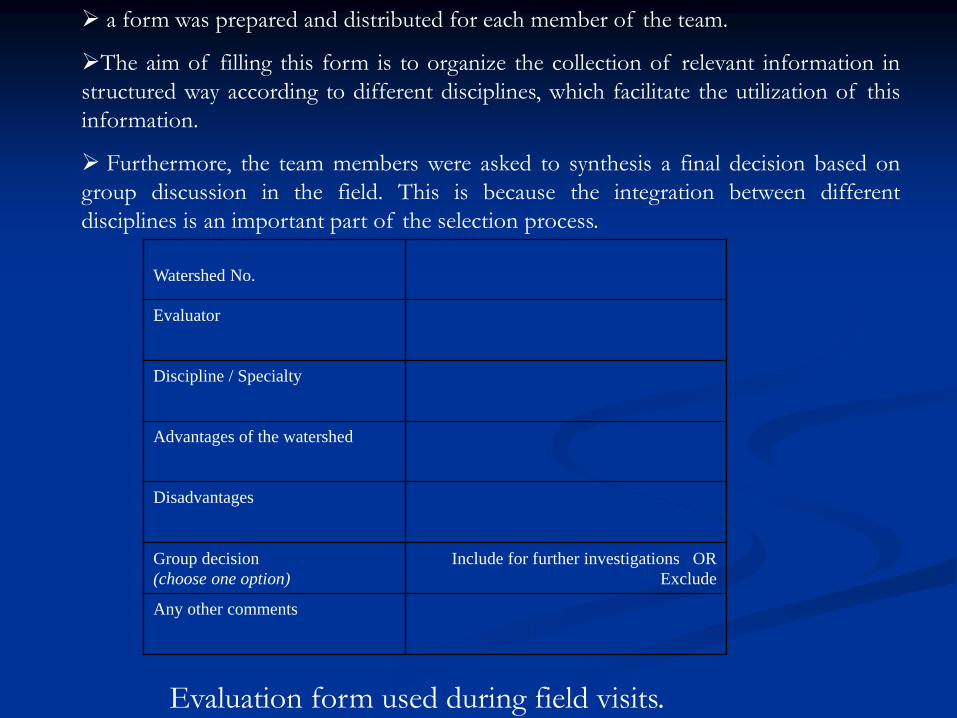
a form was prepared and distributed for each member of the team.
The aim of filling this form is to organize the collection of relevant information in
structured way according to different disciplines, which facilitate the utilization of this
information.
Furthermore, the team members were asked to synthesis a final decision based on
group discussion in the field. This is because the integration between different
disciplines is an important part of the selection process.
Evaluation form used during field visits.
Watershed No.
Evaluator
Discipline / Specialty
Advantages of the watershed
Disadvantages
Include for further investigations OR
Exclude
Group decision
(choose one option)
Any other comments
Revision the scoring with respect to the community criterion
and come up with additional watersheds to be added for the
existing 9 watersheds. The final score for the first stage was
recalculated to exclude the community score.
Watersheds that still have high scores and were excluded from
the first stage because of the community were highlighted. This
presents the scoring without taking into account the community
criterion.
The following watersheds were added because the scores
without the community were high and there were a fair
distribution of communities close to these watersheds: 104, 118,
119, 126 and 127.
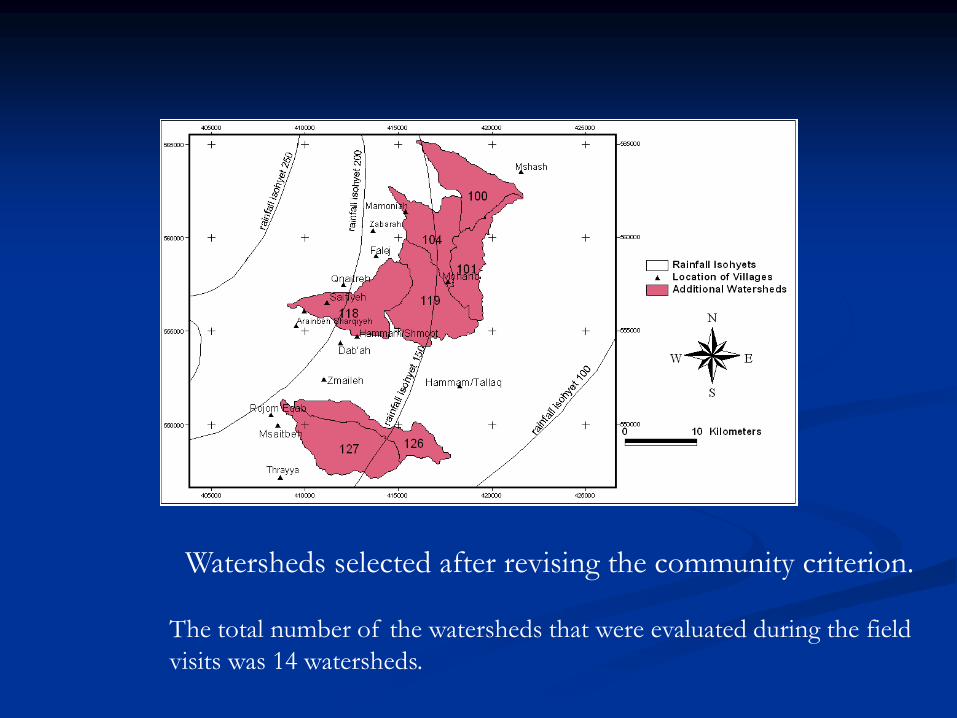
Watersheds selected after revising the community criterion.
The total number of the watersheds that were evaluated during the field
visits was 14 watersheds.

This table presents the watersheds (8)that were eliminated from further
discussions due to the respective obvious limitation. These judgments
were reached by revising the notes taken in the field by each expert
Limitation(s)Watershed Number
- closed area, not allowed for public.19
- Intensive irrigation.
- Very limited community.
- Dominated by flat topography.
36
- Very steep and stony watershed.
- Industrial and urban activities.
28
- Intensive industrial zone.35
- Intensive irrigation activities.51
- Intensive irrigation activities.126
- Dominated by flat topography.
- Very limited community.
127
- Intensive irrigation activities.118
Excluded watersheds according to an obvious limitation.
The remaining watersheds (6) were scaled according to their
fitness to certain criteria that were evaluated in the field. The
team worked together during the meeting to agree upon a scale
for each watershed .
The aim of this scaling is to summarize all what have been
seen and discussed in the field into rational items which is
relevant to the project. These items fall under three major
headings; bio-physical factors, water harvesting related and
socio-economical aspects.
Scale was from 1 (worst) to 3 (best).
Urbanization was scaled in negative figures, because as the
increase in urbanization represent a negative impact on the
project activities.
Scaling methodology.
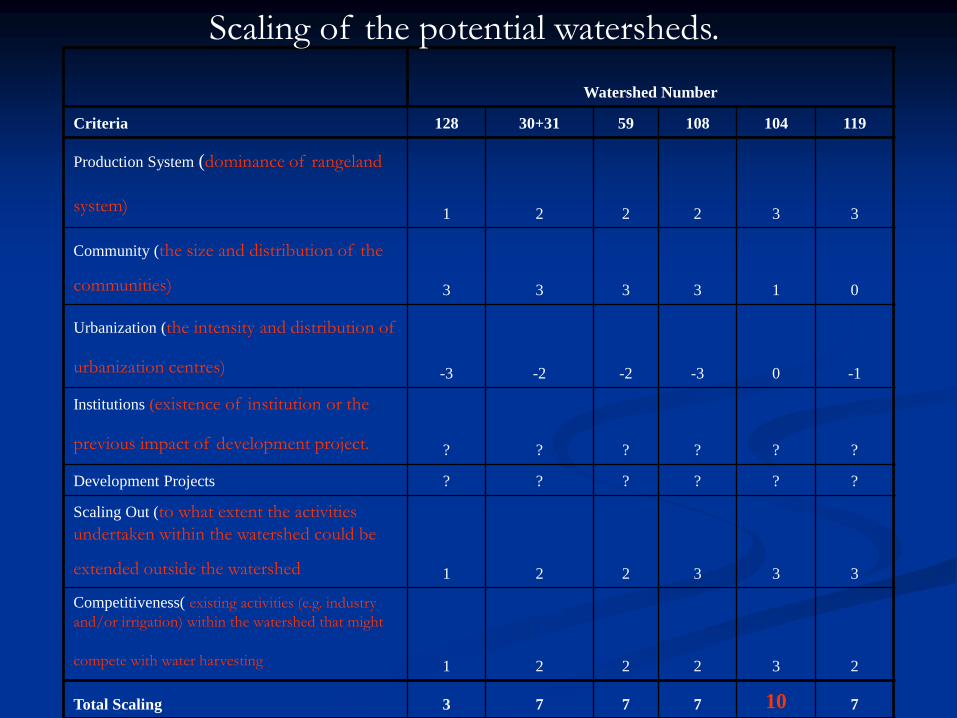
Watershed Number
1191041085930+31128Criteria
332221
Production System (dominance of rangeland
system)
013333
Community (the size and distribution of the
communities)
-10-3-2-2-3
Urbanization (the intensity and distribution of
urbanization centres)
??????
Institutions (existence of institution or the
previous impact of development project.
??????Development Projects
333221
Scaling Out (to what extent the activities
undertaken within the watershed could be
extended outside the watershed
232221
Competitiveness( existing activities (e.g. industry
and/or irrigation) within the watershed that might
compete with water harvesting
7107773Total Scaling
Scaling of the potential watersheds.
Results
Watershed 128was excluded because of low
score.
5 watersheds were forwarded as an input for
further detailed evaluation in the third stage of
the selection process.
Third stage
Selection of the final watershed(s)
The third stage of site selection process included detailed
investigation of three main issues:
Socio-economy through RRA.
Hydrological assessment.
Environmental impact assessment.
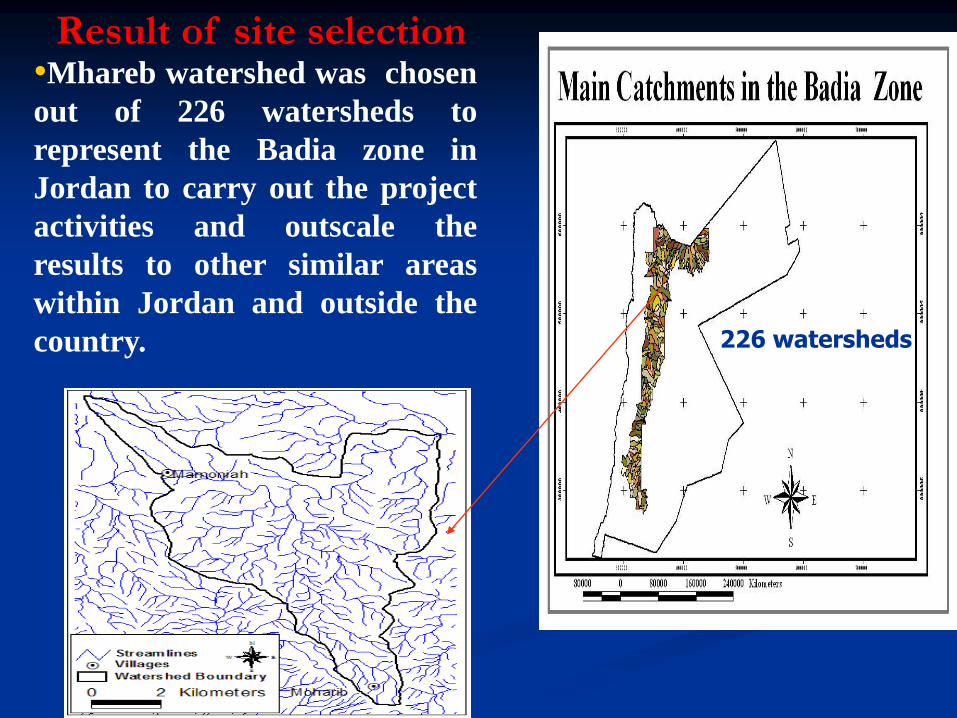
226 watersheds
•Mhareb watershed was chosen
out of 226 watersheds to
represent the Badia zone in
Jordan to carry out the project
activities and outscale the
results to other similar areas
within Jordan and outside the
country.
Result of site selection
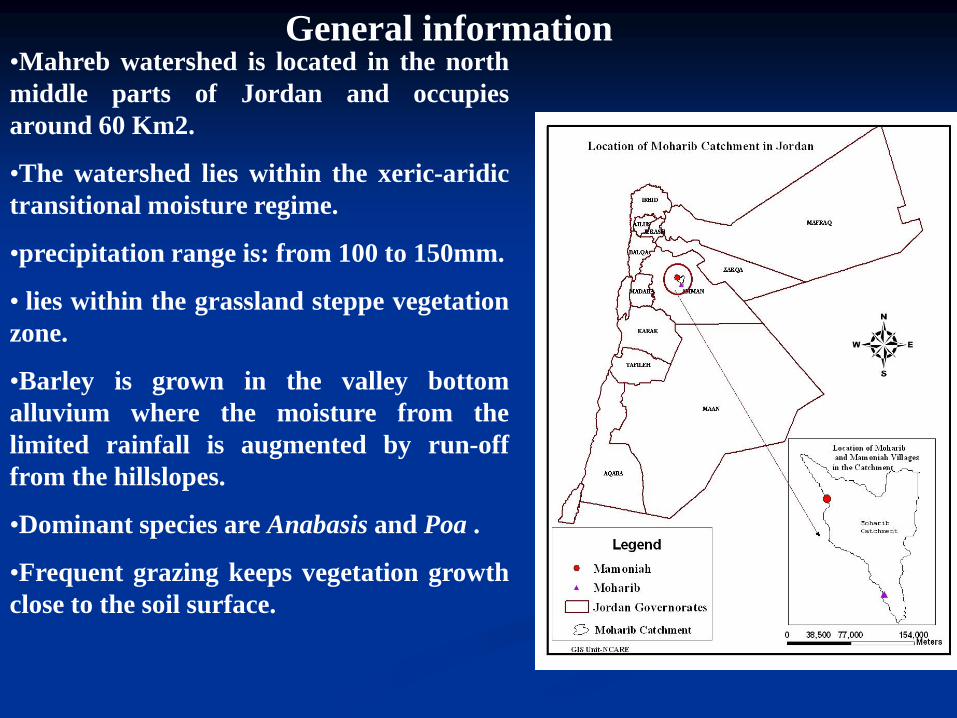
•Mahreb watershed is located in the north
middle parts of Jordan and occupies
around 60 Km2.
•The watershed lies within the xeric-aridic
transitional moisture regime.
•precipitation range is: from 100 to 150mm.
• lies within the grassland steppe vegetation
zone.
•Barley is grown in the valley bottom
alluvium where the moisture from the
limited rainfall is augmented by run-off
from the hillslopes.
•Dominant species are Anabasis and Poa .
•Frequent grazing keeps vegetation growth
close to the soil surface.
General information
Why ?
The purpose of the watershed characterization is to
select suitable areas for various water harvesting
interventions.
When planning such systems, appropriate data must be
available on the climate, soil, crops, topography, and
socioeconomics of the project area.
Biophysical Characterization
of Mhareb watershed
The main output:
provide a suitability map that indicates the
distribution of areas suitable for various
water harvesting techniques within the
watershed from a biophysical point of view.
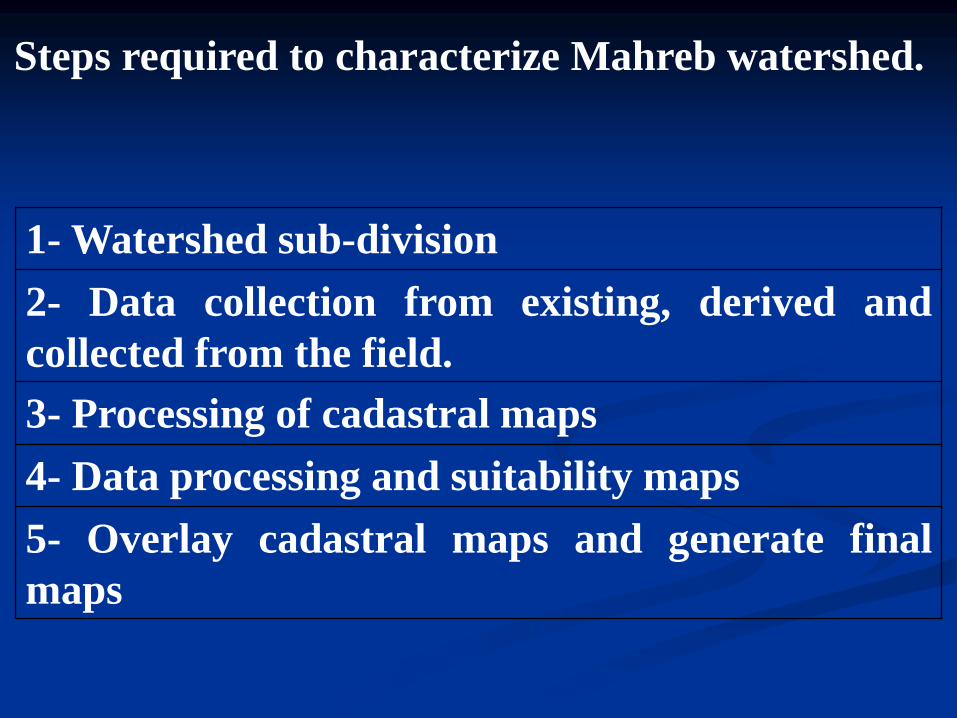
Steps required to characterize Mahreb watershed.
1- Watershed sub-division
2- Data collection from existing, derived and
collected from the field.
3- Processing of cadastral maps
4- Data processing and suitability maps
5- Overlay cadastral maps and generate final
maps

Methodology:
Data Collection :The data were delivered from
various sources and various formats
Available Data
Derived data
Data collected in the field
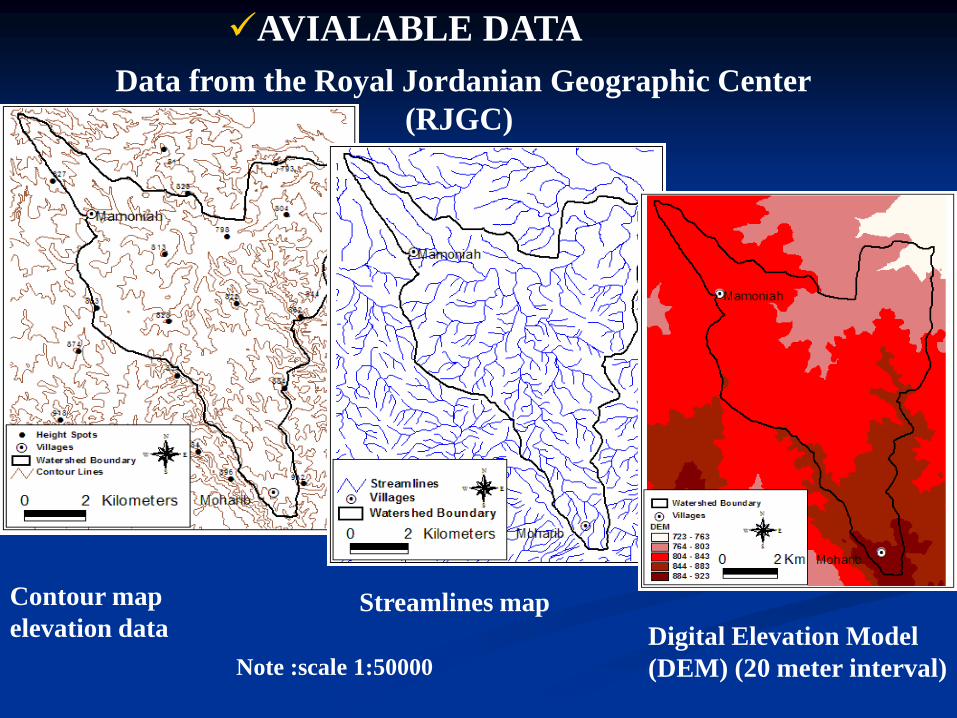
Data from the Royal Jordanian Geographic Center
(RJGC)
AVIALABLE DATA
Digital Elevation Model
(DEM) (20 meter interval)
Contour map
elevation dataStreamlines map
Note :scale 1:50000
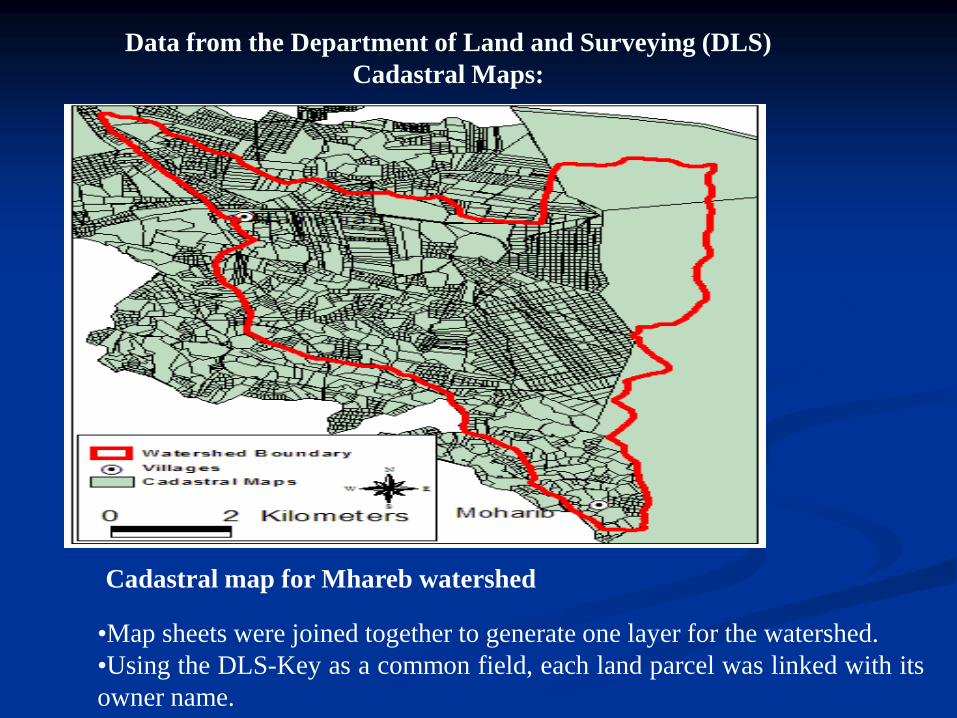
Cadastral map for Mhareb watershed
•Map sheets were joined together to generate one layer for the watershed.
•Using the DLS-Key as a common field, each land parcel was linked with its
owner name.
Data from the Department of Land and Surveying (DLS)
Cadastral Maps:
Cadastral data will be used for many purposes:
The area of each parcel was used to identifysuitable land for water harvesting as criteria forthe selections.
to identify the owner(s) of the land for thosesuitable land for each water harvestingintervention.
To provide the socio-economic team with thisinformation to approach the relevant owner(s) tostart the negotiation about the implementationstage.
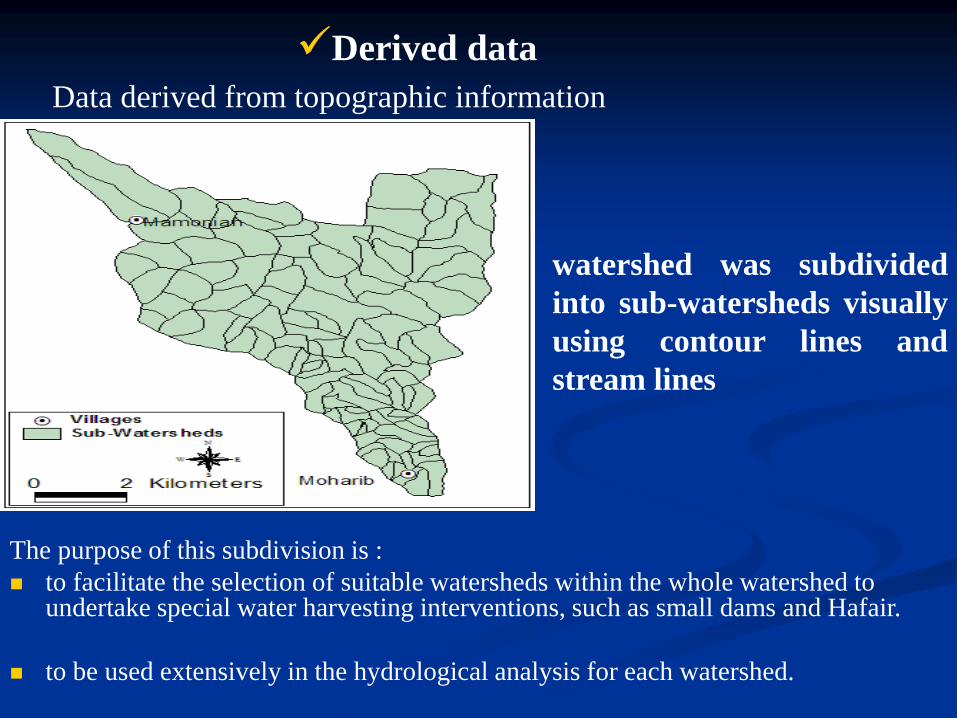
Data derived from topographic information
Derived data
watershed was subdivided
into sub-watersheds visually
using contour lines and
stream lines
The purpose of this subdivision is :
to facilitate the selection of suitable watersheds within the whole watershed to undertake special water harvesting interventions, such as small dams and Hafair.
to be used extensively in the hydrological analysis for each watershed.
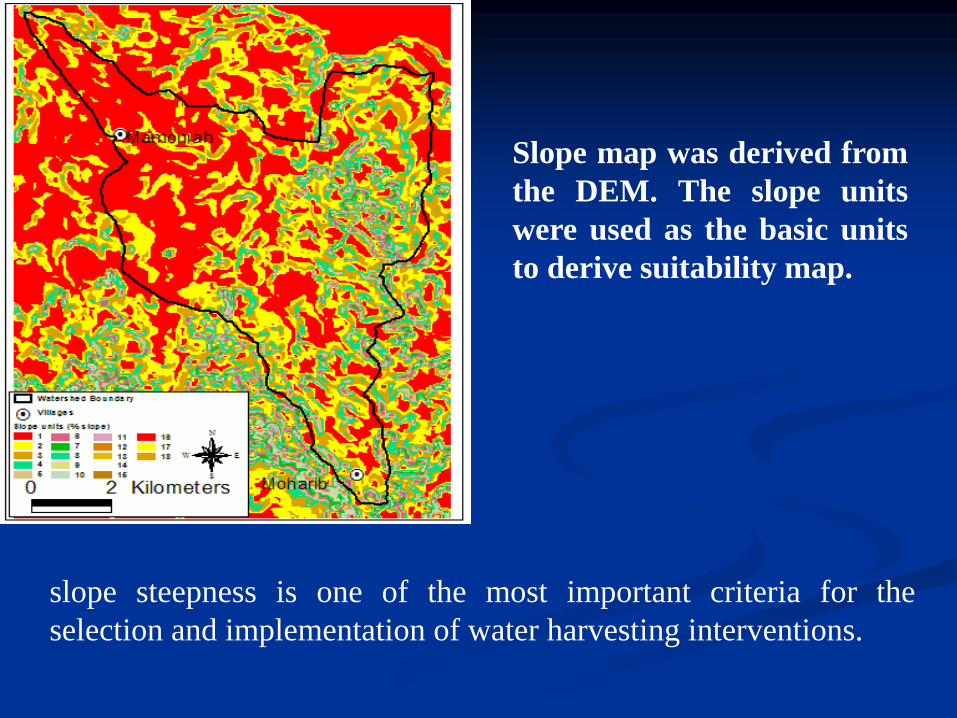
Slope map was derived from
the DEM. The slope units
were used as the basic units
to derive suitability map.
slope steepness is one of the most important criteria for the
selection and implementation of water harvesting interventions.
main limitation: detailed information about the
soil in the investigated area is absent.
The alternative was the collection of field
observations where only relevant soil and site
properties were recorded.
Data collected in the field

Sampling procedure
A grid of uniform sampling (500m) was used. One field
observation was taken for each grid.
Sampling procedure
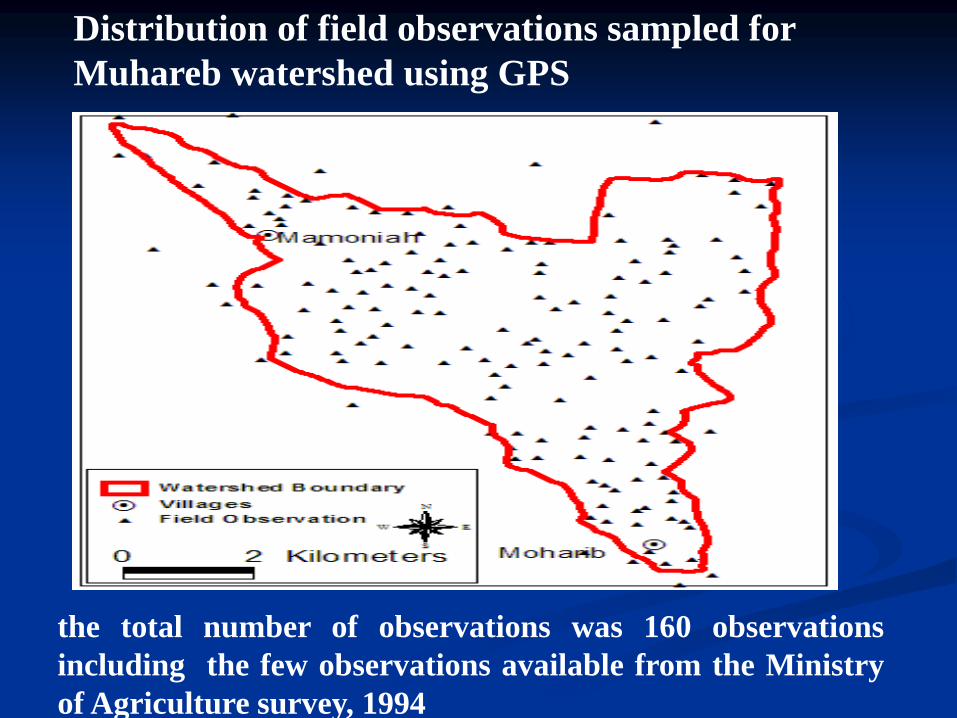
Distribution of field observations sampled for
Muhareb watershed using GPS
the total number of observations was 160 observations
including the few observations available from the Ministry
of Agriculture survey, 1994
The field survey was basically designed to
provide information about the physical factors
in the watershed required to carry out the
suitability analysis for water harvesting
interventions.
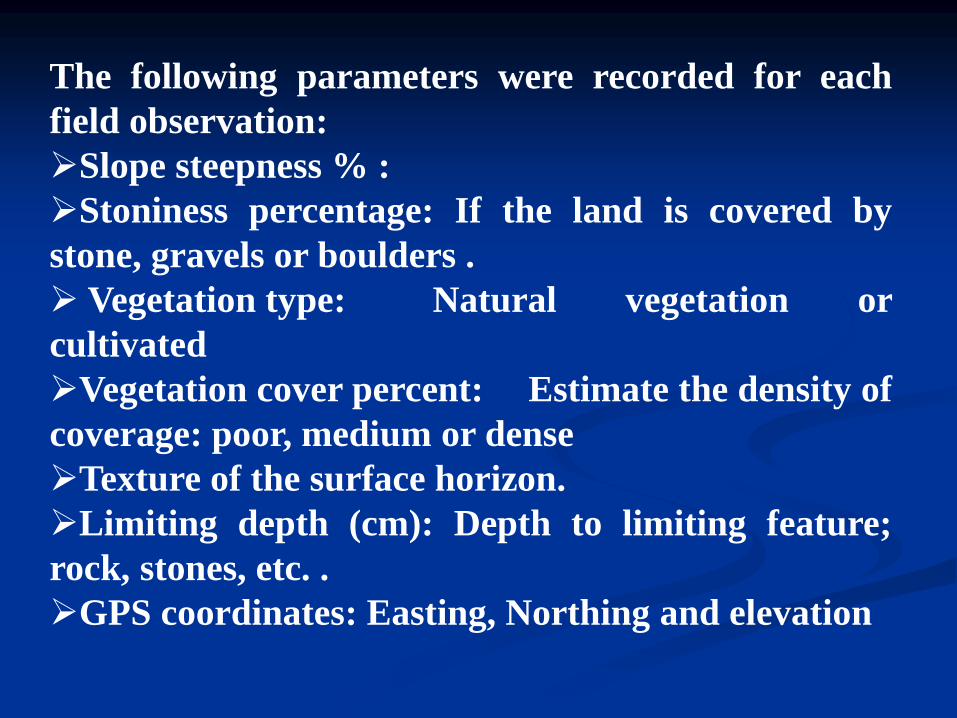
The following parameters were recorded for each
field observation:
Slope steepness % :
Stoniness percentage: If the land is covered by
stone, gravels or boulders .
Vegetation type: Natural vegetation or
cultivated
Vegetation cover percent: Estimate the density of
coverage: poor, medium or dense
Texture of the surface horizon.
Limiting depth (cm): Depth to limiting feature;
rock, stones, etc. .
GPS coordinates: Easting, Northing and elevation
Limiting
Soil depth
cm
Stoniness
&garvels
%
Slop
e
%
Texture*V.
Cover
%
Vegetation Cover
(Dominant. Sp)
Elevatio
n
(GPS)
m
Coordination
(GPS)
Site Number,
Randomly
characterize
dNorthing
JTM
Easting/
JTM
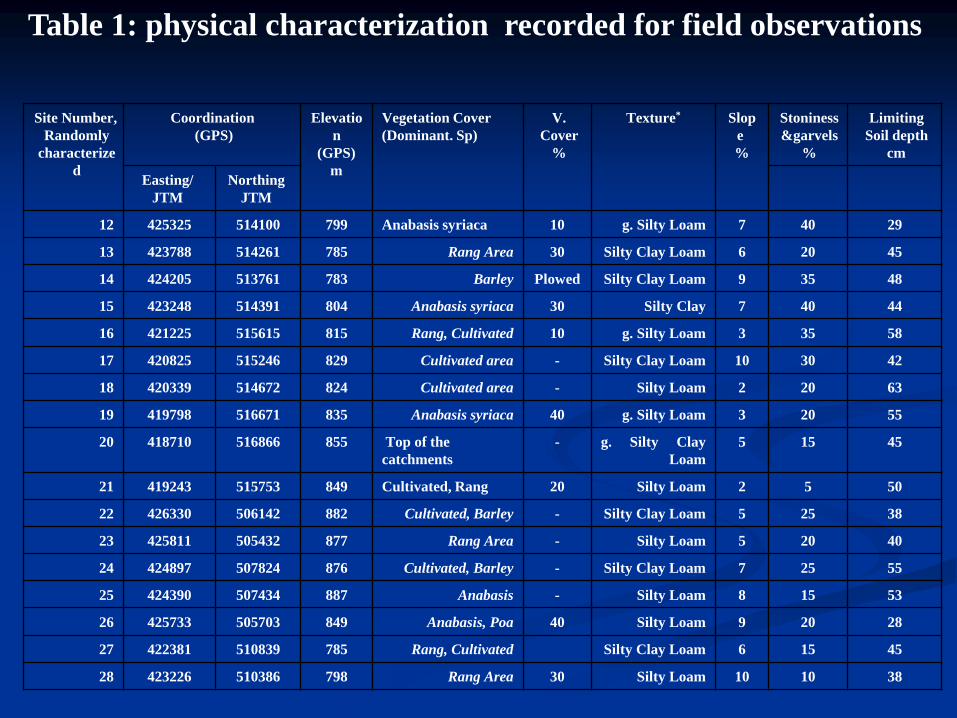
29407g. Silty Loam10Anabasis syriaca79951410042532512
45206Silty Clay Loam30Rang Area78551426142378813
48359Silty Clay LoamPlowedBarley78351376142420514
44407Silty Clay30Anabasis syriaca80451439142324815
58353g. Silty Loam10Rang, Cultivated81551561542122516
423010Silty Clay Loam-Cultivated area82951524642082517
63202Silty Loam-Cultivated area82451467242033918
55203g. Silty Loam40Anabasis syriaca83551667141979819
45155g. Silty Clay
Loam
-Top of the
catchments
85551686641871020
5052Silty Loam20Cultivated, Rang 84951575341924321
38255Silty Clay Loam-Cultivated, Barley88250614242633022
40205Silty Loam-Rang Area87750543242581123
55257Silty Clay Loam-Cultivated, Barley87650782442489724
53158Silty Loam-Anabasis88750743442439025
28209Silty Loam40Anabasis, Poa84950570342573326
45156Silty Clay LoamRang, Cultivated78551083942238127
381010Silty Loam30Rang Area79851038642322628
Table 1: physical characterization recorded for field observations
SUITABILITY ANALYSIS FOR WATER
HARVESTING INTERVENTIONS of Muhareb
CATCHMENT
Methodology: cont..
The purpose of undertaking suitability analysis is
to provide information about the distribution of
areas that are suitable for each water harvesting
technique.
How suitable an area is for water harvesting
depends on whether the area meets the basic
technical requirements of the water-harvesting
system in question.
Steps of suitability analysis:

1- determine the physical requirements (guidelines)
for each water harvesting intervention using
published sources (Water Harvesting: Indigenous
Knowledge for the Future of the Drier
Environments)*.
The set of guidelines for selecting water-harvesting
techniques in the drier environments was reviewed and
modified according to the actual conditions of the Badia in
the region.

REQUIREMENTS FOR WATER HARVESTING:
using published sources (Water Harvesting: Indigenous Knowledge for the
Future of the Drier Environments, By Theib Oweis, Dieter Prinz and Ahmed
Hachum. Published by ICARDA)
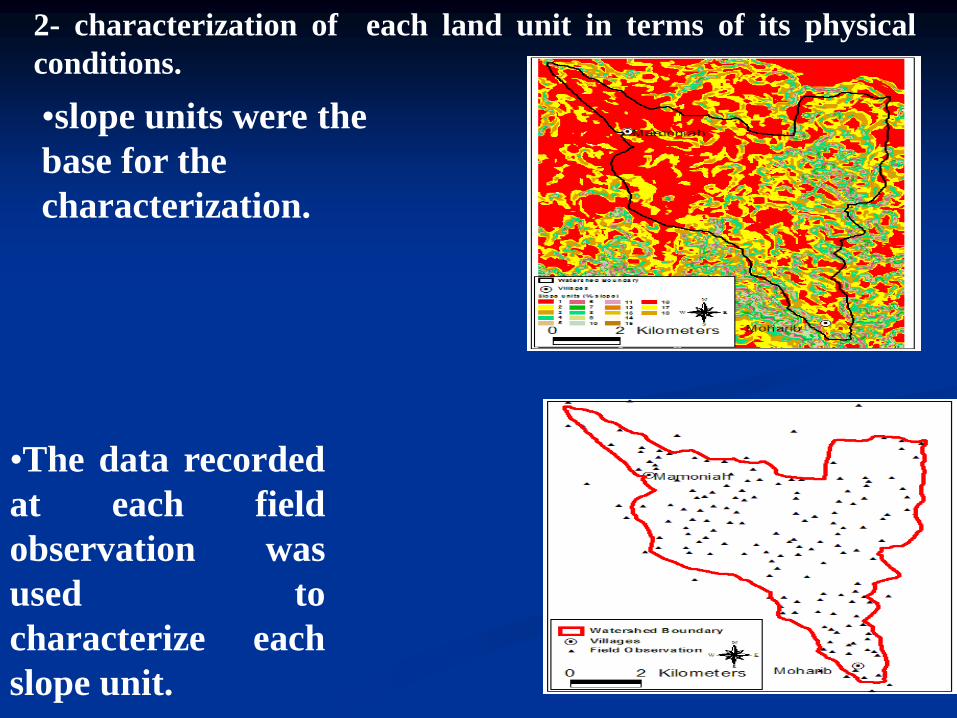
2- characterization of each land unit in terms of its physical
conditions.
•slope units were the
base for the
characterization.
•The data recorded
at each field
observation was
used to
characterize each
slope unit.
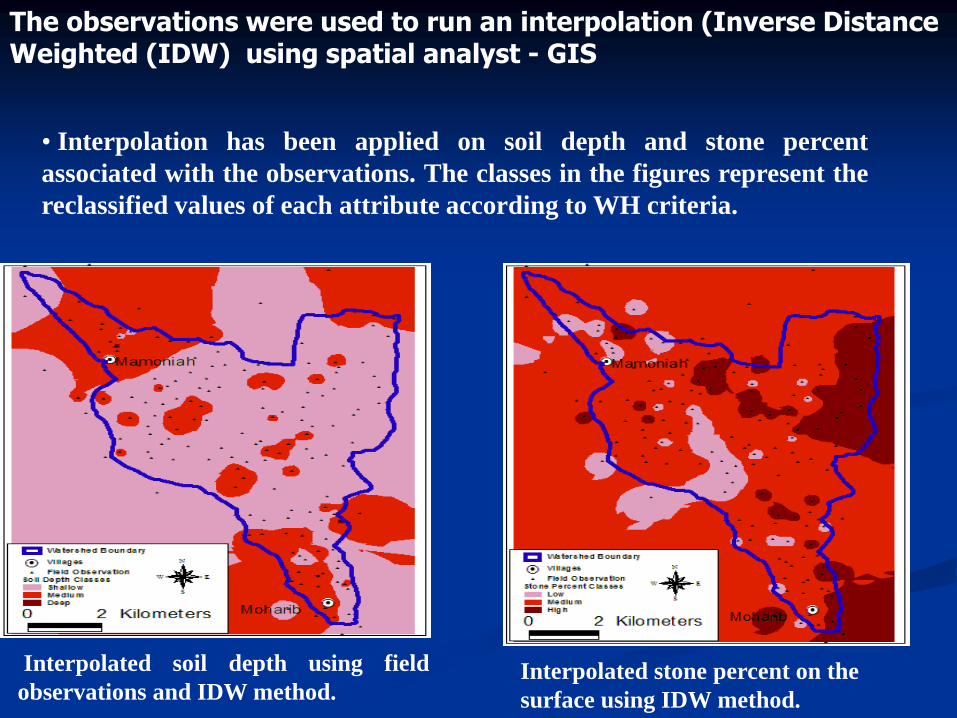
The observations were used to run an interpolation (Inverse Distance Weighted (IDW) using spatial analyst - GIS
Interpolated soil depth using field
observations and IDW method.Interpolated stone percent on the
surface using IDW method.
• Interpolation has been applied on soil depth and stone percent
associated with the observations. The classes in the figures represent the
reclassified values of each attribute according to WH criteria.
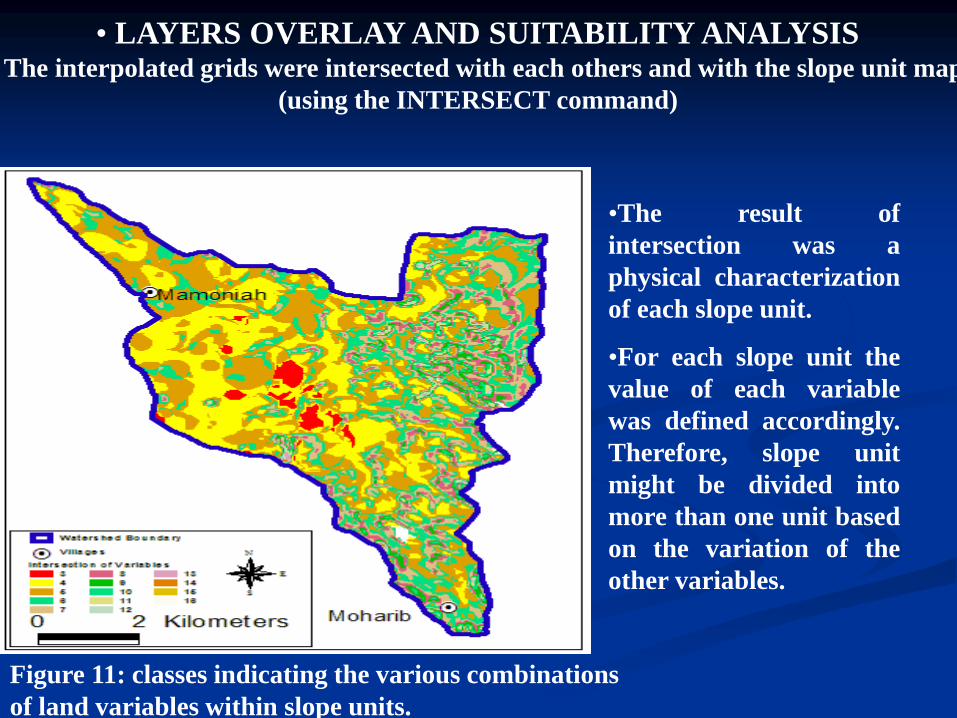
• LAYERS OVERLAY AND SUITABILITY ANALYSISThe interpolated grids were intersected with each others and with the slope unit map
(using the INTERSECT command)
Figure 11: classes indicating the various combinations
of land variables within slope units.
•The result of
intersection was a
physical characterization
of each slope unit.
•For each slope unit the
value of each variable
was defined accordingly.
Therefore, slope unit
might be divided into
more than one unit based
on the variation of the
other variables.
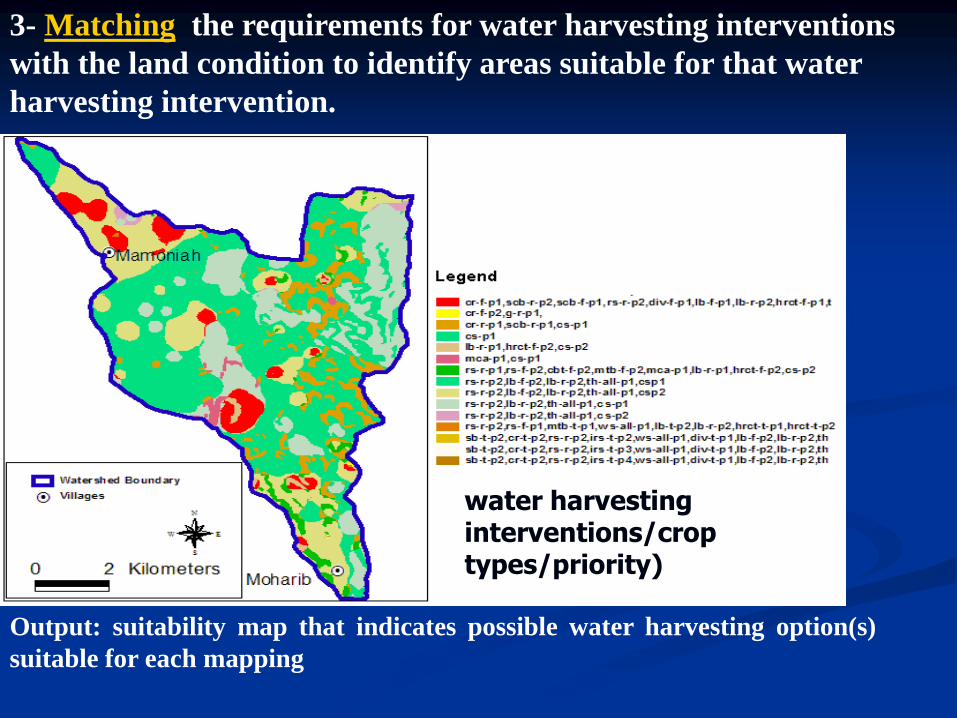
3- Matching the requirements for water harvesting interventions
with the land condition to identify areas suitable for that water
harvesting intervention.
Output: suitability map that indicates possible water harvesting option(s)
suitable for each mapping
water harvesting interventions/crop types/priority)
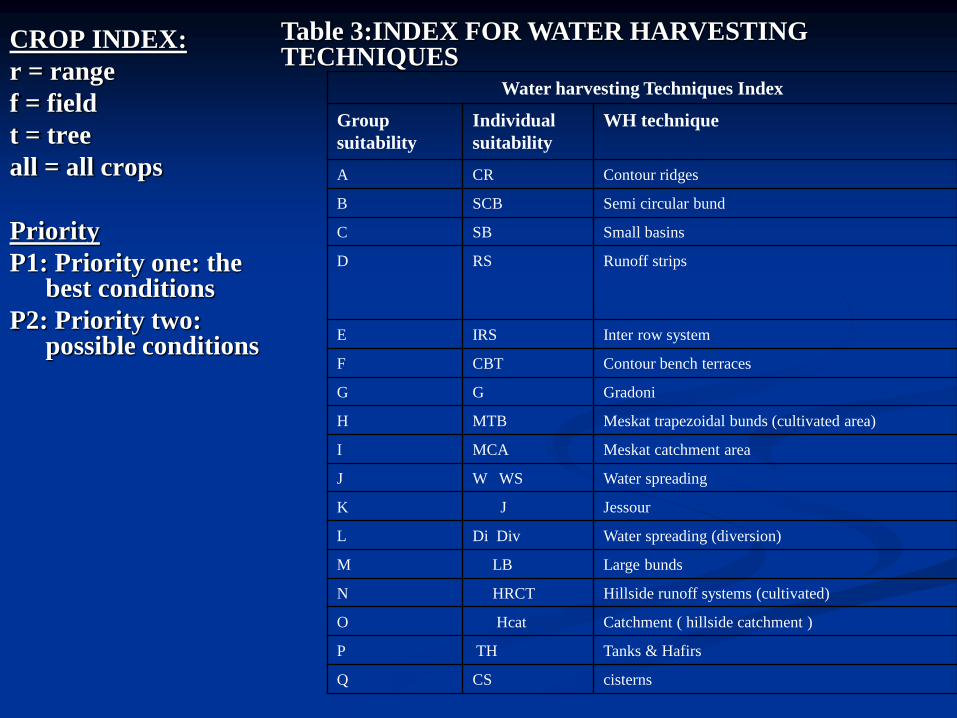
CROP INDEX:
r = range
f = field
t = tree
all = all crops
Priority
P1: Priority one: the best conditions
P2: Priority two: possible conditions
Water harvesting Techniques Index
WH techniqueIndividual
suitability
Group
suitability
Contour ridgesCRA
Semi circular bundSCBB
Small basins SBC
Runoff stripsRSD
Inter row system IRSE
Contour bench terracesCBTF
GradoniGG
Meskat trapezoidal bunds (cultivated area) MTBH
Meskat catchment area MCAI
Water spreadingW WSJ
JessourJK
Water spreading (diversion)Di DivL
Large bundsLBM
Hillside runoff systems (cultivated)HRCTN
Catchment ( hillside catchment )HcatO
Tanks & Hafirs THP
cisternsCSQ
Table 3:INDEX FOR WATER HARVESTING TECHNIQUES
UTILITY OF THE SUITABILITY RESULTS

Farm size as selection criterion
Suitability map overlaid with classified farming
units (according to the size of the land parcel).
Note: many options (especially those demanding
large farm size, Macro-Catchments systems) could
be dropped from the list.
cadastral map for Mhareb watershed.
Source: Department of Land and
Surveying (DLS)
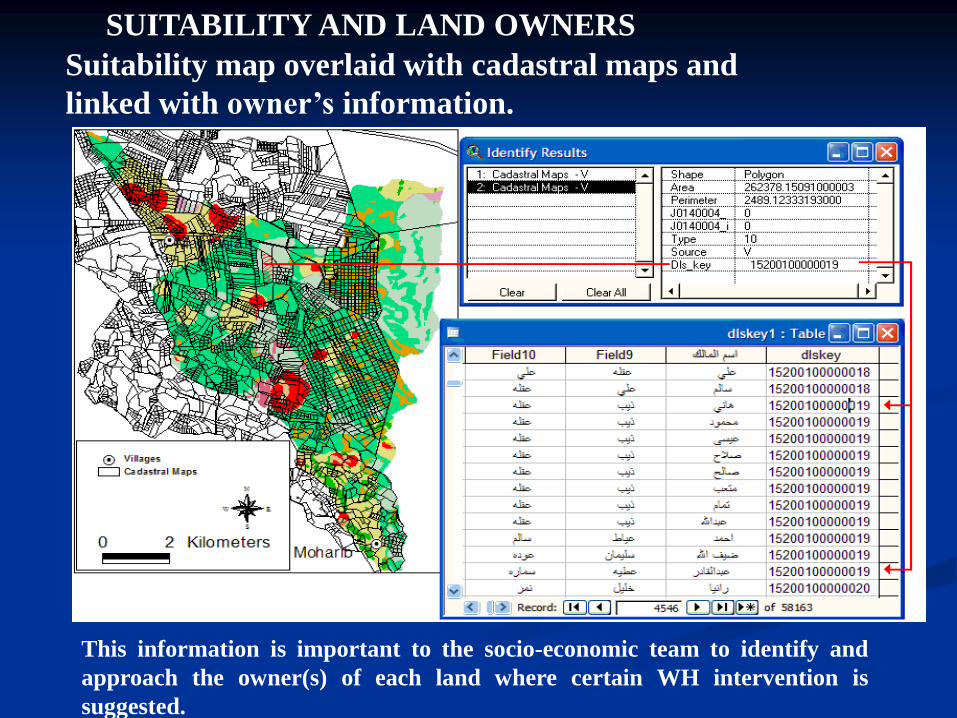
SUITABILITY AND LAND OWNERS
This information is important to the socio-economic team to identify and
approach the owner(s) of each land where certain WH intervention is
suggested.
Suitability map overlaid with cadastral maps and
linked with owner’s information.
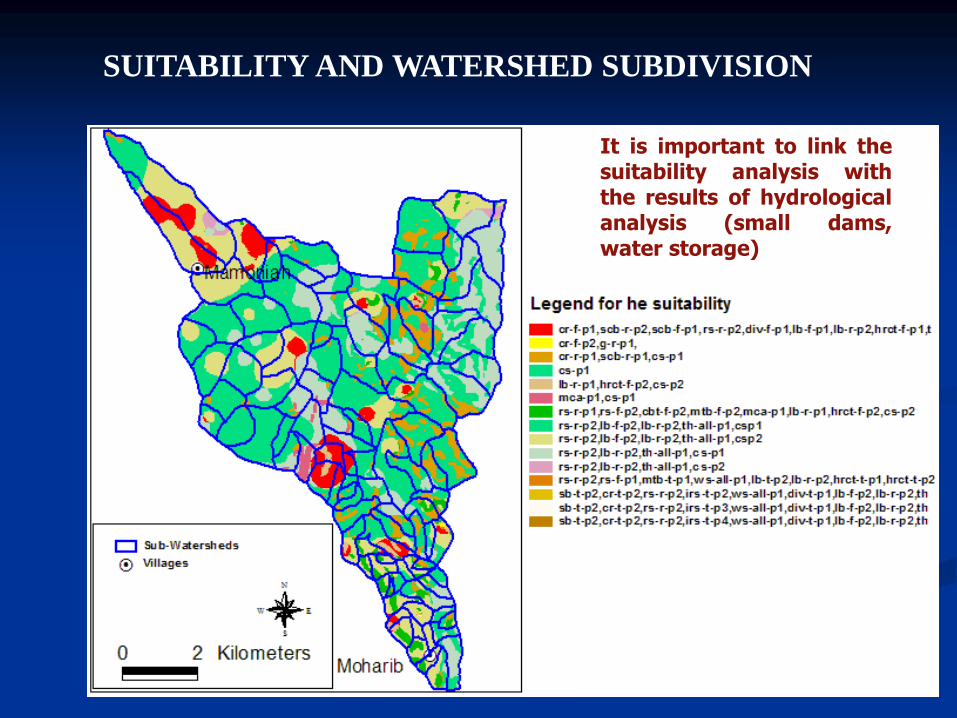
SUITABILITY AND WATERSHED SUBDIVISION
It is important to link thesuitability analysis withthe results of hydrologicalanalysis (small dams,water storage)
Outputs:
1. Improvement of skills and qualifications of the nationalteam in the application of the methodology of siteselection and watershed characterization -using GIS.
2. Methodology has been developed for the identification ofpotential sites and suitable techniques for waterharvesting using remote sensing, GIS and ground data.
3. Establishment of database for the project in the Badiaregion.
A GIS-based Approach for Assessing Water Harvesting Suitability in a
Badia Benchmark Watershed in Jordan. Feras M. Ziadat1, Safa S.
Mazahreh2, Theib Y. Oweis3, Adriana Bruggeman.
Selection and characterization of Badia Watershed Research Sites. Water
Benchmarks of CWANA PROJECT. ICARDA.F. Ziadat, T. Oeis, S.
Mazahreh, A. Bruggeman, N. Haddad, E. Karablieh, B. Benli, M. Abu Zanat,
J. Al Bakri, and A. Ali, 2006.
Publications:

Production of training manual:
Training Manual Application of GIS and land suitability analysis to
identify the potential for rainwater harvesting in the arid region of Jordan (Al-Badia)
An integrated biophysical and socio-economic approach
Safa Mazahreh, Lubna Al Mahasneh, Feras Ziadat

Thank you for attention