Embed Size (px)
Citation preview
Copyright 2006 John Wiley & Sons, Inc.Copyright 2006 John Wiley & Sons, Inc.Beni AsllaniBeni Asllani
University of Tennessee at ChattanoogaUniversity of Tennessee at Chattanooga
Statistical Process ControlStatistical Process Control
Operations Management - 5th EditionOperations Management - 5th Edition
Chapter 4Chapter 4
Roberta Russell & Bernard W. Taylor, IIIRoberta Russell & Bernard W. Taylor, III
Copyright 2006 John Wiley & Sons, Inc.Copyright 2006 John Wiley & Sons, Inc. 4-4-22
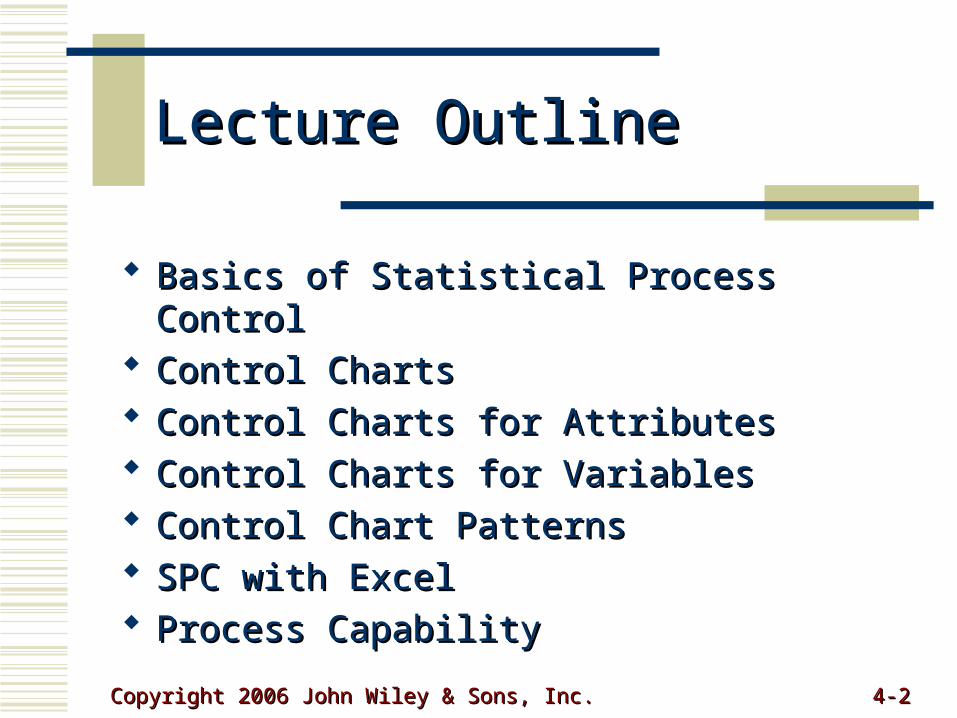
Lecture OutlineLecture Outline
Basics of Statistical Process ControlBasics of Statistical Process Control Control ChartsControl Charts Control Charts for AttributesControl Charts for Attributes Control Charts for VariablesControl Charts for Variables Control Chart PatternsControl Chart Patterns SPC with ExcelSPC with Excel Process CapabilityProcess Capability
Copyright 2006 John Wiley & Sons, Inc.Copyright 2006 John Wiley & Sons, Inc. 4-4-33
Basics of Statistical Basics of Statistical Process ControlProcess Control
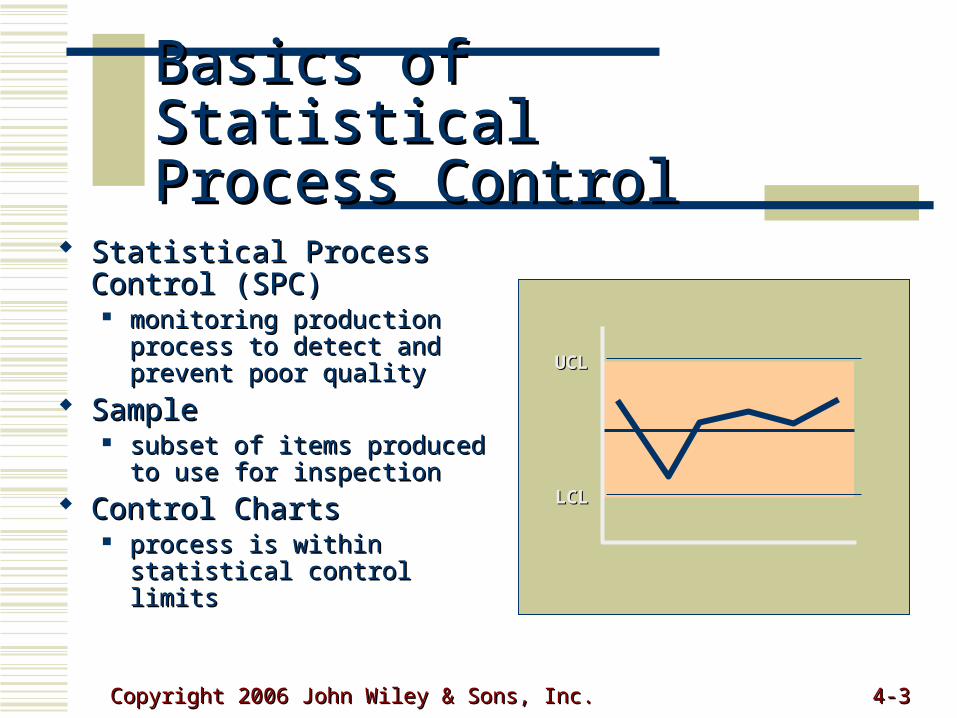
Statistical Process Control Statistical Process Control (SPC)(SPC) monitoring production process monitoring production process
to detect and prevent poor to detect and prevent poor qualityquality
SampleSample subset of items produced to subset of items produced to
use for inspectionuse for inspection Control ChartsControl Charts
process is within statistical process is within statistical control limitscontrol limits
UCLUCL
LCLLCL
Copyright 2006 John Wiley & Sons, Inc.Copyright 2006 John Wiley & Sons, Inc. 4-4-44
VariabilityVariability
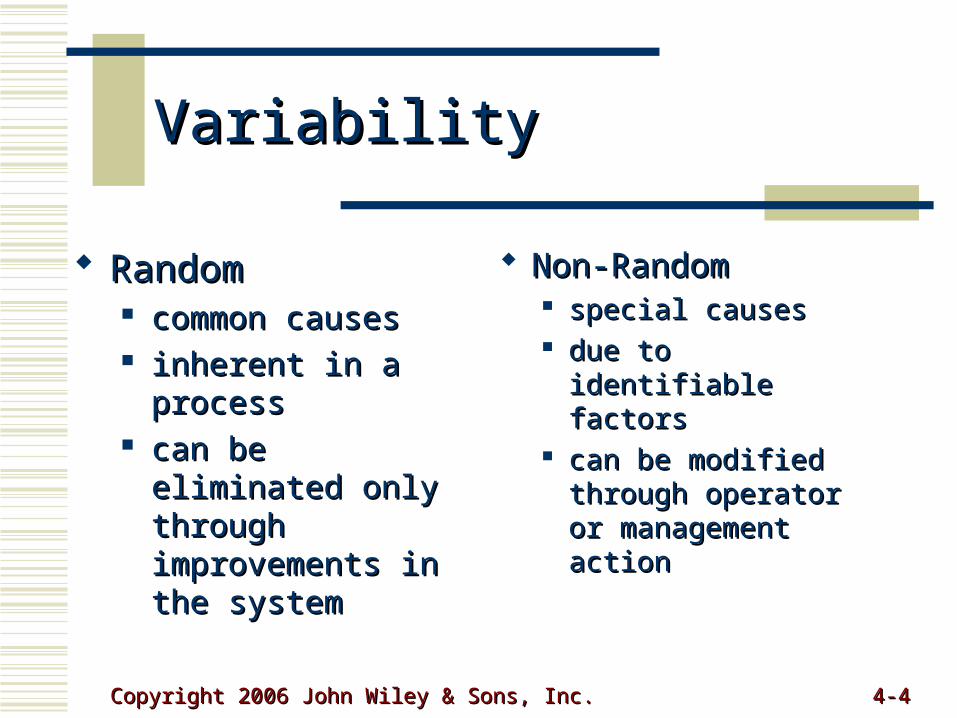
RandomRandom common causescommon causes inherent in a processinherent in a process can be eliminated can be eliminated
only through only through improvements in the improvements in the systemsystem
Non-RandomNon-Random special causesspecial causes due to identifiable due to identifiable
factorsfactors can be modified can be modified
through operator or through operator or management actionmanagement action
Copyright 2006 John Wiley & Sons, Inc.Copyright 2006 John Wiley & Sons, Inc. 4-4-55
SPC in TQMSPC in TQM
SPCSPC tool for identifying problems and tool for identifying problems and
make improvementsmake improvements contributes to the TQM goal of contributes to the TQM goal of
continuous improvementscontinuous improvements
Copyright 2006 John Wiley & Sons, Inc.Copyright 2006 John Wiley & Sons, Inc. 4-4-66
Quality MeasuresQuality Measures
AttributeAttribute a product characteristic that can be a product characteristic that can be
evaluated with a discrete responseevaluated with a discrete response good – bad; yes - nogood – bad; yes - no
VariableVariable a product characteristic that is continuous a product characteristic that is continuous
and can be measuredand can be measured weight - lengthweight - length
Copyright 2006 John Wiley & Sons, Inc.Copyright 2006 John Wiley & Sons, Inc. 4-4-77
Nature of defect is different in servicesNature of defect is different in services Service defect is a failure to meet Service defect is a failure to meet
customer requirementscustomer requirements Monitor times, customer satisfactionMonitor times, customer satisfaction
Applying SPC to Applying SPC to ServiceService
Copyright 2006 John Wiley & Sons, Inc.Copyright 2006 John Wiley & Sons, Inc. 4-4-88
Applying SPC to Applying SPC to Service (cont.)Service (cont.)
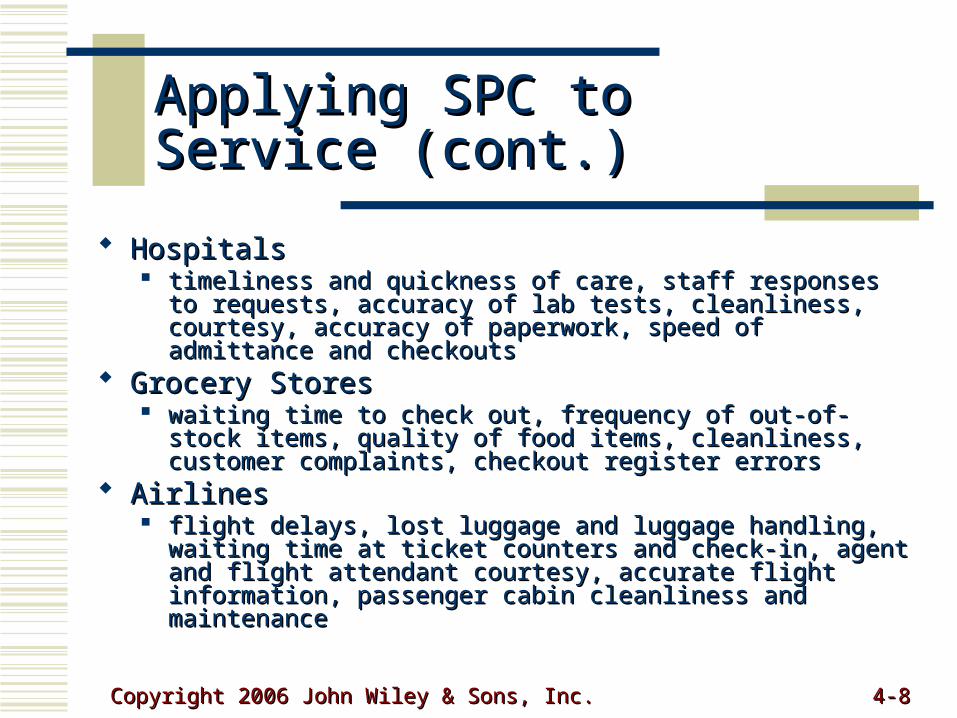
HospitalsHospitals timeliness and quickness of care, staff responses to requests, timeliness and quickness of care, staff responses to requests,
accuracy of lab tests, cleanliness, courtesy, accuracy of accuracy of lab tests, cleanliness, courtesy, accuracy of paperwork, speed of admittance and checkoutspaperwork, speed of admittance and checkouts
Grocery StoresGrocery Stores waiting time to check out, frequency of out-of-stock items, waiting time to check out, frequency of out-of-stock items,
quality of food items, cleanliness, customer complaints, quality of food items, cleanliness, customer complaints, checkout register errorscheckout register errors
AirlinesAirlines flight delays, lost luggage and luggage handling, waiting time flight delays, lost luggage and luggage handling, waiting time
at ticket counters and check-in, agent and flight attendant at ticket counters and check-in, agent and flight attendant courtesy, accurate flight information, passenger cabin courtesy, accurate flight information, passenger cabin cleanliness and maintenancecleanliness and maintenance
Copyright 2006 John Wiley & Sons, Inc.Copyright 2006 John Wiley & Sons, Inc. 4-4-99
Applying SPC to Applying SPC to Service (cont.)Service (cont.)
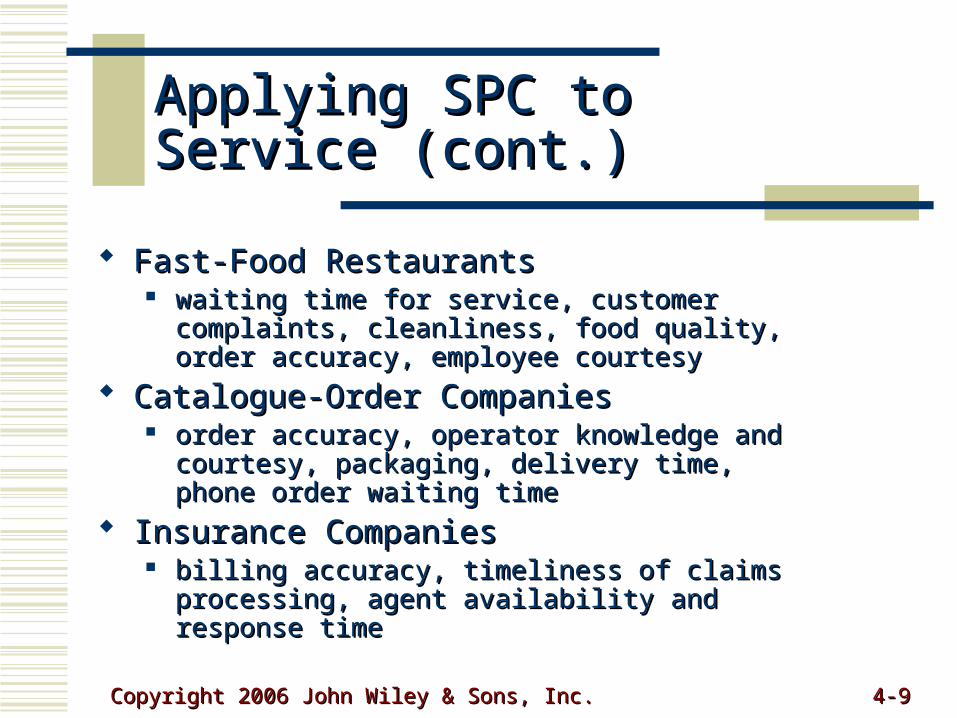
Fast-Food RestaurantsFast-Food Restaurants waiting time for service, customer complaints, waiting time for service, customer complaints,
cleanliness, food quality, order accuracy, employee cleanliness, food quality, order accuracy, employee courtesycourtesy
Catalogue-Order CompaniesCatalogue-Order Companies order accuracy, operator knowledge and courtesy, order accuracy, operator knowledge and courtesy,
packaging, delivery time, phone order waiting timepackaging, delivery time, phone order waiting time Insurance CompaniesInsurance Companies
billing accuracy, timeliness of claims processing, billing accuracy, timeliness of claims processing, agent availability and response timeagent availability and response time
Copyright 2006 John Wiley & Sons, Inc.Copyright 2006 John Wiley & Sons, Inc. 4-4-1010
Where to Use Control ChartsWhere to Use Control Charts
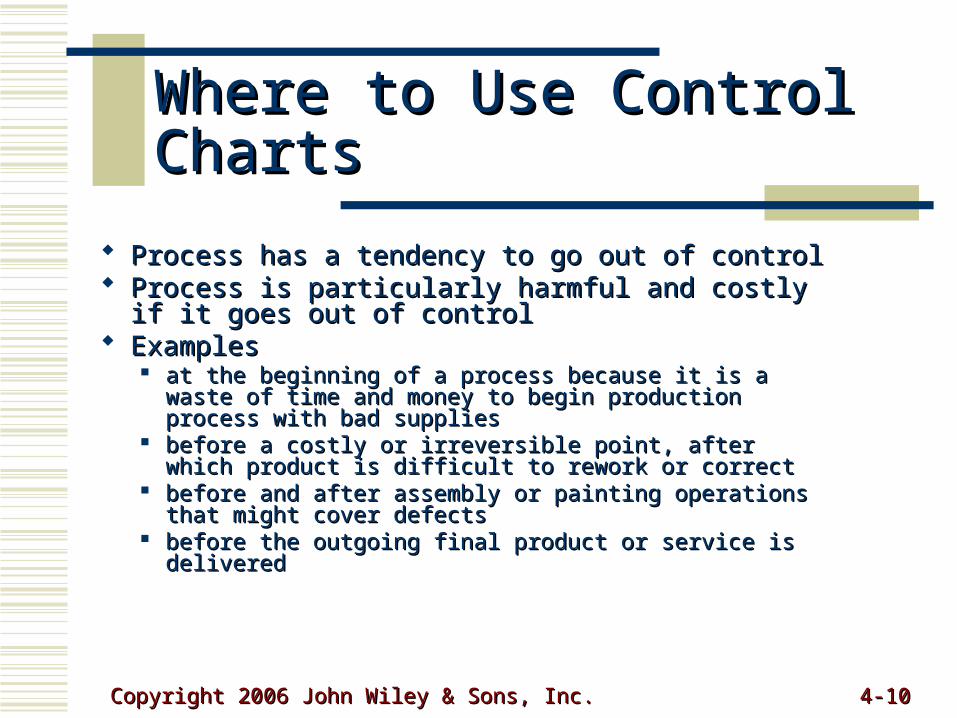
Process has a tendency to go out of controlProcess has a tendency to go out of control Process is particularly harmful and costly if it Process is particularly harmful and costly if it
goes out of controlgoes out of control ExamplesExamples
at the beginning of a process because it is a waste of at the beginning of a process because it is a waste of time and money to begin production process with bad time and money to begin production process with bad suppliessupplies
before a costly or irreversible point, after which product before a costly or irreversible point, after which product is difficult to rework or correctis difficult to rework or correct
before and after assembly or painting operations that before and after assembly or painting operations that might cover defectsmight cover defects
before the outgoing final product or service is deliveredbefore the outgoing final product or service is delivered
Copyright 2006 John Wiley & Sons, Inc.Copyright 2006 John Wiley & Sons, Inc. 4-4-1111
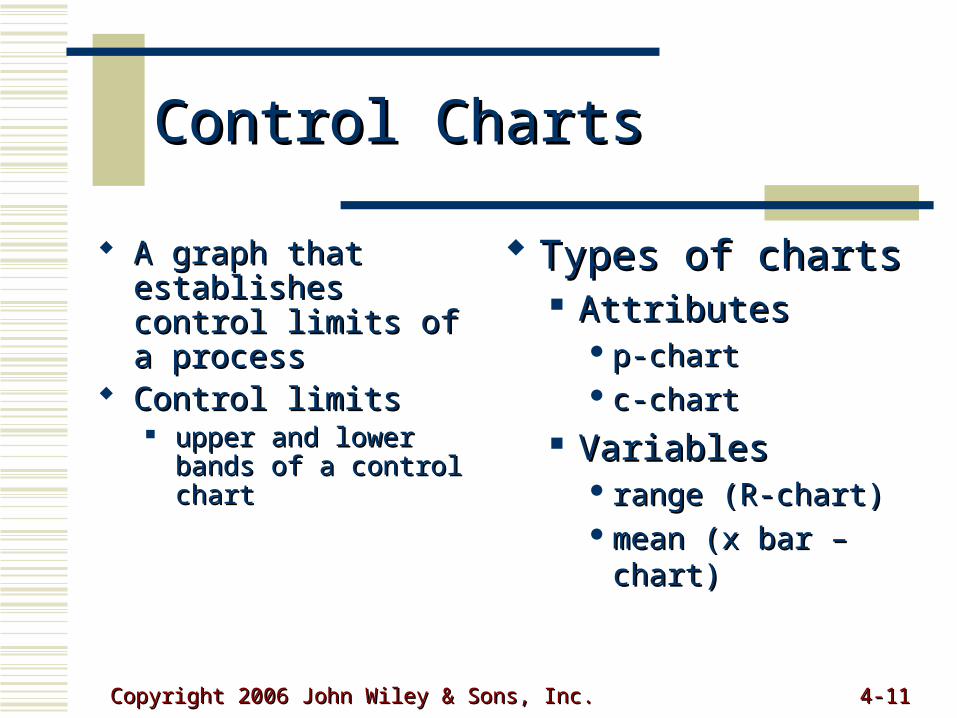
Control ChartsControl Charts
A graph that establishes A graph that establishes control limits of a control limits of a processprocess
Control limitsControl limits upper and lower bands of upper and lower bands of
a control charta control chart
Types of chartsTypes of charts AttributesAttributes
p-chartp-chart c-chartc-chart
VariablesVariables range (R-chart)range (R-chart) mean (x bar – chart)mean (x bar – chart)
Copyright 2006 John Wiley & Sons, Inc.Copyright 2006 John Wiley & Sons, Inc. 4-4-1212
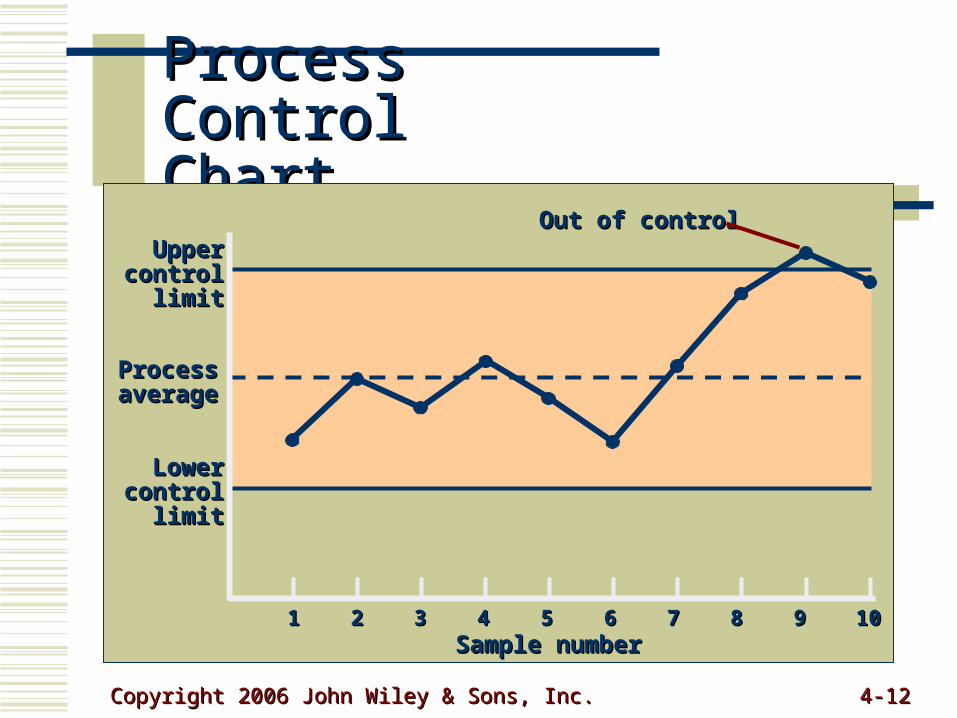
Process Control Process Control ChartChart
11 22 33 44 55 66 77 88 99 1010Sample numberSample number
UpperUppercontrolcontrol
limitlimit
ProcessProcessaverageaverage
LowerLowercontrolcontrol
limitlimit
Out of controlOut of control
Copyright 2006 John Wiley & Sons, Inc.Copyright 2006 John Wiley & Sons, Inc. 4-4-1313
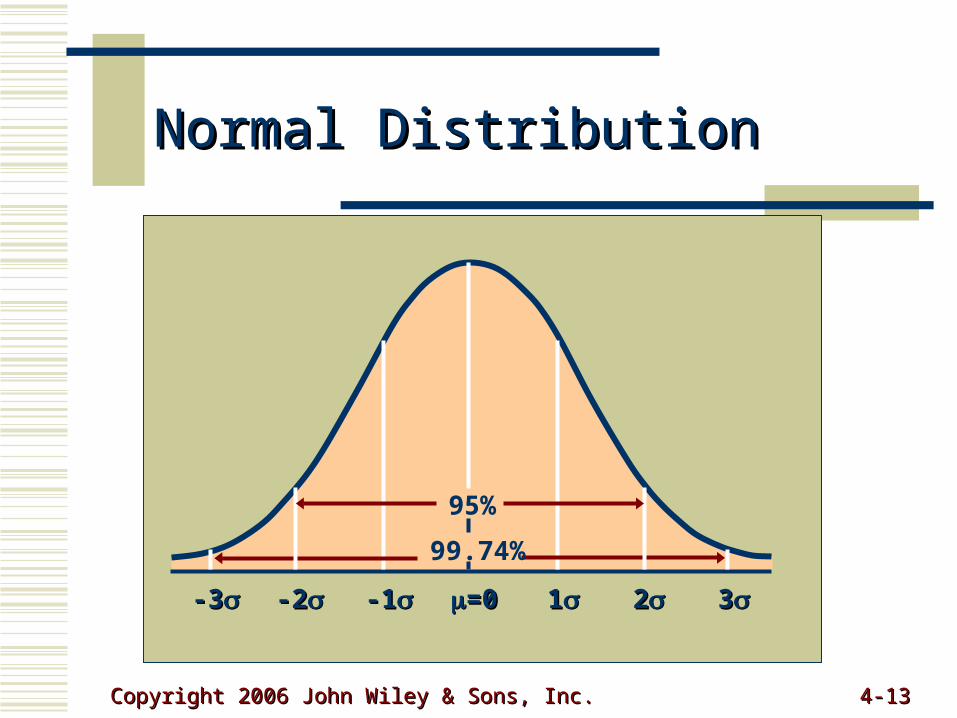
Normal DistributionNormal Distribution
=0=0 11 22 33-1-1-2-2-3-3
95%
99.74%
Copyright 2006 John Wiley & Sons, Inc.Copyright 2006 John Wiley & Sons, Inc. 4-4-1414
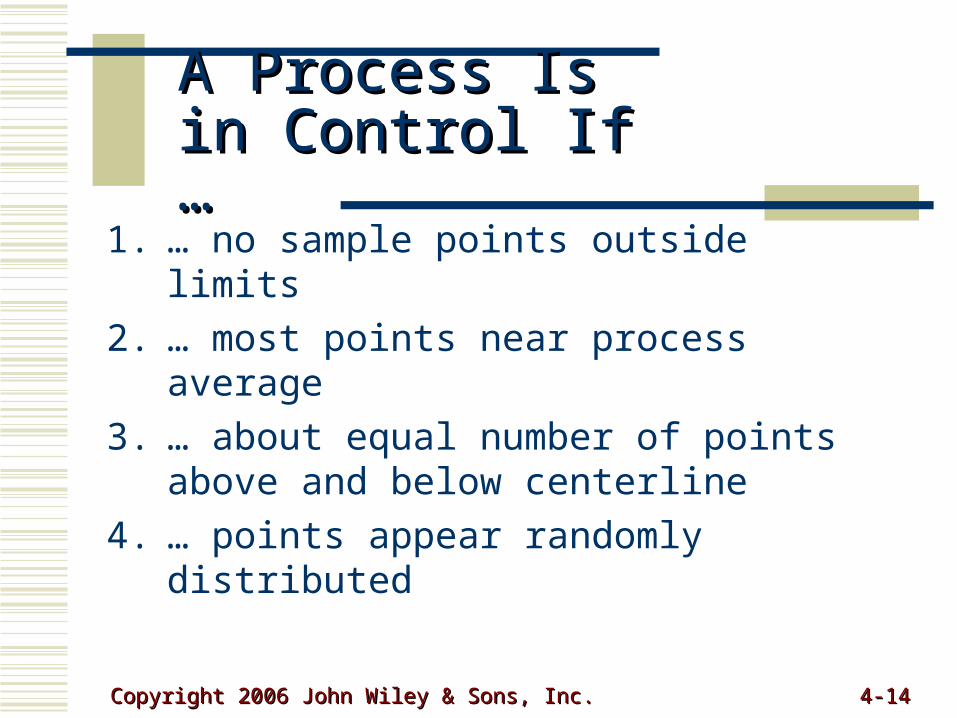
A Process Is in A Process Is in Control If …Control If …
1. … no sample points outside limits
2. … most points near process average
3. … about equal number of points above and below centerline
4. … points appear randomly distributed
Copyright 2006 John Wiley & Sons, Inc.Copyright 2006 John Wiley & Sons, Inc. 4-4-1515
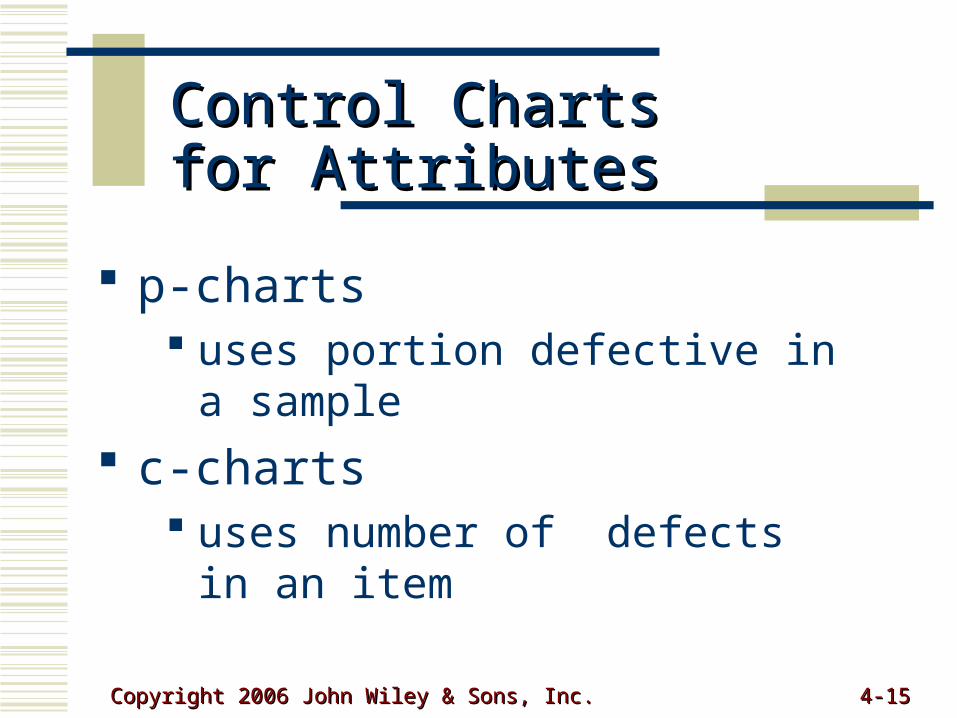
Control Charts for Control Charts for AttributesAttributes
p-charts uses portion defective in a sample
c-charts uses number of defects in an item
Copyright 2006 John Wiley & Sons, Inc.Copyright 2006 John Wiley & Sons, Inc. 4-4-1616
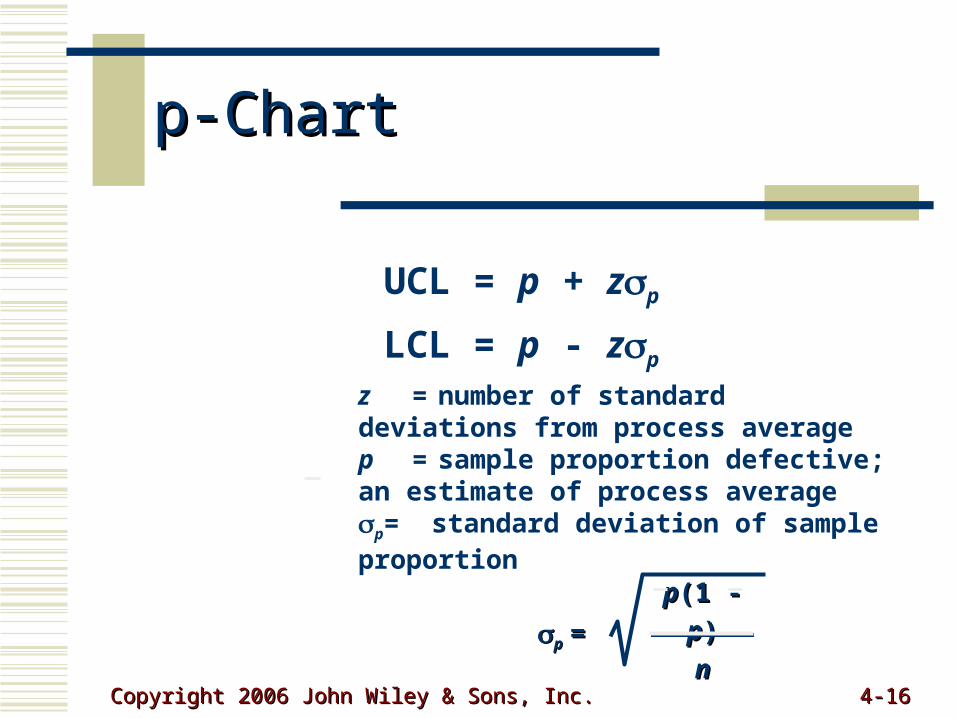
p-Chartp-Chart
UCL = p + zp
LCL = p - zp
z = number of standard deviations from process averagep = sample proportion defective; an estimate of process averagep= standard deviation of sample proportion
pp = = pp(1 - (1 - pp))
nn
Copyright 2006 John Wiley & Sons, Inc.Copyright 2006 John Wiley & Sons, Inc. 4-4-1717
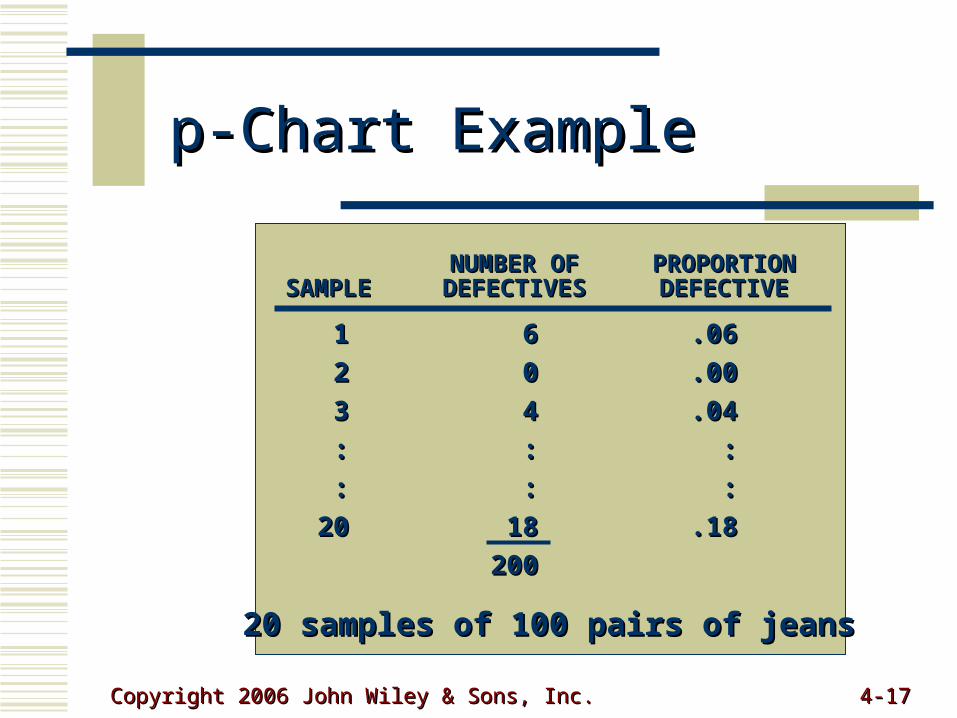
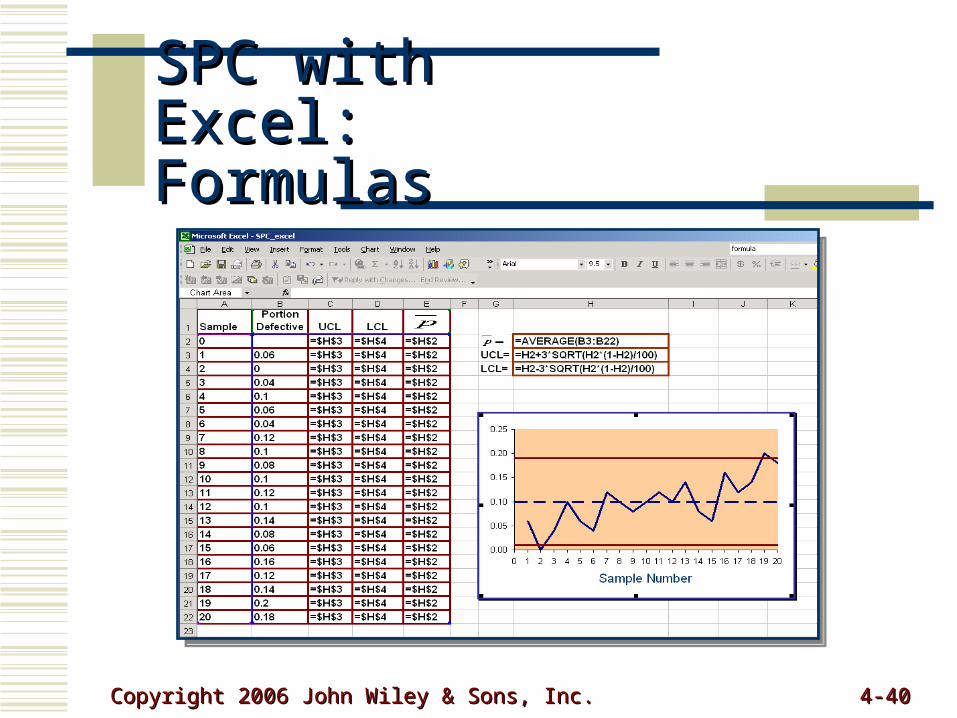
p-Chart Examplep-Chart Example
20 samples of 100 pairs of jeans20 samples of 100 pairs of jeans
NUMBER OFNUMBER OF PROPORTIONPROPORTIONSAMPLESAMPLE DEFECTIVESDEFECTIVES DEFECTIVEDEFECTIVE
11 66 .06.06
22 00 .00.00
33 44 .04.04
:: :: ::
:: :: ::
2020 1818 .18.18
200200
Copyright 2006 John Wiley & Sons, Inc.Copyright 2006 John Wiley & Sons, Inc. 4-4-1818
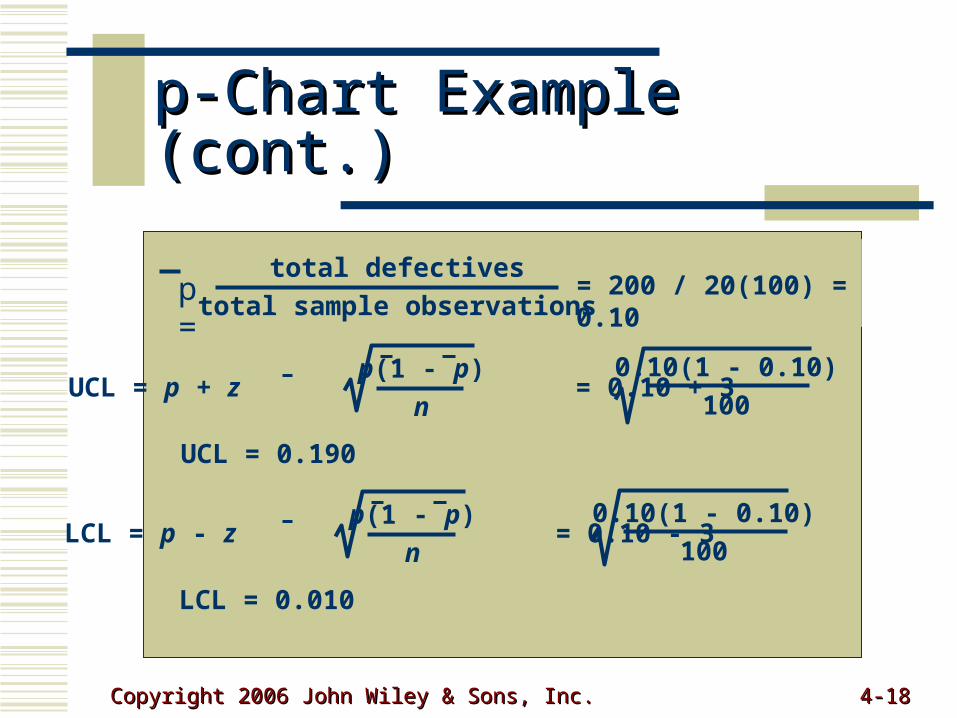
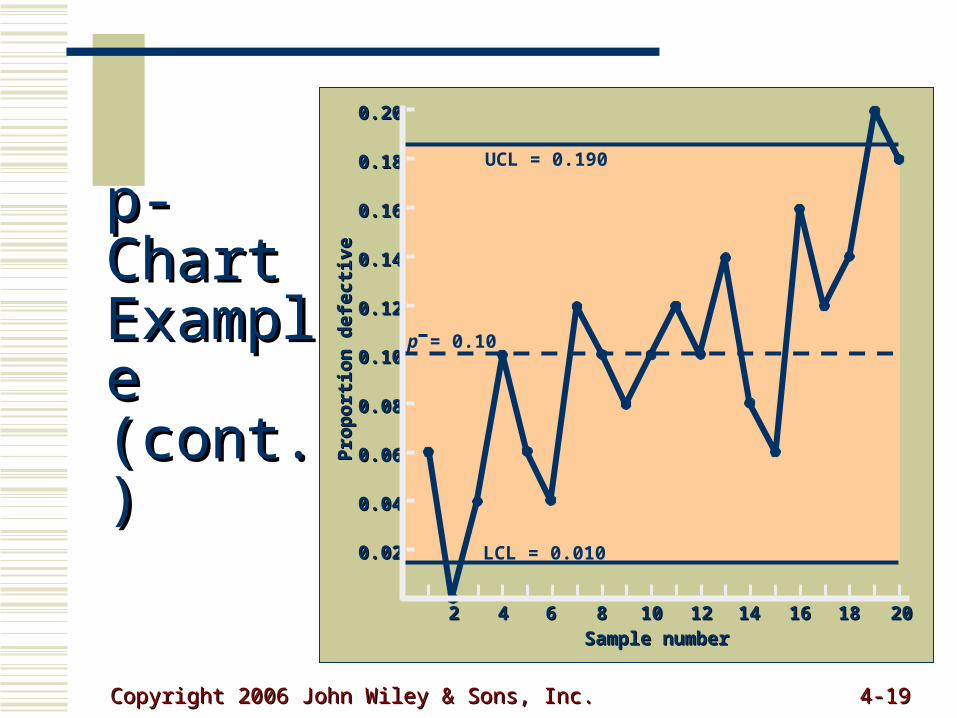
p-Chart Example (cont.)p-Chart Example (cont.)
UCL = p + z = 0.10 + 3p(1 - p)
n
0.10(1 - 0.10)
100
UCL = 0.190
LCL = 0.010
LCL = p - z = 0.10 - 3p(1 - p)
n
0.10(1 - 0.10)
100
= 200 / 20(100) = 0.10total defectives
total sample observationsp =
Copyright 2006 John Wiley & Sons, Inc.Copyright 2006 John Wiley & Sons, Inc. 4-4-1919
0.020.02
0.040.04
0.060.06
0.080.08
0.100.10
0.120.12
0.140.14
0.160.16
0.180.18
0.200.20
Pro
po
rtio
n d
efec
tive
Pro
po
rtio
n d
efec
tive
Sample numberSample number22 44 66 88 1010 1212 1414 1616 1818 2020
UCL = 0.190
LCL = 0.010
p = 0.10
p-Chart p-Chart Example Example (cont.)(cont.)
Copyright 2006 John Wiley & Sons, Inc.Copyright 2006 John Wiley & Sons, Inc. 4-4-2020
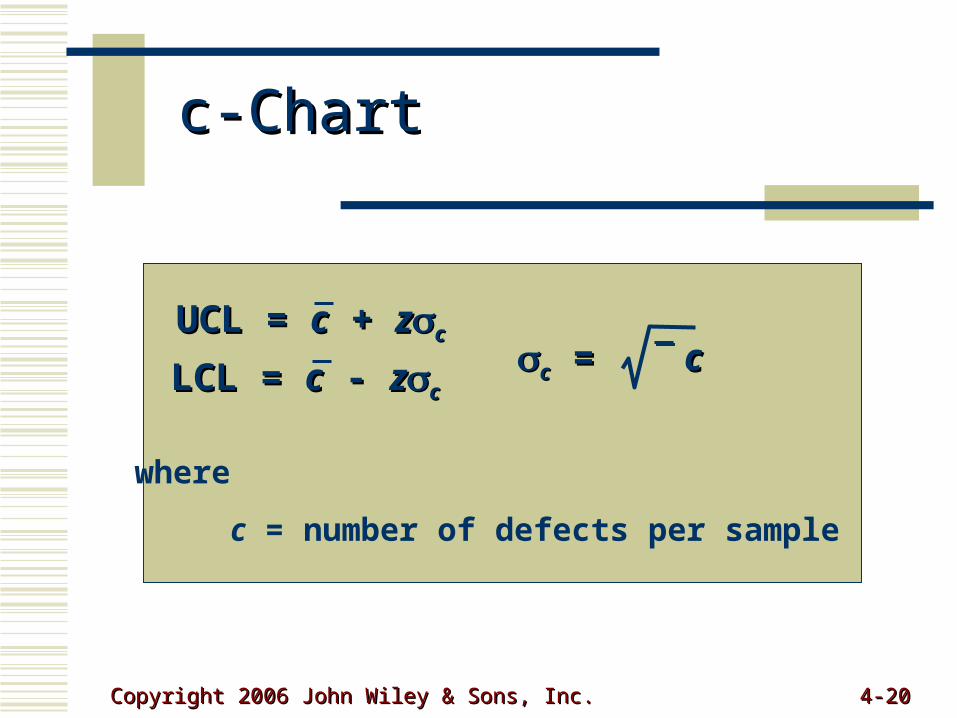
c-Chartc-Chart
UCL = UCL = cc + + zzcc
LCL = LCL = cc - - zzcc
where
c = number of defects per sample
cc = = cc
Copyright 2006 John Wiley & Sons, Inc.Copyright 2006 John Wiley & Sons, Inc. 4-4-2121
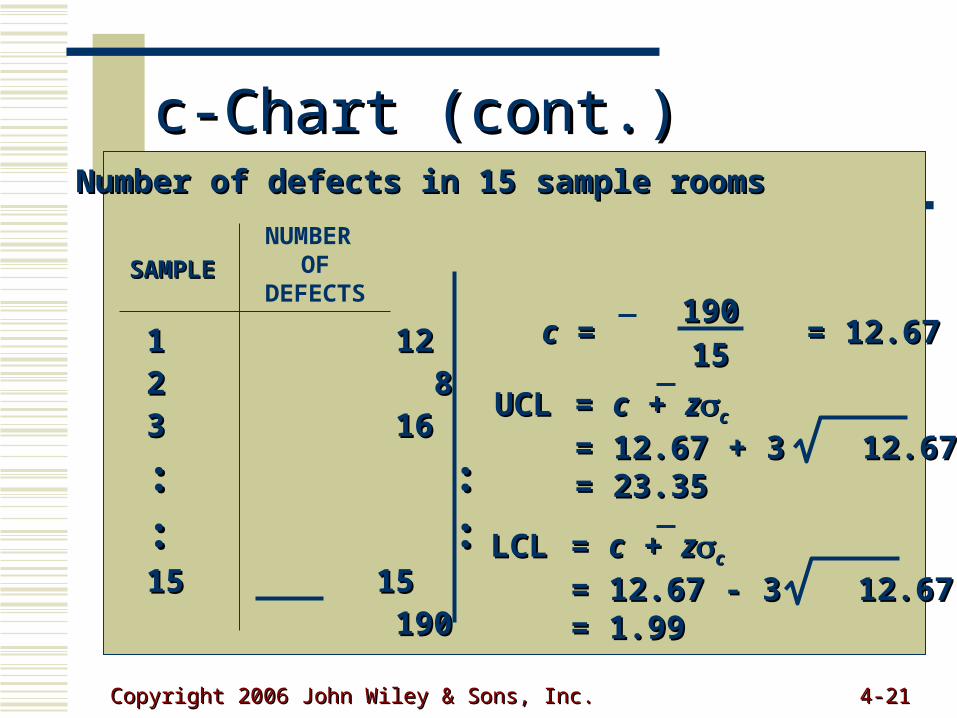
c-Chart (cont.)c-Chart (cont.)Number of defects in 15 sample roomsNumber of defects in 15 sample rooms
1 121 122 82 83 163 16
: :: :: :: :15 1515 15 190190
SAMPLESAMPLE
cc = = 12.67 = = 12.67190190
1515
UCLUCL = = cc + + zzcc
= 12.67 + 3 12.67= 12.67 + 3 12.67= 23.35= 23.35
LCLLCL = = cc + + zzcc
= 12.67 - 3 12.67= 12.67 - 3 12.67= 1.99= 1.99
NUMBER OF
DEFECTS
Copyright 2006 John Wiley & Sons, Inc.Copyright 2006 John Wiley & Sons, Inc. 4-4-2222
33
66
99
1212
1515
1818
2121
2424
Nu
mb
er o
f d
efec
tsN
um
ber
of
def
ects
Sample numberSample number
22 44 66 88 1010 1212 1414 1616
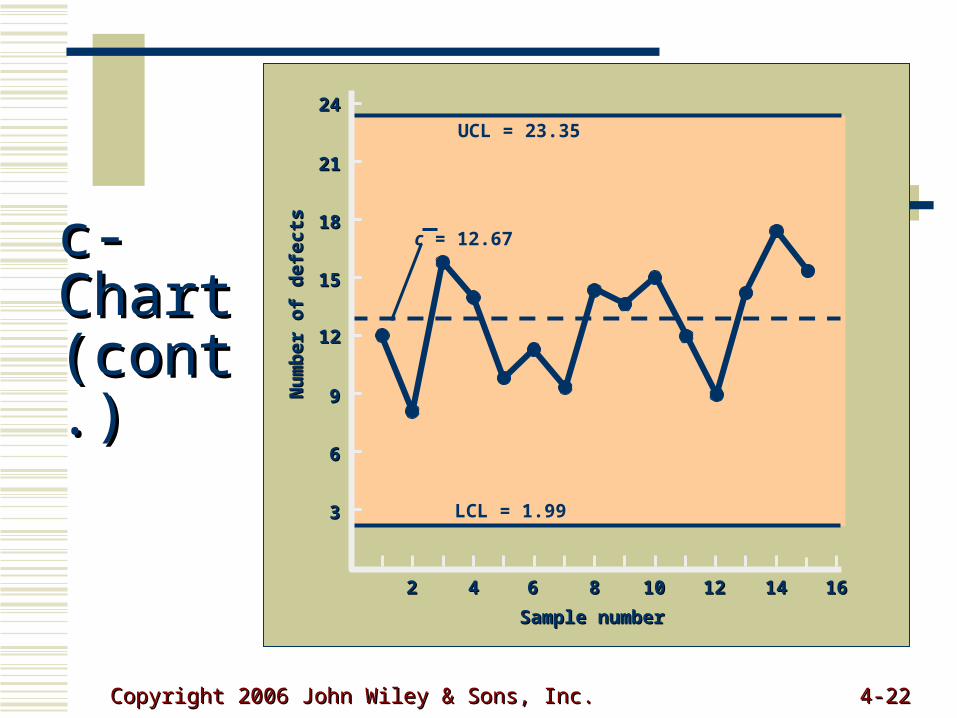
UCL = 23.35
LCL = 1.99
c = 12.67
c-Chart c-Chart (cont.)(cont.)
Copyright 2006 John Wiley & Sons, Inc.Copyright 2006 John Wiley & Sons, Inc. 4-4-2323
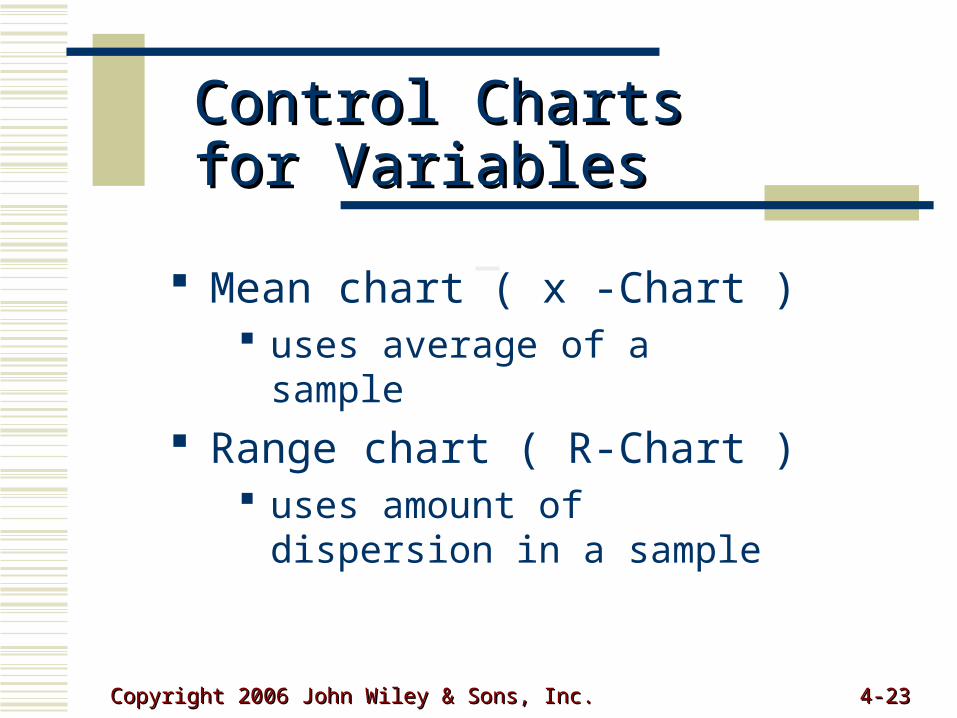
Control Charts for Control Charts for VariablesVariables
Mean chart ( x -Chart ) uses average of a sample
Range chart ( R-Chart ) uses amount of dispersion in a
sample
Copyright 2006 John Wiley & Sons, Inc.Copyright 2006 John Wiley & Sons, Inc. 4-4-2424
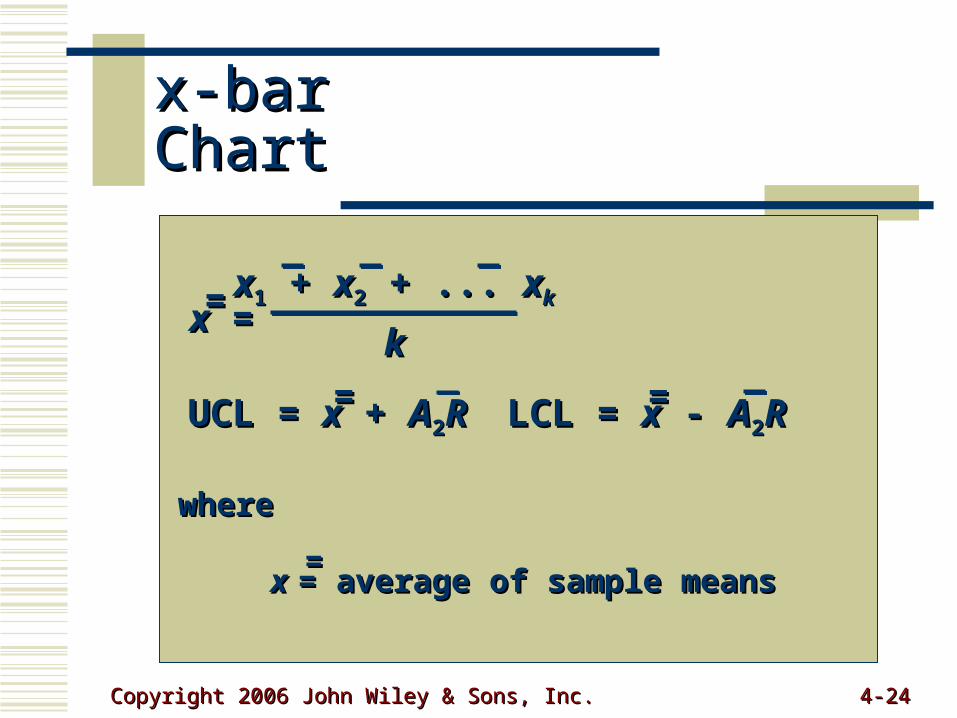
x-bar Chartx-bar Chart
xx = = xx11 + + xx22 + ... + ... xxkk
kk==
UCL = UCL = xx + + AA22RR LCL = LCL = xx - - AA22RR== ==
wherewhere
xx = average of sample means= average of sample means==
Copyright 2006 John Wiley & Sons, Inc.Copyright 2006 John Wiley & Sons, Inc. 4-4-2525
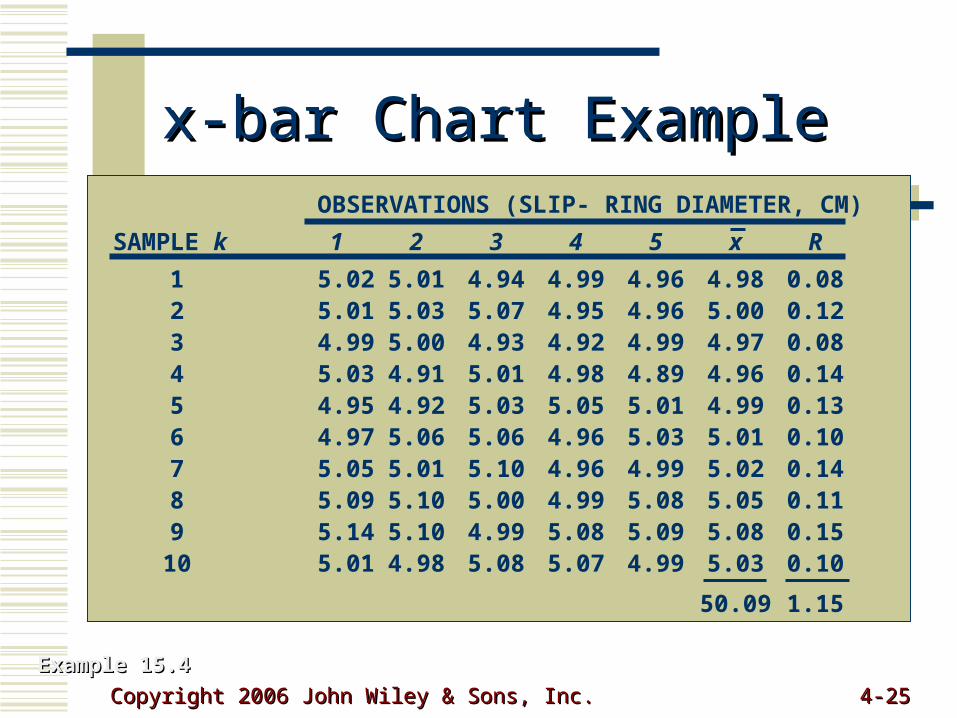
x-bar Chart Examplex-bar Chart Example
Example 15.4Example 15.4
OBSERVATIONS (SLIP- RING DIAMETER, CM)
SAMPLE k 1 2 3 4 5 x R
1 5.02 5.01 4.94 4.99 4.96 4.98 0.082 5.01 5.03 5.07 4.95 4.96 5.00 0.123 4.99 5.00 4.93 4.92 4.99 4.97 0.084 5.03 4.91 5.01 4.98 4.89 4.96 0.145 4.95 4.92 5.03 5.05 5.01 4.99 0.136 4.97 5.06 5.06 4.96 5.03 5.01 0.107 5.05 5.01 5.10 4.96 4.99 5.02 0.148 5.09 5.10 5.00 4.99 5.08 5.05 0.119 5.14 5.10 4.99 5.08 5.09 5.08 0.15
10 5.01 4.98 5.08 5.07 4.99 5.03 0.10
50.09 1.15
Copyright 2006 John Wiley & Sons, Inc.Copyright 2006 John Wiley & Sons, Inc. 4-4-2626
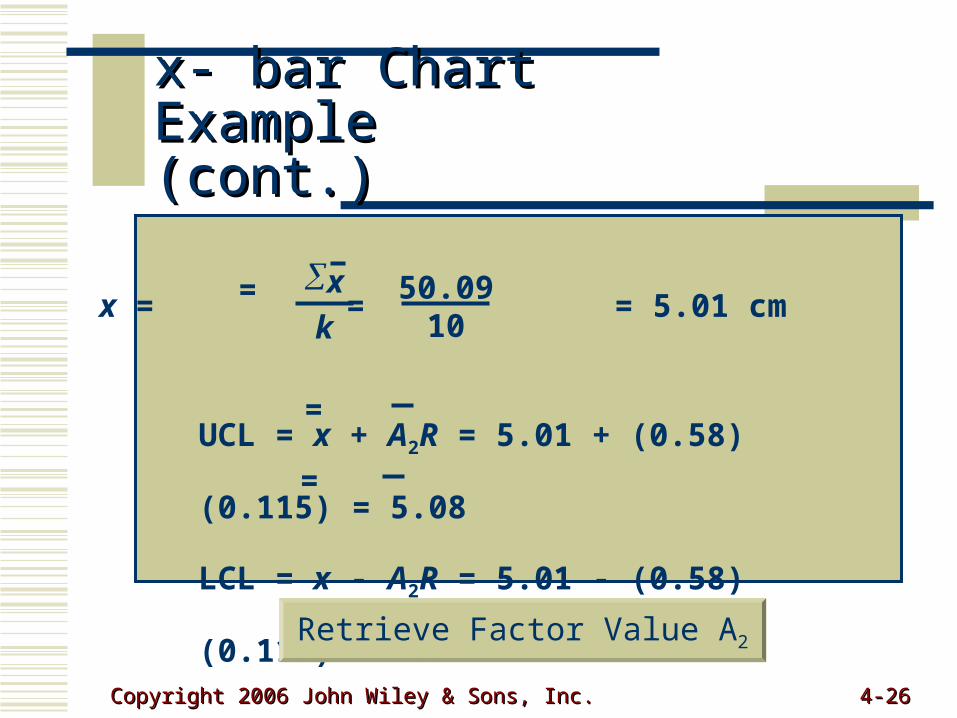
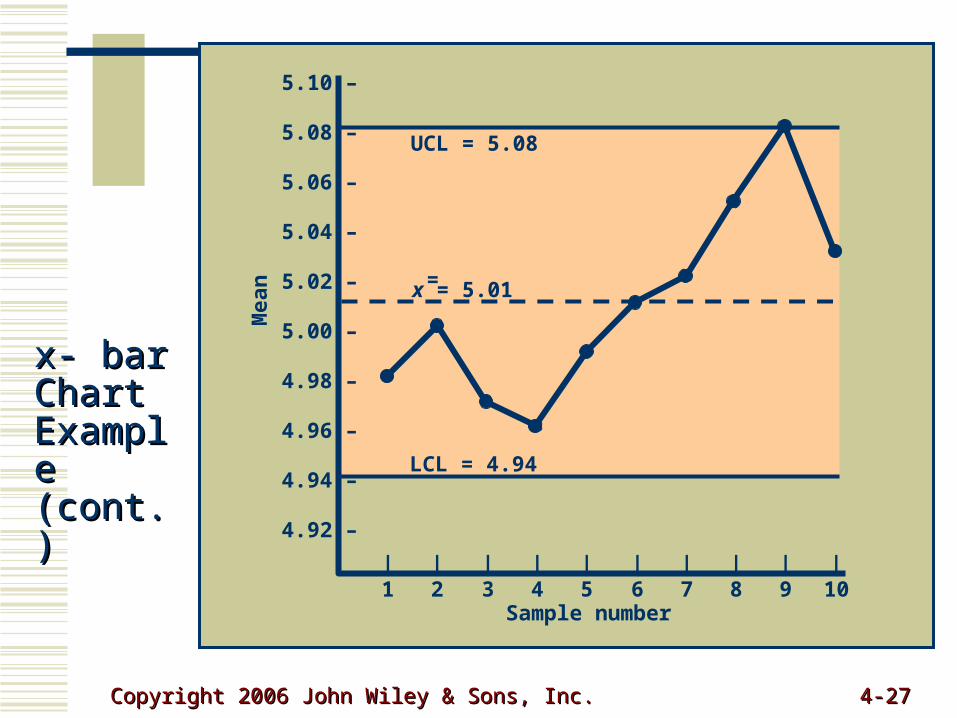
UCL = x + A2R = 5.01 + (0.58)(0.115) = 5.08
LCL = x - A2R = 5.01 - (0.58)(0.115) = 4.94
=
=
x = = = 5.01 cm= x
k50.09
10
x- bar Chart x- bar Chart Example (cont.)Example (cont.)
Retrieve Factor Value A2
Copyright 2006 John Wiley & Sons, Inc.Copyright 2006 John Wiley & Sons, Inc. 4-4-2727
x- bar x- bar Chart Chart Example Example (cont.)(cont.)
UCL = 5.08
LCL = 4.94
Mea
n
Sample number
|1
|2
|3
|4
|5
|6
|7
|8
|9
|10
5.10 –
5.08 –
5.06 –
5.04 –
5.02 –
5.00 –
4.98 –
4.96 –
4.94 –
4.92 –
x = 5.01=
Copyright 2006 John Wiley & Sons, Inc.Copyright 2006 John Wiley & Sons, Inc. 4-4-2828
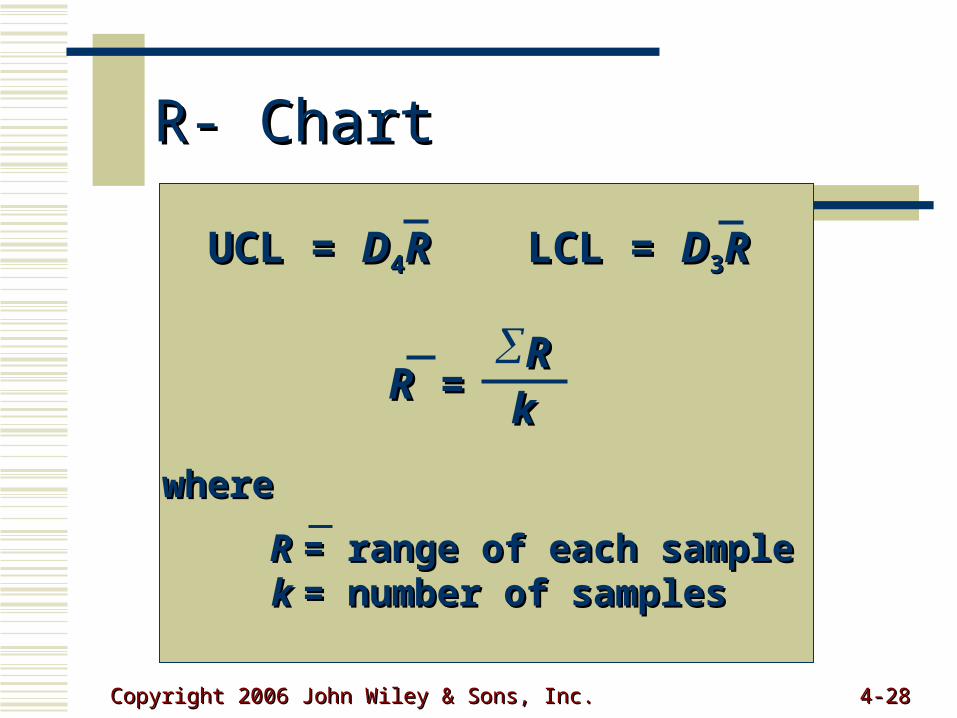
R- ChartR- Chart
UCL = UCL = DD44RR LCL = LCL = DD33RR
RR = = RRkk
wherewhere
RR = range of each sample= range of each samplekk = number of samples= number of samples
Copyright 2006 John Wiley & Sons, Inc.Copyright 2006 John Wiley & Sons, Inc. 4-4-2929
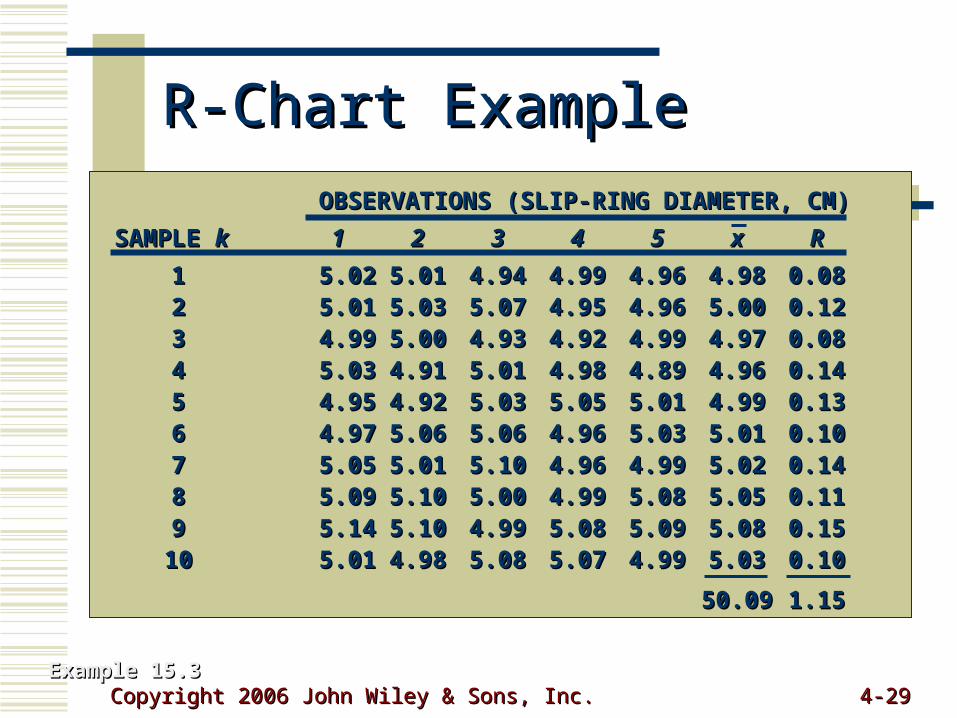
R-Chart ExampleR-Chart Example
OBSERVATIONS (SLIP-RING DIAMETER, CM)OBSERVATIONS (SLIP-RING DIAMETER, CM)
SAMPLE SAMPLE kk 11 22 33 44 55 xx RR
11 5.025.02 5.015.01 4.944.94 4.994.99 4.964.96 4.984.98 0.080.0822 5.015.01 5.035.03 5.075.07 4.954.95 4.964.96 5.005.00 0.120.1233 4.994.99 5.005.00 4.934.93 4.924.92 4.994.99 4.974.97 0.080.0844 5.035.03 4.914.91 5.015.01 4.984.98 4.894.89 4.964.96 0.140.1455 4.954.95 4.924.92 5.035.03 5.055.05 5.015.01 4.994.99 0.130.1366 4.974.97 5.065.06 5.065.06 4.964.96 5.035.03 5.015.01 0.100.1077 5.055.05 5.015.01 5.105.10 4.964.96 4.994.99 5.025.02 0.140.1488 5.095.09 5.105.10 5.005.00 4.994.99 5.085.08 5.055.05 0.110.1199 5.145.14 5.105.10 4.994.99 5.085.08 5.095.09 5.085.08 0.150.15
1010 5.015.01 4.984.98 5.085.08 5.075.07 4.994.99 5.035.03 0.100.10
50.0950.09 1.151.15
Example 15.3Example 15.3
Copyright 2006 John Wiley & Sons, Inc.Copyright 2006 John Wiley & Sons, Inc. 4-4-3030
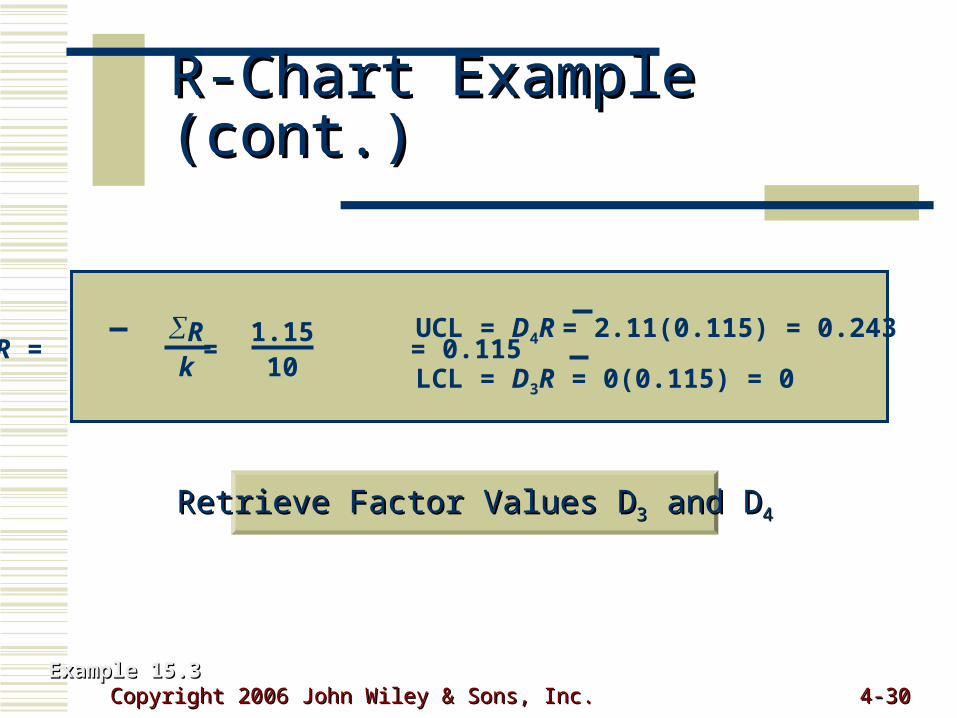
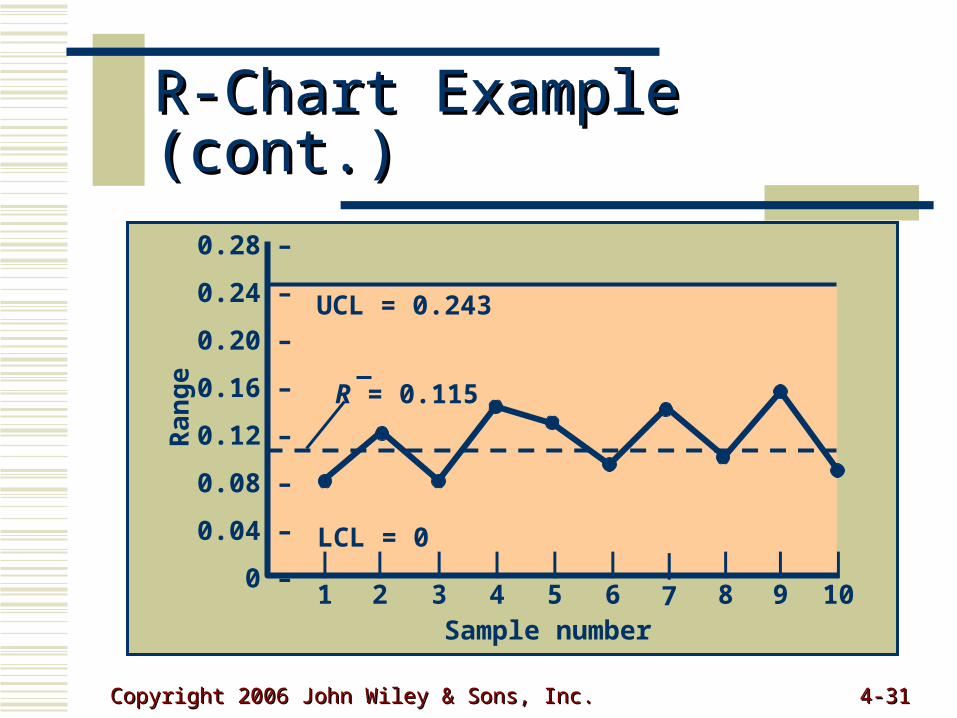
R-Chart Example (cont.)R-Chart Example (cont.)
Example 15.3Example 15.3
Rk
R = = = 0.115 1.1510
UCL = D4R = 2.11(0.115) = 0.243
LCL = D3R = 0(0.115) = 0
Retrieve Factor Values DRetrieve Factor Values D33 and D and D44
Copyright 2006 John Wiley & Sons, Inc.Copyright 2006 John Wiley & Sons, Inc. 4-4-3131
R-Chart Example (cont.)R-Chart Example (cont.)
UCL = 0.243
LCL = 0
Ra
ng
e
Sample number
R = 0.115
|1
|2
|3
|4
|5
|6
|7
|8
|9
|10
0.28 –
0.24 –
0.20 –
0.16 –
0.12 –
0.08 –
0.04 –
0 –
Copyright 2006 John Wiley & Sons, Inc.Copyright 2006 John Wiley & Sons, Inc. 4-4-3232
Using x- bar and R-Charts Using x- bar and R-Charts TogetherTogether
Process average and process variability must be in control.
It is possible for samples to have very narrow ranges, but their averages is beyond control limits.
It is possible for sample averages to be in control, but ranges might be very large.
Copyright 2006 John Wiley & Sons, Inc.Copyright 2006 John Wiley & Sons, Inc. 4-4-3333
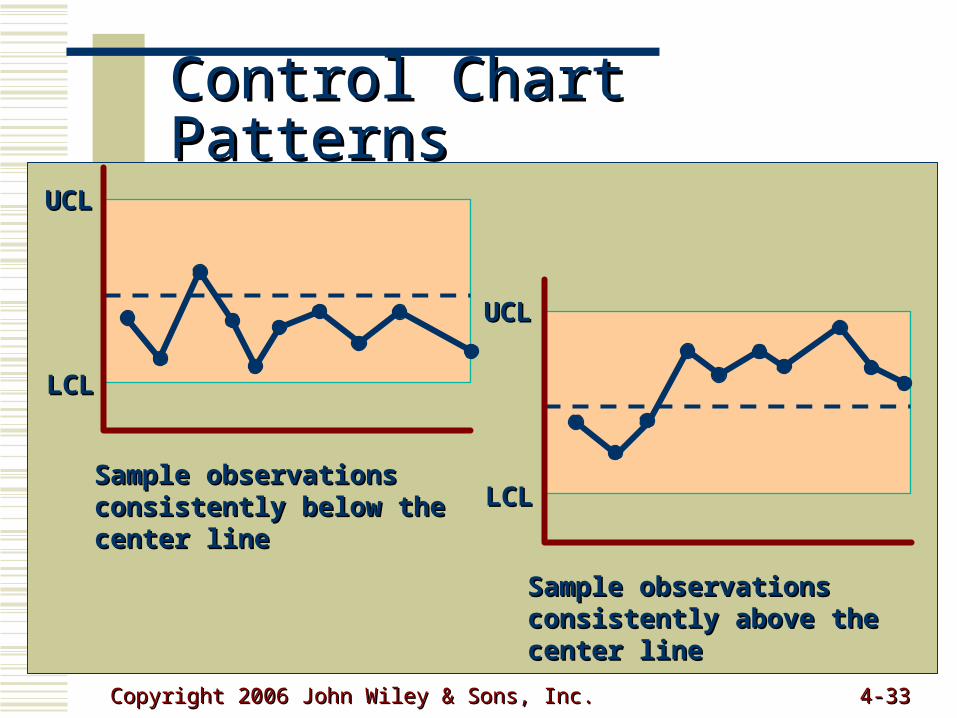
Control Chart PatternsControl Chart Patterns
UCLUCL
LCLLCL
Sample observationsSample observationsconsistently above theconsistently above thecenter linecenter line
LCLLCL
UCLUCL
Sample observationsSample observationsconsistently below theconsistently below thecenter linecenter line
Copyright 2006 John Wiley & Sons, Inc.Copyright 2006 John Wiley & Sons, Inc. 4-4-3434
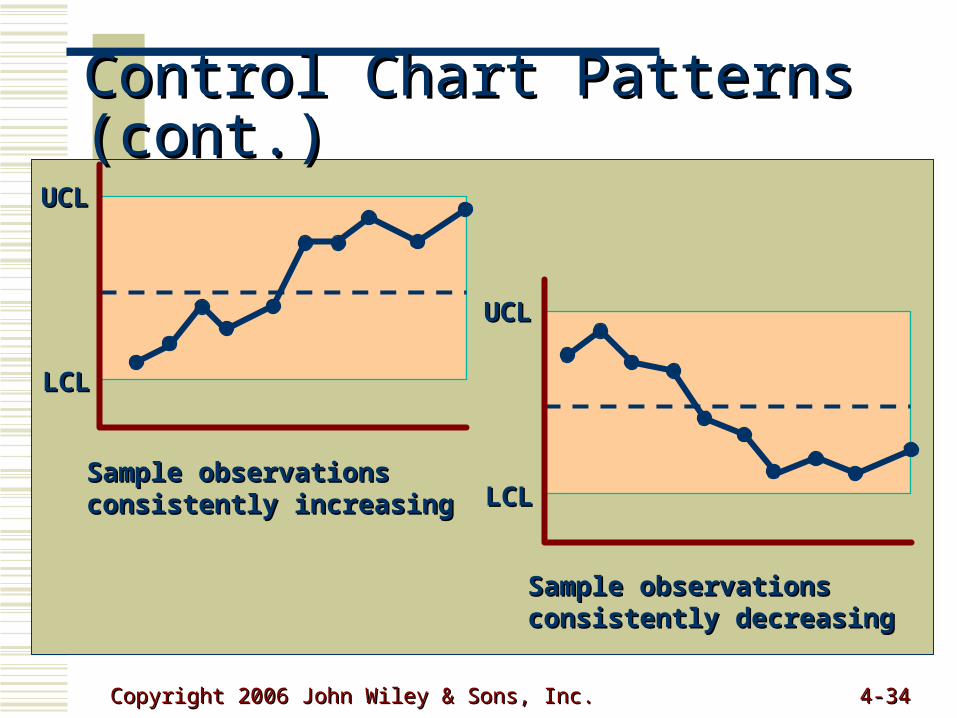
Control Chart Patterns (cont.)Control Chart Patterns (cont.)
LCLLCL
UCLUCL
Sample observationsSample observationsconsistently increasingconsistently increasing
UCLUCL
LCLLCL
Sample observationsSample observationsconsistently decreasingconsistently decreasing
Copyright 2006 John Wiley & Sons, Inc.Copyright 2006 John Wiley & Sons, Inc. 4-4-3535
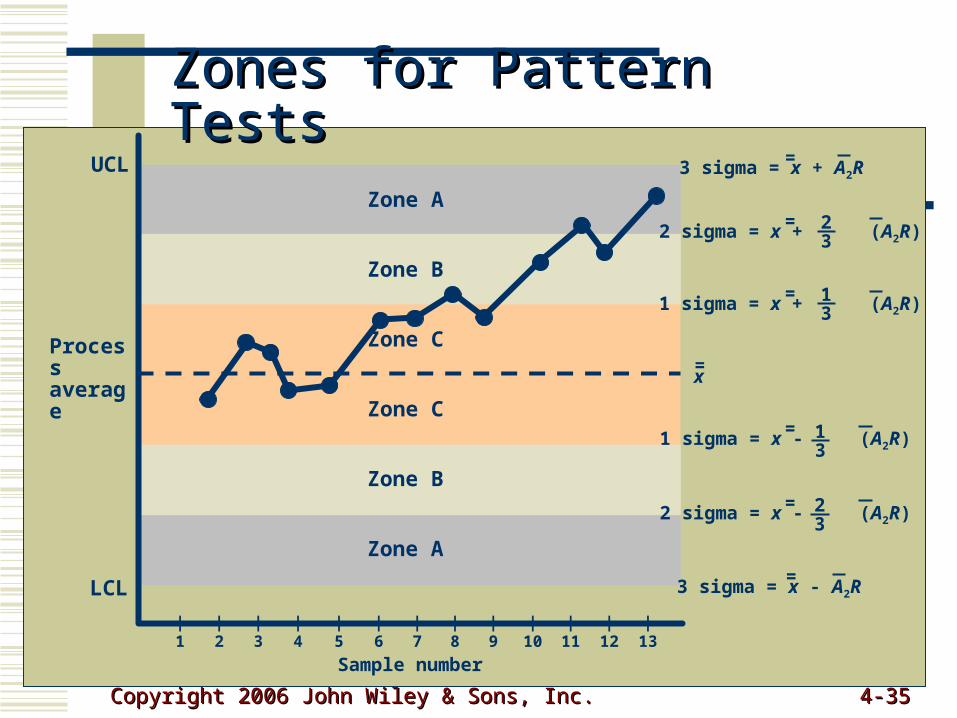
Zones for Pattern TestsZones for Pattern TestsUCL
LCL
Zone A
Zone B
Zone C
Zone C
Zone B
Zone A
Process average
3 sigma = x + A2R=
3 sigma = x - A2R=
2 sigma = x + (A2R)= 23
2 sigma = x - (A2R)= 23
1 sigma = x + (A2R)= 13
1 sigma = x - (A2R)= 13
x=
Sample number
|1
|2
|3
|4
|5
|6
|7
|8
|9
|10
|11
|12
|13
Copyright 2006 John Wiley & Sons, Inc.Copyright 2006 John Wiley & Sons, Inc. 4-4-3636
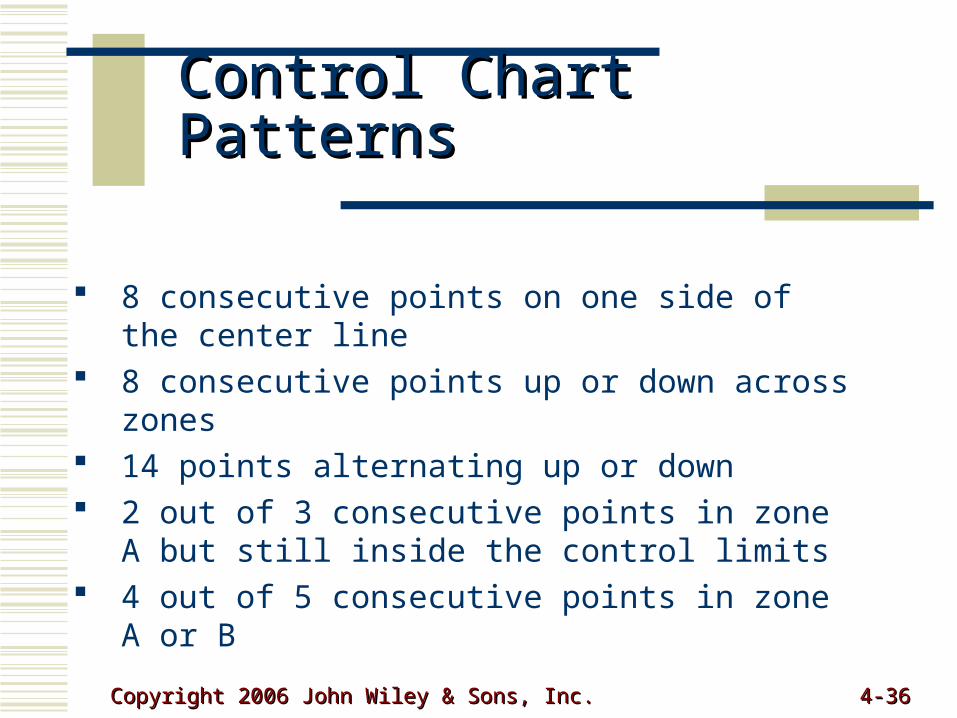
Control Chart PatternsControl Chart Patterns
8 consecutive points on one side of the center line 8 consecutive points up or down across zones 14 points alternating up or down 2 out of 3 consecutive points in zone A but still
inside the control limits 4 out of 5 consecutive points in zone A or B
Copyright 2006 John Wiley & Sons, Inc.Copyright 2006 John Wiley & Sons, Inc. 4-4-3737
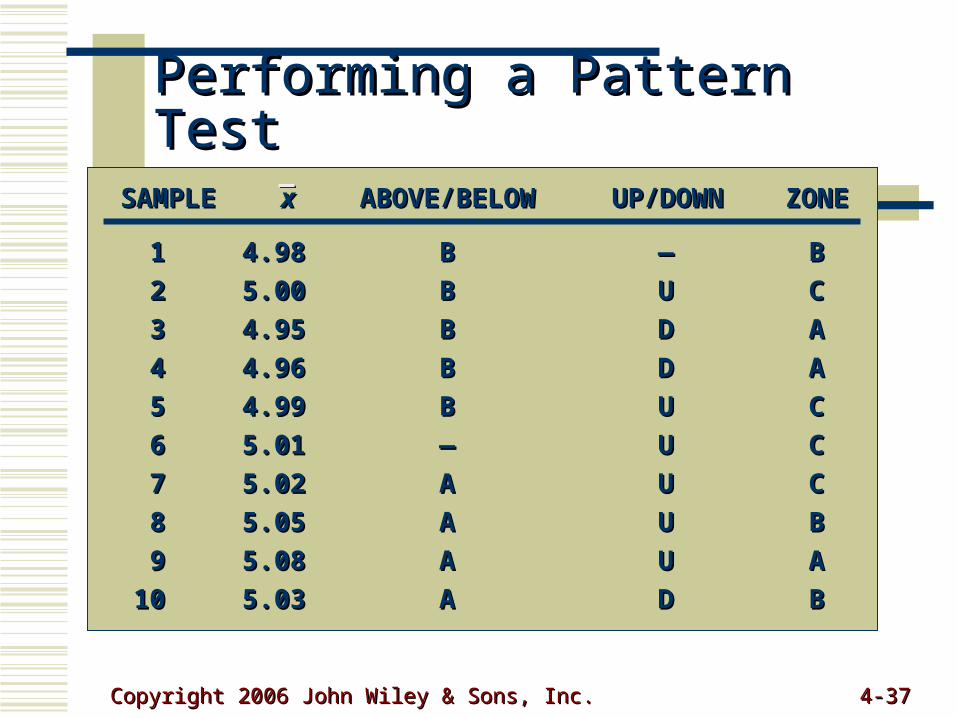
Performing a Pattern TestPerforming a Pattern Test
11 4.984.98 BB —— BB
22 5.005.00 BB UU CC
33 4.954.95 BB DD AA
44 4.964.96 BB DD AA
55 4.994.99 BB UU CC
66 5.015.01 —— UU CC
77 5.025.02 AA UU CC
88 5.055.05 AA UU BB
99 5.085.08 AA UU AA
1010 5.035.03 AA DD BB
SAMPLESAMPLE xx ABOVE/BELOWABOVE/BELOW UP/DOWNUP/DOWN ZONEZONE

Copyright 2006 John Wiley & Sons, Inc.Copyright 2006 John Wiley & Sons, Inc. 4-4-3838
Sample SizeSample Size
Attribute charts require larger sample sizes 50 to 100 parts in a sample
Variable charts require smaller samples 2 to 10 parts in a sample
Copyright 2006 John Wiley & Sons, Inc.Copyright 2006 John Wiley & Sons, Inc. 4-4-3939
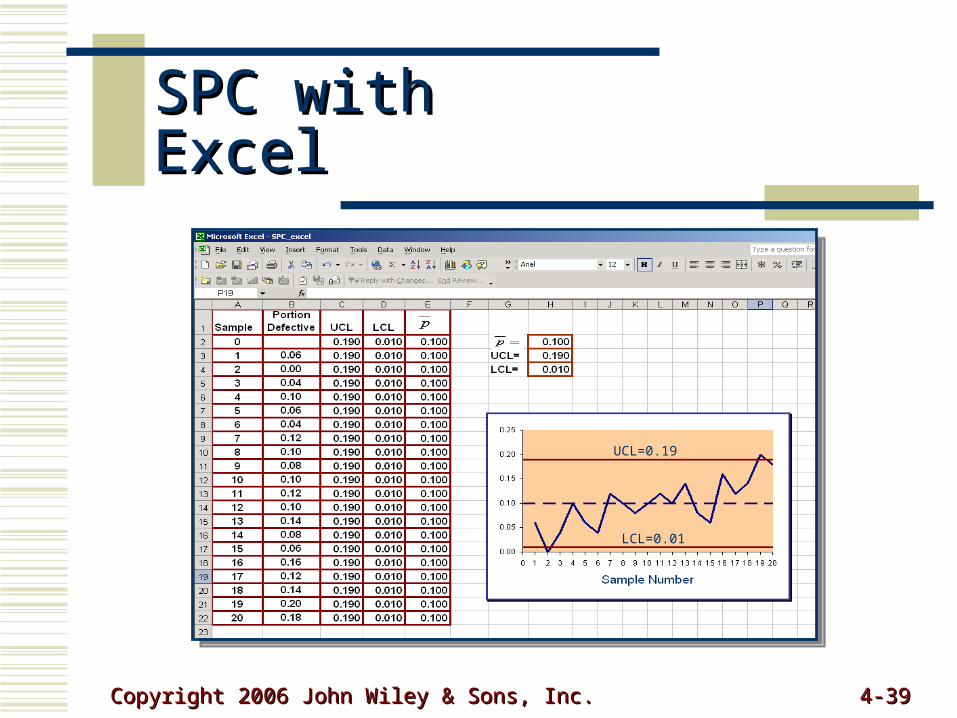
SPC with ExcelSPC with Excel
UCL=0.19
LCL=0.01
Copyright 2006 John Wiley & Sons, Inc.Copyright 2006 John Wiley & Sons, Inc. 4-4-4040
SPC with Excel: SPC with Excel: FormulasFormulas
Copyright 2006 John Wiley & Sons, Inc.Copyright 2006 John Wiley & Sons, Inc. 4-4-4141
Process CapabilityProcess Capability
TolerancesTolerances design specifications reflecting product design specifications reflecting product
requirementsrequirements
Process capabilityProcess capability range of natural variability in a process what range of natural variability in a process what
we measure with control chartswe measure with control charts
Copyright 2006 John Wiley & Sons, Inc.Copyright 2006 John Wiley & Sons, Inc. 4-4-4242
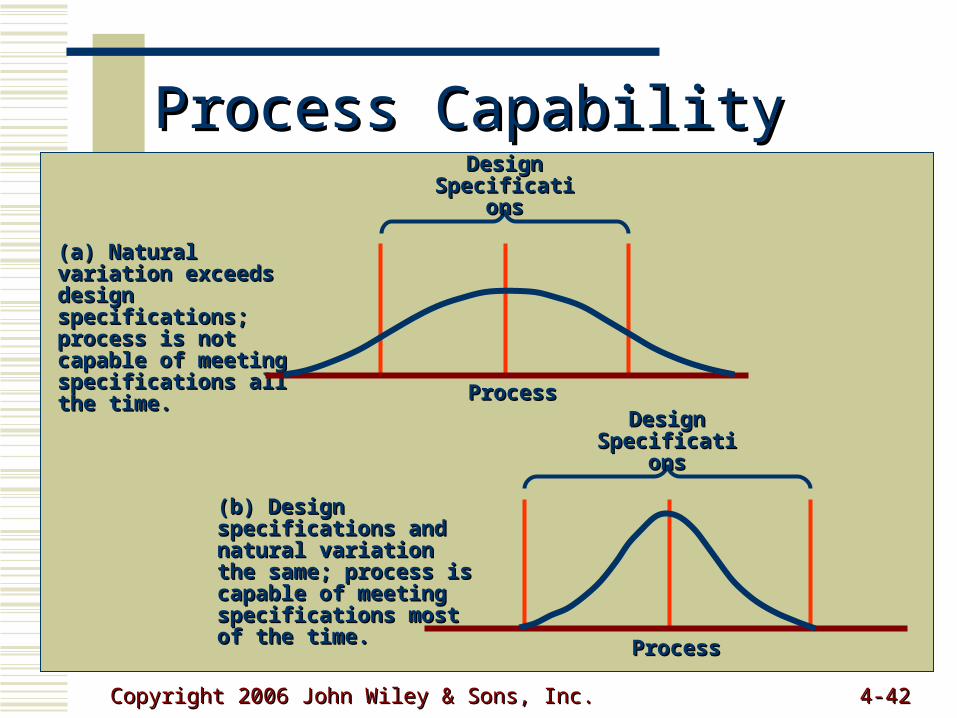
Process CapabilityProcess Capability
(b) Design specifications (b) Design specifications and natural variation the and natural variation the same; process is capable same; process is capable of meeting specifications of meeting specifications most of the time.most of the time.
Design Design SpecificationsSpecifications
ProcessProcess
(a) Natural variation (a) Natural variation exceeds design exceeds design specifications; process specifications; process is not capable of is not capable of meeting specifications meeting specifications all the time.all the time.
Design Design SpecificationsSpecifications
ProcessProcess
Copyright 2006 John Wiley & Sons, Inc.Copyright 2006 John Wiley & Sons, Inc. 4-4-4343
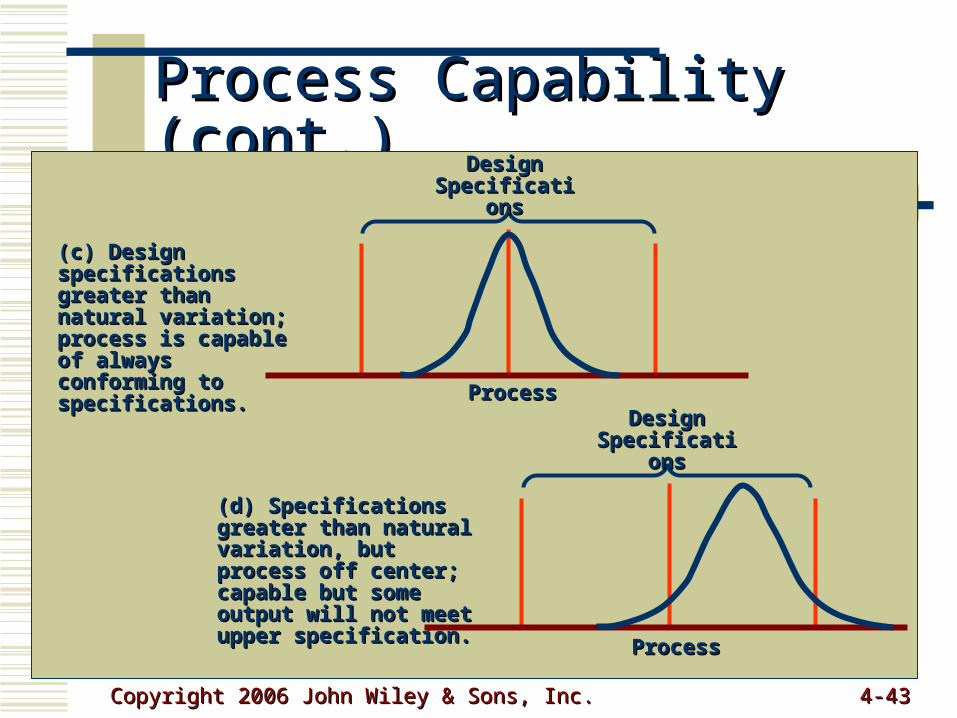
Process Capability (cont.)Process Capability (cont.)
(c) Design specifications (c) Design specifications greater than natural greater than natural variation; process is variation; process is capable of always capable of always conforming to conforming to specifications.specifications.
Design Design SpecificationsSpecifications
ProcessProcess
(d) Specifications greater (d) Specifications greater than natural variation, but than natural variation, but process off center; process off center; capable but some output capable but some output will not meet upper will not meet upper specification.specification.
Design Design SpecificationsSpecifications
ProcessProcess
Copyright 2006 John Wiley & Sons, Inc.Copyright 2006 John Wiley & Sons, Inc. 4-4-4444
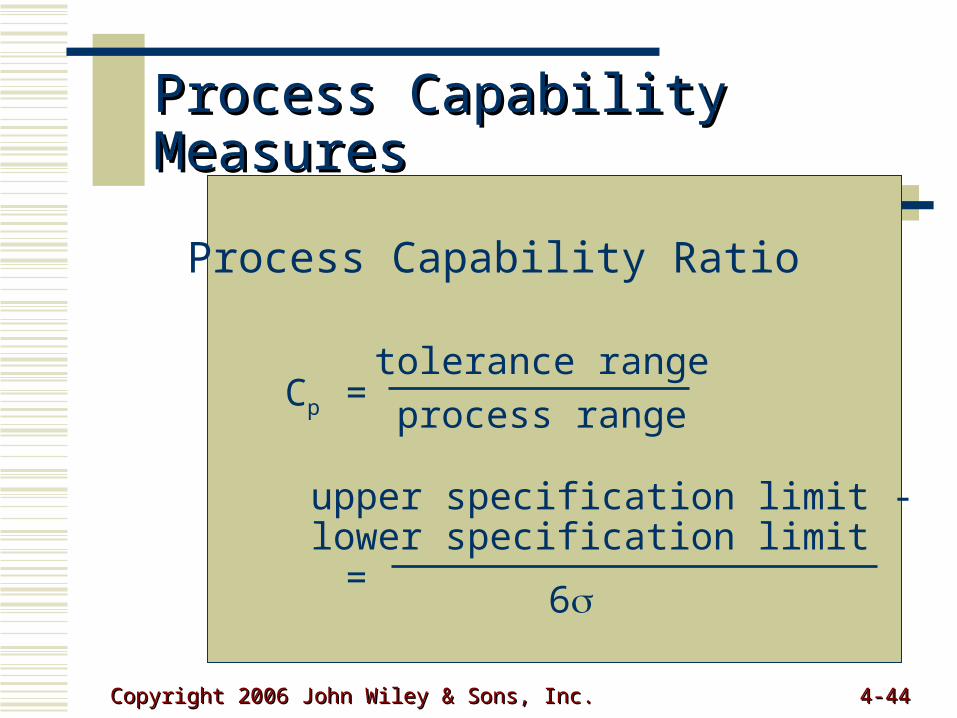
Process Capability MeasuresProcess Capability Measures
Process Capability Ratio
Cp =
=
tolerance range
process range
upper specification limit - lower specification limit
6
Copyright 2006 John Wiley & Sons, Inc.Copyright 2006 John Wiley & Sons, Inc. 4-4-4545
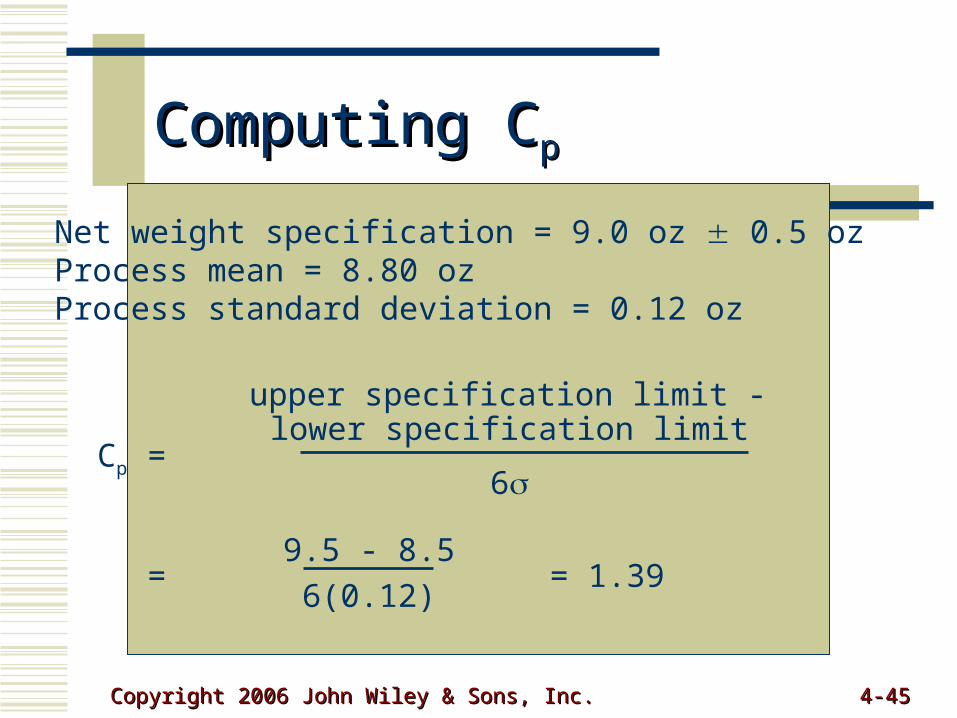
Computing CComputing Cpp
Net weight specification = 9.0 oz 0.5 ozProcess mean = 8.80 ozProcess standard deviation = 0.12 oz
Cp =
= = 1.39
upper specification limit - lower specification limit
6
9.5 - 8.5
6(0.12)

Copyright 2006 John Wiley & Sons, Inc.Copyright 2006 John Wiley & Sons, Inc. 4-4-4646
Process Capability MeasuresProcess Capability Measures
Process Capability IndexProcess Capability Index
CCpkpk = minimum = minimum
xx - lower specification limit - lower specification limit
33
==
upper specification limit -upper specification limit - x x
33
==
,,

Copyright 2006 John Wiley & Sons, Inc.Copyright 2006 John Wiley & Sons, Inc. 4-4-4747
Computing CComputing Cpkpk
Net weight specification = 9.0 oz 0.5 ozProcess mean = 8.80 ozProcess standard deviation = 0.12 oz
Cpk = minimum
= minimum , = 0.83
x - lower specification limit
3
=
upper specification limit - x
3
=
,
8.80 - 8.50
3(0.12)
9.50 - 8.80
3(0.12)
Copyright 2006 John Wiley & Sons, Inc.Copyright 2006 John Wiley & Sons, Inc. 4-4-4848
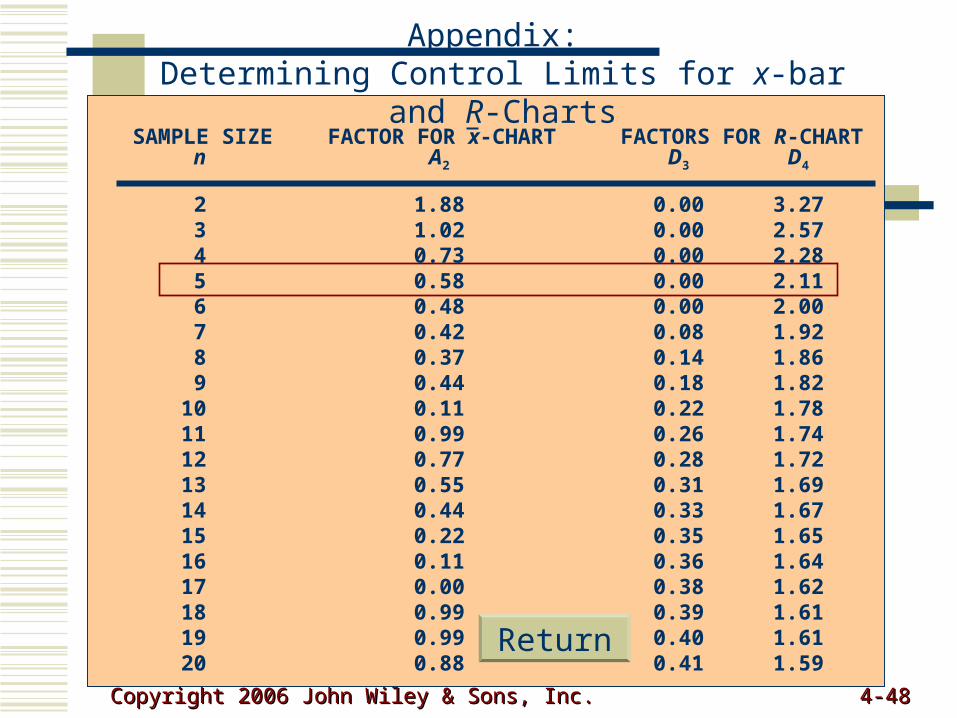
FactFactorsors
n A2 D3 D4
SAMPLE SIZE FACTOR FOR x-CHART FACTORS FOR R-CHART
2 1.88 0.00 3.273 1.02 0.00 2.574 0.73 0.00 2.285 0.58 0.00 2.116 0.48 0.00 2.007 0.42 0.08 1.928 0.37 0.14 1.869 0.44 0.18 1.82
10 0.11 0.22 1.7811 0.99 0.26 1.7412 0.77 0.28 1.7213 0.55 0.31 1.6914 0.44 0.33 1.6715 0.22 0.35 1.6516 0.11 0.36 1.6417 0.00 0.38 1.6218 0.99 0.39 1.6119 0.99 0.40 1.6120 0.88 0.41 1.59
Appendix: Determining Control Limits for x-bar and R-Charts
Return
Copyright 2006 John Wiley & Sons, Inc.Copyright 2006 John Wiley & Sons, Inc. 4-4-4949
Copyright 2006 John Wiley & Sons, Inc.Copyright 2006 John Wiley & Sons, Inc.All rights reserved. Reproduction or translation All rights reserved. Reproduction or translation of this work beyond that permitted in section 117 of this work beyond that permitted in section 117 of the 1976 United States Copyright Act without of the 1976 United States Copyright Act without express permission of the copyright owner is express permission of the copyright owner is unlawful. Request for further information should unlawful. Request for further information should be addressed to the Permission Department, be addressed to the Permission Department, John Wiley & Sons, Inc. The purchaser may John Wiley & Sons, Inc. The purchaser may make back-up copies for his/her own use only make back-up copies for his/her own use only and not for distribution or resale. The Publisher and not for distribution or resale. The Publisher assumes no responsibility for errors, omissions, assumes no responsibility for errors, omissions, or damages caused by the use of these or damages caused by the use of these programs or from the use of the information programs or from the use of the information herein. herein.