Embed Size (px)
Citation preview

Step By Step
First I opened up Excel, I used excel because I thought it would be the best programme to use.
I then inserted my title of the radio into the 2 cells E1, F1 which is Radio L.C, The font was, Calibri, the size was 18 and it was underlined and bold. I also merged the cells together to make it look
professional.
I then put the information that I had received from Mrs Steven into the excel by clicking onto data
Then I clicked on to go into my documents to get the information that I had saved from Mrs Stevens , this icon helps me put in the information and then put it into columns , separating the categories of information into groups.
This has now put my information into a table so it is easier to read
I am using the school logo colours on my spread sheet so I have got the RGB codes; I have filled the cells with the green colour from the logo. And then the font colour is the blue colour of the logo.
I have typed the item names into the a column so I can then work out when they are going to be
playing.

Then I need to work out the formula for the time when it changes according to the length of the item that has been played. The formula is to show when the item is actually being played. E.g. for the
adverts I have used the formula I then have put the formulas in for the other items and dragged down so it followed on the results in the table.
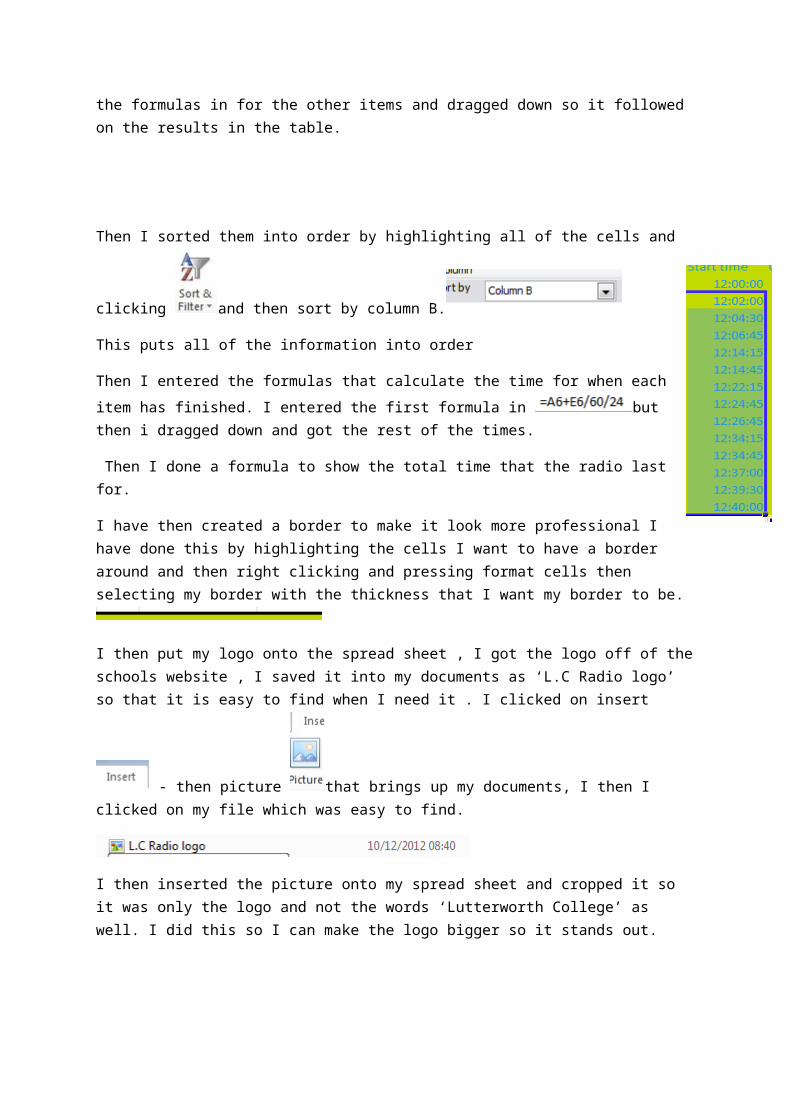
Then I sorted them into order by highlighting all of
the cells and clicking and then sort by
column B.
This puts all of the information into order
Then I entered the formulas that calculate the time for when each item has finished. I entered
the first formula in but then i dragged down and got the rest of the times.
Then I done a formula to show the total time that the radio last for.
I have then created a border to make it look more professional I have done this by highlighting the cells I want to have a border around and then right clicking and pressing format cells then selecting my border with the thickness that I want my border to be.
I then put my logo onto the spread sheet , I got the logo off of the schools website , I saved it into my
documents as ‘L.C Radio logo’ so that it is easy to find when I need it . I clicked on insert -
then picture that brings up my documents, I then I clicked on my file which was easy to find.
I then inserted the picture onto my spread sheet and cropped it so it was only the logo and not the words ‘Lutterworth College’ as well. I did this so I can make the logo bigger so it stands out.
I cropped the image by clicking on the image and then format and crop then resized the image to fit it to the cells A1, A2, A3.
I then put a border around the image.
This is my 1st completed spread sheet.
I am now going onto my 2nd spread sheet which is basically the same but I have not got to include the bits about each individual item. This is the spread sheet that is going to go up on the display at school so that the pupils and staff can read to see what is going to be played.
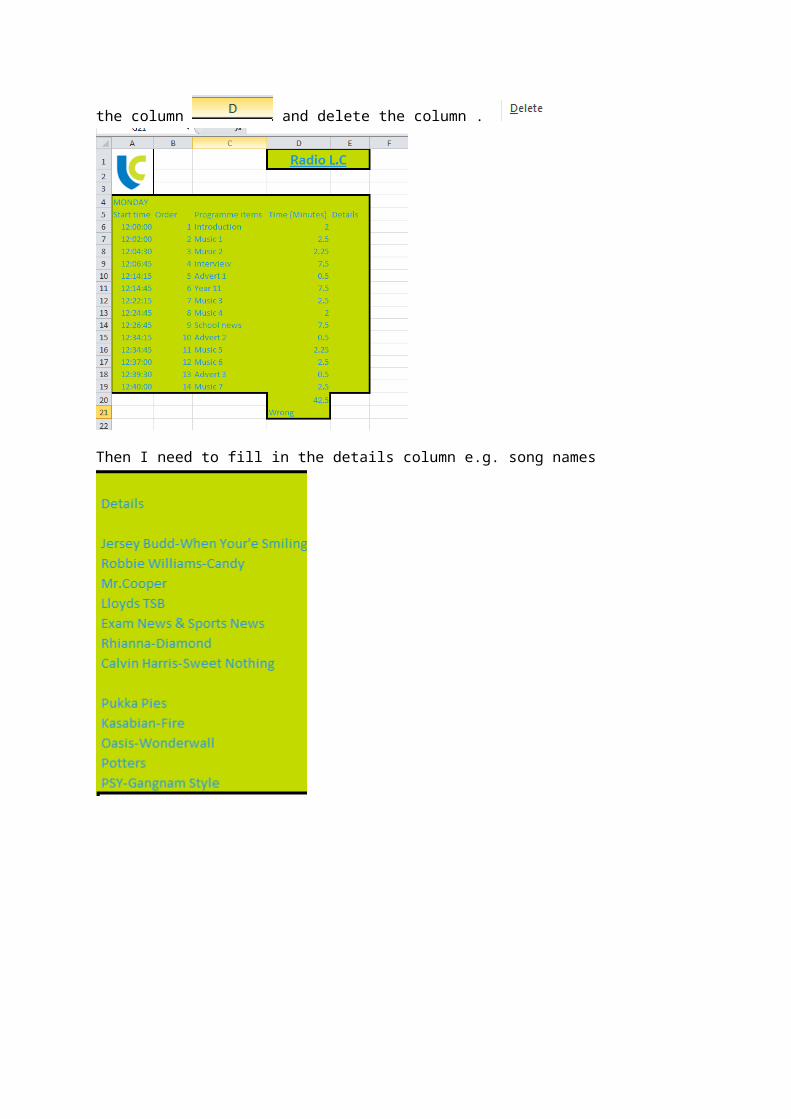
To do this spread sheet all I need to do is copy part of my spread sheet onto a plain spread sheet page and delete 1 column because I do not need the ‘Item Code’ column so I right clicked on the top
of the column and delete the column .

Then I need to fill in the details column e.g. song names
This is my second completed spread sheet
For the 3rd spread sheet I need to create a graph. I Started by clicking then Because this is the suitable graph to use , Then select a 2D graph so it is easy to understand / read
. Then size the blank graph to what was on the spread sheet, in my case
up to K23
I then need to put in my data onto the graph so I click Collect data Which then brings up a box

Then go back onto the first sheet and There is another box there which sends information to the 3rd spread sheet.Highlight the Totals that each item is on for , hold control , select the names of the item.
Then press OK. This will send all of the information to the graph and insert charts. Then I clicked on the graph and reselected a graph with a Graph that includes a title and so that the graphs are all joined together.

Then I wrote in my title and change the all of the font to the same green colour that is in the Lutterworth logo. This is my finished 3rd spread sheet.