Upload tom-drummond
View 77
Download 0
Embed Size (px) 344 x 292 429 x 357 514 x 422 599 x 487
Citation preview
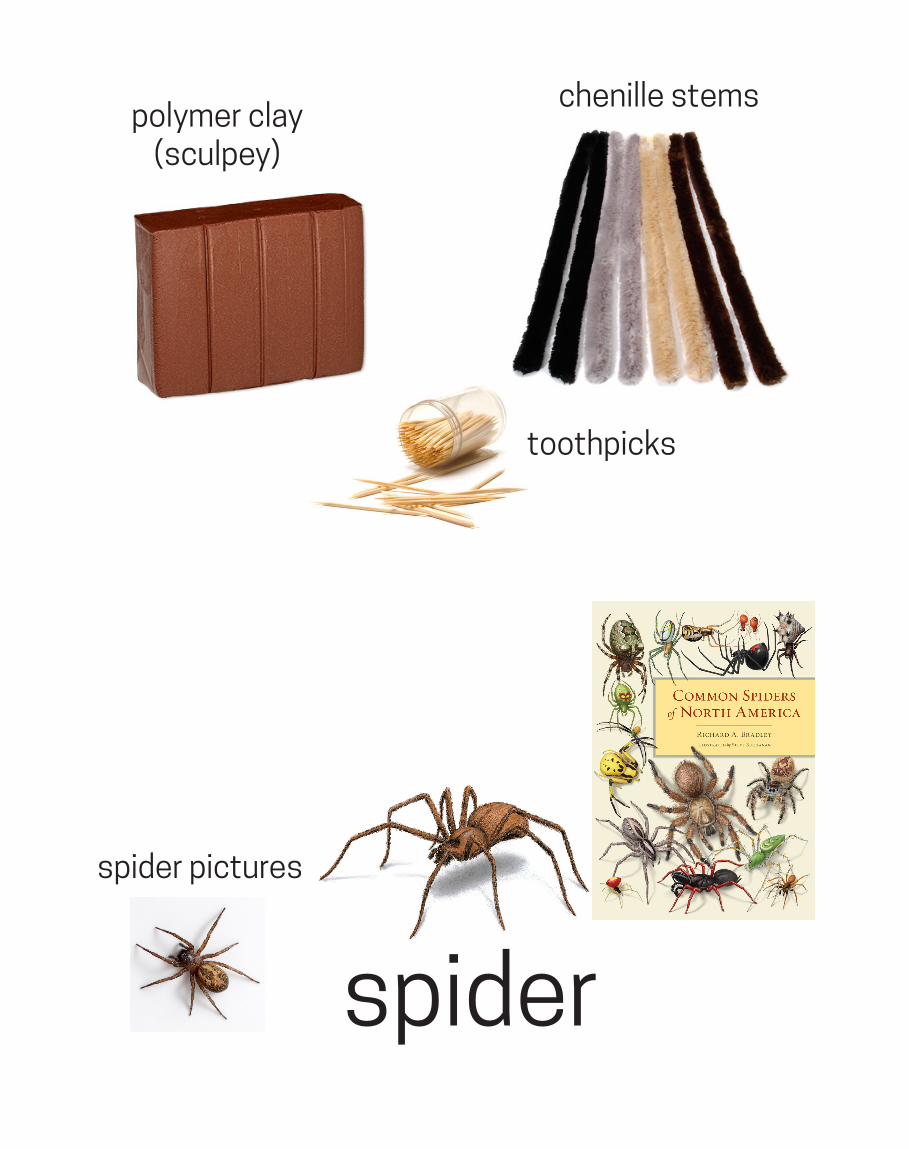
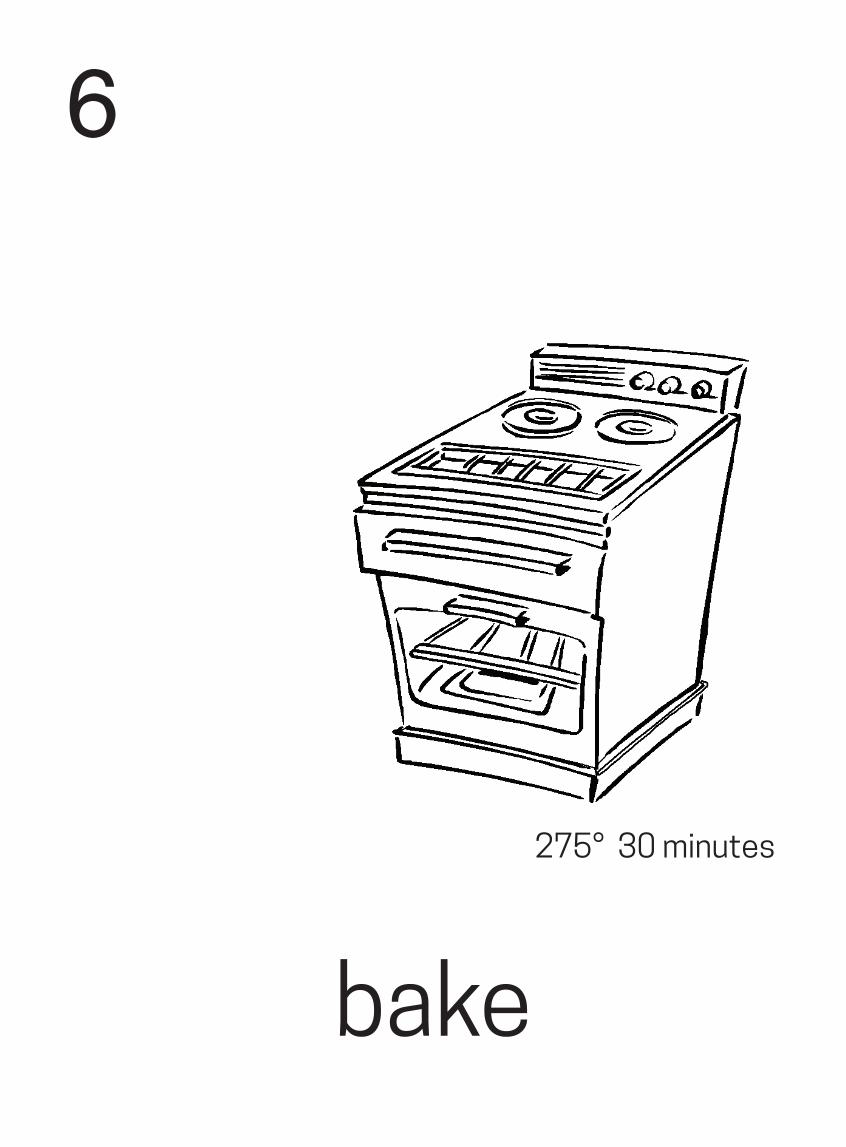
polymer clay(sculpey)
spider
chenille stems
toothpicks
spider pictures
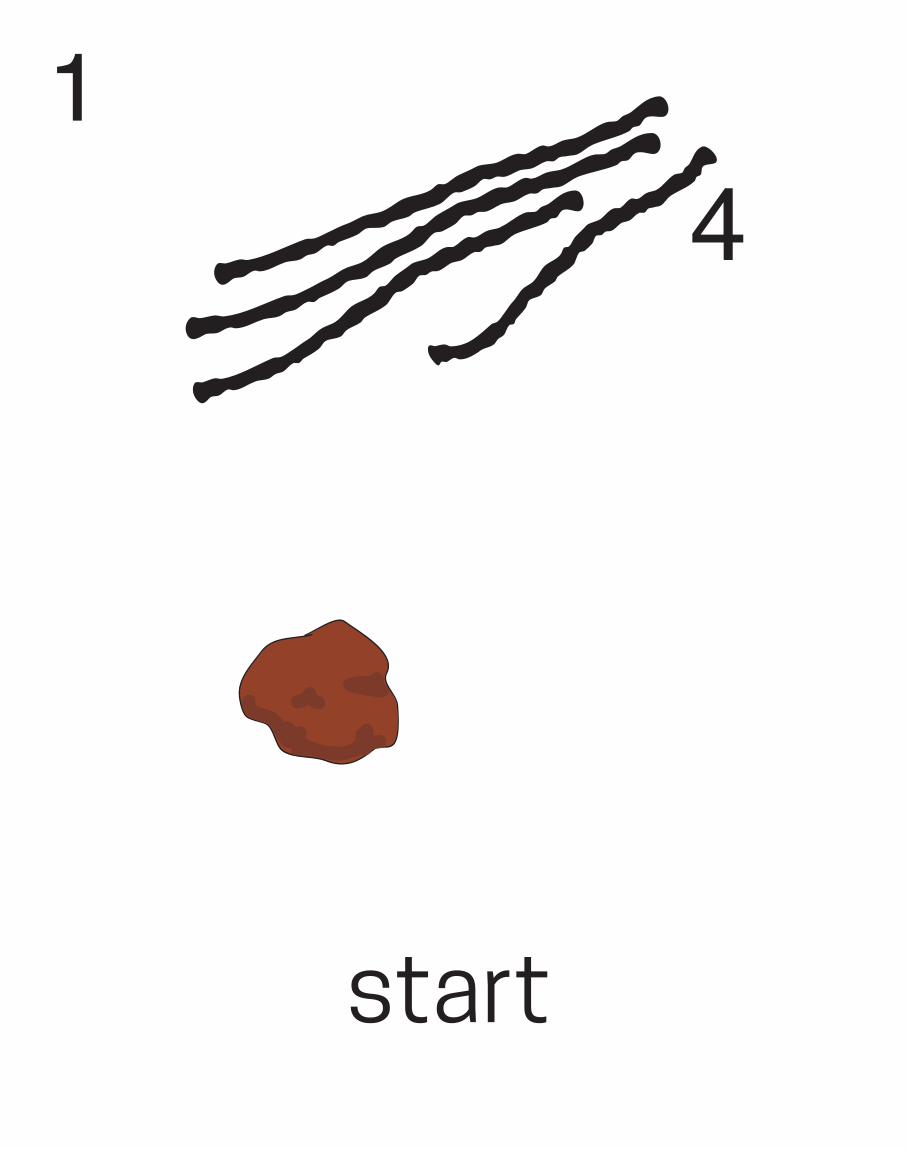
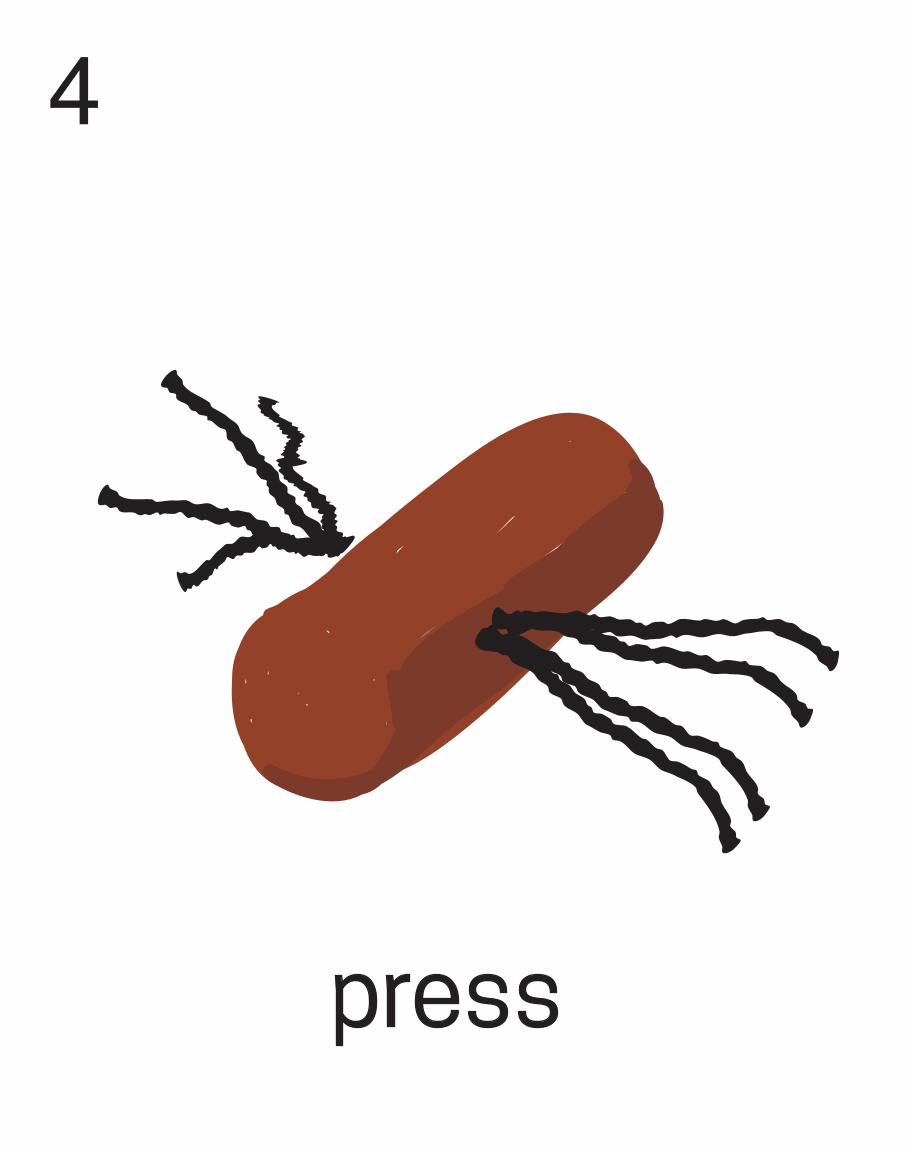
4
start
1
roll
2
across
3
press
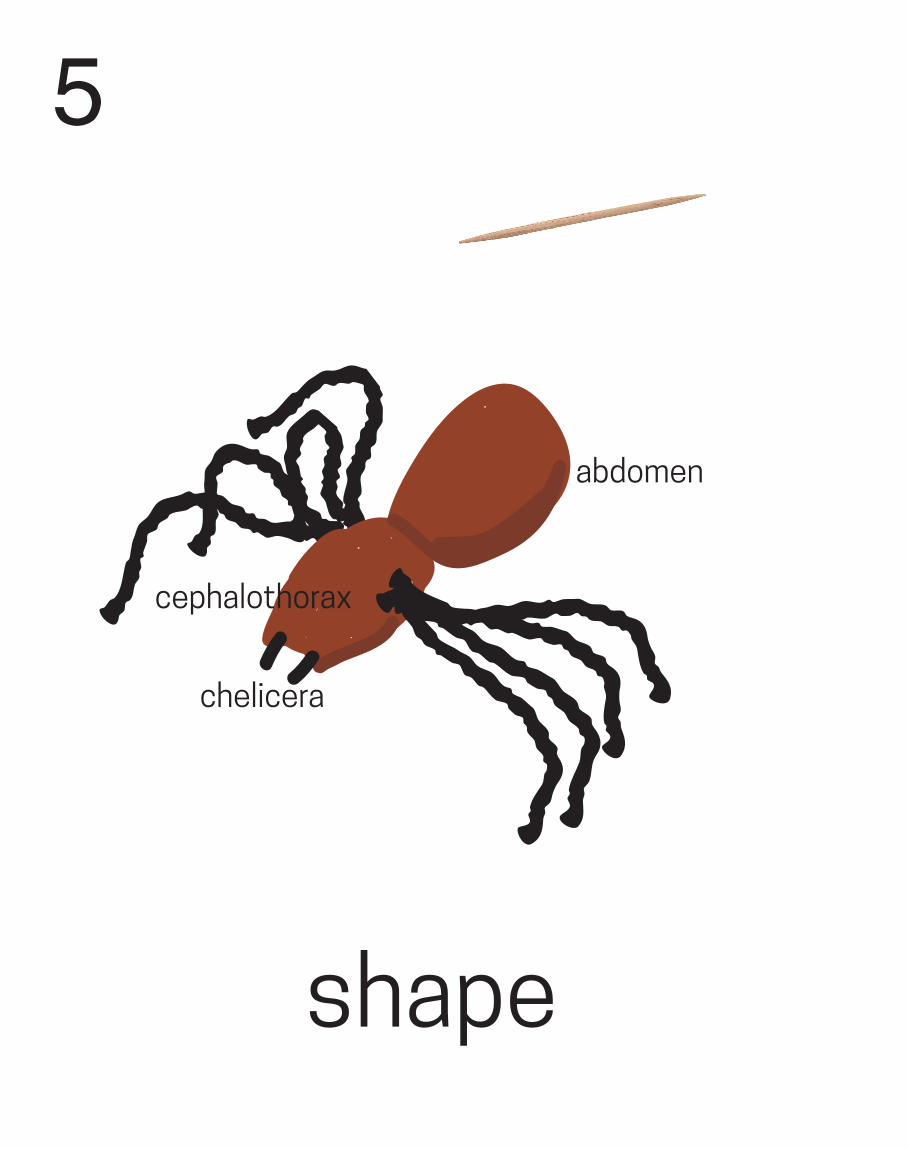
shape
5
abdomen
thoraxcephalothorax
chelicera
bake
275° 30 minutes
6
Step chart for Constant Voltage Output (C. V. Mode)
The High-Low Chart—Step-by-Step Tutorial
Radar chart 1 - The Learning Exchangelx.iriss.org.uk/sites/default/files/resources/radar_chart_1.pdf · How$tomake$a$Radar$chart$/spider$chart$ $ When$itcomes$to$using$scale$measures$as$partof$apersonal$outcomes$approach,$the$radar$chartcan$help$you
10 stages sequence of process in step by-step format organization chart powerpoint slides
SPIDER IDENTIFICATION CHART - Pest Control Servicescompetitivepestcontrol.com.au/wp-content/uploads/... · SYDNEY FUNNEL-WEB FEMALE SPIDER IDENTIFICATION CHART SYDNEY FUNNEL-WEB MALE
Giulietta 750/101 Spider-Spider Veloce
“Mama” Spider Sculptures - Blick Art Materialscdn.dickblick.com/lessonplans/mama-spider-sculptures/mama-spider... · “Mama” Spider Sculptures ... born artist Louise Bourgeois
(Cleome gynandra) Vegetable Growingafricasoilhealth.cabi.org/.../uploads/...Vegetable-Trainers-Notes.-pdf.p… · CHART 11: Harvesting spider plant vegetable Spider plant is ready
New Features in Primavera Portfolio Management 15 1 WHATS …€¦ · Primavera Portfolio Management 15.1 includes new graph types -- radar/spider chart and Pareto chart -- for display
Time Management – Time Use Chart and Log (Step 1)
New 201505 OWASP AppSecEU 2015 SecDevOps - Christian Schneider · 2015. 5. 28. · "OWASP ZAP" (spider & scanner) + Jenkins plugin "ZAProxy" • Allows us to "Spider & Scan" as step
SPIDER V FAMILY - shop.suonostore.com · spider v family spider v 30 spider v 60 spider v 120 spider v 240 spider v 240hc pilot’s guide manuel de pilotage pilotenhandbuch manual
Time Management Time Use Chart and Log (Step 1) - unco.edu · Time Management – Time Use Chart and Log (Step 1) 1 Overview Time management is not something you do just once and
Oracle Financials R12 - GL STEP 1 - Chart Of Accounts
Sequence Chart - understood.org/media/71c51200ebea49aaaab8533e6a145e22.pdf · 1st Step 2nd Step 3rd Step 4th Step 5th Step 6th Step 7th Step 8th Step Last Step Sequence Chart Topic:
Ppt 3d arrow step by process spider diagram powerpoint template business templates
IQ Basic Step by Step Instruction Basis-Farben Step by Step Anleitung Instruction étape par étape Istruzioni di base passaggio per passaggio 11 Advanced Colour Combination Chart
F T B SYSTEMS T ACK ESTING - Fibonacci Trader SWING CHART NEXT ARKAY SWING CHART OWN BALANCE POINT BALANCE STEP HIGH BALANCE STEP NEXT BALANCE STEP OWN DANTON STOP DIRECTIONAL MOVEMENT
76004 Spider-Man: Spider-Cycle Chase [Marvel]
DROP DEAD PEST CONTROL...drop dead pest control your local pest control experts spider identification chart dangerous - deadly spiders sydney funnel-web mouse spider female female
HP Project and Portfolio Management Center...Radar (Spider) Line Chart Portlet 125 Bubble Chart Portlet 128 Setting the Displayed Color Label Length for a Bubble Chart 130 Selecting
International Program in Engineering (IPE) - DHBW Mosbach · Motivation –International Program in Engineering (IPE) ... International Program in Engineering –Spider Web Chart
Graphing Charts in Microsoft Excel · 28/04/2006 · 2.2 Step 1 – Chart Type In the first Chart Wizard dialog box, Step 1 – Chart Type, you select the chart type and subtype
Spider vs Spider
Excel Column Chart Step by Step
Project and Portfolio Management Center...Line Chart Portlet 105 XY (Scatter) Line Chart Portlet 106 Radar (Spider) Line Chart Portlet 108 Bubble Chart Portlet 111 Setting the Displayed
Start-up-BW Summit Pitchdeck Investors · 2020-02-27 · p ider 12000 . Spider sign Spider sign Spider Spider Wall Spider Meet ounge Spider Spider tech TV Spider ... Side Stage South
FREE E-BOOK · line chart as it displays the trend as well as the time taken between changes. The difference between a Step Chart and Line Chart: A line chart connects data points
€¦ · Web viewChoosing a Chart Layout and Style14 Arranging Chart Elements15 Step-by-Step 8.315 Creating a 3-D Chart17 Step-by-Step 8.417 Formatting and Modifying a Chart18 Step-by-Step
Analysis of Personal Attributes and Skills of Mercer ... · Spider chart, or radar charts, is a graphical chart used to plo t multivariate data of three or variables on axes that


![76004 Spider-Man: Spider-Cycle Chase [Marvel]](https://img.pdfslide.net/doc/110x75/577cc35c1a28aba71195cd3a/76004-spider-man-spider-cycle-chase-marvel.jpg)


