Embed Size (px)
Citation preview
11
Março de 2017 Working Paper
449
The Economic Commission for Latin America (ECLA)
was right: scale-free complex networks and core-
periphery patterns in world trade
Paulo Gala
Jhean Camargo
Elton Freitas
TEXTO PARA DISCUSSÃO 449 • MARÇO DE 2017 • 1
Os artigos dos Textos para Discussão da Escola de Economia de São Paulo da Fundação Getulio
Vargas são de inteira responsabilidade dos autores e não refletem necessariamente a opinião da
FGV-EESP. É permitida a reprodução total ou parcial dos artigos, desde que creditada a fonte.
Escola de Economia de São Paulo da Fundação Getulio Vargas FGV-EESP www.eesp.fgv.br
The Economic Commission for Latin America (ECLA) was right:
scale-free complex networks and core-periphery patterns in world trade
Paulo Gala1 – EESP/FGV
Jhean Camargo – UFSCAR/CCTS
Elton Freitas –CEDEPLAR/UFMG
Abstract
The main purpose of this paper is to apply big-data and scale-free complex network techniques
to the study of world trade, with a specific focus on the investigation of ECLA and structuralist
ideas. A secondary objective is to illustrate the potentialities of the use of the new science of
complex networks in economics, in what has been recently referred to as an econophysics
research agenda. We work with a trade network of 101 countries and 762 products (SITC-4)
which generated 1,756,224 trade links in 2013. The empirical results based on network analysis
and computational methods reported here point in the direction of what ECLA economists used
to argue; countries with higher income per capita concentrate in producing and exporting
manufactured and complex goods at the center of the trade network; countries with lower income
per capita specialize in producing and exporting non-complex commodities at the network’s
periphery.
Keywords
Complex networks, core-periphery, economic development, international trade, ECLA
JEL classification: D85, B20, F10
1 To whom correspondence should be addressed: [email protected]
1
Introduction
One of the keys to understanding the models and ideas of the Economic Commission for Latin
America (ECLA) and structuralist economists in general lies in realizing that the disaggregation
of economic analyses by product types is crucial; one cannot understand the economic
development of countries without studying the specific technological and productive traits of
each type or class of goods produced in a given nation. For ECLA and structuralists, economic
development is nothing more than a productive sophistication from simple products towards
more complex ones. For these classical development economists increased productivity springs
precisely from climbing the technology ladder, migrating from low to high quality activities and
achieving technological sophistication of the economy (Bresser-Pereira 2016). To this end,
building a complex and diversified industrial system, subject to increasing returns to scale, high
synergies, and linkages between activities is crucial (Reinert 2010). Specialization in agriculture
and commodity extraction alone does not allow for this kind of technological evolution.
How does one empirically measure these propositions from the classical economists of
development? Ideally one could study the structures of world markets as reflected in the world
trade web. If the propositions of classical development authors are correct, one would then find
that countries with higher income per capita would specialize in the production of manufactured
goods, while poor countries would specialize in activities more closely connected with
commodities production and extraction; which is indeed easily seen from a superficial analysis
of today’s world trade patterns, but difficult to demonstrate in a more robust way. This is the
path that this paper will follow. We use complex networks and big-data computational
techniques to study the world’s trade network. We apply here econophysics’ techniques to test
2
classical structuralist ideas. As we will show, the concentration of commodities trade in the
hands of emerging countries and of manufactured goods trade in those of rich countries is an
important indication of core-periphery patterns in the world trade web.
Other works on econophysics have used scale-free complex networks to study international trade
as well (Fagiolo et al (2008) and Deguchi et al (2014)), but not with the focus adopted here:
using structuralist ideas and a database focused on productive complexity of countries and
products in the world trade web. This paper’s main purpose is, therefore, to apply big-data and
scale-free complex network techniques to the study of world trade, with a specific focus on
investigating structuralist ideas. A secondary objective is to illustrate the potentialities of the use
of approaches from the new science of complex networks in economics, in what has more
recently become known as an econophysics research agenda (Sinha et al 2010). The paper is
divided into five sections. The next section briefly introduces the connections that structuralist
economists draw between economic development and international trade. Section two covers
measurements of productive sophistication adopted in The Atlas of Economic Complexity and
introduces the database that will be used for this paper’s empirical analysis. Section three
discusses key themes for the application of scale-free complex networks techniques and
addresses the empirical methodology to be used in the paper. Section four studies the world trade
web and analyses the structure of several international product markets. The fifth and final
section concludes the text.
3
1-Classics of economic development
Former development economists, also known as structuralist economists, were mainly divided
into two main strands: the Anglo-Saxon and the Latin-American. Both based their analyses of
economic development on concepts such as productive linkages, poverty traps, core-periphery
patterns and dualism in economic systems. The structuralist view defines economic development
as a radical transformation of economic structures towards the sophistication of the productive
fabric. Assuming that a country’s industrial productive structure affects both the pace and the
direction of economic development, the structuralist literature emphasizes the importance of
industrialization in this growth trajectory. For structuralist economists, in the absence of a robust
industrialization process a country cannot increase its employment, productivity and per-capita
income levels, and thereby reduce its poverty. For these authors the development process
involves reallocating output from low to high productivity industries, where increasing returns to
scale prevail.
Paul Rosenstein-Rodan, Ragnar Nurkse, Arthur Lewis, H. Singer, Albert Hirschman, Gunnar
Myrdal and Hollis Chenery belong to the group of economists associated with the original
structuralism or classical development economics. Their seminal contributions challenged the
neoclassical view of market efficiency as a promoter of the structural change that economic
development processes require. Another strand of contributions comes from the so-called Latin-
American structuralism, which is mainly associated with the Economic Commission for Latin
America (ECLA) whose works coalesced into a coherent school of thought in the late 1950s. In
light of historical experiences, the core thinking of the Latin-American strand of structuralism is
encapsulated in the works of Raul Prebisch and Celso Furtado (Bianchi and Salviano 1999).
4
Their main focus was on the challenges developing countries faced to grow in a world economy
split into two poles: the rich “center” and the poor “periphery”, each with different productive
structures.
For all of these classical authors of economic development productive activities differ in terms of
their ability to generate growth and development. Activities with high increasing returns to scale,
high incidence of technological innovations and high synergies arising from the division of labor
within and among business firms are strong inducers of economic development (Reinert 2009).
These are activities where, in general, imperfect competition prevails, as well as all of the
characteristics typical to this kind of market structure (important learning curves, rapid technical
progress, high R&D content, large potential for economies of scale and scope, high industrial
concentration, high entry barriers, product differentiation, etc.). This group of high value-added
activities lies opposite to low value-added ones that are usually carried out by poor or middle-
income countries with typical perfect-competition structures (low R&D content, low
technological innovation, absence of learning curves, and low potential for labor division) (Katel
and Reinert 2010).
For these economists higher aggregate productivity is achieved through migration from low to
high-quality activities, towards the sophistication of the productive structure of an economy
(Bresser-Pereira 2014). This is an enormously difficult endeavor. Economic development
processes depend on this leap. Thanks to their intrinsic characteristics, high-quality activities
emerge in markets with oligopolistic and monopolistic competition structures; which on itself
makes entry very difficult for new players from emerging countries. Barriers to entry, large
5
economies of scale and scope and product differentiation are some of these markets’
characteristics that greatly hamper the access of new business firms from the emerging world. In
order to develop a country must be able to establish firms in these already highly occupied
industries, where the potential for economies of scale and profits are huge: therein lies aggregate
productivity. Without getting into these markets and occupying relevant spaces, no relevant
productivity gains occur and no economic development takes place; the productive fabric does
not gain sophistication, nor does production complexity increase.
2-Economic complexity and patterns of international trade
Hausmann et al (2011) use computational, network and complexity techniques to create an
ingenious method for comparison of productive sophistication, or “economic complexity”, across
countries. Starting from an analysis of a given country’s exports basket they are able to indirectly
measure its productive fabric’s technological sophistication. The methodology devised to build
economic complexity indices culminated in an Atlas (http://atlas.media.mit.edu) that collects
extensive analyses on countless products and countries over 50 years starting in 1963. The two
basic concepts used to measure whether a country is “economically complex” are the ubiquity
and diversity of the products found in its exports. If a given economy is capable of producing and
exporting several non-ubiquitous goods, this indicates the presence of a sophisticated productive
fabric.
This measure obviously involves a scarcity problem, particularly of natural resources like
diamonds and uranium, for example. Non-ubiquitous goods can be divided into those with high
technological content, which are therefore difficult to produce (airplanes), and those that are
6
highly scarce in nature, such as diamonds, which are therefore naturally non-ubiquitous. To
control for this issue of scarce natural resources in complexity measurements, the authors of the
Atlas use an ingenious technique: they compare the ubiquity of the product made in a given
country with the diversity of the exports of countries that also produce and export this good. To
illustrate: Botswana and Sierra Leone produce and export something that is rare and therefore
non-ubiquitous, rough diamonds. On the other hand, their exports are extremely limited and
undiversified. These, then, are instances of non-ubiquity without complexity.
At the opposite end of the ubiquity spectrum we could mention image-processing medical
devices (X-ray equipment) which practically Japan, Germany and the United States (complex
countries) alone can manufacture and export; these are non-ubiquitous complex products. In this
case the export composition of Japan, USA and Germany is extremely diversified, indicating that
these countries are highly capable of making many different things. In other worlds, non-
ubiquity with diversity means “economic complexity”. On the other hand, countries with highly
diverse export composition made up of ubiquitous goods (fish, meat, fruits, ores, etc…) do not
show high economic complexity; they produce and export what all others can do. Diversity
without non-ubiquity means lack of economic complexity.
One of the main virtues of such economic (ECIs) and product complexity (PCI) indicators is the
fact that they operate based on quantitative measures obtained from linear algebra calculations to
arrive at their results. There is no account of qualitative issues relating to the production and
exports of those goods. That is, no judgment is made as to what is regarded as complex or non-
complex. Along these lines, the authors rate several countries and arrive at robust correlations
7
between income per-capita levels, inequality and economic complexity (Hausmann et al 2011
and Hartman et al 2015). Japan, Germany, Switzerland and Sweden are always ranked among
the top ten countries in terms of complexity. Economic development may be treated as the
mastery of more sophisticated production techniques, which usually lead to output of higher
value added per worker as argued by classic development authors. This is what economic
complexity indicators ingeniously capture from measures of ubiquity and diversity of exports
from various countries. The Atlas’ results are in line with predictions from classical development
economists regarding specialization patterns in world trade: rich countries tend to specialize in
producing manufactured goods, poor countries in commodities; an aspect we will explore in
greater depth ahead.
In this sense, the Atlas of Economic Complexity offers yet another important empirical
contribution: by calculating the probability of products being jointly exported by several
countries, the Atlas also creates an interesting measure of the productive knowledge embedded in
products and of the local capabilities needed for their production; the “product space” (Hidalgo
et al 2007). The greater the probability of two products being co-exported, the greater their
“proximity” and the more indication that they contain similar characteristics and therefore
require similar productive capabilities for production; they are “siblings” or “cousin” products.
The co-exportation indicator ultimately serves as a measure of each product’s “productive
connection”, that is, an indication of the productive ties linking various products as a result of
their shared requirements for production. Highly connected goods are therefore loaded with
knowledge and technological potential; they are “hubs of knowledge”, whereas those with low
connectivity have low knowledge multiplication potential. To illustrate: countries that make
8
advanced combustion engines probably have engineers and knowledge that enable them to
produce a series of similar and sophisticated things. Countries that only produce bananas or other
fruit have limited knowledge and are probably incapable of making more complex goods. It is
important to emphasize that the difficulty observing these differences arises from our inability to
directly measure and capture such local productive skills. What one observes in international
trade are the products, not countries’ ability to produce them.
Some examples from the Atlas of Complexity illustrate the point: machinery in general and cars
are highly “connective” and complex in terms of knowledge content, and are therefore “hubs of
knowledge”; iron ore and soybeans have very low connectivity and are non-complex.
Manufactured goods stand out from other kinds of goods in terms of complexity and
“connectivity”. Commodities in general lack these characteristics. Empirically, the Atlas clearly
shows that manufactured goods are generally characterized as more complex and connected
whereas commodities emerge as non-complex and non-connected goods. Out of the 34 main
communities of goods in the Atlas calculated by their network compression algorithm (Rosvall
and Bergstrom (2007), one finds that machinery, chemicals, airplanes, ships and electronics
stand out as the more complex and connected goods (hubs of knowledge). On the other hand,
gemstones, oil, minerals, fish and shellfish, fruit, flowers, and tropical agriculture show very low
complexity and connectivity. Grains, textiles, construction material and equipment and processed
food occupy an intermediate position between more and less complex and connected goods.
9
3-Big data, scale-free complex networks, power laws and hubs
Studies in complexity gained momentum in Economics after Brian Arthur’s work (Arthur (2015)
and Foster (2005)) as the head of New Mexico’s Santa Fe Institute in the late 1980s. With
applications on various fronts, complex dynamical systems approaches have been applied to
different fields of research in Economics and other sciences. Applications are used, for example,
in Game Theory, Political Science, Biology and Physics. Original applications in Economics
were on modeling of financial markets, individual agents’ decision-making rules in various
contexts and studies on path-dependence and technological dynamics with increasing returns.
The Atlas of Economic Complexity presented in the previous section advances the discussion of
complexity combining it with Big Data techniques to create what is perhaps one of today’s most
relevant economic databases for world trade analysis. The term Big Data has been widely used in
various contexts to describe the explosive growth of data available from the digital world. At its
roots, Big Data deals with a large volume and variety of high-velocity data.
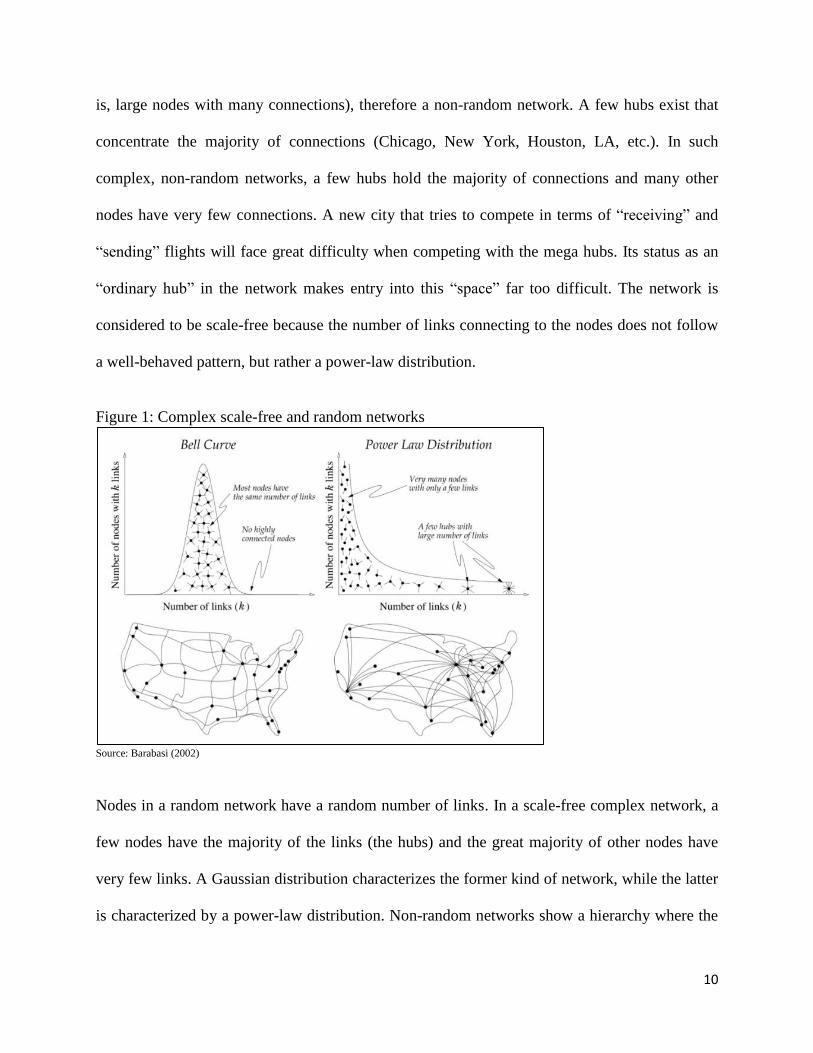
In a compilation of his works on and the history of scale-free complex networks, Barabasi (2002)
provides a detailed explanation of the concepts and recent contributions to network science
within the context of Big Data in different fields of knowledge; some practical examples of
which include the internet itself, the network of Hollywood actors and films, biological and
linguistic networks, among many more. The simple case of the US airlines network (see figure 1
below) as presented by Barabasi (2002) explains in a clear manner the concept of scale-free
complex networks that we will use in our empirical analysis below. The first network is that of
the US highway system with many connection nodes (each city is a node) and no relevant hubs.
The airlines network in the same graph is the opposite case: a complex network with hubs (that
10
is, large nodes with many connections), therefore a non-random network. A few hubs exist that
concentrate the majority of connections (Chicago, New York, Houston, LA, etc.). In such
complex, non-random networks, a few hubs hold the majority of connections and many other
nodes have very few connections. A new city that tries to compete in terms of “receiving” and
“sending” flights will face great difficulty when competing with the mega hubs. Its status as an
“ordinary hub” in the network makes entry into this “space” far too difficult. The network is
considered to be scale-free because the number of links connecting to the nodes does not follow
a well-behaved pattern, but rather a power-law distribution.
Figure 1: Complex scale-free and random networks
Source: Barabasi (2002)
Nodes in a random network have a random number of links. In a scale-free complex network, a
few nodes have the majority of the links (the hubs) and the great majority of other nodes have
very few links. A Gaussian distribution characterizes the former kind of network, while the latter
is characterized by a power-law distribution. Non-random networks show a hierarchy where the
11
hubs prevail because they have far more access to links than “ordinary” nodes: a “topocracy”
reigns (Borondo et al 2014). Competition inside these networks is uneven in the sense that, over
time, certain nodes collect large numbers of links to become hubs with greater access to other
nodes of the network. An “ordinary” node faces great difficulty when competing with a hub
because it starts out from a poor position in terms of its stock of accumulated links. Barabasi and
his team created a simplified model that reproduces with remarkable accuracy this kind of real-
world network dynamics; the model has three pillars: i) a network that grows with new nodes
being incorporated to other nodes by means of links at every point in time; ii) a preferential
attachment rule according to which each new node prefers to connect to an existing node with
lots of links; and, iii) fitness: some nodes are more competent link-accumulators than others,
which may help a new node to overcome the difficulty of lacking links when it enters the
network.
Barabasi and his team use these three simple rules to formally replicate the characteristics of
such networks in the real world, including the appearances of power-law distributions as
indicated above in the case of the US airlines network. Barabasi’s "preferential attachment"
mechanism is nothing more than the familiar dynamics of increasing returns illustrated in a
single urn Polya process or in a generalized several urns Yules process. H. Simon showed that
power laws may emerge as consequences of Yule-type processes (Newman 2010). These
findings are crucially important for economists because they formalize and add analytical content
for already known insights and empirical regularities; particularly for discussions of the new
economic geography and trade theory (as previously noted by A. Marshall, Krugman et al (1999)
among others). This kind of Barabasi network dynamics clearly illustrates the increasing returns
12
and path-dependent processes that Arthur (2015) demonstrated in his works on economic
complexity and technological dynamics.
4- The scale-free complex network of international trade
The first step of our empirical approach is to study the structure of the international world trade
web for the year 2013 (last complete data set available at the Observatory of Economic
Complexity for SITC-4 products). To do so, we begin by investigating the number of links for
each node (countries) in the world trade web; one link represents one product that goes from one
country to another. Our final database, after several filtering procedures to eliminate countries
with missing data, results in a trade network with 101 countries, 762 products classified
according to the Standard International Trade Classification (SITC Revision 2 with 4 digits) and
1,756,224 links between nodes. Each node in the network represents a country that trades a
SITC-4 product and each link represents a trade connection between two countries. The more
links a country has in a given market, the greater its relevance is according to our methodology;
many links mean that a country is able to achieve several other countries in that specific market.
The economic idea we follow using this kind of approach is that a country with many links for
several products reveals comparative advantages proven to be important in those markets. Many
factors exist that can explain these comparative advantages: i) locational advantages in terms of
low freight cost; ii) relatively abundant natural resources; iii) cheap or specialized labor in the
production of certain goods; iv) technological advantages; and so forth.
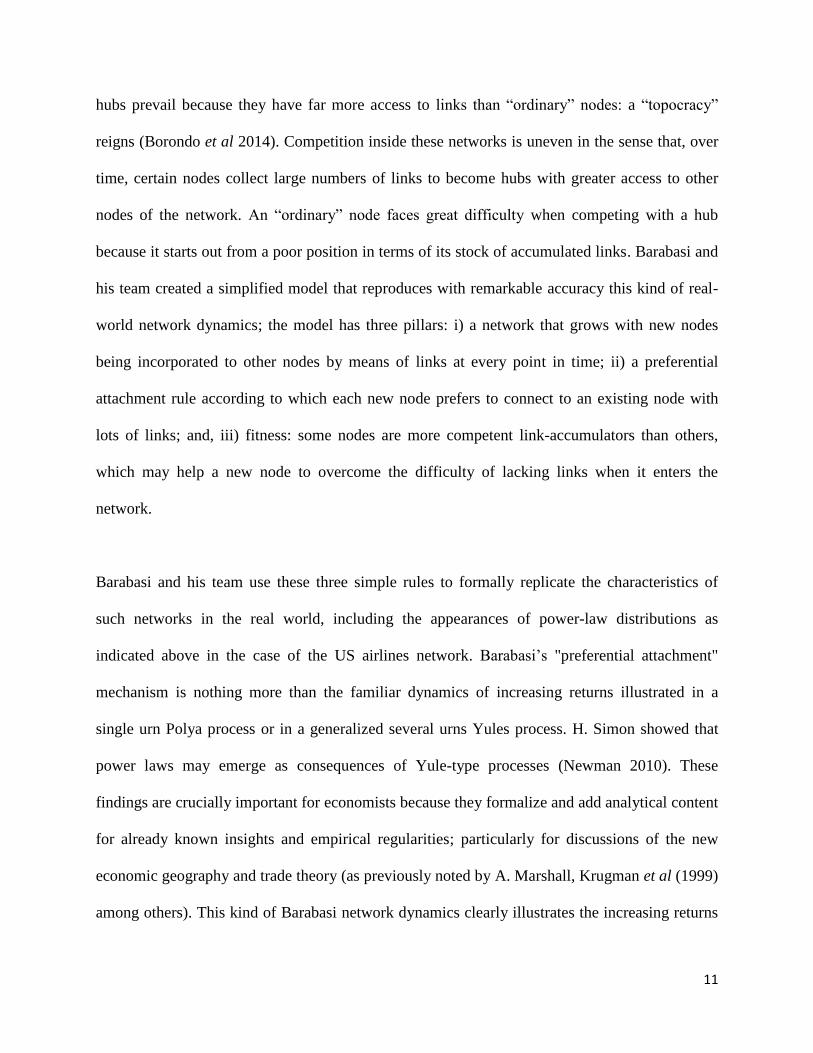
The network below (figure 2) exemplifies the methodology for the world market of blown glass
(top 1 SITC-4 product from the Atlas of Complexity in 2013). This network has 133 nodes
13
(countries) and 962 links which represent products going from country A to country B, measured
by the presence or absence of exports from A to B. The bigger hubs dominate this market, while
peripheral nodes have little relevance and are usually mere recipients of products. The network
plotted below represents a single market for the purposes of enabling a visualization of our
methodology. To get a sense of the world trade network of our complete database one could
multiply the network below by the other 761 products.
Figure 2: World market of blown glass in 2013
Source: elaborated by authors
Identifying trade hubs based on the number of country links brought us newer results when
compared to other works in the literature that measure country’s participation in markets as the
total value of their exports in current dollars relative to total market values (Hausmann et al
2011). This approach also enabled us to run an algorithm to detect the presence of power laws
and hubs in the main global trade network (including all countries and all SITC-4 products) and
14
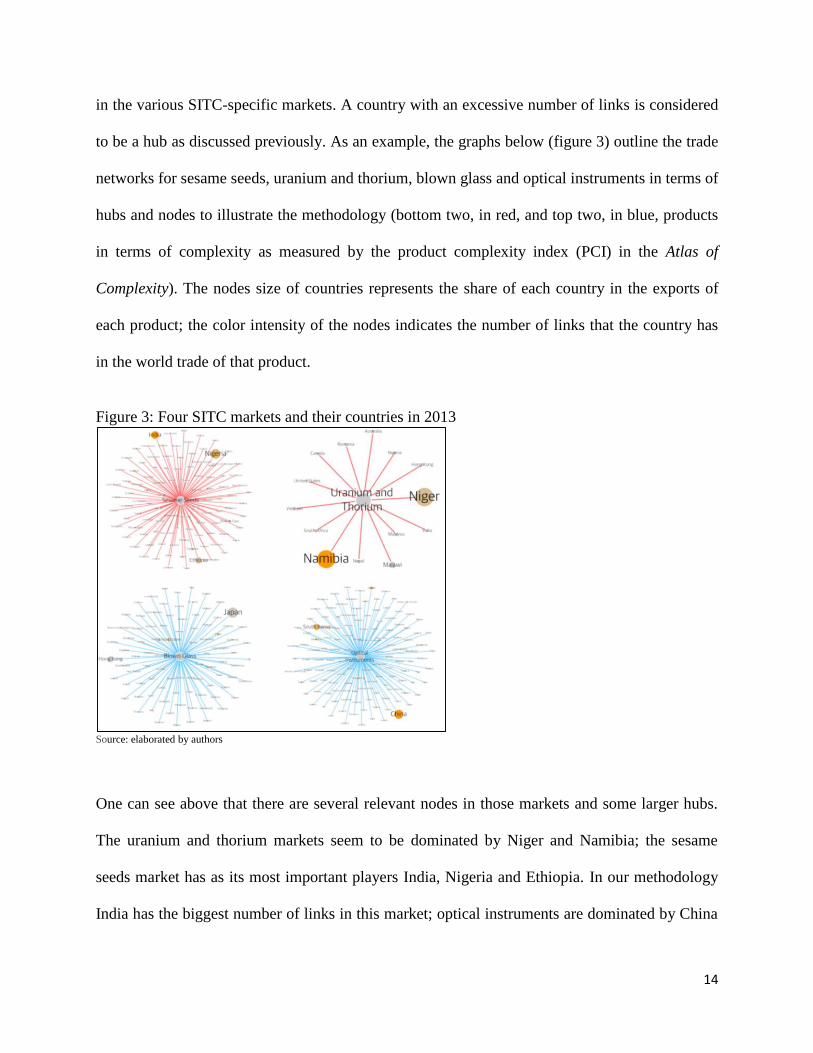
in the various SITC-specific markets. A country with an excessive number of links is considered
to be a hub as discussed previously. As an example, the graphs below (figure 3) outline the trade
networks for sesame seeds, uranium and thorium, blown glass and optical instruments in terms of
hubs and nodes to illustrate the methodology (bottom two, in red, and top two, in blue, products
in terms of complexity as measured by the product complexity index (PCI) in the Atlas of
Complexity). The nodes size of countries represents the share of each country in the exports of
each product; the color intensity of the nodes indicates the number of links that the country has
in the world trade of that product.
Figure 3: Four SITC markets and their countries in 2013
Source: elaborated by authors
One can see above that there are several relevant nodes in those markets and some larger hubs.
The uranium and thorium markets seem to be dominated by Niger and Namibia; the sesame
seeds market has as its most important players India, Nigeria and Ethiopia. In our methodology
India has the biggest number of links in this market; optical instruments are dominated by China
15
and South Korea and blown glass by Japan and Hong Kong. The algorithm for the detection of
power laws in terms of numbers of country links in all markets found a positive result for some
of the SITC-4 products and for the network as a whole (coefficient 2,58). The procedure captures
the distributions of links across markets and calculates power law coefficients using the
"Maximum Likelihood Fitting" method described by Newman (2010):
𝛼 ̂ ≃ 1 + 𝑛 [∑ log (𝑥𝑖
𝑥𝑚𝑖𝑛 − 0,5 )
𝑛
𝑖=1
]
−1
Where 𝛼 ̂ is the power law parameter, n is the number of elements in the array where the data is
contained, 𝑥𝑖 is the value of the variable i in the vector x and 𝑥𝑚𝑖𝑛 is the minimum value of x
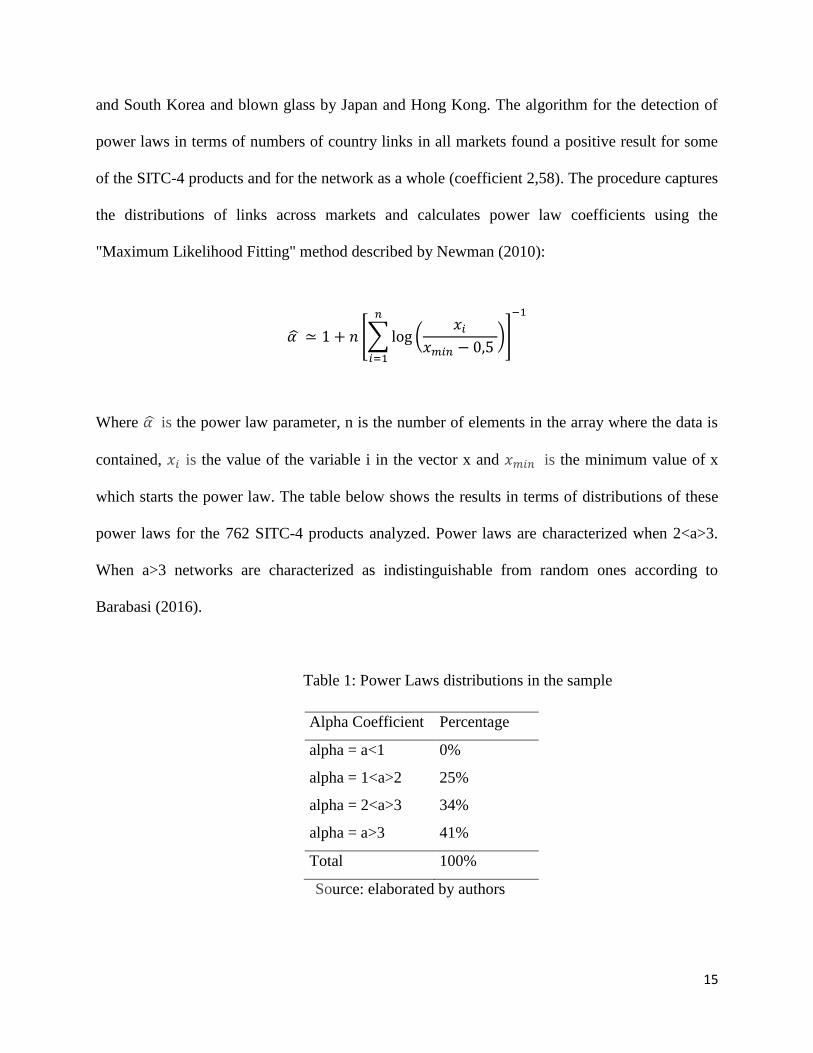
which starts the power law. The table below shows the results in terms of distributions of these
power laws for the 762 SITC-4 products analyzed. Power laws are characterized when 2<a>3.
When a>3 networks are characterized as indistinguishable from random ones according to
Barabasi (2016).
Table 1: Power Laws distributions in the sample
Alpha Coefficient Percentage
alpha = a<1 0%
alpha = 1<a>2 25%
alpha = 2<a>3 34%
alpha = a>3 41%
Total 100%
Source: elaborated by authors

16
According to the table above, none SITC market shows linearity or sub-linearity in the power
law coefficient; meaning that as long as the number of country links increases in this market, the
growth rate in the number of links is less than proportional or proportional to growth. 25% of the
products show super-linearity, that is, when the number of country links grows, they increase
more than proportionally. For power laws with values of the alpha parameter between 2 and 3
results are positive for 34% of the markets in the sample. This shows that for one third of SITC
markets studied here we found relevant hubs in world trade and a scale free pattern. For all these
products and for the network as a whole we find a few countries dominating world trade in terms
of number of links or countries accessed; a result that approaches HHI concentration
measurements for world markets. As an exercise, we found very similar results in terms of the
methodology followed here and HHI kind of measures for markets of soya beans, wheat and
coffee made, for example, by Oladi and Gilbert (2012); further research here seem to be
promising.
Based on the idea of the product complexity indexes (PCI), one can also run an analysis of the
total number of links weighted by the “quality” of the product. The purpose in this case would be
to capture the quality of links of various countries in terms of complexity of products exported.
Thus, if country A has many links in a low-complexity market as measured by a low PCI
(sesame seeds market for example), its productive capabilities will probably be worse than those
of country B with fewer links but in a highly complex market as measured by a high PCI (say,
optical instruments). For the purpose of visualization, the maps below (figure 4) show the links
of Switzerland and Japan (the two top-ranking countries for complexity) and of Mauritania and
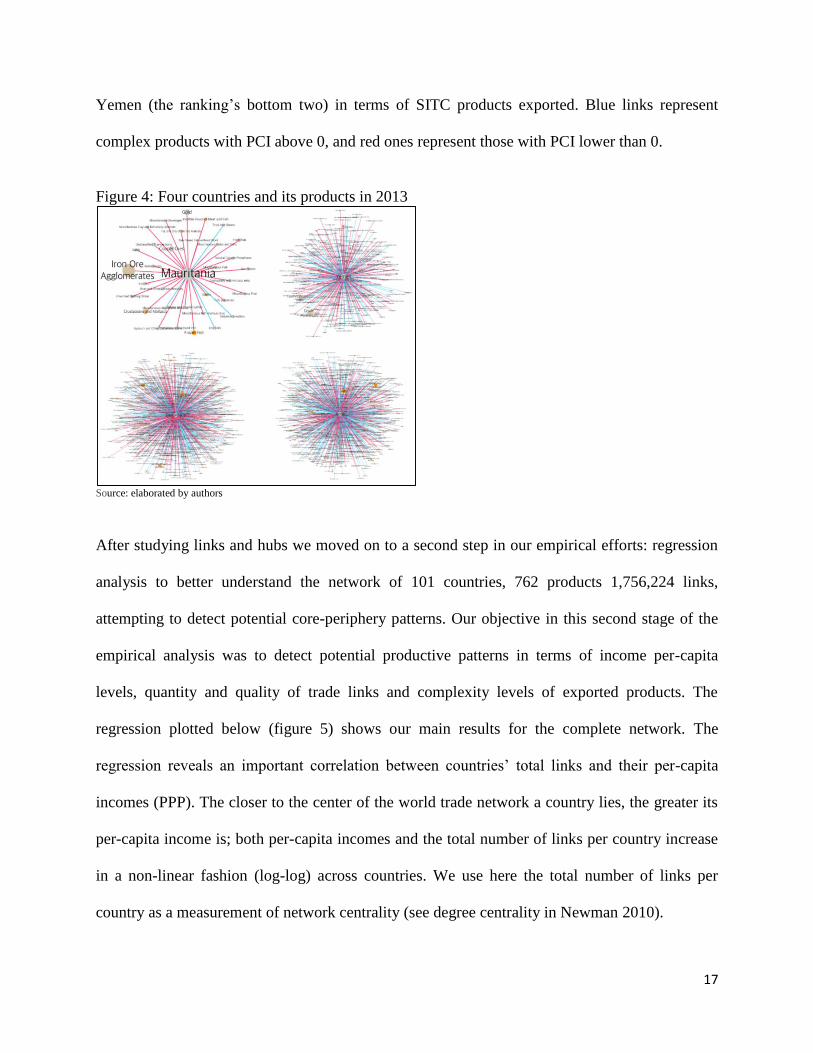
17
Yemen (the ranking’s bottom two) in terms of SITC products exported. Blue links represent
complex products with PCI above 0, and red ones represent those with PCI lower than 0.
Figure 4: Four countries and its products in 2013
Source: elaborated by authors
After studying links and hubs we moved on to a second step in our empirical efforts: regression
analysis to better understand the network of 101 countries, 762 products 1,756,224 links,
attempting to detect potential core-periphery patterns. Our objective in this second stage of the
empirical analysis was to detect potential productive patterns in terms of income per-capita
levels, quantity and quality of trade links and complexity levels of exported products. The
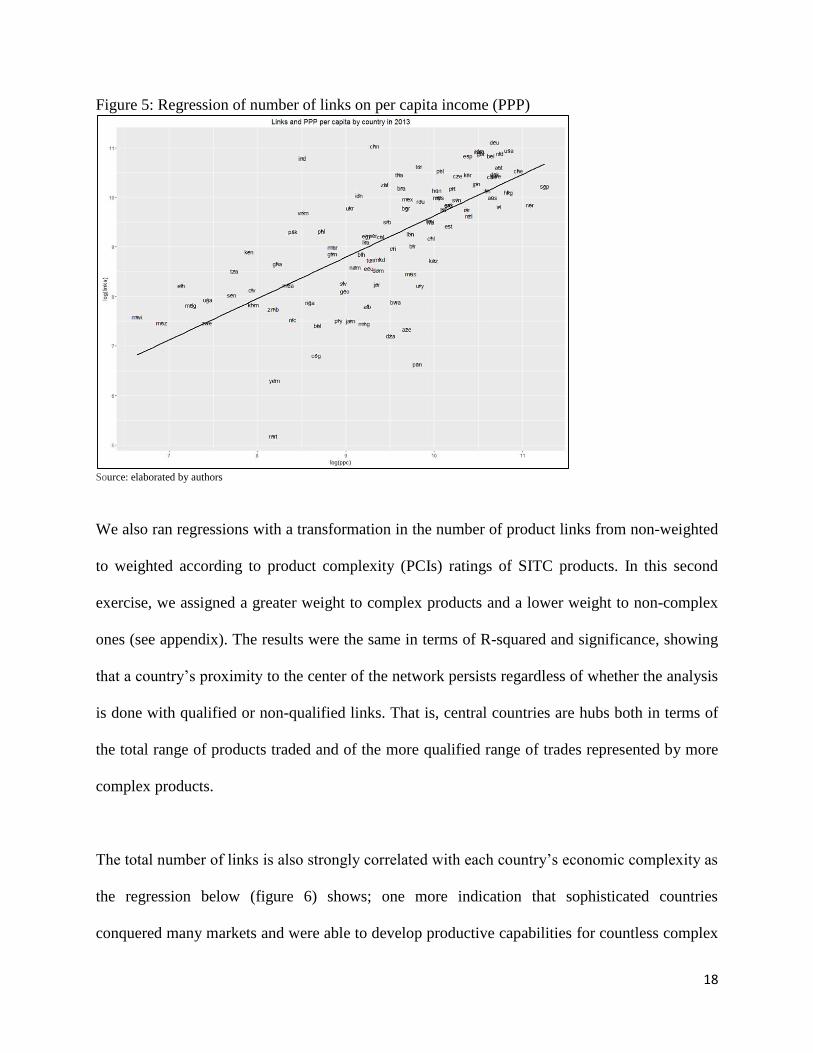
regression plotted below (figure 5) shows our main results for the complete network. The
regression reveals an important correlation between countries’ total links and their per-capita
incomes (PPP). The closer to the center of the world trade network a country lies, the greater its
per-capita income is; both per-capita incomes and the total number of links per country increase
in a non-linear fashion (log-log) across countries. We use here the total number of links per
country as a measurement of network centrality (see degree centrality in Newman 2010).
18
Figure 5: Regression of number of links on per capita income (PPP)
Source: elaborated by authors
We also ran regressions with a transformation in the number of product links from non-weighted
to weighted according to product complexity (PCIs) ratings of SITC products. In this second
exercise, we assigned a greater weight to complex products and a lower weight to non-complex
ones (see appendix). The results were the same in terms of R-squared and significance, showing
that a country’s proximity to the center of the network persists regardless of whether the analysis
is done with qualified or non-qualified links. That is, central countries are hubs both in terms of
the total range of products traded and of the more qualified range of trades represented by more
complex products.
The total number of links is also strongly correlated with each country’s economic complexity as
the regression below (figure 6) shows; one more indication that sophisticated countries
conquered many markets and were able to develop productive capabilities for countless complex
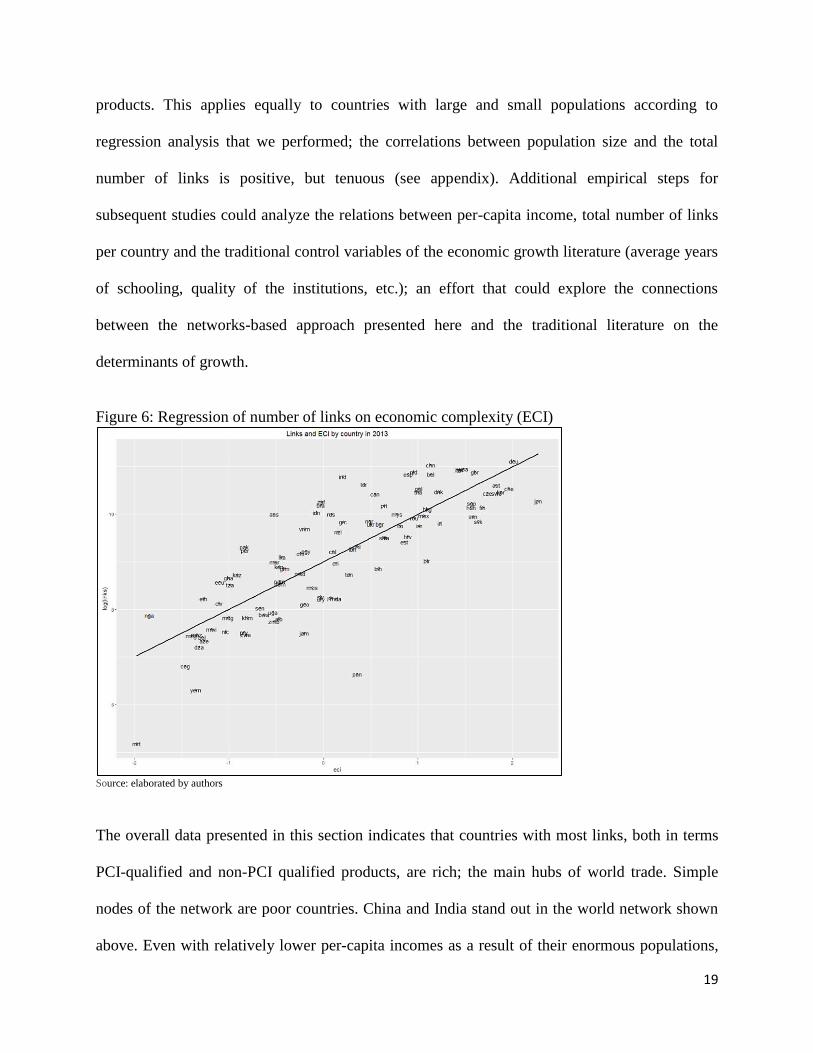
19
products. This applies equally to countries with large and small populations according to
regression analysis that we performed; the correlations between population size and the total
number of links is positive, but tenuous (see appendix). Additional empirical steps for
subsequent studies could analyze the relations between per-capita income, total number of links
per country and the traditional control variables of the economic growth literature (average years
of schooling, quality of the institutions, etc.); an effort that could explore the connections
between the networks-based approach presented here and the traditional literature on the
determinants of growth.
Figure 6: Regression of number of links on economic complexity (ECI)
Source: elaborated by authors
The overall data presented in this section indicates that countries with most links, both in terms
PCI-qualified and non-PCI qualified products, are rich; the main hubs of world trade. Simple
nodes of the network are poor countries. China and India stand out in the world network shown
above. Even with relatively lower per-capita incomes as a result of their enormous populations,
20
they were still able to accumulate a vast number of links; both are also still somewhat behind in
terms of economic complexity in 2013 as compared to rich countries, particularly in the case of
India. The United States, Germany, Japan and South Korea, the “usual suspects”, appear at the
center of the network. They have thousands of highly complex links. These results are in line
with what ECLA authors argued: countries with high per-capita incomes concentrate in
producing and exporting manufactured and complex goods at the center of the network, whereas
those with low per-capita incomes concentrate in producing and exporting non-complex
commodities at the periphery. Rich countries in Europe, North America and Asia are at the
center of the world trade network. Poor countries in Africa, Latin America and Asia are on its
periphery.
As for a criticism and potential problems with our methodology, its main failure probably lies in
using only export data as a proxy for the productive structures of countries. This is, indeed, a
weakness, as we know that certain countries do produce goods that they do not export for a
variety of reasons. Our entire analysis is based on what can be “seen” from world trade data, a
broad, disaggregated, standardized database that goes back to the 1960s. The main advantage of
these trade databases (SITC, HS) rests precisely in the standardization, capillarity and longevity
of the data; their disadvantage lies in not capturing all of each country’s domestic idiosyncratic
features. On the other hand, national accounts databases that include some of those idiosyncratic
aspects have not yet been able to capture the same kind of information with the granularity level
required for the kind of analysis that we do here; these databases usually have fewer productive
disaggregation layers. Another problem with the database we use is the fact that it does not
identify countries that are mere “maquilas”: those that simply import and then export complex
21
products, Mexico being the most notorious case. Schteingart (2014) has an interesting
perspective on qualifying countries’ complexity based on the number of patents per country and
ratios of R&D spending to GDP as an attempt to identify “truly complex” countries, a path that
could be used in the future to improve the network analysis methodology proposed here.
5- Conclusions
To a certain extent the results presented here for the analysis of markets, countries, hubs and
their relation to economic and product complexity were expected; the empirical analysis of the
Atlas of Complexity already pointed in this direction, though not using a scale-free network
approach. The Atlas basic regressions are on countries’ per-capita income and complexity, using
the literature’s traditional control variables. Here we followed the path of detecting hubs and
scale-free properties in each market’s network and in the overall world trade network. The
results appear quite promising in the sense of demonstrating new and important empirical
content for old economic ideas. This paper’s novelty lies in specifically analyzing market
structures for each SITC-4 product and for the global trade web using network science
techniques.
From the complex networks perspective adopted here we may now argue that each country’s
ability to collect trade links depends on its productive capabilities. The more complex countries
being able to collect many higher-quality links (as measured by PCI) as time went by. The
historical process that led to the picture of the world-trade network in 2013 that we present here
took place in an environment full of increasing returns, a world of power laws. In such an
environment, countries that have already collected many links can easily collect more on the
22
margin. Countries that have collected few links face greater difficulty getting ahead.
Breakthroughs from the few low-quality links status to a many high-quality links situation are
feasible, but extremely difficult to accomplish. A potential topic for further research based on the
approach presented here might involve dynamic analyses of the world trade network using
complexity measures.
Serrano and Boguñá (2003) arrive at similar conclusions about the scale-free characteristics of
the world trade network that we presented in this paper. Our work here is different because we
incorporate into the empirical investigations advances from Hidalgo et al (2007), Hausmann et al
(2011) and Hidalgo and Hausmann (2011) regarding complexity measurements for the world
trade network. This paper thus provides a new analysis for the topology of the world trade
network, taking into account recent findings in economic complexity investigations. The
empirical results that we report here based on computational and network-science methodologies
point in the direction of ECLA and structuralist economists’ arguments.
The hub and links analysis performed indicate that the “rich center” of the world trade network
features a productive structure that specializes in producing and exporting complex, sophisticated
and industrialized goods whereas the “poor periphery” of the scale-free complex world trade
network has a productive structure focused on producing and exporting less complex goods
(commodities). This kind of topology of the world trade network can be seen in the correlations
found between economic complexity levels (ECI) and total links per country. Following ECLA,
therefore, we could conclude that economic development will continue to be a very difficult task
23
for poorer countries unless they are able to transform their productive structure in the direction of
producing and exporting more complex goods.
References
Abbate, A., Benedicts, L., Fagiolo, G., Tajoli, L., (2013) “The International Trade Network in
Space and Time, SSRN Electronic Journal, April
Arthur, W., B. (2015), Complexity and the Economy, Oxford University press, New York.
Barabasi, A.L. (2002) Linked: How Everything Is Connected to Everything Else and What It
Means for Business, Science, and Everyday Life, Basic Books ed. NY
Barabasi A.L., (2016) Network Science, http://barabasi.com/networksciencebook/
Barigozzi, M., Fagiolo, G., Garlaschelli, D., (2010) “Multinetwork of international trade: A
commodity-specific analysis, Physical Review E, April
Bianchi, A.,M., and Salviano, C. Jr (1999) “Raul Prebisch and the beginnings of the Latin
American School of Economics: a rhetorical perspective”, Journal of Economic Methodology,
Volume 6, Issue 3, 1999 pages 423-438 DOI: 10.1080/13501789900000026
Bresser-pereira, L.C., (2014), A construção política do Brasil, editora 34, São Paulo, Brazil
Bresser-pereira, L.C., (2016), “Reflecting on new developmentalism and classical
developmentalism”, Revista de Economia Política, vol. 36, nº 2 (143), pp. 237-265, abril-
junho/2016
J. Borondo, F. Borondo, C. Rodriguez-Sickert, C. A. Hidalgo (2014), “To Each According to
its Degree: The Meritocracy and Topocracy of Embedded Markets”, Scientific Reports 4,
Article number: 3784 doi:10.1038/srep03784
Chang, H.,J., (2003), Rethinking Development Economics, Ha-Joon Chang (ed.), Anthem Press,
London
Cristelli M, Gabrielli A, Tacchella A, Caldarelli G, Pietronero L (2013) “Measuring the
Intangibles: A Metrics for the Economic Complexity of Countries and Products”, PLoS ONE
8(8): e70726. doi:10.1371/journal.pone.0070726
Deguchi, T., Takahashi, K., Takayasu, H., Takayasu M. (2014) “Hubs and Authorities in the
World Trade Network Using a Weighted HITS Algorithm”, PLOS ONE 9(7): e100338.
doi:10.1371/journal.pone.0100338
Felipe, J., Kumar, U., Abdon, A., Bacate, M. (2012), “Product complexity and Economic
Development”, in Structural Change and Economic Dynamics, June
24
Fagiolo. G., Reyes,J., Schiavo. S., (2008) “The Evolution of the World Trade Web. A Weighted-
Network Analysis”, Journal of Evolutionary Economics August, Volume 20, Issue 4, pp 479-514
Foster, J., (2005) “From simplistic to complex systems in economics”, Cambridge Journal of
Economics 29, 873–892, doi:10.1093/cje/bei083
Hausmann, R.; Hidalgo, C.A.; Bustos, S.; Coscia, M.; Chung, S.; Jimenez, J.; Simões, A.;
Yildirim, M. A. (2011) The Atlas of Economics Complexity – Mapping Paths to prosperity.
Puritan Press
Hidalgo, C. (2015) Why information grows: the evolution of order, from Atoms to Economies,
ed. Basic Books, NY
Hartmann, D., Guevara, M.R., Jara-Figueroa, C., Aristarán, M. Hidalgo, C.(2015), “Linking
economic complexity, institutions and income inequality”, arXiv:1505.07907 [q-fin.EC]
Hidalgo, C; Hausmann, R. (2011) “The network structure of economic output”, Journal of
Economic Growth, 16(4), pp. 309-42
Hidalgo, C. A., Klinger, B, Barabasi, A., L., and Hausmann, R., (2007) “The product space
conditions the development of nations”, Science 27 july: 317 (5837), 482-487.
Doi:10.1126/science.1144581
Johnson, N., F., (2007), Simply Complexity, a clear guide to complexity theory, Oneworld
publications, Oxford
Kaldor, N., (1966) “Causes of the slow rate of economic growth of the United Kingdom”, in:
Further Essays On Economic Theory, New York, Holmes & Meier Publisher.
Kattel, R. and Reinert, E., (2009) “The relevance of Ragnar Nurkse and classical development
economics,” The other canon foundation and Tallinn university of technology working papers in
technology governance and economic dynamics n21
Kattel, R. and Reinert, E., (2010) “Modernizing Russia: round iii. Russia and the other bric
countries: forging ahead, catching up or falling behind?”, The Other Canon foundation and
Tallinn university of technology working papers in technology governance and economic
dynamics n32
Krugman, p., Fujita, and Venables (1999) The Spatial Economy, cities regions and international
trade, Mit Press
Lall, S, Weiss, J., and Zhang, ., (2005) “The ‘sophistication’ of exports: a new measure of
product characteristics”, ADB Institute Discussion Paper No. 23
Newman, M.E.J., (2010) Networks, an introduction, Santa Fe Institute, Oxford University Press
25
Oladi, R., and Gilbert, J. (2012) “Buyer and Seller Concentration in Global Commodity
Markets”, DOI: 10.1111/j.1467-9361.2012.00667.x, Review of Development Economics, Volume
16, Issue 2, pages 359–367, May 2012
Palma, G., (2010) “Why has productivity growth stagnated in most Latin American countries
since the neo-liberal reforms?” May, Cambridge Working Papers in Economics n1030
Reinert, E., (2010) “Developmentalism,” The other canon foundation and Tallinn University of
technology working papers in technology governance and economic dynamics n34
Reinert, E. (2008) How rich countries got rich and why poor countries stay poor, Ed. Public
Affairs
Reinert, S. (2011), Translating Empire, Emulation and the Origins of political economy, Harvard
University Press
Rocha, I., L. (2015), "Essays on Economic Growth and Industrial Development: A comparative
analysis between Brazil and South Korea", PhD Thesis, University of Cambridge.
Rosvall, M. and Bergstrom, C. (2008) “Maps of random walks on complex networks reveal
community structure,” Proceedings of the National Academy of Sciences 105, 1118
Schteingart, D. (2014) “Estructura productivo-tecnológica, inserción internacional y desarrollo”,
Tesis de Maestría en sociología económica, Idaes-Unsam, Buenos Aires
Serrano, A. and Boguñá, M. (2003) “Topology of the world trade web”, Physical Review E 68,
015101(R), July
Sinha, S., Chatterjee, A., Chakraborti, A., Bikas K. (2010) Econophysics: An Introduction, 1st
Edition, Wiley-VCH
Thirlwall, A. P. (1979) “The balance of payments constraint as an explanation of international
growth rates differences”, Banca Nazionale del Lavoro Quarterly Review, v. 128
26
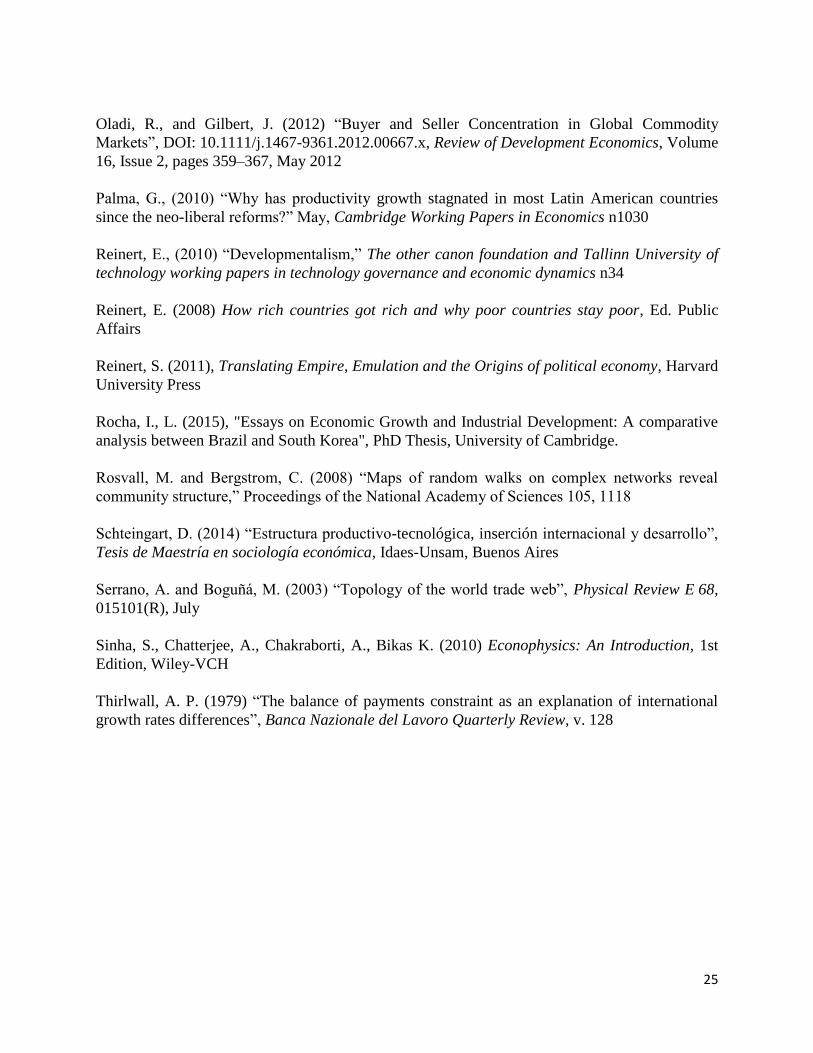
Appendix
Regressions
ppc – per capita income PPP (2013)
eci – economic complexity index (2013)
link_p – adjusted total links links – non adjusted total links
Database http://atlas.media.mit.edu/en/resources/data/


![[ECFR] Periphery of the Periphery-Crisis and the Western-Balkans-Brief](https://img.pdfslide.net/doc/110x75/577cdcad1a28ab9e78ab1b9d/ecfr-periphery-of-the-periphery-crisis-and-the-western-balkans-brief.jpg)