Embed Size (px)
Citation preview

Safety Performance of Priority
Three Leg Intersections –
Seagulls and Left Turn Slip
Lanes
Submitted to
AITPM Conference
July 2016

Presentation Overview
• Reason for research
• NZ and overseas research
• Dataset size
• Predictor variables
• Crash modelling results

Reason for Research
• There has been a history of poor crash performance at some seagull intersections – in some jurisdictions this concern means that there is a reluctance to use this intersection option despite the efficiency benefits.
• There are concerns that some left turn slip lane treatment designs may increase crash risk especially where the left turn in and right turn out movements are high – the international research is not conclusive that left turn slip lanes improve road safety.
• There is limited research available on the safety performance of high volume priority T-intersections – the crash prediction models manly cover lower traffic volumes sites where the entering traffic has plenty of gaps in the main traffic flow. It would be useful to understand the contribution of design factors, main road speed and traffic flows on crash occurrence.
• Key outcome is to expand the current NZ crash prediction models for this intersection type to include seagull layouts and LTSLs
Current Knowledge – NZ Studies
• Crash prediction models are available for both urban (low speed) and rural (high speed – 80km/h plus) priority intersections
• These models are presented in the NZTA Economic Evaluation Manual as a Compendium to the Crash Analysis Section (this is the Crash Estimation Compendium)
• Basic product of flow models (total crashes as function of daily two way traffic on each road) are available for both urban and rural Tees.
• AT = b0 × Qmajorb1 × Qminor/side
b2
• For rural tees conflicting flows models are also available for each major crash type. These models also include non-flow predictors, including operating speed, visibility and presence of right turn bay (RTB).
• AT = 1.08 × 10⁻⁶ × q40.36 × q5
1.08× ΦRTB
• ΦRTB = 0.22 (if right-turn bay present)

Local Literature – Arndt and Turner
• Arndt 2005 - Key Variables (143 T-intersections + 63 X-roads)• Visibility between minor and major road vehicles
• Visibility between right turners and through vehicles on main road
• Minor and Major road approach speeds (85%ile)
• Number of lanes on side-road
• Right turn provision – widening to RTB
• Observation angle SKEW (degree at which drivers have to look backwards)
• Turner 2007 – Key Variables (100 Rural T-intersections)• Visibility from side-road
• Approach speed on main road
• Presence of RTB

Literature - Seagulls
• Radalj, et al., (2006) analysed 76 seagull intersections in Perth. The study identified that seagull intersections • installed as per the recommended guidelines, do not result in any
significant (positive or negative) change in the type or number of crashes.
• installed with a seagull entry angle that did not conform to the recommended guidance (55 to 70 degrees), had more crashes and higher crash severity, especially the latter.
• Elvik, et al., (2009) based on a review several European and USA studies has concluded that chanelised passing lanes at T-junctions (seagull equivalent) increases the crash risk by 26%.
• Summersgill, et al., (1996) investigated the frequency and character of crashes at priority intersections in the UK. They found an increase in ‘JA’ crashes of 50% at chanelised intersections.

Literature - Seagulls
• Harper, et al., (2011) researched the safety performance of three design variations of a seagull intersection design for the A1 Highway / Island Point Road intersection in New South Wales, Australia.
• After the seagull intersection was constructed a number of ‘right near’ (JA) type crashes began to occur.
• The intersection was modified to include a short left turn splay (LTSL) that included a small raised concrete splitter island and priority control. This did not reduce JA crashes but increased LB crashes (from 2 to 6 injury crashes per year).
• A final modification increased separation between the left-turn deceleration lane and the straight through lane of the major road. After which the crashes reduced appreciably (I per year).
Literature - LTSLs
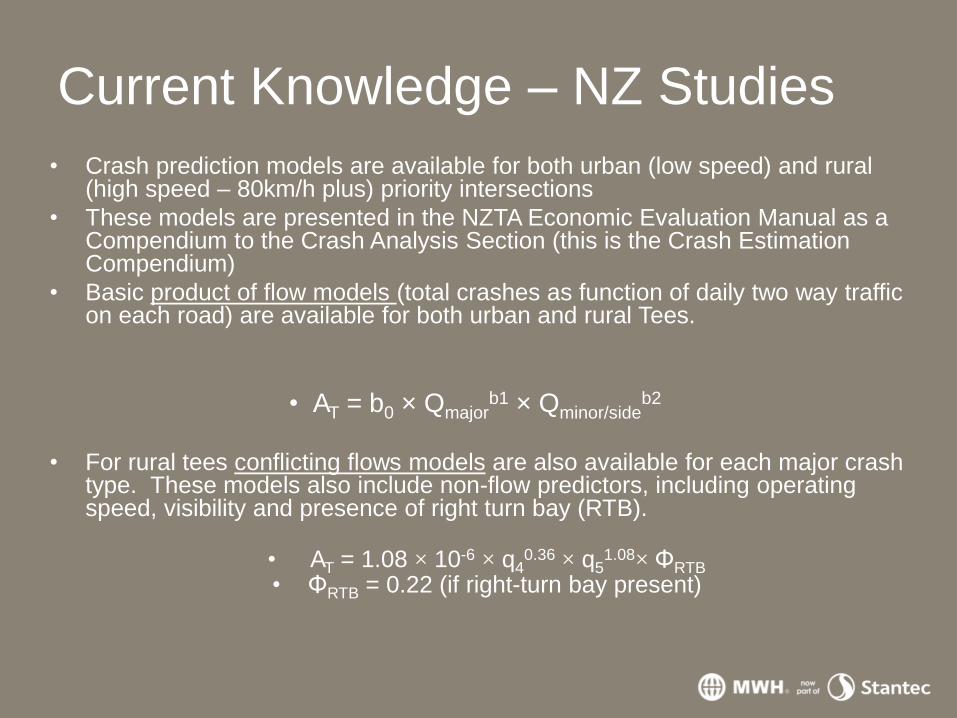
• Research undertaken by Ale et al (2013) identified that the provision of left turn lanes reduces the incidence of rear-end crashes, the crash severity and the associated economic costs.
• Elvik et al (2009) identified from several studies that the provision of left turn lanes at T-junctions acts to increase the number of injuries by 12%.
• They reasoned that left turn lanes may create blind spots where a vehicle turning left can obscure approaching through traffic.
• They also added that large scale intersection channelisation can complicate the road layout, which may increase driver error and in particular cause more severe ‘JA’ crashes.
• Highway Safety Manual (ASSHTO) shows a crash reduction
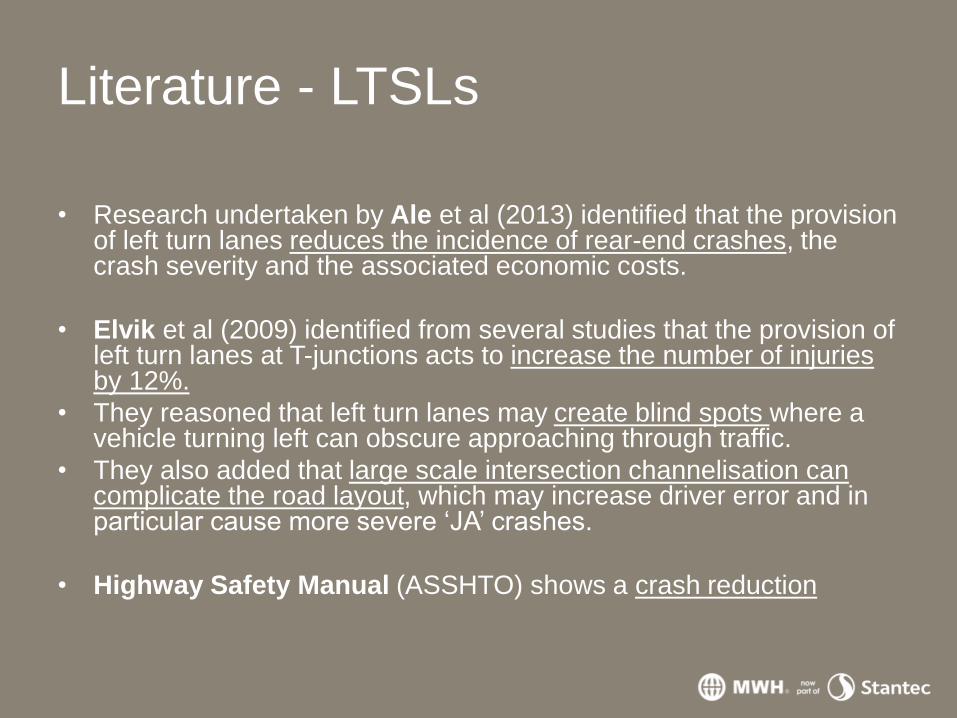
Datasets
Intersection Type Urban Rural
Standard Tees 92 92
Seagulls 17 12
Tees with LTSL 10 37
TOTAL 119 141

T-Junction Crash Types
Rural
Urban
JA Crashes34%
LB Crashes3%
10%
53%
Rural T-Junction Crashes
JA Crashes LB Crashes GD Crashes Other Crashes
JA Crashes21%
LB Crashes17%
4%
58%
Urban T-Junction Crashes
JA Crashes LB CrashesGD Crashes Other Crashes

Rural Intersections
JA Crashes24%
LB Crashes24%
15%
37%
Rural T-Junction LTSL (37)
JA Crashes LB CrashesGD Crashes Other Crashes
JA Crashes50%
LB Crashes37%
0%
13%Rural Seagulls
JA Crashes LB CrashesGD Crashes Other Crashes
JA Crashes34%
LB Crashes3%
10%
53%
Rural T-Junction Crashes (92)
JA Crashes LB Crashes GD Crashes Other Crashes

Urban Intersections
JA Crashes31%
LB Crashes15%
8%
46%
Urban T-Junction LTSL (10)
JA Crashes LB CrashesGD Crashes Other Crashes
JA Crashes33%
LB Crashes22%
0%
45%
Urban Seagulls (17)
JA Crashes LB CrashesGD Crashes Other Crashes
JA Crashes21%
LB Crashes17%
4%
58%
Urban T-Junction Crashes (92)
JA Crashes LB CrashesGD Crashes Other Crashes

Crash Prediction Model
JA crashes at standard urban T-Junctions
Crashes = 6.760 × 10⁻¹² × 𝑄10.19 × 𝑄5
0.23 × 𝑀𝑅𝑆𝐿3.8 × 𝑈𝐽𝐴𝐷𝐼2.9
Where, 𝑄1 = Right turn from side road
𝑄5 = Right to left movement on main road
MRSL= Main Road Speed Limit
UJADI = Design index (seven features)
Model does not fit without design index

Key Variables
Flows
Intersection Size
• No. through lanes
• Side Road approach lanes
• Side Road median
Distractions/Pressure
• Right turn bay stacking length
• Type of feature
• Distance to feature
Speed Limits (50, 60, 70, 80, 100)
Geometry
• Main Rd Gradient
• Seagull entry splitter island length
• LTSL Distance to diverge
• LTSL Offset

JA Crash Models –Urban Tee
1. More traffic and higher speeds less
safe
2. Bigger Intersections less safe
3. Features (parking and side-roads) to
the left cause distraction
4. Seagulls - more crashes where wider
main road median

LB Crash Models – Urban Tee
1. More traffic and higher speeds less
safe
2. Bigger Intersections and parking on
RT approach are less safe
3. Longer splitter island length is safer
4. Late left turns are safer at
Seagulls than early left turns
(removes confusion?)

Urban Model Factors EXPOSURE | SPEED | VISIBILITY |
DISTRACTION | SIZE | COMPLEXITY
Factors - Model Standard
JA
Standard
LB
Seagull JA Seagull LB
Conflicting Flows X X X X
MRSL X X X X
No Through lanes X X X X
No Approach Lanes X X X X
Distance to Feature X X X X
SR LT Control Type X
MR Median Width X X
SR Median Width X
SR Median (Y/N) X X
Seagull entry splitter
length
X
MR gradient X X
LTSL Distance to diverge X

JA Crash Models – Standard Rural Tee
1. More traffic and higher speeds less
safe
2. Bigger Intersections less safe
3. Features (side-roads) to the left
cause distraction
4. More crashes where longer right turn
bay (more right turners)
5. Side road gradient is less safe

JA Crash Models – Rural Seagull or LTSL
1. More traffic and higher speeds less
safe
2. Seagulls less safe when 4-lanes,
wider median and RT stacking
3. Poor left turn lane off-set reduces
visibility and increases crashes
4. Late left turn drop safer for LTSL
5. Features (side-roads) to the left
cause distraction when LTSL
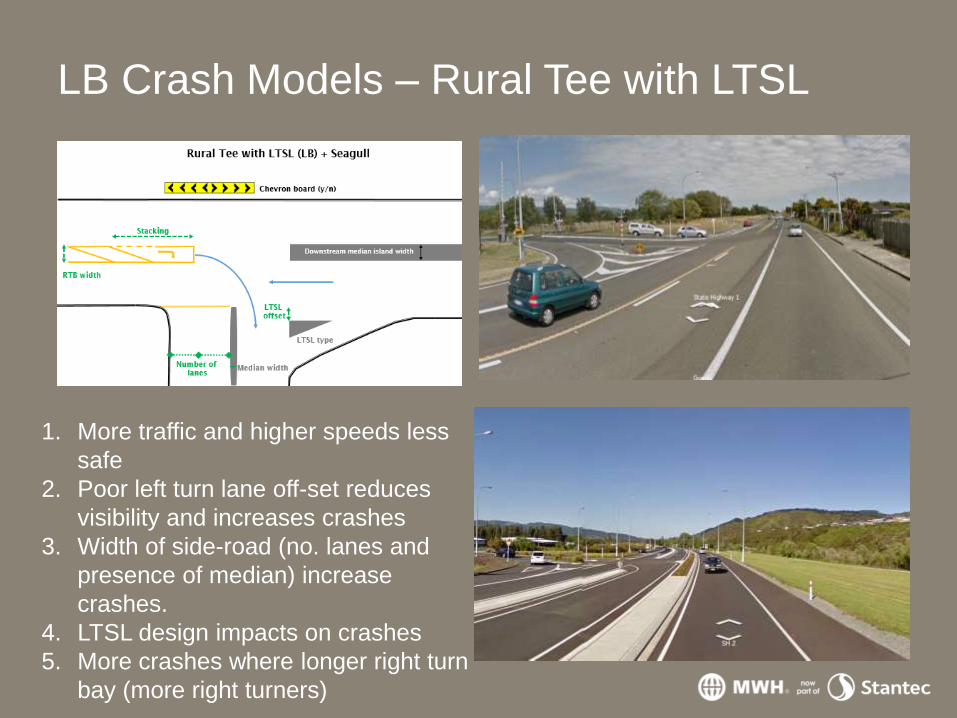
LB Crash Models – Rural Tee with LTSL
1. More traffic and higher speeds less
safe
2. Poor left turn lane off-set reduces
visibility and increases crashes
3. Width of side-road (no. lanes and
presence of median) increase
crashes.
4. LTSL design impacts on crashes
5. More crashes where longer right turn
bay (more right turners)

Rural Model Factors EXPOSURE | SPEED | VISIBILITY |
DISTRACTION | SIZE | COMPLEXITY
Factors - Model Standard JA LTSL JA LTSL LB Seagull JA Seagull LB
Conflicting Flows X X X X X
MRSL X X X X X
No. Through lanes X Limited
data
Limited data X X
LTSL Offset (Visibility
past LT)
N/A X X X X
Distance to Feature X X
MR Median Width Limited data Limited
data
Limited data X X
RTB Stacking Length X X X
Chevron Board (Y/N) X X
LTSL Type N/A X X
Number of other factors 2 3 3 3 0

Areas of Refinement
• Explore further the impact of wide medians on seagull performance – may be related to RT bay entry angle
• Examine wet weather and night crash percentages. Also look at time of crashes (in peaks?)
• Rural Tees – why is feature upstream an issue for Rural JA’s. Is it distraction/less attention to right turn traffic or is it the complexity of a staggered intersection?
• All the design index variables are currently weighted the same. Need to consider more weight on stronger design variables.
• Consider bias by selection (eg chevron boards & side road medians are often installed at high crash risk sites).
Questions?