Embed Size (px)
Citation preview

ENTER 2015 Research Track Slide Number 1
Transportation Mode Annotation of Tourist GPS
Trajectories under Environmental Constraints
Hidekazu Kasahara, Mikihiko Mori,
Masayuki Mukunoki, and Michihiko Minoh
Kyoto University, Japan
http://www.mm.media.kyoto-u.ac.jp/en/members/hidekazu-
kasahara

ENTER 2015 Research Track Slide Number 2
Agenda
• Motivation
• Purpose
• Previous Work
• Problems
• Proposed Method
• Experiment & Evaluation
• Discussion
• Future Work & Conclusion

ENTER 2015 Research Track Slide Number 3
Motivation
• DMOs want to know the tourists’ activities.
– Policy making / destination marketing strategy. • Optimum deployment of transportation.
• Outdoor ads / direction boards.
Spot B
Spot ABus
1,000 tourists
Taxi
10 tourists
Ads on bus is more effective
than those on taxi in this route.
Accurate transportation usage
statistics is necessary for DMOs
for the decision making.
The traditional stats is costly.

ENTER 2015 Research Track Slide Number 4
Purpose of Study
• Annotating transportation mode from tourists’
GPS trajectory (x, y, t).
• Modeling the tourists activity as a chain of
transportation modes.
• Transportation usage statistics is calculated from
these chains of transportation modes.
• In addition, tourists’ personal preferences can be
explored from the chains.
Walk 60 min. Bus 20 min.Bus 20 min.Walk Walk
5 min.Train 20 min.

ENTER 2015 Research Track Slide Number 5
Scope of Study
• Tourists move by foot and public transportation.
– Train, route bus and taxi as public transportation.
– Tour bus, bicycle, motor-bike and hire car are out of
scope.
• Destinations that include numerous locations of
interest, such as Milano.
• Only GPS.
– Acceleration meter is out of scope.

ENTER 2015 Research Track Slide Number 6
Previous Work
• Approaches using tourist moving physical features.
– Speed: Decision tree (Aoki 2008, Zheng 2010).
– Baysean network (Stenneth 2011).
– Hierarchical CRF (Liao 2007).
– SVM (Bolbol 2012).
– Acceleration: Adaptive boosting (Hemminki 2013).
– Regression analysis (Furukawa 2014).
• Approach using environmental factors.
– Assumption on typical tourist travel patterns (Stopher 2008).
– Bus stops and road network (Liao 2007).
– Land utilization situation (Yan 2013).

ENTER 2015 Research Track Slide Number 7
Transportation Mode Estimation
using Tourist Speed
Yellow points shows
deceleration at bus stops
and crossings.
Station
Temple
Castle
Train
Golden Pagoda
Yellow: Under 1km/hour
Black : 1-60 km/hour
Red : Over 60 km/hour
These decelerations are
estimated as walk / retain
modes using by speed.
GPS Trajectory
1km

ENTER 2015 Research Track Slide Number 8
Annotation using
Environmental Constraints
bus bus train train train bus
p1p2 p3
p4p5 p6
Estimate using Tourist Features
(Speed)
• In physical space, there are
some environmental constraints
restrict transportation usage.
– Environmental constraints.

ENTER 2015 Research Track Slide Number 9
Annotation using
Environmental Constraints
Environmental Constraints :
All 6 Points Are on a Bus Route
Not on a railway.
Estimate using Tourist Features
(Speed)
• In physical space, there are
some environmental constraints
restrict transportation usage.
– Environmental constraints.bus bus train train train bus
p1p2 p3
p4p5 p6

ENTER 2015 Research Track Slide Number 10
Annotation using
Environmental Constraints
Environmental Constraints :
All 6 Points Are on a Bus Route
Not on a railway.
Estimate using Tourist Features
(Speed)Inconsistency
• In physical space, there are
some environmental constraints
restrict transportation usage.
– Environmental constraints.
• In the case when the estimation
with tourist moving features is
failed, there is regional
inconsistency with
environmental constraints.
bus bus train train train bus
p1p2 p3
p4p5 p6

ENTER 2015 Research Track Slide Number 11
Problem
• The system failed to estimate car and train
as retain or walk modes when they
decelerate or stop in case the system use
only tourist features (speed).
• Examples of deceleration:
– Route bus decelerates at all bus stop along the
route.
– Train decelerates at stations on the railways.

ENTER 2015 Research Track Slide Number 12
Proposed Method
• Using the environmental constraints,
decrease the inconsistency between the
estimate using tourist features (speed) and
environmental constraints.
• Annotate the transportation modes with
the least inconsistency in total.
• We evaluate the proposed methods
compared with human labeling.

ENTER 2015 Research Track Slide Number 13
Proposed Method
Output : GPS Trajectory Consists of (x, y, time, speed)
• Environmental
constraints
• SpeedOutput: Fragmented Segments
Output: Merged Segments with the least inconsistency in total
• Interleave
• Continuity
• Filtering
• Speed calculation
Technique
�� �� �� �� ��
�� �� �� ����
�� ��� ��
�� �� ��
Preprocess
Stage 1
Stage 2
ENTER 2015 Research Track Slide Number 14
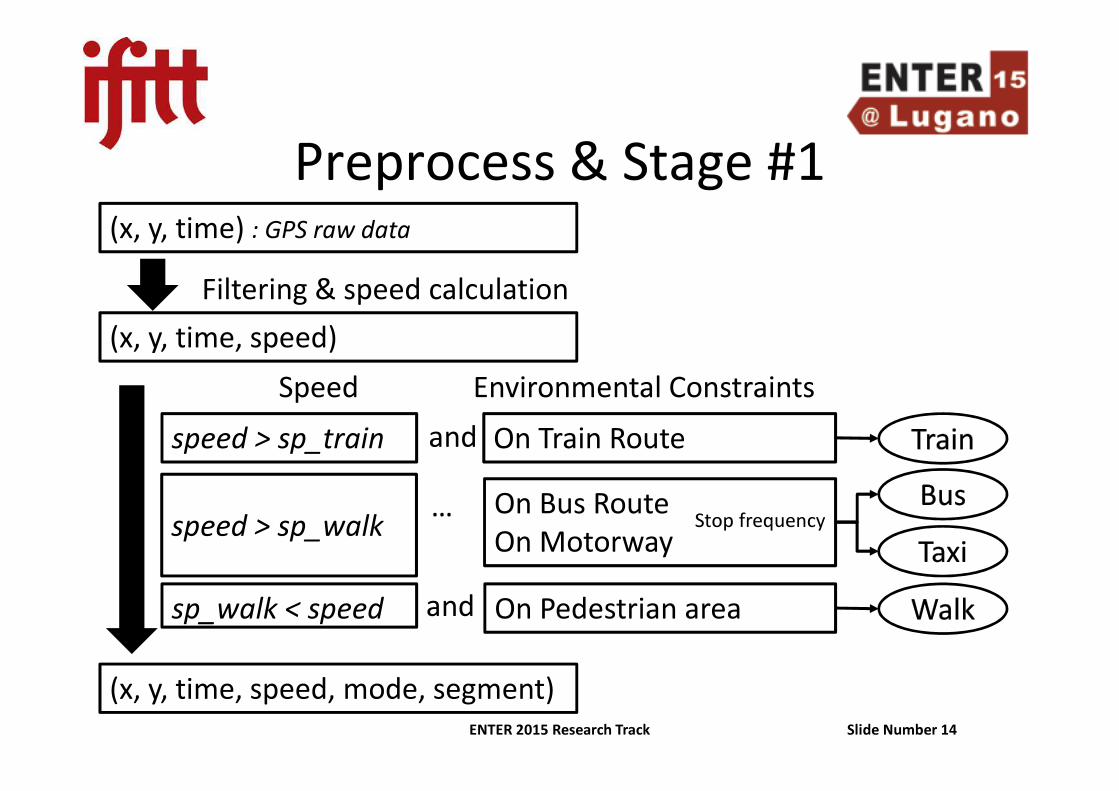
Preprocess & Stage #1(x, y, time) : GPS raw data
(x, y, time, speed)
Filtering & speed calculation
On Train Route
On Bus Route
On Motorway
On Pedestrian area
(x, y, time, speed, mode, segment)
speed > sp_train
Speed Environmental Constraints
sp_walk < speed
speed > sp_walk
and
and
…Stop frequency

ENTER 2015 Research Track Slide Number 15
#2 Stage: Segment Merger
• Interleave Assumption:
Tourists do not change
“train to car” or
“car to train” directly.
• Continuity Assumption:
Tourists typically do not
change the transportation
mode over a short period.
Bus
Taxi
Walk
Bus
Never Directly
Connected
Too short to change

ENTER 2015 Research Track Slide Number 16
Experiment
• Dataset
– 16 persons’ GPS trajectory data from students
and teachers who travelled.
• Destination : Kyoto
• 160,130 points in total.
• GPS measures location per 1 second.
• From 8:00 to 18:00.

ENTER 2015 Research Track Slide Number 17
Screening Value
• sp_walk = 2 metres per second.
– The screening value between walk and bus/taxi.
• sp_train = 15 metres per second.
– The screening value between bus/taxi and train.
• ����� = 10%
– The screening value of stop frequency between bus
and taxi. (Route bus stops more frequent than taxi.)
• Interleave = 240 seconds
– If the length of segment is under 240 seconds, the
segment is merged to next or before segment

ENTER 2015 Research Track Slide Number 18
Environmental Constraints• Data is supplied as shape files.
Bus Route
(Gov. data)
Train Route(COTS)
Motorway(COTS)
Pedestrian Zone
(Gov. data)

ENTER 2015 Research Track Slide Number 19
Results of the Experiment
Bus Taxi Train WalkTotal
count
Bus82.8%
(15,601)
17.5%
(1,413)
0.0%
(0)
4.5%
(5,817) (22,831)
Taxi6.1%
(1,158)
60.1%
(4,847)
10.6%
(529)
0.3%
(371)(6,905)
Train0.2%
(30)
0.3%
(21)
77.3%
(3,869)
1.3%
(1,620)(5,540)
Walk10.9%
(2,048)
22.1%
(1,779)
12.2%
(609)
93.9%
(120,418)(124,854)
Total
count
100.0%
(18,837)
100.0%
(8,060)
100.0%
(5,007)
100.0%
(128,226)
90.4%
(160,130)
Estimate
Actual

ENTER 2015 Research Track Slide Number 20
Comparison
Bus Taxi Train WalkTotal
Proposed 82.8% 60.1% 77.3% 93.9% 90.4%
SVM
*1) 88.9 % 78.9% 67.1% 67.7% 75.2%
Speed without
environmental
constraints
*2)*3)
44.3% 2.5% 49.2% 99.1% 86.2%
Method
Mode
*1) Result of 5-fold cross validation on the same data set
*2) Bus route constraints are used for bus / taxi estimation.
*3) The universe is biased to “walk” mode.

ENTER 2015 Research Track Slide Number 21
Discussion
• Automatic estimation
– The screening values are given by human in the
proposed method.
• Generalization ability is low.
• These values should be decided automatically.
– Stochastic function.
• Function can be estimated
from training data.
• Stochastic function varies
in different environments 0%
20%
40%
60%
80%
100%
Mode Probability Function
Walk Tran Taxi Bus

ENTER 2015 Research Track Slide Number 22
Discussion
• Context among primitive components
– Transportation modes consist of three primitive
components; “stable speed move”, “acceleration
(deceleration)” and “stop.”
– We call context to the relationship between
consecutive segments of each primitive component.
– We should consider the context for estimation.
– We have two assumptions of context in this study and
give some screening values. However, these should be
automatically decided by using training data.

ENTER 2015 Research Track Slide Number 23
Discussion
• Distinction of bus and taxi is difficult
– Only using speed, this system cannot distinguish
between taxi and bus accurately.
• Other environmental constraints is necessary.
– Other environmental constraints is necessary.
• Other environmental constraints
– Traffic confusion.
– Bus stop location.

ENTER 2015 Research Track Slide Number 24
Conclusion & Future Work
• We proposed a new GPS semantic annotation method
using environmental constraints based on two
assumptions of tourist behaviour.
• The results indicate the high accuracy, 90%.
• Making model based on stochastic logic.
– Improving generalization capability of the method.
• By using other environmental constraints, we try to
improve the performance in future.

ENTER 2015 Research Track Slide Number 25
Appendix

ENTER 2015 Research Track Slide Number 26
Transportation Mode Annotation
using Tourist Features
Annotation using
tourist’s speed
is valid for retain /
walk modes.
Golden Pagoda
Blue : 10-60km/hour
Yellow: Under 1km/hour
Green : 1-10 km/hour
In this area, system
estimated retain /
walk / bus modes.
GPS Trajectory

ENTER 2015 Research Track Slide Number 27
Transportation Mode Estimation
from GPS Trajectory
Walk 60 min. Bus 20 min.
Chain of Transportation
Modes Bus 20 min.
Bus
GPS TrajectoryWalk
Temple
ENTER 2015 Research Track Slide Number 28
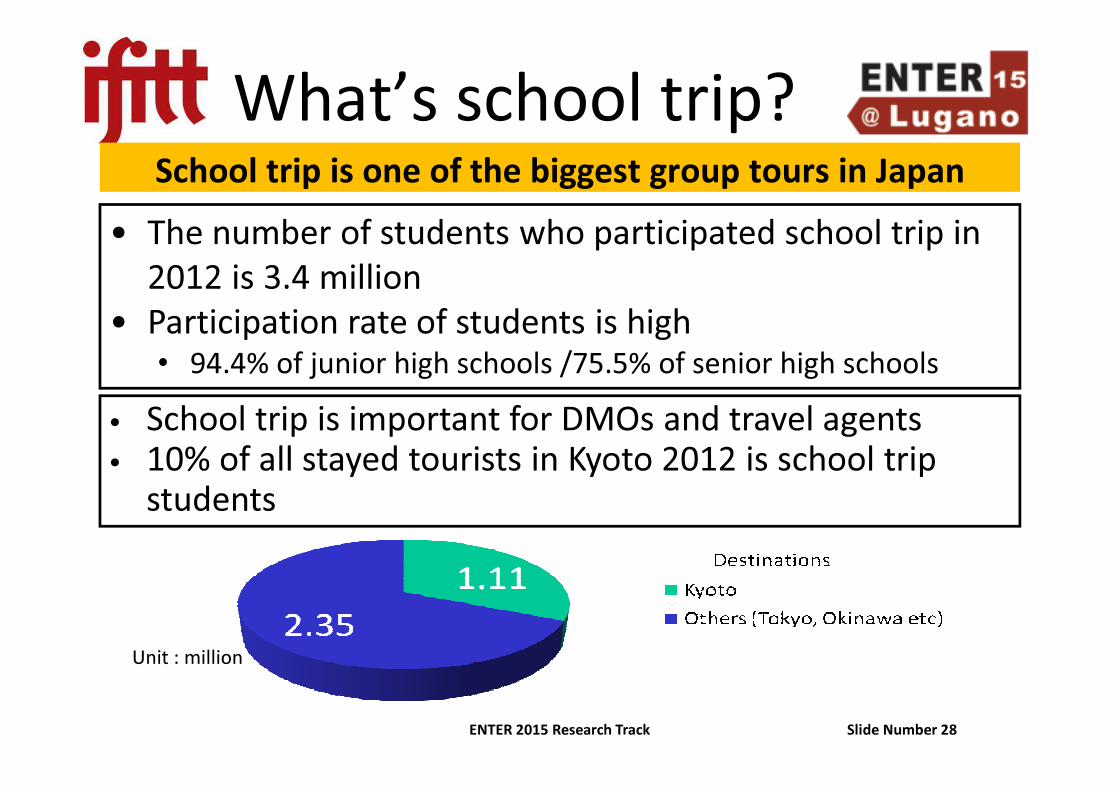
What’s school trip?School trip is one of the biggest group tours in Japan
• School trip is important for DMOs and travel agents• 10% of all stayed tourists in Kyoto 2012 is school trip
students
• The number of students who participated school trip in
2012 is 3.4 million
• Participation rate of students is high• 94.4% of junior high schools /75.5% of senior high schools
Unit : million

ENTER 2015 Research Track Slide Number 29
Escort-teachers
Field HQ (HOTEL)
School staff
School(Home)
School master
Real-time monitoring
Current position
Smartphone(Group leader carries)
Trajectory
Tablet/PC
- GPS & Wi-Fi positioning
Overview of safety ensuring systemETSS (Educational Tour Support System)
Student groups
Information Sharing among All Related Persons
Group Leader(Student. Trained before trip.)
- Mail & Voice
Safety ensuring
No NavigationFor education
System
Tablet

ENTER 2015 Research Track Slide Number 30
Screenshot of student phone
Schoolmaster
Homeroom
teacher
Voice & MailDisaster MapNormal Map
School NameNow 1 hr All
Eva
cu
atio
n A
re
a
Ob
serv
ing
Att
racti
on
s
Current Position Evacuation Area MapNormal MapNormal Map

ENTER 2015 Research Track Slide Number 31
Evacuation mapNetwork DisconnectedNetwork Connected

ENTER 2015 Research Track Slide Number 32
Safety ensuring by mail
No Problem
Injured
Illness
Stray
Lost Matter
Late
Other
Mr. A lost his way in Ginkaku-ji
Send Mail
Title : SafetyConfirmation
Are you all right?Tell me your status.
No Problem
In Trouble
Safety ConfirmStatus Report
In case of
trouble

ENTER 2015 Research Track Slide Number 33
Outline of service specification
Before trip� Planning in advance
- Display the observing attractions on the map.
During trip
Normal
Situation
� Monitoring the students position.
- Track real-time students’ position. (per 1 second)
- Send students’ position to the server. (per 30 seconds)
- Store students’ trajectories in the remote server. (Tokyo)
� Visualization of student trajectories.
- Indicate students’ current position and moving history.
Disaster
Situaion
� Visualization of evacuation areas.
- Display the evacuation areas near position of students/teachers.
- Keep map display in case of the wireless network disconnection.
� Voice & mail communication
- Broadcast confirmation mail to students from teachers.
- VoIP call among the permitted users.

ENTER 2015 Research Track Slide Number 34
GPS data
Date&Time Latitude Longitude Accuracy Provider BatteryLevel
2013/12/13 8:16 34.66693997 135.4960799 0GPS 86
2013/12/13 8:16 34.66884434 135.4969159 37GPS 86
2013/12/13 8:16 34.66915648 135.4967177 52GPS 86
2013/12/13 8:16 34.66908064 135.4967123 57GPS 86
2013/12/13 8:16 34.66900876 135.4968523 47GPS 86
2013/12/13 8:16 34.6692168 135.4962441 48GPS 86
2013/12/13 8:16 34.668968 135.496233 52GPS 86
2013/12/13 8:16 34.66880131 135.4963071 52GPS 86
2013/12/13 8:16 34.66868704 135.4963497 49GPS 86
2013/12/13 8:16 34.66827182 135.4963885 47GPS 86
2013/12/13 8:16 34.66789418 135.4962628 35GPS 86
2013/12/13 8:16 34.66777089 135.4962316 32GPS 86
2013/12/13 8:17 34.66764224 135.4961837 26GPS 86
2013/12/13 8:17 34.66750577 135.4961392 21GPS 86
2013/12/13 8:17 34.66743723 135.49611 21GPS 86
2013/12/13 8:17 34.66739099 135.496083 20GPS 86
2013/12/13 8:17 34.66731841 135.4960461 19GPS 86
2013/12/13 8:17 34.66729817 135.4960326 19GPS 86
2013/12/13 8:17 34.6673011 135.4960286 18GPS 86
2013/12/13 8:17 34.66731857 135.4960296 18GPS 86
2013/12/13 8:17 34.66732602 135.4960259 18GPS 86
2013/12/13 8:17 34.66732767 135.4960237 15GPS 86
2013/12/13 8:17 34.66732837 135.4960193 14GPS 86
2013/12/13 8:17 34.66732553 135.496015 14GPS 86
2013/12/13 8:17 34.66732211 135.4960096 14GPS 86
2013/12/13 8:17 34.66732243 135.4960029 14GPS 86
2013/12/13 8:17 34.66732497 135.4959998 14GPS 86
2013/12/13 8:17 34.66733029 135.4959973 14GPS 86
2013/12/13 8:17 34.66734217 135.4959961 14GPS 86

ENTER 2015 Research Track Slide Number 35
Comparison Experiment
without Environmental Constraints
Bus Taxi Train WalkTotal
count
Bus44.3%
(8,353)
41.8%
(3,372)
1.7%
(83)
0.2%
(212) (22,831)
Taxi1.6%
(303)
2.5%
(198)
19.3%
(964)
0.3%
(333)(6,905)
Train0%
(0)
0.3%
(21)
49.2%
(2,463)
0.5%
(598)(5,540)
Walk54.0%
(10,181)
55.4%
(4,469)
29.9%
(1,497)
99.1%
(127,083)(124,854)
Total
count
100.0%
(18,837)
100.0%
(8,060)
100.0%
(5,007)
100.0%
(128,226)
86.2%
(160,130)
Estimate
Actual
*) Bus route constraints are used for bus / taxi estimation.
*) The universe is biased to “walk” mode.


![Annotating Trajectories by Fusing them with Social Media ...behavior found in trajectories and/or external data. The DayTag annotation system [Rinzivillo et al. 2013] helps an individual](https://img.pdfslide.net/doc/110x75/5f0ee8307e708231d4418628/annotating-trajectories-by-fusing-them-with-social-media-behavior-found-in-trajectories.jpg)