Embed Size (px)
Citation preview

Parametric or Nonparametric Methods

This presentation is designed to help you determine if using parametric or non-parametric methods would be most appropriate with the relationship question you are working on.

This presentation is designed to help you determine if using parametric or non-parametric methods would be most appropriate with the relationship question you are working on.
Parametric Method
Non-Parametric Method

What are parametric methods?

Parametric methods are used when we examine sample statistics

Parametric methods are used when we examine sample statistics as a representation of population parameters
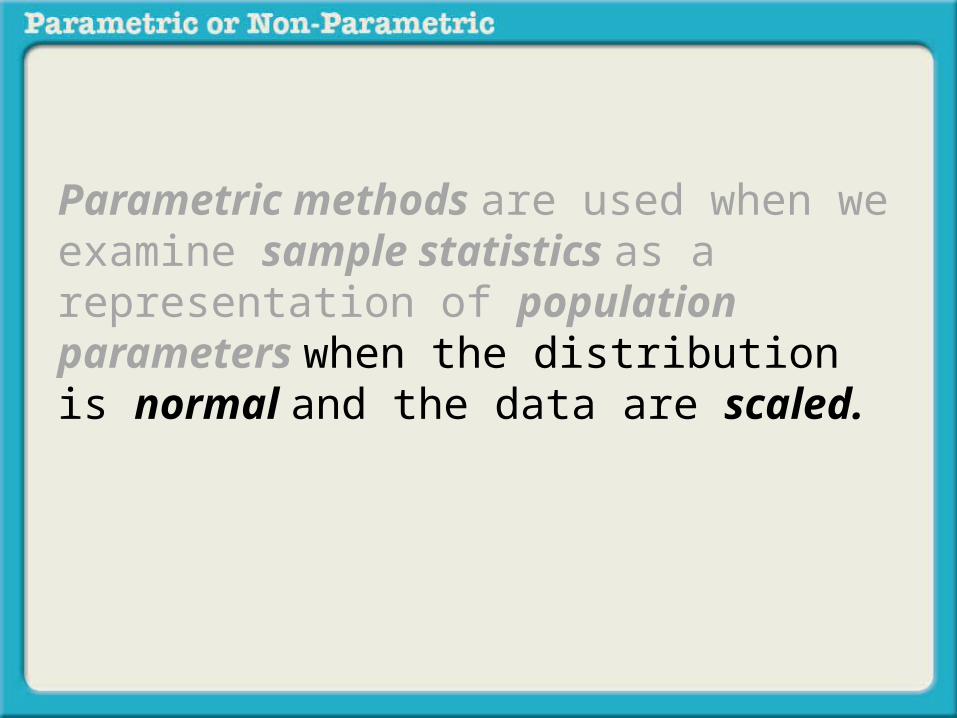
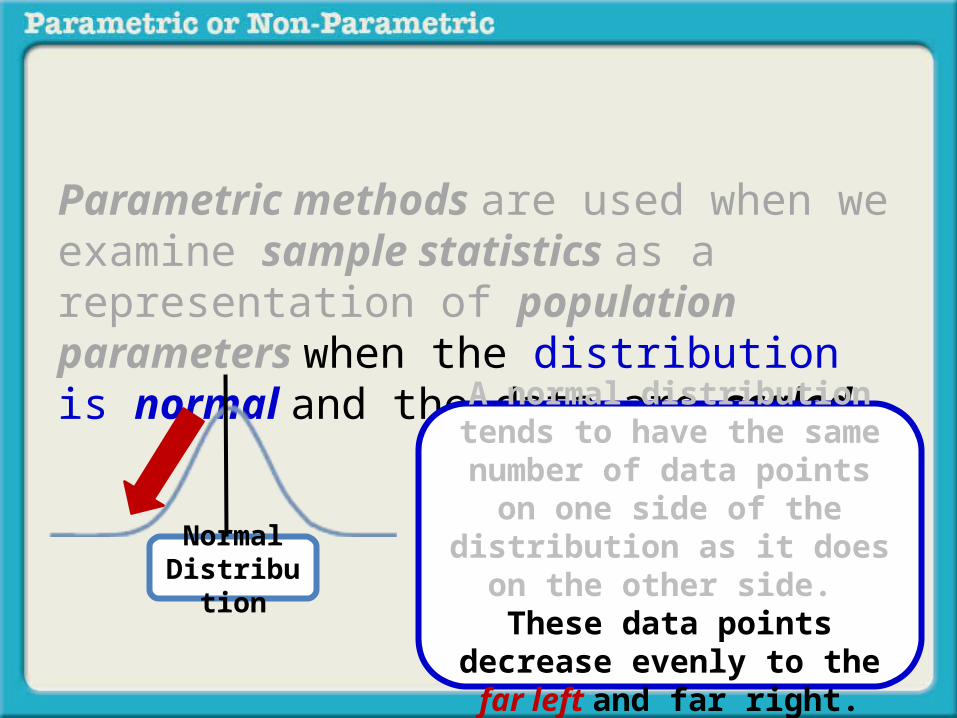
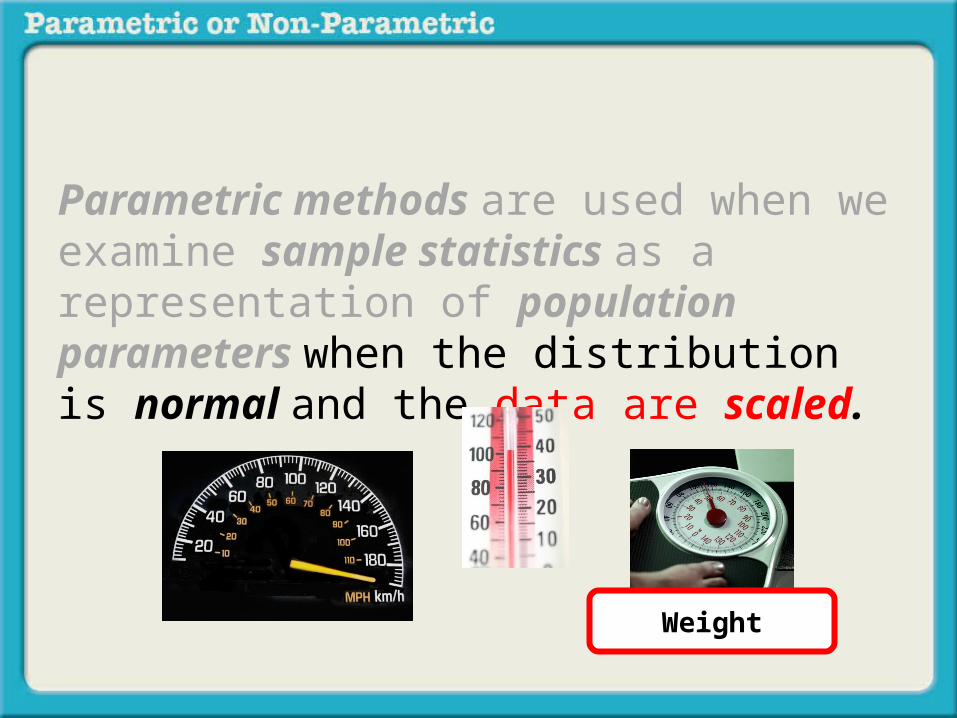
Parametric methods are used when we examine sample statistics as a representation of population parameters when the distribution is normal and the data are scaled.

Parametric methods are used when we examine sample statistics as a representation of population parameters when the distribution is normal and the data are scaled.
Normal Distribution

Parametric methods are used when we examine sample statistics as a representation of population parameters when the distribution is normal and the data are scaled.
Normal Distribution
A normal distribution tends to have the same number of data
points on one side of the distribution as it does on the other side. These data points
decrease evenly to the far left and far right.
50%

Parametric methods are used when we examine sample statistics as a representation of population parameters when the distribution is normal and the data are scaled.
Normal Distribution
A normal distribution tends to have the same number of data
points on one side of the distribution as it does on the other side. These data points
decrease evenly to the far left and far right.
50%50%

Parametric methods are used when we examine sample statistics as a representation of population parameters when the distribution is normal and the data are scaled.
Normal Distribution
A normal distribution tends to have the same number of data
points on one side of the distribution as it does on the other side. These data points
decrease evenly to the far left and far right.

Parametric methods are used when we examine sample statistics as a representation of population parameters when the distribution is normal and the data are scaled.

Parametric methods are used when we examine sample statistics as a representation of population parameters when the distribution is normal and the data are scaled.
Speed

Parametric methods are used when we examine sample statistics as a representation of population parameters when the distribution is normal and the data are scaled.
Temperature
Parametric methods are used when we examine sample statistics as a representation of population parameters when the distribution is normal and the data are scaled.
Weight

Parametric methods are used when we examine sample statistics as a representation of population parameters when the distribution is normal and the data are scaled.
Scaled Data

Parametric methods are used when we examine sample statistics as a representation of population parameters when the distribution is normal and the data are scaled.
Data which is scaled have equal points along the scale (e.g., 1 pound is the same unit of measurement across
the weight scale)
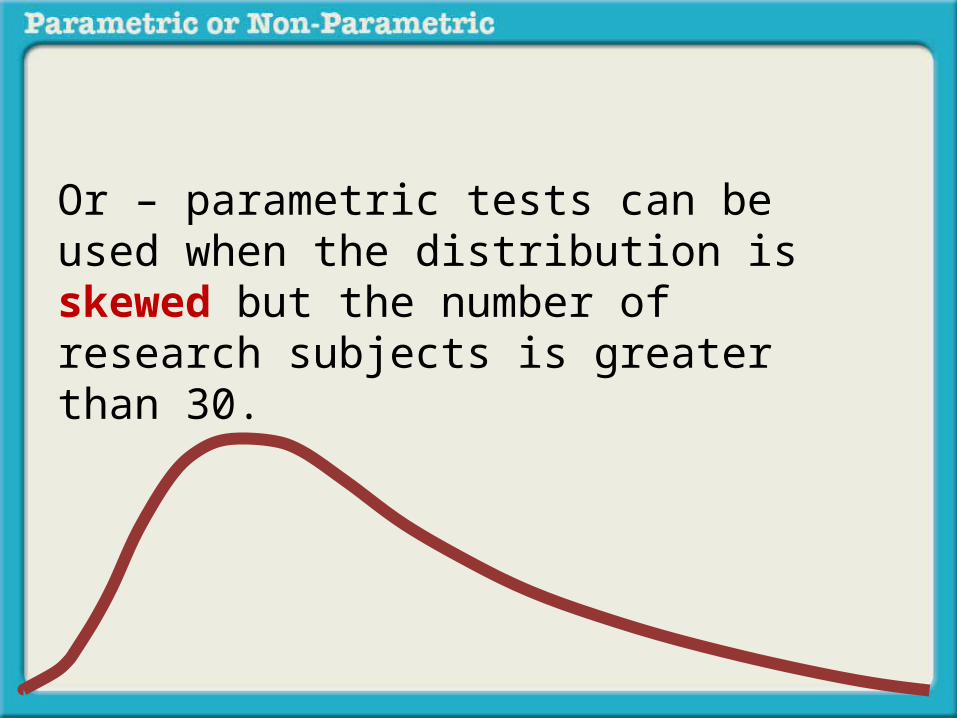
Or – parametric tests can be used when the distribution is skewed but the number of research subjects is greater than 30.

Or – parametric tests can be used when the distribution is skewed but the number of research subjects is greater than 30.

A parametric question that deals with relationships might look like this:

Researchers interested in determining if there is a relationship between death anxiety and religiosity conducted the following study. Subjects completed a death anxiety scale (high score = high anxiety) and also completed a checklist designed to measure an individuals degree of religiosity (belief in a particular religion, regular attendance at religious services, number of times per week they regularly pray, etc.) (high score = greater religiosity. A data sample is provided to the right:

Researchers interested in determining if there is a relationship between death anxiety and religiosity conducted the following study. Subjects completed a death anxiety scale (high score = high anxiety) and also completed a checklist designed to measure an individuals degree of religiosity (belief in a particular religion, regular attendance at religious services, number of times per week they regularly pray, etc.) (high score = greater religiosity. A data sample is provided to the right:
&

Researchers interested in determining if there is a relationship between death anxiety and religiosity conducted the following study. Subjects completed a death anxiety scale (high score = high anxiety) and also completed a checklist designed to measure an individuals degree of religiosity (belief in a particular religion, regular attendance at religious services, number of times per week they regularly pray, etc.) (high score = greater religiosity. A data sample is provided to the right:

Researchers interested in determining if there is a relationship between death anxiety and religiosity conducted the following study. Subjects completed a death anxiety scale (high score = high anxiety) and also completed a checklist designed to measure an individuals degree of religiosity (belief in a particular religion, regular attendance at religious services, number of times per week they regularly pray, etc.) (high score = greater religiosity. A data sample is provided to the right:
Death Anxiety Scale

Researchers interested in determining if there is a relationship between death anxiety and religiosity conducted the following study. Subjects completed a death anxiety scale (high score = high anxiety) and also completed a checklist designed to measure an individuals degree of religiosity (belief in a particular religion, regular attendance at religious services, number of times per week they regularly pray, etc.) (high score = greater religiosity. A data sample is provided to the right:

Researchers interested in determining if there is a relationship between death anxiety and religiosity conducted the following study. Subjects completed a death anxiety scale (high score = high anxiety) and also completed a checklist designed to measure an individuals degree of religiosity (belief in a particular religion, regular attendance at religious services, number of times per week they regularly pray, etc.) (high score = greater religiosity.) A data sample is provided to the right:

Researchers interested in determining if there is a relationship between death anxiety and religiosity conducted the following study. Subjects completed a death anxiety scale (high score = high anxiety) and also completed a checklist designed to measure an individuals degree of religiosity (belief in a particular religion, regular attendance at religious services, number of times per week they regularly pray, etc.) (high score = greater religiosity.) A data sample is provided to the right:

Researchers interested in determining if there is a relationship between death anxiety and religiosity conducted the following study. Subjects completed a death anxiety scale (high score = high anxiety) and also completed a checklist designed to measure an individuals degree of religiosity (belief in a particular religion, regular attendance at religious services, number of times per week they regularly pray, etc.) (high score = greater religiosity). A data sample is provided to the right:
Measure of Religiosity

Researchers interested in determining if there is a relationship between death anxiety and religiosity conducted the following study. Subjects completed a death anxiety scale (high score = high anxiety) and also completed a checklist designed to measure an individuals degree of religiosity (belief in a particular religion, regular attendance at religious services, number of times per week they regularly pray, etc.) (high score = greater religiosity. A data sample is provided to the right:

Death Anxiety Religiosity38 442 329 1131 528 915 624 1417 919 1011 158 19
19 173 10
14 146 18
Researchers interested in determining if there is a relationship between death anxiety and religiosity conducted the following study. Subjects completed a death anxiety scale (high score = high anxiety) and also completed a checklist designed to measure an individuals degree of religiosity (belief in a particular religion, regular attendance at religious services, number of times per week they regularly pray, etc.) (high score = greater religiosity. A data sample is provided to the right:
This data has enough spread to be
considered scaled

Death Anxiety Religiosity38 439 329 1131 528 915 624 1417 919 1011 158 19
19 173 10
14 146 18
Researchers interested in determining if there is a relationship between death anxiety and religiosity conducted the following study. Subjects completed a death anxiety scale (high score = high anxiety) and also completed a checklist designed to measure an individuals degree of religiosity (belief in a particular religion, regular attendance at religious services, number of times per week they regularly pray, etc.) (high score = greater religiosity. A data sample is provided to the right:
Same with this data.

Death Anxiety Religiosity38 439 329 1131 528 915 624 1417 919 1011 158 19
19 173 10
14 146 18
Researchers interested in determining if there is a relationship between death anxiety and religiosity conducted the following study. Subjects completed a death anxiety scale (high score = high anxiety) and also completed a checklist designed to measure an individuals degree of religiosity (belief in a particular religion, regular attendance at religious services, number of times per week they regularly pray, etc.) (high score = greater religiosity. A data sample is provided to the right:
The skew for this data set is 0.26 (a skewed distribution will
have a skew value greater than +2.0 or less than -2.0). While slightly skewed to the
right, the distribution would be considered normal

Death Anxiety Religiosity38 439 329 1131 528 915 624 1417 919 1011 158 19
19 173 10
14 146 18
Researchers interested in determining if there is a relationship between death anxiety and religiosity conducted the following study. Subjects completed a death anxiety scale (high score = high anxiety) and also completed a checklist designed to measure an individuals degree of religiosity (belief in a particular religion, regular attendance at religious services, number of times per week they regularly pray, etc.) (high score = greater religiosity. A data sample is provided to the right:
At the end of this module, go to the presentation entitled “Assessing Skew” to learn how to assess the level of skew in your data set in SPSS.
You can access it through the link on the webpage you just left.

Death Anxiety Religiosity38 439 329 1131 528 915 624 1417 919 1011 158 19
19 173 10
14 146 18
Researchers interested in determining if there is a relationship between death anxiety and religiosity conducted the following study. Subjects completed a death anxiety scale (high score = high anxiety) and also completed a checklist designed to measure an individuals degree of religiosity (belief in a particular religion, regular attendance at religious services, number of times per week they regularly pray, etc.) (high score = greater religiosity. A data sample is provided to the right:
The skew for this data set is 0.03 and therefore the distribution would be considered normal

Death Anxiety Religiosity38 439 329 1131 528 915 624 1417 919 1011 158 19
19 173 10
14 146 18
Researchers interested in determining if there is a relationship between death anxiety and religiosity conducted the following study. Subjects completed a death anxiety scale (high score = high anxiety) and also completed a checklist designed to measure an individuals degree of religiosity (belief in a particular religion, regular attendance at religious services, number of times per week they regularly pray, etc.) (high score = greater religiosity. A data sample is provided to the right:
Because the data are scaled and the distributions are both normal, this analysis would be
handled with a parametric method.

In summary,

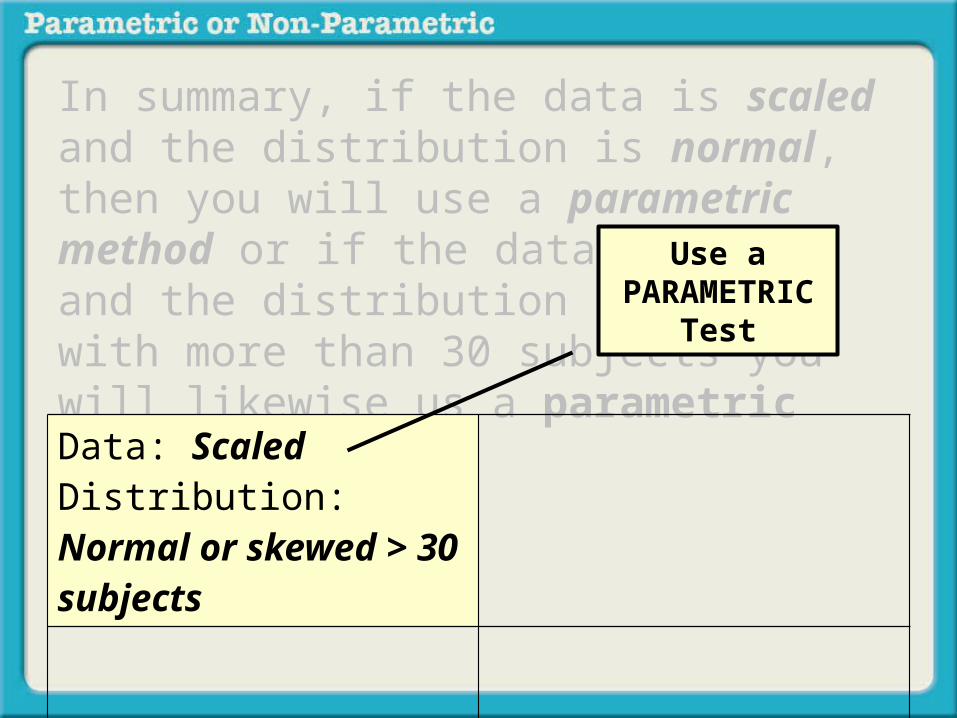
In summary, if the data is scaled and the distribution is normal, then you will use a parametric method or if the data is scaled and the distribution is skewed with more than 30 subjects you will likewise us a parametric method.

In summary, if the data is scaled and the distribution is normal, then you will use a parametric method or if the data is scaled and the distribution is skewed with more than 30 subjects you will likewise us a parametric method.
Data: ScaledDistribution: Normal or skewed > 30 subjects
In summary, if the data is scaled and the distribution is normal, then you will use a parametric method or if the data is scaled and the distribution is skewed with more than 30 subjects you will likewise us a parametric method.
Data: ScaledDistribution: Normal or skewed > 30 subjects
Use a PARAMETRIC
Test

What are nonparametric methods?

Non-Parametric methods are used when we examine sample statistics

Non-Parametric methods are used when we examine sample statistics as a representation of population parameters

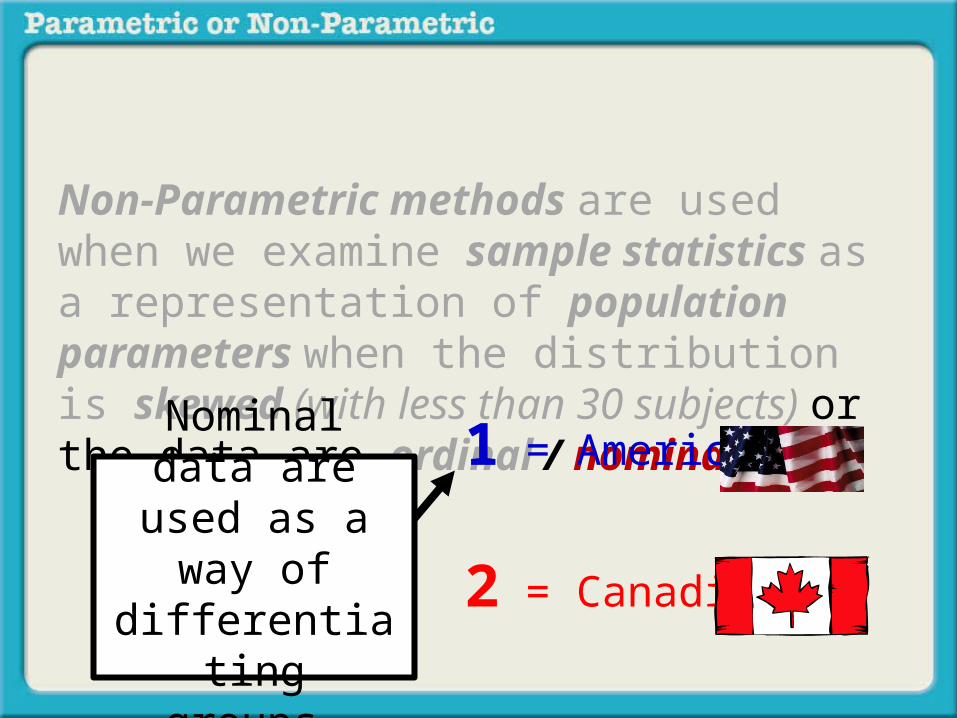
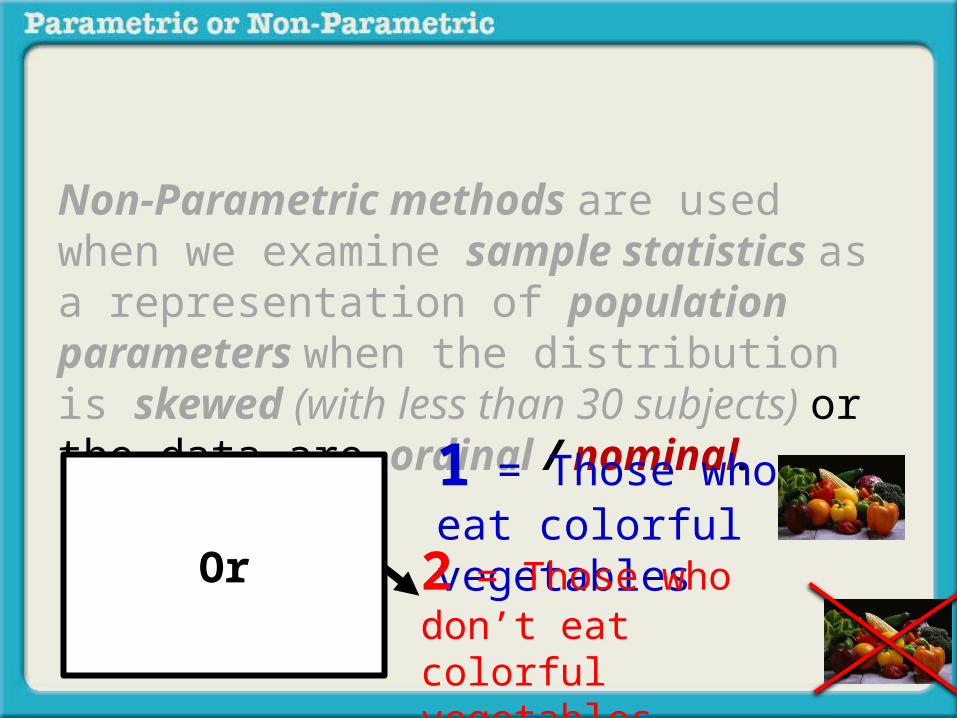
Non-Parametric methods are used when we examine sample statistics as a representation of population parameters when the distribution is skewed (with less than 30 subjects) or the data are ordinal / nominal.

Non-Parametric methods are used when we examine sample statistics as a representation of population parameters when the distribution is skewed (with less than 30 subjects) or the data are ordinal / nominal.
Skewed Distributions
with less than 30

Non-Parametric methods are used when we examine sample statistics as a representation of population parameters when the distribution is skewed (with less than 30 subjects) or the data are ordinal / nominal.
Skewed Distributions
with less than 30

Non-Parametric methods are used when we examine sample statistics as a representation of population parameters when the distribution is skewed (with less than 30 subjects) or the data are ordinal / nominal.

Non-Parametric methods are used when we examine sample statistics as a representation of population parameters when the distribution is skewed (with less than 30 subjects) or the data are ordinal / nominal.
Or ranked data like percentiles %

Non-Parametric methods are used when we examine sample statistics as a representation of population parameters when the distribution is skewed (with less than 30 subjects) or the data are ordinal / nominal.

Non-Parametric methods are used when we examine sample statistics as a representation of population parameters when the distribution is skewed (with less than 30 subjects) or the data are ordinal / nominal.
1 = American
2 = Canadian

Non-Parametric methods are used when we examine sample statistics as a representation of population parameters when the distribution is skewed (with less than 30 subjects) or the data are ordinal / nominal.
1 = American
2 = Canadian
Nominal data are used as a way of differentiating
groups.
Non-Parametric methods are used when we examine sample statistics as a representation of population parameters when the distribution is skewed (with less than 30 subjects) or the data are ordinal / nominal.
1 = American
2 = Canadian
Nominal data are used as a way of differentiating
groups.

Non-Parametric methods are used when we examine sample statistics as a representation of population parameters when the distribution is skewed (with less than 30 subjects) or the data are ordinal / nominal.
1 = American
2 = Canadian
Nominal data are used as a way of differentiating
groups.

Non-Parametric methods are used when we examine sample statistics as a representation of population parameters when the distribution is skewed (with less than 30 subjects) or the data are ordinal / nominal.
Or
1 = Those who eat colorful vegetables
Non-Parametric methods are used when we examine sample statistics as a representation of population parameters when the distribution is skewed (with less than 30 subjects) or the data are ordinal / nominal.
Or
1 = Those who eat colorful vegetables
2 = Those who don’t eat colorful vegetables

A nonparametric question that deals with relationships might look like this:

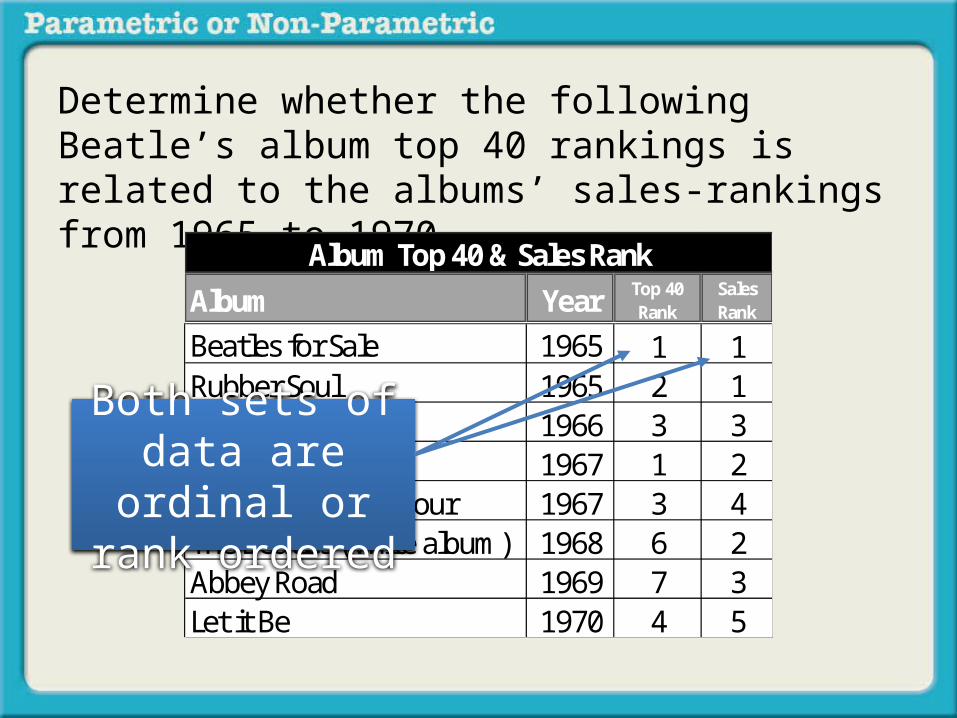
Determine whether the following Beatle’s album top 40 rankings is related to the albums’ sales-rankings from 1965 to 1970.

Determine whether the following Beatle’s album top 40 rankings is related to the albums’ sales-rankings from 1965 to 1970.
Album Year Top 40Rank
SalesRank
Beatles for Sale 1965 1 1Rubber Soul 1965 2 1Revolver 1966 3 3Sgt. Pepper 1967 1 2Magical Mystery Tour 1967 3 4The Beatles (white album) 1968 6 2Abbey Road 1969 7 3Let it Be 1970 4 5
Album Top 40 & Sales Rank
Both sets of data are ordinal or rank
ordered

Determine whether the following Beatle’s album top 40 rankings is related to the albums’ sales-rankings from 1965 to 1970.
Because the data are ordinal this analysis would be handled with a nonparametric method.

Very Important Note –
When the data are ordinal in at least ONE data set we will automatically use a nonparametric test, regardless of whether the distribution is normal or not.regardless of whether the distribution is normal or not.

Very Important Note –
When the data are ordinal in at least ONE data set we will automatically use a nonparametric test, regardless of whether the distribution is normal or not.regardless of whether the distribution is normal or not.

Very Important Note –
When the data are ordinal in at least ONE data set we will automatically use a nonparametric test, regardless of whether the distribution is normal or not.

Here is another nonparametric-relationship problem:

Do those from rural areas tend to drink more than 8 ounces of an alcoholic beverage in one sitting than those from urban areas?

Do those from rural areas tend to drink more than 8 ounces of an alcoholic beverage in one sitting than those from urban areas?
Where the subject is from?
Amount of alcohol drunken
SubjectRural = 1City = 2
Less than 8oz = 1More than 8oz = 2
a 1 1b 1 1c 1 2d 1 1e 2 2f 2 1g 2 1h 2 1

Do those from rural areas tend to drink more than 8 ounces of an alcoholic beverage in one sitting than those from urban areas?
Where the subject is from?
Amount of alcohol drunken
SubjectRural = 1City = 2
Less than 8oz = 1More than 8oz = 2
a 1 1b 1 1c 1 2d 1 1e 2 2f 2 1g 2 1h 2 1
Both sets of data are nominal
(either/or)
Because the data are nominal this analysis would be handled with a nonparametric method.
The Same Very Important Note –
When the data are nominal in at least ONE data set we will automatically use a nonparametric test, regardless of whether the distribution is normal or not.regardless of whether the distribution is normal or not.

The Same Very Important Note –
When the data are nominal in at least ONE data set we will automatically use a nonparametric test, regardless of whether the distribution is normal or not.regardless of whether the distribution is normal or not.

The Same Very Important Note –
When the data are nominal in at least ONE data set we will automatically use a nonparametric test, regardless of whether the distribution is normal or not.

In summary,

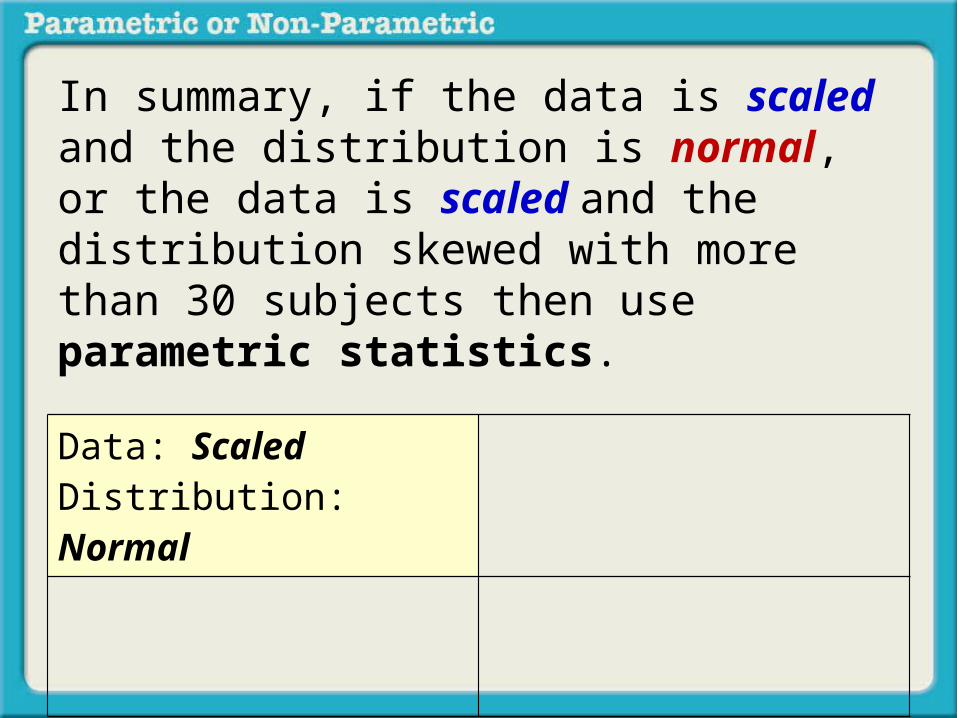
In summary, if the data is scaled and the distribution is normal, or the data is scaled and the distribution skewed with more than 30 subjects then use parametric statistics.
In summary, if the data is scaled and the distribution is normal, or the data is scaled and the distribution skewed with more than 30 subjects then use parametric statistics.
Data: ScaledDistribution: Normal

In summary, if the data is scaled and the distribution is normal, or the data is scaled and the distribution skewed with more than 30 subjects then use parametric statistics.
Data: ScaledDistribution: NormalData: ScaledDistribution: Skewed with less than 30 subjects

In summary, if the data is scaled and the distribution is normal, or the data is scaled and the distribution skewed with more than 30 subjects then use parametric statistics.
Data: ScaledDistribution: NormalData: ScaledDistribution: Skewed with less than 30 subjects
Use a PARAMETRIC
Test

However, if the data are EITHER Ordinal/Nominal or the distribution is skewed with less than 30 subjects, then you will use a NON-parametric method.

However, if the data are EITHER Ordinal/Nominal or the distribution is skewed with less than 30 subjects, then you will use a NON-parametric method.
Data: ScaledDistribution: Normal
Data: Ordinal/Nominal
Data: ScaledDistribution: skewed > 30 subjects

However, if the data are EITHER Ordinal/Nominal or the distribution is skewed with less than 30 subjects, then you will use a NON-parametric method.
Data: ScaledDistribution: Normal
Data: Ordinal/Nominal
Data: ScaledDistribution: skewed > 30 subjects
Data: ScaledDistribution: skewed < 30 subjects

However, if the data are EITHER Ordinal/Nominal or the distribution is skewed with less than 30 subjects, then you will use a NON-parametric method.
Data: ScaledDistribution: Normal
Data: Ordinal/Nominal
Data: ScaledDistribution: skewed > 30 subjects
Data: ScaledDistribution: skewed < 30 subjects
Use a NON-PARAMETRIC
Test

What type of method would be most appropriate for the data set you are working with?

What type of method would be most appropriate for the data set you are working with?
Parametric Method
Non-Parametric Method