Embed Size (px)
DESCRIPTION
Slides used by Martin Bazley as part of UX Oxford day 18 March 2013 organised by the Bodleian Libraries
Citation preview
Understanding online audiences
Planning and implementing research into online audiences
UX day Oxford 18 March 2013
Martin BazleyOnline experience consultantMartin Bazley & Associates

Martin BazleyPreviously• Teaching (7 yrs)• Science Museum, London,
Internet Projects (7yrs)• E-Learning Officer, MLA South East
(3yrs)• Founder: Digital Learning Network
DLNET

Martin Bazley• Current• Developing online resources,
websites, user testing, evaluation, training, consultancy…Martin Bazley & Associateswww.martinbazley.com
Slides and notes available afterwards

www.martinbazley.com
Note to self: check stats tomorrow to see if anyone looked up the website

How can we get a sense of who our online visitors are and what they do with our online content?
How do we gather data to help us improve what we do?
How do we measure success from the user's point of view, and / or against our own objectives and constraints?
For example, how justify investment (or lack of it) in social networks etc?

Reasons for doing audience research:
Evaluation
• Did your project/product/service do what you wanted it to do?
• Provide information for stakeholders
• Gauge audience satisfaction

Reasons for doing audience research:
Promotion
• Improve your offer for your target audiences
• Increase usage
• Widen access

Reasons for doing audience research:
Planning
• Inform development of a new product/service
• Inform business planning
• Prove interest in a related activity
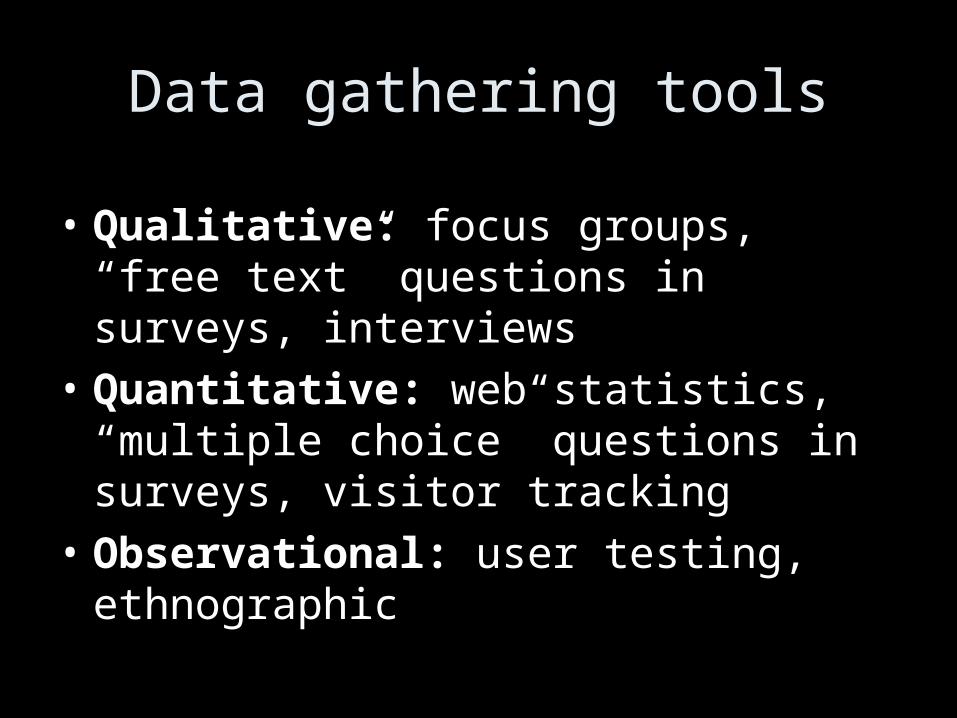
Data gathering tools
• Qualitative: focus groups, “free text” questions in surveys, interviews
• Quantitative: web statistics, “multiple choice” questions in surveys, visitor tracking
• Observational: user testing, ethnographic

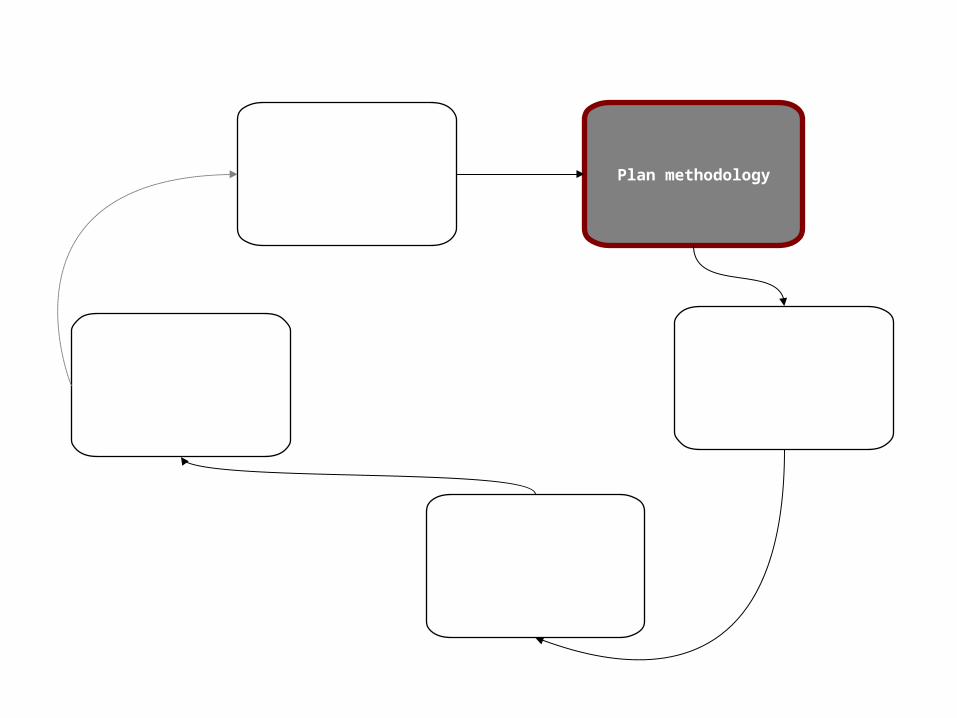
Define audience research goal
Analyse data
Collect data Use results to guide changes
Plan methodology
Define audience research goal
Analyse data
Collect data Use results to guide changes
Plan methodology

Define audience research goal
Analyse data
Collect data Use results to guide changes
Plan methodology

Define audience research goal
Analyse data
Collect data Use results to guide changes
Plan methodology

Define audience research goal
Analyse data
Collect data Use results to guide changes
Plan methodology

Define audience research goal
Analyse data
Collect data Use results to guide changes
Plan methodology

Strengths and weaknesses of different data gathering techniques
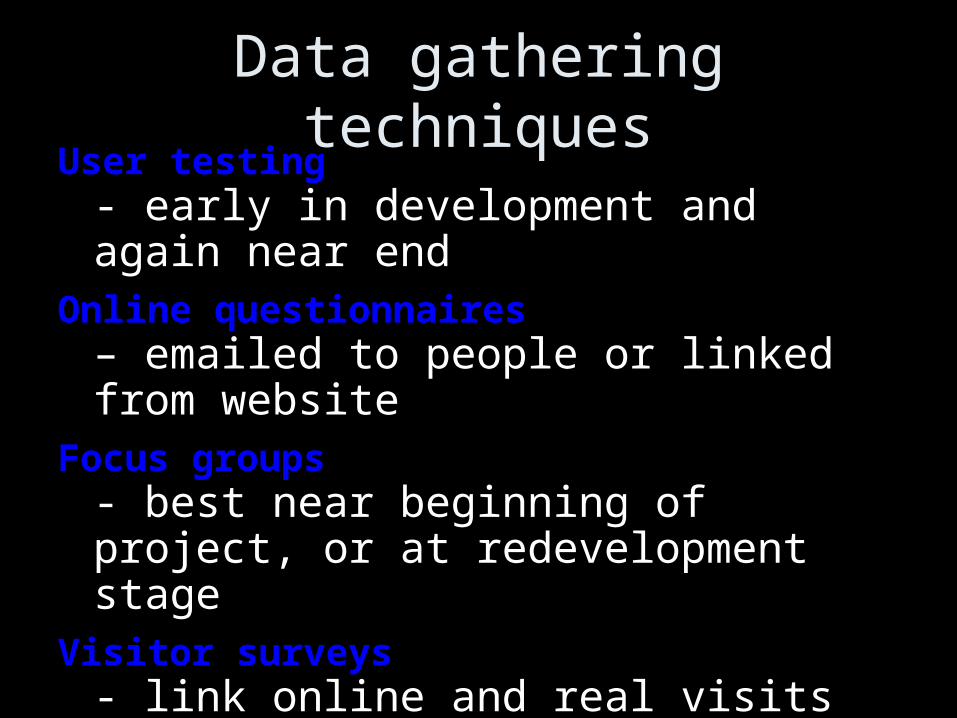
Data gathering techniquesUser testing
- early in development and again near endOnline questionnaires
– emailed to people or linked from websiteFocus groups
- best near beginning of project, or at redevelopment stage
Visitor surveys - link online and real visits
Web stats- useful for long term trends /events etc

Need to distinguish between:
Diagnostics – making a project or service better
Reporting – to funders, or for advocacy
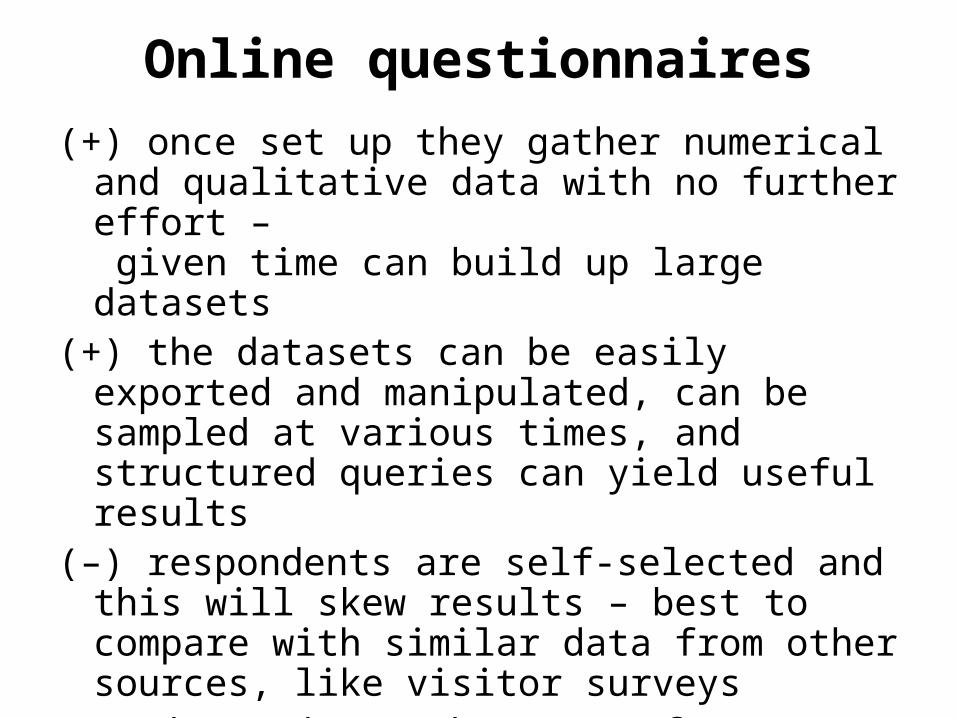
Online questionnaires(+) once set up they gather numerical and
qualitative data with no further effort – given time can build up large datasets
(+) the datasets can be easily exported and manipulated, can be sampled at various times, and structured queries can yield useful results
(–) respondents are self-selected and this will skew results – best to compare with similar data from other sources, like visitor surveys
(–) the number and nature of responses may depend on how the online questionnaire is displayed and promoted on the website

Focus groups
(+) can explore specific issues in more depth, yielding rich feedback
(+) possible to control participant composition to ensure representative
(–) comparatively time-consuming (expensive) to organise and analyse
(–) yield qualitative data only - small numbers mean numerical comparisons are unreliable

Visitor surveys
(+) possible to control participant composition to ensure representative
(–) comparatively time-consuming (expensive) to organise and analyse
(–) responses can be affected by various factors including interviewer, weather on the day, day of the week, etc, reducing validity of numerical comparisons between museums

Web stats(+) Easy to gather data – can decide
what to do with it later(+) Person-independent data
generated - it is the interpretation, rather than the data themselves, which is subjective. This means others can review the same data and verify or amend initial conclusions reached

Web stats(–) Different systems generate
different data for the same web activity – for example no of unique visits measured via Google Analytics is generally lower than that derived via server log files
(–) Metrics are complicated and require specialist knowledge to appreciate them fully

Web stats(–) As the amount of off-website web
activity increases (e.g. Web 2.0 style interactions) the validity of website stats decreases, especially for reporting purposes, but also for diagnostics
(–) Agreeing a common format for presentation of data and analysis requires collaborative working to be meaningful

Online surveys
SurveyMonkey
www.surveymonkey.com

Web statsGoogle Analytics

Learn GA: short intro videos etc
https://www.google.com/analytics/iq.html

The best way to learn GA is to use it:
www.google.com/analytics/

Web stats: Focus on trends rather than absolute values

An example of a power law graph showing popularity ranking. To the right is the long tail; to the left are the few that dominate. Notice that the areas of both regions match. [Wikipedia: Long Tail]
The ‘long tail’

The tail becomes bigger and longer in new markets (depicted in red). In other words, whereas traditional retailers have focused on the area to the left of the chart, online bookstores derive more sales from the area to the right.[Wikipedia: Long Tail]
The ‘long tail’

SCA guidancehttp://sca.jiscinvolve.org/wp/audience-publications/
Good overview
Step by step approach
Culture 24 Let’s Get Realhttp://weareculture24.org.uk/projects/action-research/
Happy to help - phone number on site:
Martin Bazley0780 3580 737
www.martinbazley.com
More information / advice / ideas

Extra slides not used in session
Some of these may be useful - please feel free to call for clarification or more info

When to evaluate or test and why
• Before funding approval – project planning
• Post-funding - project development
• Post-project – summative evaluation
Testing is an iterative process
Testing isn’t something you do once
Make somethingMake something=> test it => test it
=> refine it=> refine it=> test it again=> test it again

Before funding – project planning• *Evaluation of other websites
– Who for? What for? How use it? etc– awareness raising: issues, opportunities– contributes to market research– possible elements, graphic feel etc
• *Concept testing – check idea makes sense with audience– reshape project based on user feedback
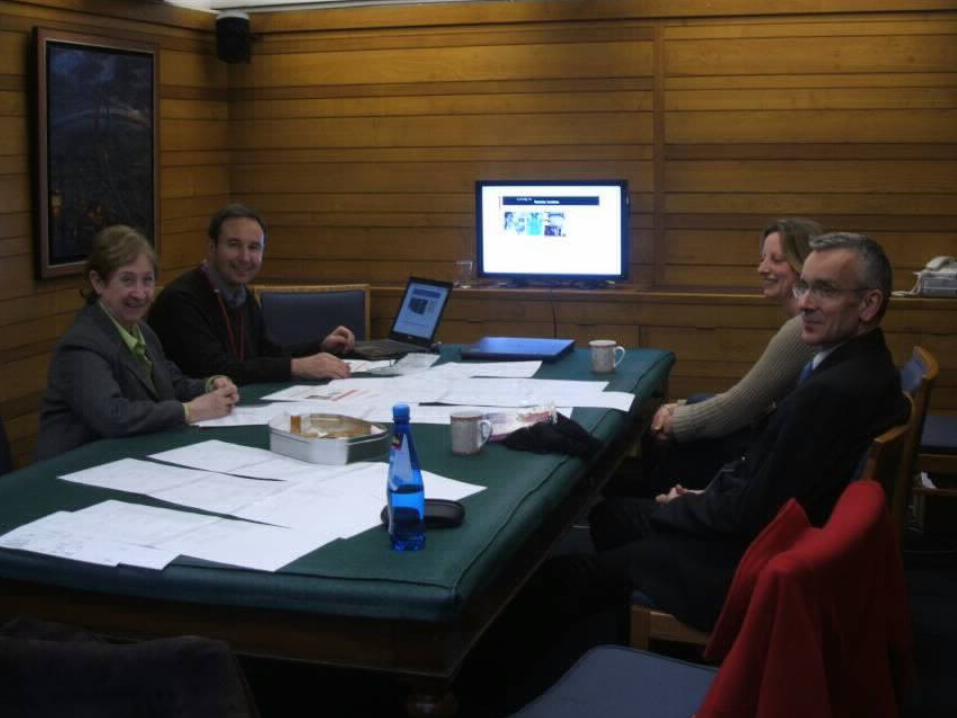
Focus group
Research


Post-funding - project development• *Concept testing
– refine project outcomes based on feedback from intended users
• Refine website structure– does it work for users?
• *Evaluate initial look and feel – graphics,navigation etc
Focus group
Focus group
One-to-one tasks


Card sorting - get various people to try out the website structure before you build it

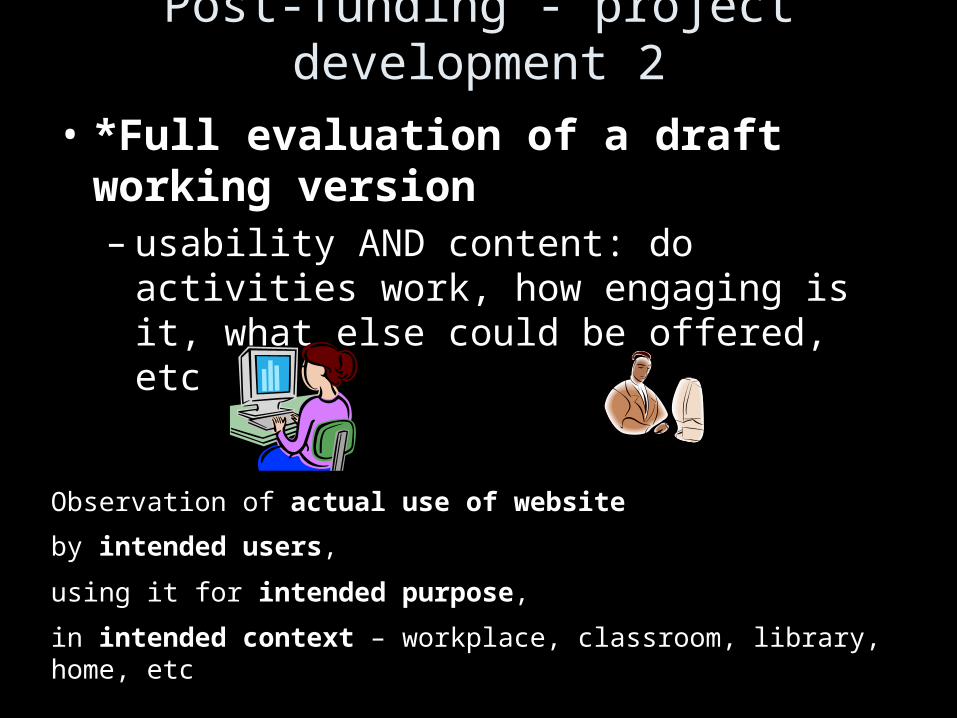
Post-funding - project development 2
• *Full evaluation of a draft working version – usability AND content: do activities work, how
engaging is it, what else could be offered, etc
Observation of actual use of website
by intended users,
using it for intended purpose,
in intended context – workplace, classroom, library, home, etc


Post-funding - project development 3
• Acceptance testing of ‘finished’ website– last minute check, minor corrections only– often offered by web developers
• Summative evaluation– report for funders, etc– learn lessons at project level for next time

Website evaluation and testingNeed to think ahead a bit:
– what are you trying to find out?
– how do you intend to test it?
– why? what will do you do as a result?
The Why?Why? should drive this process

Martin BazleyOnline experience consultant
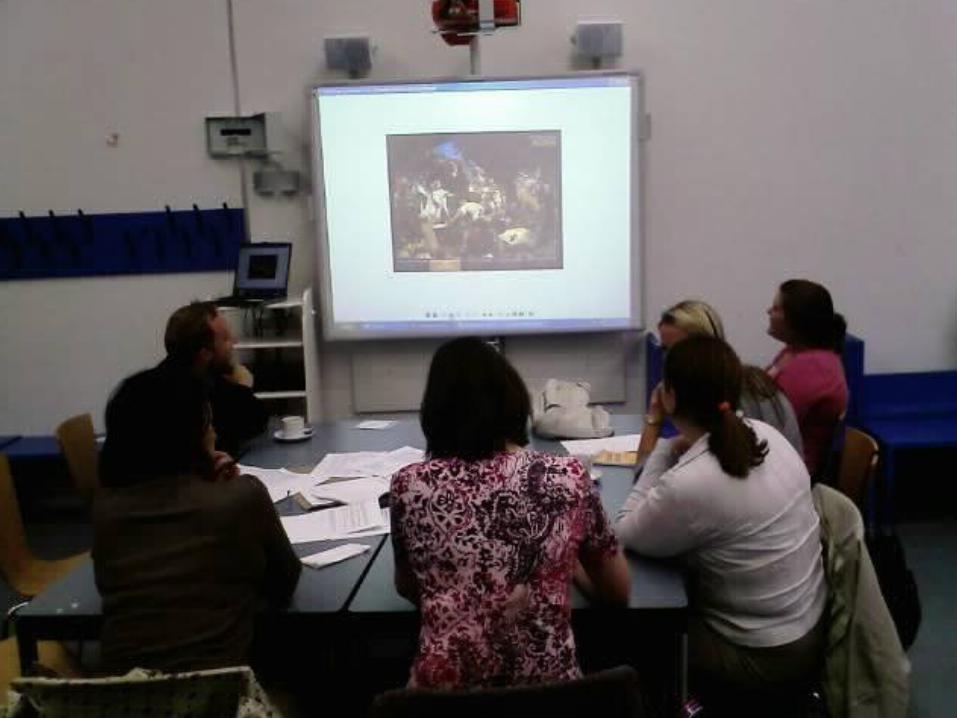
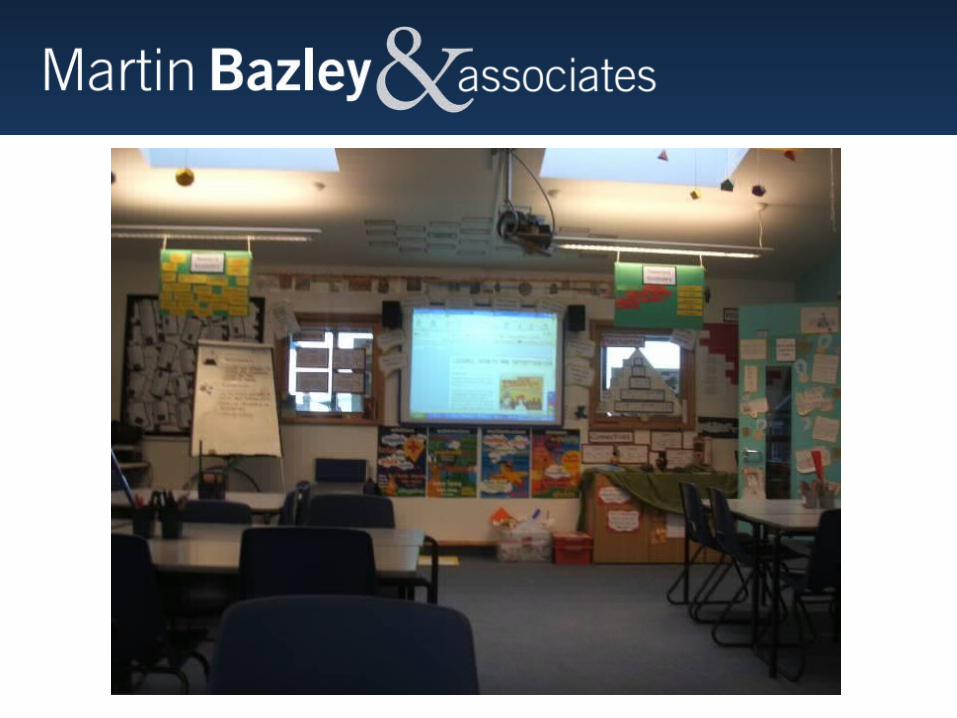
Evaluating online learning resources in the classroom

Key point:
for a site designed for schools,
the most effective user testing
observations
will be made in a real classroom situation
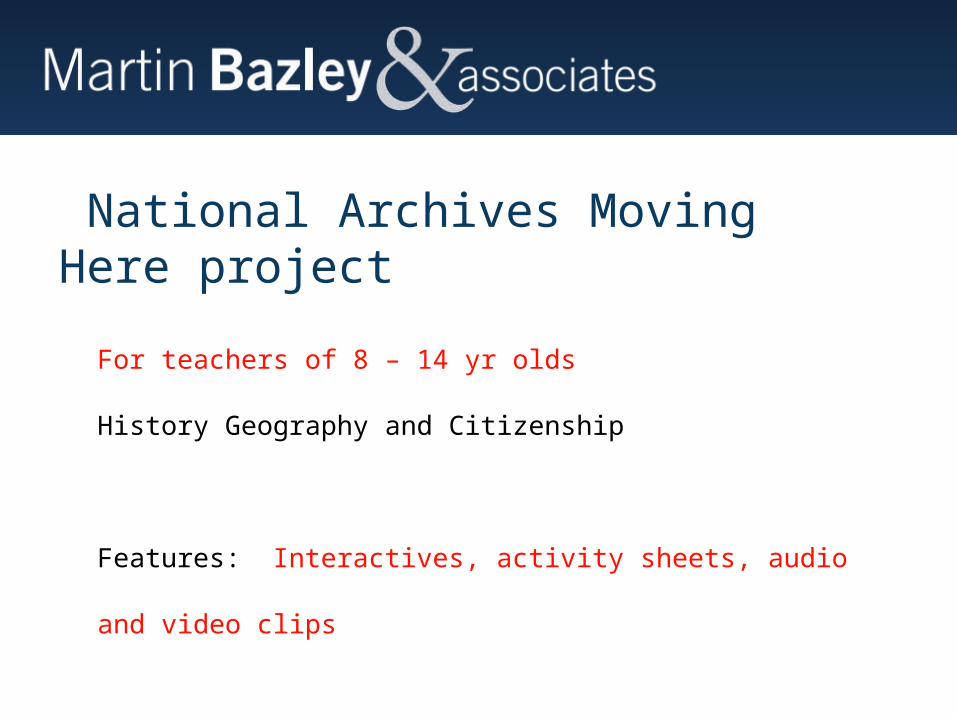
National Archives Moving Here project
For teachers of 8 – 14 yr olds
History Geography and Citizenship
Features: Interactives, activity sheets, audio and video
clips
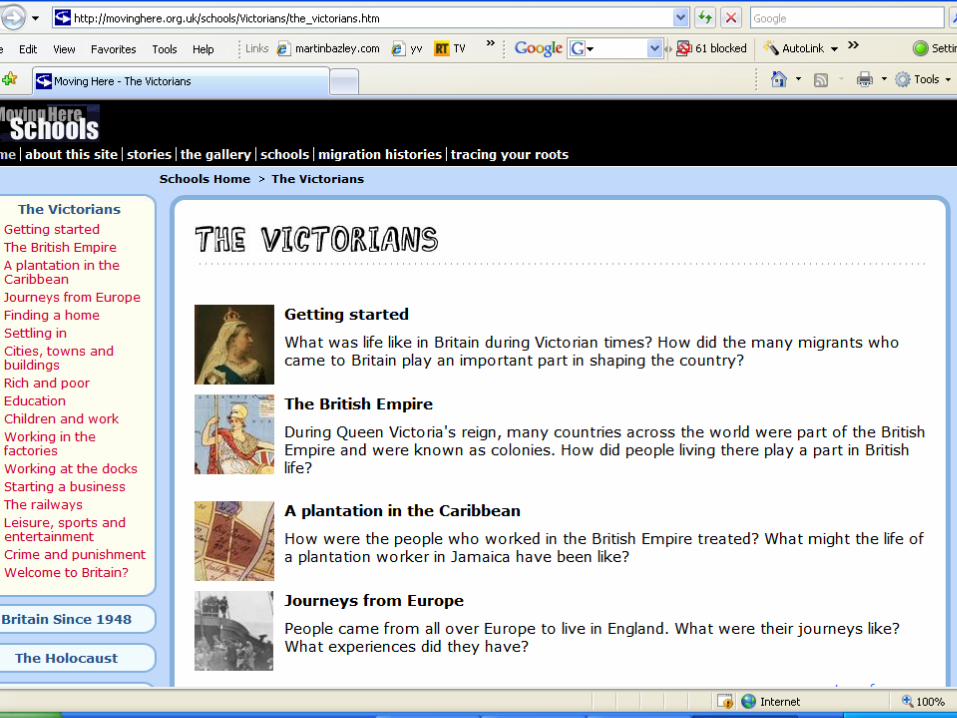
Moving Here Schools:For 8 – 14 yr olds studying:
History Geography and Citizenship
Features:
Interactives, activity sheets, audio
and video clips

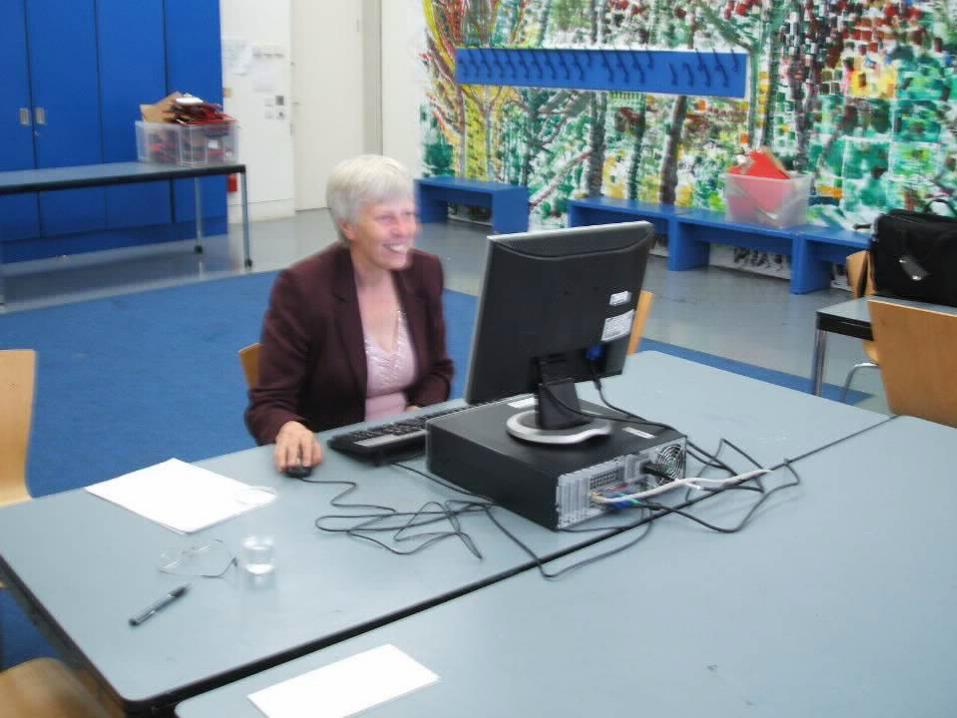
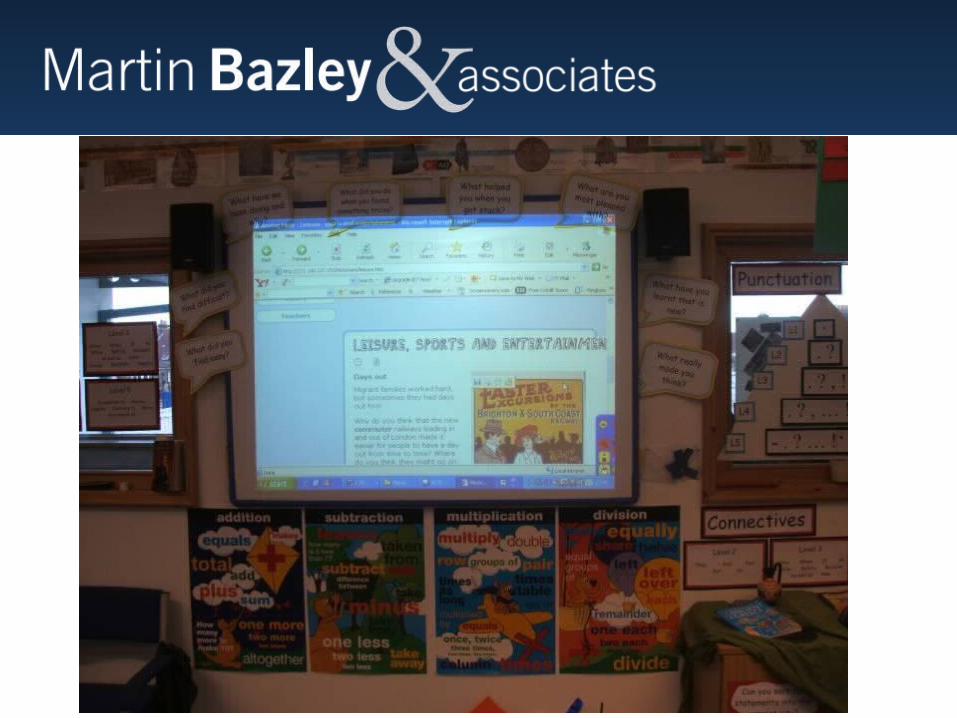
1. preliminary testing sessions –
conventional user-testing with teachers (at TNA)

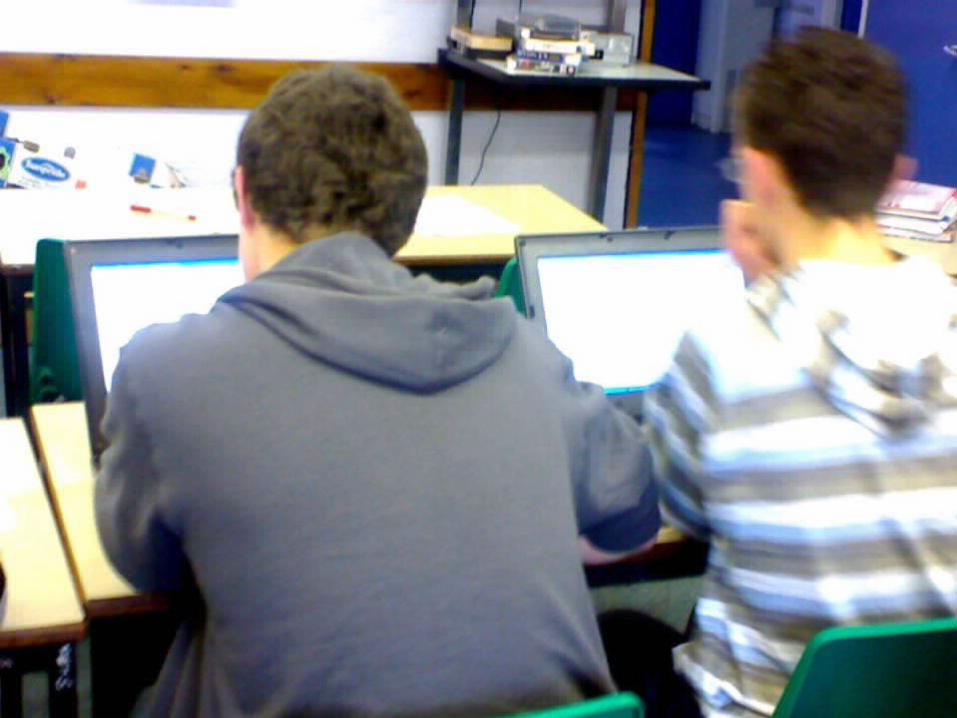
2. in-class testing – teachers used the Moving Here Schools site with pupils in their own classrooms This meant sitting at the back of the
classroom observing and taking notes…

Evaluation: 2-phase approach
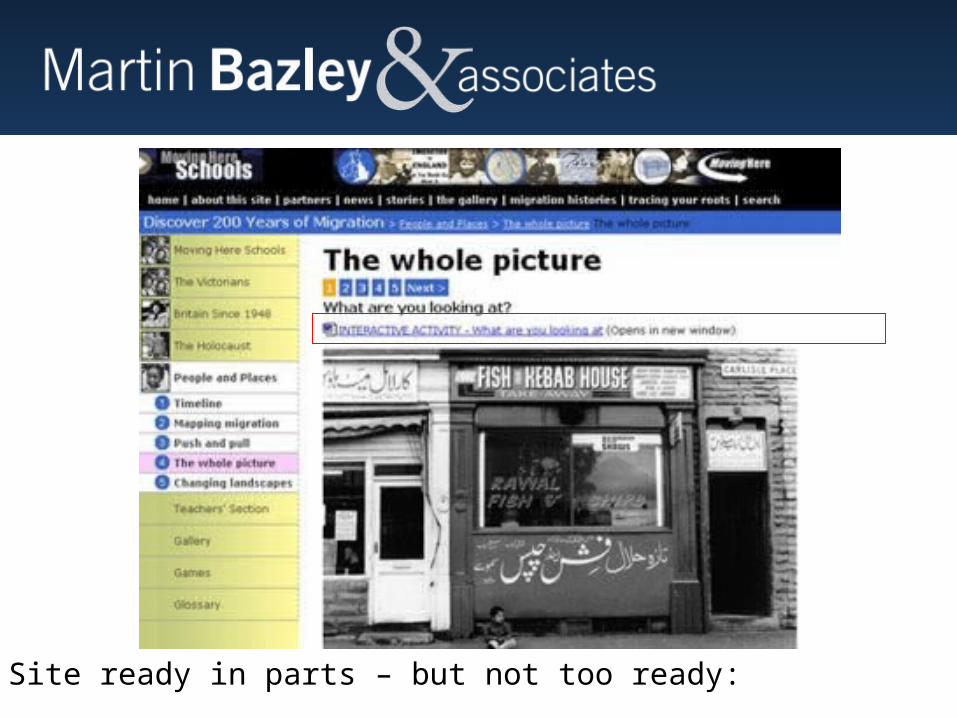
Site ready in parts – but not too ready:

The environment had a significant impact on how the site was used.
The class dynamic within the different groups contributed to how much the students learned.

The environment and social dynamics
The environment had a significant impact on how the site was used.
The class dynamic within the different groups contributed to how much the students learned.
in-class testing picked up elements not there in conventional user testing.
teachers in preliminary user testing did not spot some problems until actually in the classroom. For example…

interactive activities:
looked big enough when viewed on a screen nearby…

… but text/images too small for some children to see from the back of the class…
…so interactives needed to be viewable full-screen

Only spotted during in-class testing:
…so interactives needed to be viewable full-screen

content: when students tried to read text out loud, teachers realised some text was too difficult or complex

activity sheets:
some sheets did not have spaces for students to put their names - caused confusion when printing 30 at same time…

Manchester Art Gallery art interactive
For teachers of 8 – 11 yr olds, and for pupils
History Art and Citizenship
Features: interactive with built in video, quiz, etc,
plus activity sheets and background info


Martin Bazley
www.ICT4Learning.com

Martin Bazley
www.ICT4Learning.com

Martin Bazley
www.ICT4Learning.com

Martin Bazley
www.ICT4Learning.com

'This classroom user testing is all very well, but...'
How can you see everything in a class of 30 children – don't you miss things?
You see things in a classroom that don't arise in one-to-one testing
They are the real issues

'This classroom user testing is all very well, but...'
How can you see everything in a class of 30 children – don't you miss things?
You see things in a classroom that don't arise in one-to-one testing
They are the real issues

'This classroom user testing is all very well, but...'
Doesn't using a specific class with particular needs skew the results?
» For example, low ability, poor English, equipment not working, behaviour issues, etc - are results as reliable as those in a 'neutral' environment?
» ‘neutral environment’ ? – no such thing - any test will be subjective, and in any case:
» Testing is to make website work well in classroom, - need to see effects of factors like those.
'This classroom user testing is all very well, but...'

'This classroom user testing is all very well, but...'
Can't my Web developer do the testing for us? » best not to use external
developer to do user testing - conflict of interest
» also likely to focus more on the technical aspects of the site than on effect on the teacher and pupils.
» observe classes yourself but use an independent evaluator for key decision points
'This classroom user testing is all very well, but...'

'This classroom user testing is all very well, but...'
Can't my Web developer do the testing for us? » best not to use external
developer to do user testing - conflict of interest
» also likely to focus more on the technical aspects of the site than on effect on the teacher and pupils.
» visit a classroom yourself but use an independent evaluator for key decision points
'This classroom user testing is all very well, but...'

'This classroom user testing is all very well, but...'
I don't have the time or budget to do this!
» need cost no more than conventional user testing. one person could attend a one-hour class session in a school, giving the teacher the same small token payment
» This programme had evaluation built into project: 6.7% of total Schools site budget.
» Allow 5 -10% of total project budget for user testing
=> videos
'This classroom user testing is all very well, but...'
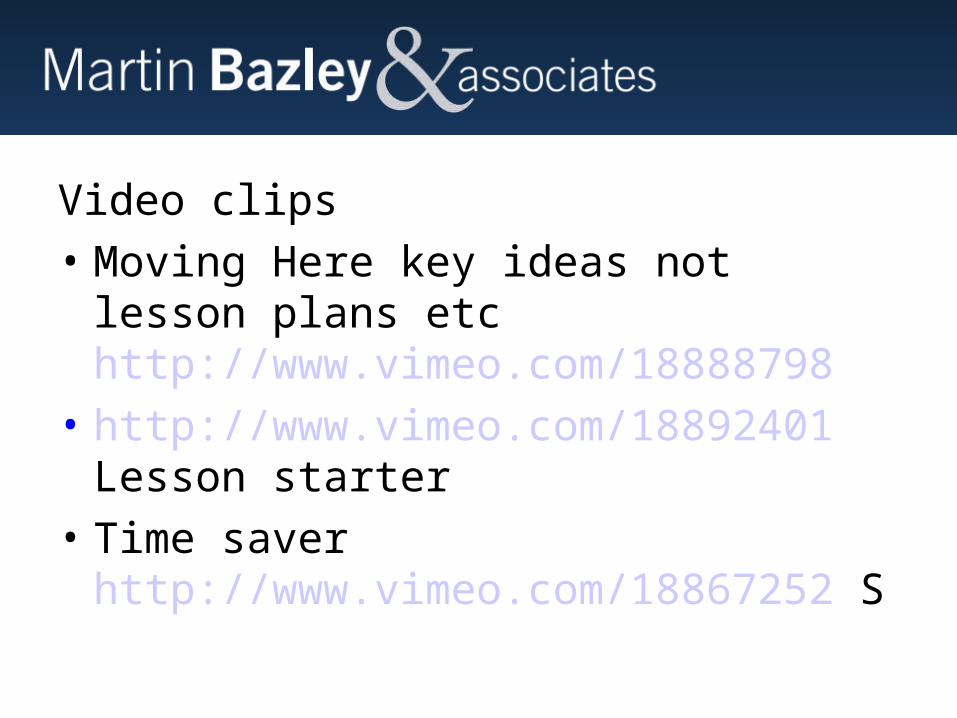
Video clips • Moving Here key ideas not lesson
plans etc http://www.vimeo.com/18888798
• http://www.vimeo.com/18892401 Lesson starter
• Time saver http://www.vimeo.com/18867252 S

User test early
Testing one user early on in the project…
…is better than testing 50 near the end
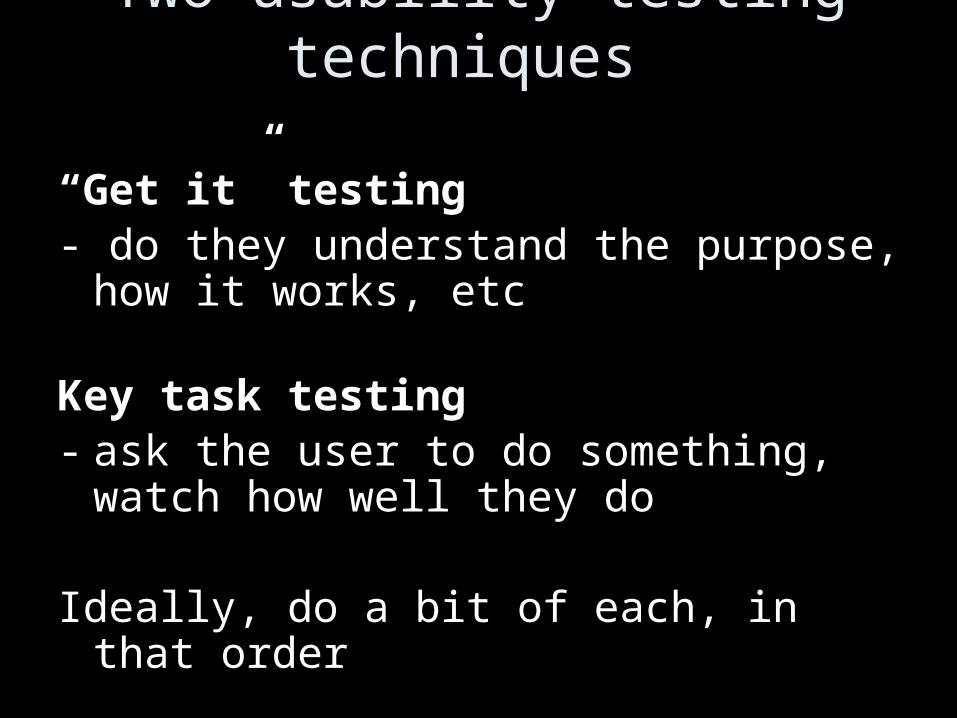
Two usability testing techniques
“Get it” testing- do they understand the purpose, how it
works, etc
Key task testing- ask the user to do something, watch how
well they do
Ideally, do a bit of each, in that order


User testing – who should do it?• The worst person to conduct (or interpret)
user testing of your own site is…– you!you!
• Beware of hearing what you want to hear…
• Useful to have an external viewpoint• First 5mins in a genuine setting tells you
80% of what’s wrong with the site

Strengths and weaknesses of different data gathering techniques

Data gathering techniquesUser testing
- early in development and again near endOnline questionnaires
– emailed to people or linked from websiteFocus groups
- best near beginning of project, or at redevelopment stage
Visitor surveys - link online and real visits
Web stats- useful for long term trends /events etc
Need to distinguish between:
Diagnostics – making a project or service better
Reporting – to funders, or for advocacy

Online questionnaires(+) once set up they gather numerical and
qualitative data with no further effort – given time can build up large datasets
(+) the datasets can be easily exported and manipulated, can be sampled at various times, and structured queries can yield useful results
(–) respondents are self-selected and this will skew results – best to compare with similar data from other sources, like visitor surveys
(–) the number and nature of responses may depend on how the online questionnaire is displayed and promoted on the website

Focus groups
(+) can explore specific issues in more depth, yielding rich feedback
(+) possible to control participant composition to ensure representative
(–) comparatively time-consuming (expensive) to organise and analyse
(–) yield qualitative data only - small numbers mean numerical comparisons are unreliable

Visitor surveys
(+) possible to control participant composition to ensure representative
(–) comparatively time-consuming (expensive) to organise and analyse
(–) responses can be affected by various factors including interviewer, weather on the day, day of the week, etc, reducing validity of numerical comparisons between museums
Web stats(+) Easy to gather data – can decide
what to do with it later(+) Person-independent data
generated - it is the interpretation, rather than the data themselves, which is subjective. This means others can review the same data and verify or amend initial conclusions reached

Web stats(–) Different systems generate
different data for the same web activity – for example no of unique visits measured via Google Analytics is generally lower than that derived via server log files
(–) Metrics are complicated and require specialist knowledge to appreciate them fully
Web stats(–) As the amount of off-website web
activity increases (e.g. Web 2.0 style interactions) the validity of website stats decreases, especially for reporting purposes, but also for diagnostics
(–) Agreeing a common format for presentation of data and analysis requires collaborative working to be meaningful
Martin Bazley0780 3580 737
www.martinbazley.com
More information / advice / ideas
SCA guidancehttp://sca.jiscinvolve.org/wp/audience-publications/
Good overview
Step by step approach
Culture 24 Let’s Get Realhttp://weareculture24.org.uk/projects/action-research/

Crit room
‘simulated user testing’

Crit room protocolSimulating user testing – usually one-
to-one in quiet roomNo one (especially site stakeholders)
other than tester say anything for first part of session
In this simulation we will focus on- Look and feel of site- Usability- Content

Happy to help - phone number on site:
Martin Bazley0780 3580 737
www.martinbazley.com
More information / advice / ideas