Embed Size (px)
Citation preview

A USERS’ GUIDE TO MEASURING CORRUPTION
2
A USERS’ GUIDE TO MEASURING CORRUPTION.
Copyright © 2008 by UNDP. All rights reserved. For information regarding the appropriate use of this document, contact UNDP Oslo Governance Centre.
Cover photo © Adaptorplug/Flickr. Used with permission.Cover and interior design by Jonathan Werve.
United Nations Development ProgrammeUNDP Oslo Governance CentreBorgatta 2B N-0650 Oslo, Norway
www.undp.org/[email protected]
FIRST EDITION ISBN Pending
First published September 2008
A USERS’ GUIDE TO MEASURING CORRUPTION
3
A Users’ Guide toMEASURING CORRUPTION
United Nations Development Programme
Global Integrity
A USERS’ GUIDE TO MEASURING CORRUPTION
5
1
3
5
11
14
20
24
30
33
43
44
47
51
53
55
55
58
59
62
64
72
This guide is a product of ongoing conversations with the larger com-
munity of anti-corruption and governance practitioners, researchers,
policy makers and donors. Comments and suggestions are welcome.
Please send your feedback to [email protected] or
ContentsForeword
Introduction
Chapter 1: Critical Review
Scale and Scope of Corruption Indicators
What is Being Measured: Inputs vs. Outputs
Methodology
Internal and External Stakeholders
Corruption Indicators: Country Context
Chapter 2: Voices from the Trenches
Chapter 3: Good Practices & Case Studies
Good Practices
Case Studies: A Government Offi cial’s Story
Case Studies: A Researcher’s Story
Case Studies: A Development Practitioner’s Story
Annex A: Endnotes & References
Endnotes
Interviewees
References
Annex B: Indicator Selection Checklist
Annex C: Corruption Indices
Annex D: National Tools for Measuring Corruption
A USERS’ GUIDE TO MEASURING CORRUPTION
7
AcknowledgementsA Users’ Guide to Measuring Corruption was commissioned by
the UNDP Oslo Governance Centre to Global Integrity.
We would like to thank Mohamed Abdel Aziz and Yuksel Yilmaz
of Global Integrity for their crucial assistance with preparing this
guide as well as the copy editor, Jennifer Frazier. We are indebted to
Åse Grødeland and Alessandra Fontana at Chr. Michelsen Institute
(CMI) who served as peer reviewers. We are also grateful to Phil
Matsheza, Anga Timilsina (UNDP Democratic Governance Group),
Noha El-Mikawy and Ingvild Oia (UNDP Oslo Governance Centre)
for their valuable contributions.
Finally, this Guide could not have been written without coopera-
tion from our interviewees (listed on page 58). We are grateful for their
insights and honesty in speaking with us.
Funding for this guide was provided by the UNDP Oslo Governance Centre, with additional support generously provided by the World Bank.
AuthorsGlobal Integrity:Raymond June, lead author
Afroza Chowdhury
Nathaniel Heller
Jonathan Werve
EditorsUNDP Oslo Governance Centre:Marie Laberge
Joachim Nahem
A USERS’ GUIDE TO MEASURING CORRUPTION
1
ForewordBy Bjørn FørdeDirector, UNDP Oslo Governance Centre
In recent years we have wit-
nessed explosive growth in
the production and use of gov-
ernance indicators by domestic
stakeholders. These include state
and non-state actors in develop-
ing countries, as well as interna-
tional investors, donors of offi cial
development assistance, develop-
ment analysts and academics.
Citizens of developing countries
are demanding better perfor-
mance from governments, and
they are increasingly aware of the
costs of poor management and
corruption. Increasingly, scarce
resources – especially resources
from external donors – are being
allocated to governments that will
use them most effectively. As a re-
sult, countries are asking for help
diagnosing governance failures
and fi nding solutions.
It is in this broader context
that UNDP has decided to give
priority to developing the capacities
of national actors to measure and
monitor the quality of governance
as a critical support area in its
democratic governance program.
For UNDP, governance as-
sessments most effectively improve
democracy when they are ground-
ed in nationally owned processes,
are based on nationally and locally
developed indicators, and are
designed with policy makers and
policy reform in mind.
In this regard, assessments
that are disaggregated to show
differences within countries across
geographic areas and across
income groups and social divides
will help to make governance
reforms more sensitive to poverty
and gender issues and to the needs
of vulnerable groups in general.
Since 2003, the UNDP Oslo
Governance Centre (OGC) has
been developing knowledge prod-
ucts and tools, providing dedicated
support to national partners that
want to assess the quality of demo-
cratic governance in their countries.
As part of this effort, in
2006 the OGC developed Gover-
nance Indicators: A Users’ Guide
which aims to help users make
sense of governance indicators.
In view of the high interest gen-
erated by this fi rst publication,
we are now producing a second
generation of users’ guides on
selected areas of governance,
including corruption, decentral-
ization and local governance,
public administration reforms
and more.
Citizens of developing countries are demanding better performance from governments.
A USERS’ GUIDE TO MEASURING CORRUPTION
2
This book, A Users’ Guide to
Measuring Corruption, is targeted
at national stakeholders, donors
and international actors involved
in corruption measurement and
anti-corruption programming. It
explains the strengths and limita-
tions of different measurement
approaches, and provides practical
guidance on how to use the indica-
tors and data generated by corrup-
tion measurement tools to identify
entry points for anti-corruption
programming.
Awareness of governance
and corruption measurement
tools is growing, and the various
tools available are becoming more
complementary. Despite this, little
systematic research has been done
to explore how best to use these
tools to design actionable reforms.
It is our hope that this guide
will help fi ll the information gap,
identifying “good practices” that
will make nationally owned and
driven anti-corruption initiatives
more effective.
Let me fi nally acknowledge
the cooperation of Global Integrity
and the quality product the orga-
nization has produced. It has been
a true pleasure to see the willing-
ness of individuals both outside
and inside UNDP contribute to
this guide.
The UNDP Oslo Gover-
nance Centre (OGC) is based
in Oslo, Norway and is a part
of the Democratic Gover-
nance Group in the Bureau
for Development Policy.
OGC has been sup-
porting national initiatives
for monitoring and measur-
ing governance focused on
the development of national
governance indicators since
2003. UNDP Country Offi ces
have registered a rising de-
mand to assist national coun-
terparts develop their capac-
ity to engage in nationally
owned and driven democratic
governance assessments.
In response, capacity
development for country-led
governance assessments and
measurements are a prior-
ity in the UNDP’s strategic
plan for 2008-2011. The newly
launched Global Programme
on Capacity Development
for Democratic Governance
Assessments and Measure-
ments addresses the need
to better understand various
methods and approaches to
assess and measure demo-
cratic governance and its
links to pro-poor planning,
budgeting, and delivery of
the Millennium Development
Goals. See http://www.undp.
org/oslocentre/fl agship/
democratic_governance_as-
sessments.html for more
information on UNDP’s work
on governance indicators.
The UNDP’s Global Programme
A USERS’ GUIDE TO MEASURING CORRUPTION
3
IntroductionBy Nathaniel HellerManaging Director, Global Integrity
One could persuasively argue
that the science of measur-
ing corruption is more an art form
than a precisely defi ned empirical
process. During the past several
years, a fl ood of new work has
emerged, challenging the validity
of the traditional measurements
of corruption and arguing for new
and improved tools for national
policy makers, civil society and
donors alike.
Is it possible to measure
corruption, and if so, how? A
Users’ Guide to Measuring
Corruption argues “yes,” and
proposes ways to do so, but with
some important caveats.
The fi rst, and most sig-
nifi cant, is the need for users of
corruption measurement tools to
employ multiple sources of quan-
titative data, qualitative narrative
analysis and real-life case studies
to “paint a picture” of corrup-
tion in a country, sub-national, or
sector context.
As we describe
throughout this
guide, no single
data source or
tool will offer a
defi nitive measurement. It is only
through the careful parsing and
comparison of the available tools
– and sometimes the generation of
new tools – that users can arrive at
a more accurate measurement.
Another important theme
that recurs throughout this guide
is the need for users to gravitate
toward “actionable” measure-
ments that provide insight into
where reforms can be made. To
put it plainly, there is little value
in an anti-corruption measure-
ment if it does not tell us what
needs to be fi xed.
For example, commonly
used external measures of cor-
ruption outputs, such as Western
businessmen’s perceptions of
bribery in business transactions,
are extremely broad and simply
not useable for this type of analy-
sis. But nationally generated tools
that are customized to a country’s
specifi c policy challenges have the
advantage of being designed to
yield actionable data.
No single data source or tool will offer a defi nitive measurement.
To put it plainly, there is little value in a measurement if it does not tell us what needs to be fi xed.
A USERS’ GUIDE TO MEASURING CORRUPTION
4
These key themes, as well as other strategies designed to im-
prove our ability to measure what is an inherently amorphous con-
cept, were sketched out by taking a relatively novel approach to the
topic: we talked to the people who use corruption measurements on a
day-to-day basis.
This guide is the amalgamation of more than 30 interviews with
individuals from dozens of countries who are working on corruption
and governance reforms, including government offi cials, development
practitioners, donor representatives and multilateral specialists. Their
feedback is summarized in Chapter 2 and informs many of the Good
Practices highlighted in Chapter 3. A helpful glossary of key terms is
also included alongside the text as a quick reference for readers.
So back to our core question: can we measure corruption? The
answer is a qualifi ed “yes.” How do we do it? While it may always be a
more artful than empirical process, by taking the approach laid out in
this guide we can indeed arrive at informed measurements that begin
to lay out a roadmap for reform.
A USERS’ GUIDE TO MEASURING CORRUPTION
5
Chapter 1: Critical ReviewThe Conceptual Landscape of Corruption Indicators: What Users Need to Know
The number of indices focused
on corruption measurement,
and by extension good gover-
nance, has grown exponentially
over the past decade. They range
from some of the more established
and widely used indicators like
Transparency International’s (TI)
Corruption Perceptions Index
(CPI) and the World Bank’s
Worldwide Governance Indica-
tors (WGI), to a newer generation
of measurement and assessment
tools like the Ibrahim Index of
African Governance, the Global
Integrity Report and the Global
Integrity Index.
Adding to the mix are some
area-specifi c tools, such as the
Open Budget Index, as well as
purely qualitative political-econ-
omy approaches to exploring the
issues like the United Kingdom’s
Department for International
Development’s (DFID) Drivers of
Change assessments.
In this guide, the term
“indicator” is distinguished
from “assessment” when dis-
cussing measures or analyses
of corruption.
A corruption indicator
is a measure that points out
something about the state
of governance or about a
particular aspect of corrup-
tion in a country.
An assessment is a
broader contextual analysis
of the state and drivers of
corruption, often relying on
multiple indicators of cor-
ruption. In other words, a
corruption assessment draws
from the data collected
to help identify particular
institutions or institutional ar-
rangements as the causes of
corruption, and to help iden-
tify appropriate solutions.
We refer to assessments
as analyses that are anchored
in a normative framework
about ‘good governance’.
A balanced assessment will
draw from a mix of qualita-
tive and quantitative corrup-
tion indicators.
Defi ning Some Key Terms
There also has been a
signifi cant rise in country specifi c
tools that measure corruption,
albeit at a slower pace, as
evidenced in a recent mapping
of African and Latin American
corruption measures1, as well
as the World Bank Governance
and Anti-Corruption (GAC)
Diagnostics.
A USERS’ GUIDE TO MEASURING CORRUPTION
6
In response to the rise in the number of governance indicator
sources (best cataloged by the UNDP’s Governance Indicators: A
Users’ Guide2), the trend has been for experts in the fi eld, particu-
larly national stakeholders and aid donors, to decry this “prolifera-
tion” of corruption and governance assessments as overly duplicative,
distracting and harmful to effective donor coordination and harmo-
nization on the governance reform agenda. Actual evidence of that
harm is harder to come by, but the argument seems compelling.
The reality is actually quite different from what many believe.
Without a doubt, the number of indices, toolkits and qualitative cor-
ruption assessments has increased during the past decade. But almost
without exception, the vast majority of these toolkits are fundamen-
tally – and importantly – different in scope, units of analysis and
methodologies. In other words, they are measuring very different
things, despite having similar sounding titles.
Take, for example, the two most widely used corruption mea-
surement metrics: Transparency International’s (TI) Corruption
Perceptions Index (CPI) and the World Bank’s Control of Corruption
indicator. Both are composite indicators, made up of distinct compo-
nent data sources that assess a wide and differing range of concepts.
Fourteen sources were used in the 2007 CPI, including Freedom
House’s Nations in Transit, the Asian Development Bank’s Country
Performance Assessment Ratings, and the World Economic Forum’s
Global Competitiveness Report, while twenty-fi ve sources were used
for the World Bank’s Control of Corruption indicator. Yet both the
CPI and the World Bank’s Control of Corruption indicator (as well as
dozens of other disparate tools) are often lumped together. They are
simply termed “corruption measures,” and are routinely compared to
and contrasted with fundamentally unique country-specifi c house-
hold and fi rm surveys, implying that these metrics should closely
track with such surveys.
In fact, often the only thing such measurement tools have in
common is a combination of the words “governance,” “corruption,”
“transparency,” “accountability,” or “democracy.” It is this labeling
confusion (which refl ects a lack of defi nitional consensus on “corrup-
tion” and “governance,” an issue that will be discussed in depth later),
rather than actual duplication, that has led many to believe that we
now have too many corruption measurement tools.
Assessments: Broad contextual analy-ses of the state and drivers of corrup-tion that often rely on multiple indica-tors of corruption, including qualitative and quantitative corruption indicators.
Composite Indicators: A composite or aggregate indicator is one which combines different measures of a similar thing into a single measure. A well known example of this would be the Human Development Index which measures human development by combining indicators of life expectan-cy, educational attainment and income.
Corruption: There is no interna-tional consensus on the meaning of corruption. Nevertheless, a popular way of differentiating corruption is by its scale. Petty corruption refers to street-level, everyday corruption that ordinary citizens experience as they interact with low/mid-level public offi cials. Grand (or political) corrup-tion generally involves much larger sums of money and normally affects the country as a whole, as well as the legitimacy of the national government and elites. The most popularly used defi nition is the abuse of public offi ce or public position for private gain.
While measurement tools have multiplied, these toolkits measure very different things,
despite having similar-sounding titles.
A USERS’ GUIDE TO MEASURING CORRUPTION
7
A user’s primary challenge is interpreting which measurement
tools are most appropriate for his or her purposes. The labels are not
going to help, so the only way to successfully determine which metrics
are most appropriate is to do what most users don’t do – take the time
to understand the methods and objectives of each measurement tool
prior to implementation.
As a fi rst step, this section analyzes existing corruption indicators
(and some closely related governance indicators) by introducing four
conceptual lenses. Through these lenses, we can better view and un-
derstand each indicator’s conceptual focus and measurement method-
ology. This will be helpful for users trying to understand which set of
indicators could be most relevant in identifying and addressing specifi c
governance and corruption challenges.
Existing corruption indicators can be classifi ed into four catego-
ries, constituting a sort of informal taxonomy:
• The scale and scope of indicators
• What is actually being measured
• The methodology employed
• The role that internal and/or external stakeholders play in generat-
ing the assessments.
Within each category, a careful distinction is made between “cor-
ruption” and “governance.” Although the two terms are often confl ated,
it is useful to parse them into discrete concepts since corruption (and
corruption control) is but one, albeit signifi cant, aspect of governance.
Governance has been broadly defi ned to encompass everything
from the rule of law, civil society and democracy to human rights,
gender equality and control of corruption. (This will be discussed in
further detail below.) While diffi cult, it is important that indicator us-
ers understand where “corruption” stops and “governance” begins.
Even when indicators focus specifi cally on corruption, it’s impor-
tant to realize that the term “corruption” also has plural meanings.
The conceptual and defi nitional fuzziness is particularly challenging
when trying to understand how the major types of corruption mea-
surement instruments can be used to measure different forms of cor-
ruption (see Corruption Measurement Tools, next page).
Corruption Indicators: Refer to discrete, often quantitative, mea-surements of a particular aspect of corruption (including the “level” of corruption).
Governance: Like corruption, the meaning of governance is manifold. For UNDP, it comprises the mecha-nisms and processes for citizens and groups to articulate their interests, mediate their differences and exercise their legal rights and obligations. It is the rules, institutions and practices that set limits and provide incentives for individuals, organizations and fi rms.
Often the only thing that seemingly redundant measurement tools have in common is some combination of the words governance, corruption, transparency, accountability, or democracy.
A USERS’ GUIDE TO MEASURING CORRUPTION
8
In addition to classifying
corruption indicators according
to scale, what is being measured,
methodology and the role that
internal and external stakehold-
ers play, this guide also examines
corruption metrics based on the
various “types” of indicators. This
approach should help the user bet-
ter understand the data presented.
The main types of corruption
indicators are:
• Perception-based indicators and
experience-based indicators
• Indicators based on a single data
source and composite indicators
• Proxy indicators
Perception-based indicators
are among the most frequently
used measurement tools. They rely
on the subjective opinions and
perceptions of levels of corruption
in a given country among experts
and citizens. Experience-based
indicators attempt to measure
actual personal experience with
corruption. Experience-based
measurement tools ask citizens
if they have been asked to give a
bribe, or if they have voluntarily
offered something to an offi cial.
Perception-based and experience-
based indicators can diverge widely
as respondents are often reluctant
to openly discuss bribe-giving.8
Indicators based on a single
data source are produced by the
publishing organization with-
out recourse to third-party data.
Composite indicators, on the other
hand, aggregate and synthesize
Which corruption mea-
surement instrument should
you use? It depends on the
form of corruption being
assessed. In this sidebar,
several types of corruption
are described, along with
corresponding measurement
tools that could be used to
appropriately gauge levels.
This is by no means an ex-
haustive list.
PETTY AND GRAND CORRUPTION
This is the most popu-
lar way of differentiating
various forms of corruption.
In general, petty corruption is
defi ned as street level, every-
day corruption. It occurs when
citizens interact with low- to
mid-level public offi cials in
places like hospitals, schools,
police departments and other
bureaucratic agencies. The
scale of monetary transaction
involved is small and primar-
ily impacts individuals (and
disproportionably the poor).
In contrast, grand (or
political) corruption often
involves much larger sums of
money. It negatively impacts
the country as a whole, along
with the legitimacy of the
national government and
national elites.3
Household surveys
of citizens are particularly
helpful tools in assessing
the perception and experi-
ence of petty corruption in
everyday lives. One of the
most prominent household
questionnaire tools is pro-
duced by Développement
Institutions et Analyses de
Long terme (DIAL), which has
been a pioneer in developing
democracy and governance
indicators in using household
surveys as a statistical instru-
ment for low-income coun-
tries.4 Another example of a
robust household survey is
Transparency International’s
Global Corruption Barometer,
a public opinion survey of the
perceptions and experiences
of petty bribery.
Focusing on petty cor-
ruption in Africa, Asia, Latin
America, and Europe, the
Afrobarometer, Asiabarom-
eter, Latinobarometer and
Eurobarometer are regional
series of national public
attitude surveys that track
public opinion about democ-
racy and governance issues,
including corruption, through
household questionnaires.
To assess the extent of
Corruption Measurement Tools
CONTINUED ON PAGE 10
A USERS’ GUIDE TO MEASURING CORRUPTION
9
different measures generated by various third-party data sources. In
the corruption realm, composite indicators remain the most widely
used measurement tools because of their near-global coverage,
which allows cross-country comparisons to inform aid or business
decisions internationally.
Finally, because it has been argued that corruption cannot be
observed empirically (how can one measure a phenomenon that one
cannot fully observe?), proxy indicators seek instead to assess cor-
ruption through indirect measures by aggregating many “voices” and
signals of corruption, or by measuring the opposite: anti-corruption,
good governance and public accountability mechanisms.
Particular attention will be paid in this guide to indicators that
provide data on the impact of corruption on women and lower in-
come groups, since cross-country studies have suggested that people
experience or perceive corruption differently according to their
gender and/or income level. For the purpose of selecting indicators,
a corruption indicator might be considered “pro-poor” if it is disag-
gregated by poverty status (the value of the indicator is calculated
separately for the part of the population characterized as “poor”).
Disaggregation is important because it allows the value of an
indicator for the poor to be compared with the value of the same
indicator for the non-poor. But even disaggregated indicators might
fail to reveal some features of anti-corruption programs that are
of particular signifi cance to low-income groups and women. Other
indicators which are “specifi c to the poor” can help capture those by
measuring corruption that specifi cally impacts the poor, such as cor-
ruption in free health-care clinics.
The UNDP Framework for Selecting Pro-Poor and Gender
Sensitive Governance Indicators offers useful examples of anti-cor-
ruption indicators that are disaggregated by poverty status (e.g.,
percentage of poor households using public services who experienced
corruption directly in the last 12 months) and specifi c to the poor
(e.g., percentage of reported corruption in public agencies of particu-
lar relevance to the poor like schools, health clinics, police, etc.).
In addition, the United Nations Convention against Corruption
(UNCAC), which was adopted in 2003 by more than 140 states, provides
a normative and globally agreed upon framework for combating corrup-
tion. Recognizing UNCAC as an important monitoring framework for
In the corruption realm, composite indicators remain the most widely used measurement tools because of their near-global coverage.
Perception-based Indicators: In-dicators based on the opinions and perceptions of corruption in a given country among citizens and experts.
Experience-based Indicators: These indicators measure citizens’ or fi rms’ actual experiences with corruption, such as whether they have been offered or whether they have given a bribe.
Proxy Indicators: Buoyed by the belief that corruption is impossible to measure empirically, proxy indicators assess corruption indirectly by aggre-gating as many “voices” and signals of corruption, or by measuring its oppo-site: anti-corruption, good governance and public accountability mechanisms.
Objective Indicators: Indicators constructed from undisputed facts. Typical examples might include the existence of anti-corruption laws or the funding received by the anti-corruption agency.
Pro-Poor and Gender-Sensitive Indicators: A pro-poor indicator requires a focus on those living in poverty, and a gender sensitive indica-tor captures the different experiences and interests of women and men. Such indicators are useful to track the potentially different impacts that the mechanisms and processes of gover-nance have on different social groups.
A USERS’ GUIDE TO MEASURING CORRUPTION
10
combating corruption, this guide
will try to tie existing indicators
and toolkits to the specifi c anti-
corruption provisions contained in
the Convention.
Rather than defi ning cor-
ruption, the Convention outlines
specifi c and discrete anti-corrup-
tion and government accountabil-
ity policy measures that member
states should integrate into their
national development plans. This
includes, inter alia, the establish-
ment of coordinated anti-corrup-
tion laws and regulations (Article
5), bodies or agencies (Article 6)
and public disclosure laws (Ar-
ticle 10). Article 5, in particular,
recognizes that national anti-
corruption policies should be
coordinated in tandem with other
governance policies and reforms.
The article also acknowledges
that national anti-corruption
policy making is not rational
and linear but rather a dynamic
and inherently political process.9
Hence, despite the varying ways
in which corruption is interpreted
and approached in diverse nation-
al polities, the Convention can
provide coordinated, yet fl exible
parameters for countries to com-
bat corruption.
Although the implementation
of UNCAC in different national
contexts has been challenging,
hampered by weak political buy-
in by key national actors, the
Convention, Article 5 in par-
ticular, is nevertheless considered
a gateway for integrating both
common preventive measures
grand corruption, users may
consult the World Bank’s
Global Competitiveness
Report, which features indica-
tors of grand corruption such
as confl ict of interest regula-
tion, party fi nancing oversight
and judicial accountability,
among others.
It is important to re-
member that there is no
international consensus on
the meaning of “corruption,”
and this blurriness has direct
implications on international
corruption rankings.
CORRUPTION IN THE PRIVATE SECTOR
Although most of the
corruption indicators used
today are focused on cor-
ruption in the public sector,
the private sector in both
industrialized and develop-
ing/transitional societies has
merited closer scrutiny. Pri-
vate sector corruption can
be exemplifi ed by private
actors who buy off public
offi cials or civil servants and
high-level political leaders
who extort businesses.
There are a number of
useful tools that evaluate
private sector corruption.
Transparency International’s
(TI) Bribe Payers Index (BPI)
focuses on the likelihood
of foreign fi rms paying
bribes, TI’s CRINIS project
examines transparency in
political fi nancing, and the
World Business Environment
Survey (WBES) shows that
corruption is a signifi cant
obstacle to enterprises
conducting business. Ad-
ditional resources include
the Business Environment
& Enterprise Performance
Survey (BEEPS) which com-
pares countries with regard
to investment climate,
competitiveness and gover-
nance in specifi c areas, and
the World Bank’s Control of
Corruption indicator, which
measures perceptions of
the extent to which pub-
lic power is exercised for
private gain, including both
petty and grand forms of
corruption, as well as “state
capture” by private actors.5
There remains a dearth
of corruption indicators spe-
cifi cally designed to assess
private sector-to-private
sector corruption.6
Corruption Measurement ToolsCONTINUED FROM PAGE 8
CONTINUED ON PAGE 12
A USERS’ GUIDE TO MEASURING CORRUPTION
11
from UNCAC and distinctive country-specifi c anti-corruption/public
integrity strategies.10 The fl exibility provided by the Convention in
developing country-specifi c anti-corruption/public integrity strategies
requires that national policy makers be able to develop appropriate
indicators relevant to their specifi c country context. This guide aims
to provide guidance to this end.
Understanding the strengths and weaknesses of the various meth-
odologies and being clear on what they are measuring is the most impor-
tant entry point for making informed decisions about which measure-
ment tool to use, depending on the context. This topic will be explored
in depth further on.
A “Quick Tip” at the end of each section will help the reader avoid
common misuses and misperceptions.
Scale and Scope of Corruption Indicators
What do corruption indicators measure or assess? This would seem
an obvious question to answer before choosing a measurement tool, but
far too often users overlook this fundamental issue in favor of grabbing
whatever seems convenient and contains “corruption” in its title.
This core question has been diffi cult to answer, largely because
there is no consensus on the defi nition of “corruption” or “gover-
nance” among academics, aid donors and development practitioners.
Understanding what “corruption” means is crucial for users who are
seeking actionable indicators and analysis to inform specifi c reform
objectives and policy priorities.
Confounding the issue further, there is wide variation in the
meaning of these concepts among different users, especially as the
evaluation of governance has broadened to include human rights,
democracy, civil society, accountability, business transparency,
fi scal accountability and the rule of law. Virtually every generator
of governance or corruption indicators says it is measuring
“governance” or “corruption,” with little clarity regarding what is
actually being assessed.
For example, the World Bank suggests that “governance refers
to the manner in which public offi cials and institutions acquire and
exercise the authority to shape public policy and provide public goods
and services.”11 UNDP uses the concept of “democratic governance” to
The term “corruption” has been applied to such a wide variety of beliefs and practices that pinning down the concept is diffi cult.
A USERS’ GUIDE TO MEASURING CORRUPTION
12
CORRUPTION IN EMERGENCIES AND POST-CONFLICT RECONSTRUCTION PROJECTS
Countries suffering
from disasters or emerg-
ing from confl ict are
often prone to corruption.
Weak state capacity, poor
oversight and virtually no
rule of law create an en-
vironment that is ripe for
corruption. This corruption
often occurs within recon-
struction and emergency
procurement programs
that are intended to ben-
efi t citizens.
In such cases, metrics
that track procurement
and public budget ex-
penditure, like the Public
Expenditure Tracking
Surveys (PETS), are es-
sential, as they monitor
aid programs and recon-
struction processes. Also
important are tools that
evaluate the extent to
which high-ranking public
offi cials are vulnerable to
corruption in public works
and re-construction, such
as the BPI.7
Corruption Measurement ToolsCONTINUED FROM P. 10
refer to governance systems where people have a voice in the decisions
that affect their lives and can hold decision-makers accountable.14
The term “corruption” has been applied to such a wide variety of
beliefs and practices that pinning down the concept has proven diffi -
cult.15 To foster some standardization and consistency, agencies such as
the World Bank, Transparency International and UNDP have defi ned
corruption as the “abuse of public offi ce for private gain.”16 Although
it has been widely adopted, several critics have observed that such
defi nitions are culturally biased and excessively narrow.17 In response
to the charge that indices of corruption tend to be Western-centric,
efforts have been made to create more balanced corruption measure-
ment tools. For example, research staff at Transparency International
created the Bribe Payers Index (BPI) to examine the “supply side of
corruption,” i.e., the role of foreign fi rms from developed industrial-
ized nations in offering bribes.
The debates continue. And without international consensus on
what corruption is, creating an international corruption ranking sys-
tem becomes impossible. How, for example, do you reconcile various
defi nitions of corruption into one universal ranking instrument when
certain types of payments are perfectly legal in one country, but il-
legal in another?18
This broad defi nitional scope is refl ected in the diversity of assess-
ments that seek to capture the extent of corruption and the quality of
good governance and anti-corruption mechanisms. Freedom House,
for example, publishes an annual evaluation of democracy that focuses
on political freedom and civil liberties in more than 190 countries.
The Ibrahim Index of African Governance is a regional assessment of
human security, human rights, economic opportunity and human de-
velopment, in addition to rule of law/transparency/corruption perfor-
mance in 48 sub-Saharan countries.
The Worldwide Governance Indicators, produced by the World
Bank, include corruption in their assessment of quality of gover-
nance. Combining citizen and expert views from industrial and
developing countries, this assessment includes six aggregate indicator
categories: voice and accountability, political stability and absence
of violence, government effectiveness, regulatory quality, rule of law
and control of corruption.
Similarly, the Heritage Foundation considers “freedom from corrup-
tion” one of 10 components in its Index of Economic Freedom. In contrast,
Transparency International’s Corruption Perceptions Index (CPI) focuses
exclusively on indicators of perceptions of corruption, although, as with
other indices, the types of corruption and how they are measured is unclear.
Further confusing issues, the Heritage index uses the CPI as source data!
A USERS’ GUIDE TO MEASURING CORRUPTION
13
Absent greater defi ni-
tional precision in available
measurement tools, how can
users make their way through
this jungle of “governance”
and “corruption” toolkits?
A fi rst and crucial step is to
ignore (to a practical extent)
the measurement tool’s own
labels and focus instead on
understanding the underly-
ing questions or indicators
that generate an aggregate
category or index score. For
example, one index’s “rule of
law” score may focus largely
on the legal framework of a
country’s constitution and
criminal and civil codes, while
another index’s “rule of law”
score may focus entirely on
citizen access to justice, cor-
ruption in the courts or the
ability of businesses to en-
force contracts and property
rights. Still a third may collect
household responses that
describe the extent to which
bribes are paid to enforce
court rulings.
These are markedly dif-
ferent concepts that are not
necessarily mutually exclusive
– there are many countries
that boast world-class con-
stitutions despite massive
corruption in the courts, poor
contract enforcement and
discrimination in the crimi-
nal justice system. So, sig-
nifi cantly different scores on
one index compared to the
other may not mean that one
index’s “rule of law” score
is right and that the other is
wrong. Instead, it may signal
that the two measurement
tools are assessing different
concepts. If users can grasp
those underlying differences
by ignoring an index’s labels
and unpacking component
indicators, they can make
informed choices as to which
tool is best for their respec-
tive objectives.
QUICK TIP:Beating the labeling problem
Despite the (perceived or real)
proliferation of corruption and gov-
ernance indicators and the potential
for confusion, some analysts note
that “most defi nitions of gover-
nance agree on the importance of
a capable state operating under the
rule of law,” with varying degrees
of “emphasis on the role of demo-
cratic accountability of govern-
ments to their citizens.”19 In other
words, there is some consensus over
what governance means, since a
minimalist defi nition encompasses
at the very least government ac-
countability to citizens as well as
the rule of law (although “rule of
law” is itself a term with defi ni-
tional issues).
At the same time, the ab-
sence of a standard agreement
over the meaning of “governance”
risks draining it of specifi city and
making it a catch-all term.20 The
meaning of “corruption” similarly
lacks conceptual coherence and
has been subject to intense defi ni-
tional debate. It may be diffi cult
to identify what is being assessed
by corruption indicators with any
precision (for instance, institutions,
rules, petty corruption, bribery,
governance and results).
This is especially true for
composite indices, which sub-
sume several datasets into one (or
more) corruption or governance
indicator(s) that risk making them
meaningless.21 As such, composite
corruption and governance indica-
tors can be less effective in provid-
ing operational data to users than
single-source indicators.
A USERS’ GUIDE TO MEASURING CORRUPTION
14
Specifying the scale and scope of corruption and governance
concepts can generate more targeted indicators. For instance, a closer
look at individual data sources making up the World Bank’s Control
of Corruption indicator and Transparency International’s (TI) Corrup-
tion Perceptions Index (CPI) reveals that the World Bank measures cor-
ruption in the public and private sector (with some individual sources
providing data on corruption at the household level) as perceived by
“experts” and opinion polls. The CPI measures corruption only in the
public sector, as perceived by “experts” only.
What is Being Measured: Inputs vs. Outputs
Although defi nitions of corruption vary, corruption measures tend
to cluster around two types: measures of the existence and quality of
institutions, rules, and procedures (governance or anti-corruption “in-
puts”) or measures of what those mechanisms lead to in practice (gov-
ernance or anti-corruption “outputs” or “outcomes”).22 In other words,
input-based indicators focus on appraising the rules “on the books,”
while outcome-based indicators assess the governance system’s deliver-
ables to citizens in a country, including reduced levels of corruption.
Governance and corruption are tricky to measure. In most
cases, empirical measurements cannot be used. Consider other is-
sues where empirical measurements may be employed, like crime
prevention: outputs could be measured by crime rates, while inputs
could be measured by the number of police offi cers on the street.
Governance and corruption aren’t so cut-and-dried, so measure-
ments of outputs rely a great deal on proxies, rather than on empiri-
cal statistics. For instance, no one believes that the number of cor-
ruption cases brought to trial serves as an appropriate measurement
of an “anti-corruption output.” Changes in this proxy measure are
ambiguous. An increase in the number of corruption cases brought
to trial could indicate a higher incidence of corruption, an increased
level of confi dence in the court, or both.
Surveys that look at citizens’ experiences with bribery and cor-
ruption, and interviews with respondents that explore public service
delivery and trust in government come closest to directly measuring
corruption outcomes. While not measuring “corruption” per se, they
are instead measuring various proxies that, hopefully, can shed light
on corruption levels.
Corruption measurement tools that primarily assess inputs
have the benefi t of providing clear information on key benchmarks
– such as the existence and strength of offi cial laws, regulations, and
institutions – that are important to the architecture of good governance
Input-based Corruption Indicators: Also called de jure indicators, these are indicators measuring the existence and quality of anti-corruption or governance institutions, rules, and procedures, i.e., the de jure rules “on the books.”
Output-based Corruption Indicators: Also called de facto indicators, these are indicators that measure the impact of corruption on quality of life and public service delivery, i.e., the de facto deliverables of the governance system. These are diffi cult to precisely measure other than through proxy measures.
A USERS’ GUIDE TO MEASURING CORRUPTION
15
and anti-corruption. There are, however, relatively few examples of
measurement tools that focus exclusively on inputs.23 Notable examples
include International Research and Exchanges Board’s (IREX) Media
Sustainability Index (MSI), which rates the quality of independent media
in 38 countries based on fi ve criteria such as legal norms, professional
standards and supporting institutions. Another example of an input-
based measure is George Mason University/University of Maryland’s
POLITY-IV Country Reports, which collect information on the
character of political regimes over time.
On the opposite end of the scale are tools that largely measure
outputs – that is, the implementation and outcomes of rules and legal
frameworks. One such metric is the Ibrahim Index of African Gover-
nance, which assesses “governance outputs” such as whether citizens
have benefi ted from increased government expenditures on health
services, and the percentage of school-aged girls who have completed
primary school.
Another is Freedom House’s annual Freedom in the World survey,
which assesses political and civil liberties in more than 190 countries.
Questions gauge the degree of freedom of the media (e.g., are journal-
ists harassed, imprisoned, or killed?) among other indicators. Simi-
larly, the Economic Intelligence Unit’s Index on Democracy focuses
on measuring outputs of democracy based on fi ve categories: electoral
process and pluralism, civil liberties, the functioning of government,
political participation, and political culture. Also output-focused, the
World Bank’s Doing Business project evaluates the legal and regula-
tory environment for business operations in a country, generates data
that capture the number of days and average costs to perform various
licensing and regulatory requirements.
Most available measurement tools fall somewhere in between
purely input measures or purely output measures, and one could even
argue that the examples just mentioned belong to a different or hybrid
category. Some input-focused assessments go beyond simple de jure in-
dicators to also capture the quality of implementation in practice with
de facto indicators. For instance, the Decent Work indicators in the In-
ternational Labour Association’s (ILO) Gaps in Basic Workers’ Rights
measure the gaps between labor conventions and their implementation.
Likewise, Global Integrity’s Integrity Indicators assess the strengths
and weaknesses of countries’ public sector anti-corruption mechanisms
Both input-based and output-based indicators have their strengths and weaknesses.
A USERS’ GUIDE TO MEASURING CORRUPTION
16
by collecting data on the legal
anti-corruption framework, as well
as on its practical implementation.
The International Budget Project
explores the legal framework for
transparent and accountable public
budgeting processes in countries, as
well as the shortcomings of those
rules and laws in practice.
Users can think of these more
robust measurement tools that com-
bine de jure and de facto indicators
as “input-plus” indicators, but they
still fall short of true measures of
output. Hybrid tools that combine
measures of inputs and outputs
also exist; for example, the World
Bank’s Worldwide Governance
Indicators combine both input
data (the Global Integrity data, for
instance, on anti-corruption law
and anti-corruption agency) as well
as output data (the Afrobarometer
data, for instance, on citizens’ per-
ceptions of the incidence of corrup-
tion amongst elected leaders, judges
and border/tax offi cials).
Both input-based and output-
based indicators have their strengths
and weaknesses. Corruption indica-
tors that focus on anti-corruption
rules and inputs have the advantage
of providing clear, straightforward
information about the existence
and strength of laws and regula-
tions. They are also more naturally
“actionable.” To pick up the crime
rate example, a country’s govern-
ment and citizens cannot simply
choose, as a matter of policy and
practice, to lower the crime rate (an
output). They can, however, choose
to put more police on the streets or
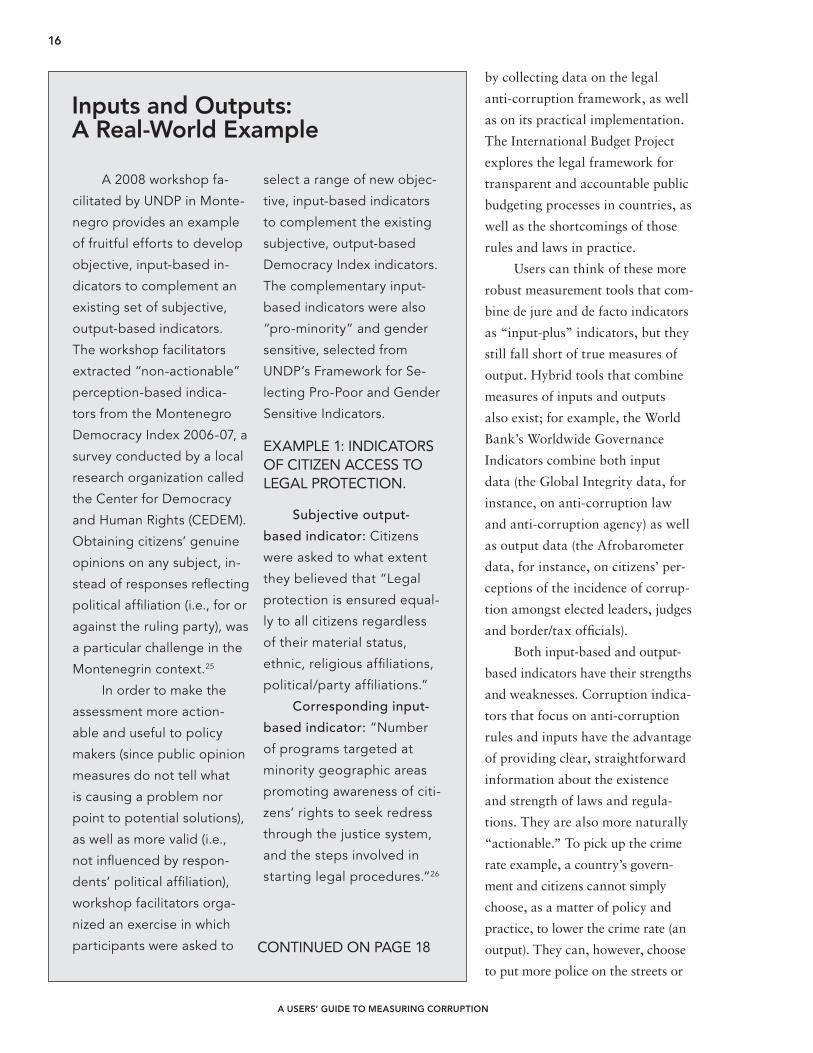
A 2008 workshop fa-
cilitated by UNDP in Monte-
negro provides an example
of fruitful efforts to develop
objective, input-based in-
dicators to complement an
existing set of subjective,
output-based indicators.
The workshop facilitators
extracted “non-actionable”
perception-based indica-
tors from the Montenegro
Democracy Index 2006-07, a
survey conducted by a local
research organization called
the Center for Democracy
and Human Rights (CEDEM).
Obtaining citizens’ genuine
opinions on any subject, in-
stead of responses refl ecting
political affi liation (i.e., for or
against the ruling party), was
a particular challenge in the
Montenegrin context.25
In order to make the
assessment more action-
able and useful to policy
makers (since public opinion
measures do not tell what
is causing a problem nor
point to potential solutions),
as well as more valid (i.e.,
not infl uenced by respon-
dents’ political affi liation),
workshop facilitators orga-
nized an exercise in which
participants were asked to
select a range of new objec-
tive, input-based indicators
to complement the existing
subjective, output-based
Democracy Index indicators.
The complementary input-
based indicators were also
“pro-minority” and gender
sensitive, selected from
UNDP’s Framework for Se-
lecting Pro-Poor and Gender
Sensitive Indicators.
EXAMPLE 1: INDICATORS OF CITIZEN ACCESS TO LEGAL PROTECTION.
Subjective output-
based indicator: Citizens
were asked to what extent
they believed that “Legal
protection is ensured equal-
ly to all citizens regardless
of their material status,
ethnic, religious affi liations,
political/party affi liations.”
Corresponding input-
based indicator: “Number
of programs targeted at
minority geographic areas
promoting awareness of citi-
zens’ rights to seek redress
through the justice system,
and the steps involved in
starting legal procedures.”26
Inputs and Outputs:A Real-World Example
CONTINUED ON PAGE 18
A USERS’ GUIDE TO MEASURING CORRUPTION
17
toughen penalties for offenders (inputs), and expect that those inputs
will lead to the desired output (less crime).
In the corruption context, governments cannot simply “reduce
corruption.” But they can, for example, choose to implement and en-
force all of the anti-corruption measures outlined in the UNCAC with
the hope that such measures will reduce corruption levels.
An advantage of output-based indicators is that they are use-
ful to assess progress towards the desired objective of governance or
anti-corruption reform programs. Output-based measures can indicate
whether governance has improved and corruption has decreased (new
laws or institutions – anti-corruption inputs – mean nothing in and
of themselves). If designed properly, output-based indicators hold the
potential to measure true progress in countries in the long term. Their
major drawback is their general lack of actionability. Often the link-
ages to the inputs that trigger desired outputs are unclear.
When examining corruption and governance, the causal rela-
tionship between rules and their outcomes are complex and often
diffi cult to link empirically. Figuring out the relative importance of
those inputs (which ones should be reformed fi rst, and why) can also
be unclear. Exploring the linkages between input-based and output-
based indicators is particularly important when identifying entry
points for policy interventions.24
In an effort to move beyond inputs and outputs, new political-
economic approaches have been developed to understand what drives
corruption in a country-specifi c context. This is premised on the
notion that governance and corruption reforms are shaped by power
relations embedded in social, political, cultural, institutional and
historical contexts.
Proponents argue that mapping out the power dynamics among
actors and institutions through a holistic analysis produces a more
concrete and nuanced understanding of the political-economic
blockages or incentives/drivers to effective reform. This approach
is also in keeping with the spirit of UNCAC, which “recognizes
that anti-corruption approaches cannot be confi ned to technocratic
solutions only, but acknowledges the inherently political nature of
anti-corruption work.”29
In an effort to move beyond inputs and outputs, new approaches have been developed, mapping out the power dynamics among actors and institutions.
A USERS’ GUIDE TO MEASURING CORRUPTION
18
EXAMPLE 2: INDICATORS OF TRANSPARENCY IN THE OPERATIONS OF LO-CAL GOVERNMENT.
Subjective output-
based indicator: Citizens
were asked about the “trans-
parency in the operations of
local government.”
Corresponding input-
based indicator: “Existence
of a public forum for citizens
to discuss their views with lo-
cally elected offi cials.”27
EXAMPLE 3: INDICATORS OF EQUAL PARTICIPATION OF WOMEN IN ALL ASPECTS OF SOCIAL AND POLITICAL LIFE.
Subjective output-based
indicator: Citizens were asked
about the “equal participa-
tion of women in all aspects of
social and political life.”
Corresponding input-
based indicator: The
“percentage of press, radio
and TV journalists at a national
level who are women” or “ratio
of women to men employed
in 1) civil service and 2) senior
civil service.”28
As one of the workshop
facilitators observed, this
exercise showed how objec-
tive indicators can be useful
complements to perception-
based indicators, not only in
terms of usability in policy
making (i.e., fi nding action-
able indicators), but also as a
means to overcome politically
biased responses to public
surveys in highly polarized
societies like Montenegro.
The idea was to pro-
vide policy makers with a list
of fairly varied input-based
indicators for them to select
the one indicator they feel
is most relevant to the type
of inputs needed to tackle
the sentiment refl ected in
the public opinion survey.
As such, there is no univer-
sal answer for this type of
exercise. Rather, it’s a matter
of selecting the input-based
indicator that’s most suit-
able for any given country
or region, depending on the
particular governance chal-
lenges and policy priorities of
this country or region.
Inputs and Outputs:A Real-World ExampleCONTINUED FROM PAGE 16
Hence, questions related to
how to make the most effective
changes can be posed, such as:
What role does political will play
in enacting corruption reform in
a given country? Why don’t some
political actors have the incentive
to strengthen accountability and
transparency? How can civil society
actors induce effective change?
What are the cultural, historical,
and structural factors behind citi-
zens’ distrust of public institutions?
These questions, among
others, help tease out contextual
information on various interests,
power dynamics, and rules (formal
or informal) that can then be trans-
lated into “actionable” fi ndings.
The United Kingdom’s Depart-
ment for International Development
(DFID) has been a pioneer among
donors in developing method-
ologies for assessing the state of
governance in partner countries.
Their Drivers of Change (DoC)
approach, developed in 2001, links
political-economic frameworks
of power and local contexts to
governance and corruption assess-
ments. To date, the DoC approach
has been applied to more than 20
developing countries. In Ghana,
for instance, a team of country
specialists identifi ed government-
business relations as a major fuel
for corruption. The research team
discovered that Ghana suffers from
an “enduring neopatrimonial” or
patron-client environment that
weakens demands for change and
discourages long-term reform.
A USERS’ GUIDE TO MEASURING CORRUPTION
19
The reality of governance
and corruption reforms is that
they are extremely complex
operations. They take place in
a political-economic context
that is, in many ways, not
fully understandable, given
the lack of transparency into
government-special interest
relations in many countries.
The idea that one indicator or
assessment will respond fully
to a user’s needs is unrealistic
in most cases.
A better approach is
to seek out complementary
measurement tools that can
be combined to provide a
more powerful and holistic
lens through which to view
these issues. Input-based
and output-based indica-
tors should be thought of
as complementary (though
imperfect) proxies for the
various dimensions of gover-
nance they seek to measure.
When available, exploring
the linkages (or lack thereof)
between measurements of
input and output for a given
country or region can yield
fascinating insight.
For instance, if a Global
Integrity assessment sug-
gests that Country X has an
effective ombudsman system
in place (one that benefi ts
from political independence,
suffi cient staffi ng and bud-
get, regular public report-
ing, and the ability to freely
initiate investigations), yet a
household survey reveals that
most citizens don’t trust the
ombudsman or believe him
to be biased, what can that
tell us about the real situation
and what reforms, if any, may
be necessary? By combining
multiple tools, we now have
an entry point for exploring
what could be a key discon-
nect in the governance and
anti-corruption framework in
the country.
The commonly used
external measures of corrup-
tion outputs, such as TI’s CPI
or the World Bank’s Control of
Corruption indicator, are often
broad and not useable for this
type of analysis. For example,
it is diffi cult to imagine any
user, even the most sophis-
ticated, developing country-
specifi c corruption reforms
based on an output measure
that may be as simple as a
survey of Western business-
men that asks what percent-
age of business transactions
QUICK TIP:Matching Inputs and Outputs
They recommended a multi-prong
approach to address this and other
problems by improving informa-
tion fl ows, introducing greater
competition among political par-
ties, and strengthening the role of
the Ghanaian diaspora as well as
civil society.30
Another trendsetter in this
area is the Swedish International
Development Corporation Agency
(SIDA), which has developed a
power analysis framework that
aims to cultivate a contextually
“thick” understanding of a coun-
try’s political-economic structures
and relations, and their implications
for pro-poor, human rights, and
other development priorities. By
examining the causes (rather than
symptoms) of corruption through
nuanced analyses of formal and in-
formal power relations, SIDA tries
to show how power is distributed
(by race/gender/age/class, local/cen-
tral, private/public) and where “real
power” lies.31 Pilot studies have
been conducted in Kenya, Ethiopia,
Mali and Burkina Faso, with ad-
ditional work in progress.
While political-economic anal-
yses are promising developments
in refi ning the corruption measure-
ment toolkit, they too have their
limitations. Members of a confer-
ence on donor approaches to gover-
nance assessments organized by the
Development Assistance Committee
of the Organization for Economic
Co-Operation and Development
(OECD DAC) put it this way: CONTINUED ON PAGE 21
A USERS’ GUIDE TO MEASURING CORRUPTION
20
“A power analysis in development projects does little to
help donors understand how to support and operation-
alize the fi ndings. Nevertheless, newer tools may help
make such analyses more actionable in the future.”32
Methodology
Another important distinction between the various corruption
measurement tools is the different methods and techniques that the
tool creators have adopted. These are not merely technical foot-
notes to be glossed over; rather, they have dramatic impact on the
toolkit’s strengths and limitations. Users must keep methodological
differences in mind when choosing their tools.
Of particular interest are the types of data sources used. Is the
index or toolkit based on composite or original data? Toolkits that rely
on original data gather new data for the explicit purpose of generating
their respective index or assessment. Examples of this approach are the
Global Integrity Index, the Open Budget Index (both the GII and OBI
are composed of scores generated by local in-country
experts), POLITY (where scores are assigned directly by its research-
ers), surveys of business experts’ perceptions of corruption, and house-
hold surveys that explore citizens’ perceptions and experiences with
corruption. In short, users can ask themselves, “Does the publishing
organization itself generate the data it uses?” If so, the toolkit relies on
original data.
Composite indicators, on the other hand, aggregate and synthe-
size information from third-party data sources. They do not gather or
generate their own data. Instead they rely on data from others, em-
ploying aggregation techniques to generate their own results or scores
from those component sources. In the corruption realm, composite
indicators remain the most widely used measurement tools because of
their near-global coverage.
This wide coverage is especially appealing to foreign aid donors
and the international investment community, because they are often
interested in cross-country comparisons to inform international aid
or capital allocation decisions. Among the most prominent composite
indicators of governance are the World Bank’s Worldwide Governance
By aggregating many component variables into a single score or category, users run the
risk of losing crucial conceptual clarity.

A USERS’ GUIDE TO MEASURING CORRUPTION
21
Indicators (WGI), the Ibrahim Index of African Governance, and Trans-
parency International’s (TI) Corruption Perceptions Index (CPI).
Measurement tools that generate their own data and those that
aggregate a number of existing data sources each have their strengths
and weaknesses. Aggregate indicators can be useful in summarizing vast
quantities of information from several sources, and in so doing can limit
the infl uence of measurement error in individual indicators and potential-
ly increase the accuracy of measuring a concept as broad as corruption.33
But, as critics have noted, by aggregating many component variables
into a single score or category, users run the risk of losing the conceptual
clarity that is so crucial.34 If users can’t understand or unpack the concept
that is being measured, their ability to draw out informed policy implica-
tions is severely constrained.
Combined with the labeling problem identifi ed earlier, most us-
ers fail to grasp the limits of aggregate indicators. Aggregate indicators
are also susceptible to misuse due to their selection bias (favoring expert
overpopulation surveys), poor methodology and scoring criteria transpar-
ency, lack of reliable comparisons over time or across countries (if the
component sources differ year-to-year or between units of analysis), and
the likelihood of correlation errors in sources (i.e., the infl uence of other
expert assessments, political/fi nancial crises and country economic per-
formance, as well as respondent errors on perception data).35
For their part, indicators and toolkits based on original data benefi t
from consistency and clarity. When designed properly, their precision can
help identify potential points of intervention in the context of governance
and anti-corruption reform programs. In other words, they can facilitate
the matching of inputs to outputs described above. Nevertheless, users
should be aware that there is always a degree of subjectivity and ambigu-
ity built into the classifi cation and “coding” (assigning of scores) of indi-
cators derived from original data. For instance, the researchers working
on country scores for the POLITY database are following strict criteria
for assigning scores, but are susceptible to some degree of unintentional
bias or inconsistency. The same applies to local in-country experts work-
ing to assign scores for international NGOs such as Global Integrity or
the International Budget Project.
The more troubling weaknesses of assessments based on original
data occur when scores are assigned with little to no identifi cation of
explicit scoring criteria. One example of this can be found in the Afroba-
rometer Survey,36 a widely-used household survey that assesses African
citizens’ opinions on a variety of government performance and democ-
racy issues. One question in the 2006 survey was, “On the whole, how
would you rate the freeness and fairness of the last national election?”
are likely tainted by bribery
in a particular country.
In those cases, matching
inputs to outputs may
require investing time and
resources into new nation-
specifi c output measures
(such as those developed
to complement the Mon-
tenegrin Democracy Index
– see “Inputs and Outputs:
A Real-World Example”,
p.16). Only then can useful
and actionable reforms be
proposed.
Matching Inputs and OutputsCONTINUED FROM P. 19

A USERS’ GUIDE TO MEASURING CORRUPTION
22
Respondents were offered the fol-
lowing choices:
• Completely free and fair
• Free and fair, but with minor
problems
• Free and fair, with major
problems
• Not free and fair
• Do not understand question
• Don’t know
Absent any other criteria to de-
fi ne those responses (such as what a
“minor” problem is, compared to a
“major” problem, and exactly what
“free and fair” means), it is diffi cult
to know precisely what attitudes and
emotions respondents refl ect onto
their response.
Imagine the similar confusion
that respondents would have in
answering a question such as, “Rate
the extent of corruption in Country
X – high, moderate, or low,” with
no other scoring criteria to guide
them. Not to mention the language
problem (translating questionnaires
might result in even more imprecise
ideas) and data entry issues (though
this can be minimized by having an
electronic data entry process). Users
need to carefully examine measure-
ment tools relying on original data
to see whether scoring criteria are
explicit, and if so, use those criteria
as a guide for interpreting the results.
Another important meth-
odological distinction for users
to bear in mind is the extent to
which indicators rely on subjective
versus objective data. Neither is
necessarily better than the other
Before deciding which
measurement tool to use,
take a few minutes to read
the fi ne print. Those dry,
long-winded white papers
or background papers that
accompany any good mea-
surement tool will describe
the process that goes into
generating the assessments,
ratings or scores. If you sense
something is missing – part of
the process, a clearer expla-
nation of the methodology,
a list of the questions asked
– contact the organization, it
should be willing to provide
the information. If not, con-
sider it a red fl ag. You may
want to avoid that particular
measurement tool.
Also bear in mind that
there’s no right answer to the
“objective vs. subjective” or
“composite vs. original” argu-
ments. Varying assessments
and corruption measures can
be useful, depending on the
context. If a user is interested
in a simple snapshot of coun-
try performance relative to its
neighbors, then a high-level
composite indicator is likely
suffi cient. Similarly, if a user is
attempting to assess citizens’
views on the climate of cor-
ruption, then a purely subjec-
tive public opinion survey is
entirely appropriate. On the
other hand, if a user is sitting
in a national government of-
fi ce and charged with improv-
ing country performance on
anti-corruption, those sources
will likely need to be comple-
mented with more actionable
and objective indicators that
offer specifi c entry points for
reform, which mirror or ad-
dress the sentiment refl ected
in public opinion surveys
or international composite
indicators.
QUICK TIP:Know Your Methodology

A USERS’ GUIDE TO MEASURING CORRUPTION
23
and, when appropriately understood, both can shed helpful light on
corruption challenges.
Subjective indicators center on citizens’ or experts’ perceptions
and opinions about the quality of governance or level of corruption
in a respective country. The clearest example of this type of indica-
tor is Transparency International’s annual CPI, but others include
the Economist Intelligence Unit (EIU) Democracy Index and the four
major regional barometers.
When deciding whether to use subjective indicators, users
should bear in mind potential drawbacks. First, subjective indica-
tors are based on perceptions and may not be reliable when assess-
ing long-term trends and changes. Improvements in the quality of a
country’s public integrity system and anti-corruption performance
are diffi cult to capture. Second, indicators that hinge on perceptions
often lack credibility because of the dearth of de jure facts and the
gap with de facto realities on the ground as experienced by the pub-
lic. Third, most subjective indicators are skewed toward the percep-
tions of the elite business community and may not always align with
the views of non-business people and ordinary citizens. Fourth, these
indices tend to gauge perceptions of governance outcomes or corrup-
tion, rather than their causes.37
In contrast, objective indicators weigh factual information,
such as the strengths and weaknesses of a country’s institutional and
legal environment (e.g., election turnout rates, the number of women
elected to the legislature, and the existence of freedom of informa-
tion rules). These objective assessments are refl ected, for instance, in
the Heritage Foundation’s Index of Economic Freedom, which grades
more than 160 countries based on 10 factors using quantitative mea-
surements from third-party sources. Objective indicators also include
experiential surveys of fi rms and households (e.g., the number of
times a person or fi rm has bribed and how much was paid).
Differences between subjective and objective data should not be ex-
aggerated. Both types of indicators should be seen as complementary.38
Indeed, several apparently objective indicators like the Ibrahim Index
integrate subjective data sources such as the CPI into their overall scores.
Only a limited number of current measurement tools address the
gender and poverty dimensions of corruption and governance. The
few “fi rst-generation indicators” (i.e., those that currently exist) that
Given that few international corruption measures focus on poverty and gender issues, new indicators need to be developed at the national level.

A USERS’ GUIDE TO MEASURING CORRUPTION
24
are pro-poor and gender sensitive are drawn from country-specifi c
surveys, censuses, administrative records and focus groups. Broader,
but less useful, illustrative gender-sensitive indicators include the
proportion of seats held by women in national parliament and the
existence of anti-sex discrimination laws.41
Given the paucity of international corruption measures that focus
on poverty and gender issues, new indicators need to be developed at
the national level. Questions like, “how do poor women’s experiences
with corruption compare to poor men’s,” need to be answered.42
“Second-generation indicators” are indicators for which data
are available, even though the indicators themselves have not yet been
created. One example is the level of trust in the police among the poor.
The regional Barometer surveys ask questions related to both the level
of trust and the economic status of respondents. This would allow the
construction of indicators with a focus on poorer groups in society.
Best developed by national stakeholders rather than by interna-
tional actors, such indicators lend themselves more easily to targeted,
in-depth diagnostics of the impact of corruption across different
population groups.
This is discussed in greater detail in the following sub-section.
Internal and External Stakeholders
A recent trend in the fi eld of corruption measurement has been
the use of local expertise and knowledge sources, as opposed to rely-
ing on outsiders for their opinions and ratings. The shift underscores
the growing recognition that corruption indicators need to be more
relevant to a country’s stakeholders. International donors and investors
have been the key external constituency to use indicators for aid and
capital allocations. However, existing indicators, especially aggregate
and perception-based indicators, are often less helpful to internal
stakeholders, such as national governments and local groups. Aggre-
gate indicators that compile information from different third-party
sources present particular dilemmas. It is diffi cult to link them back to
actionable inputs, which has generated a certain degree of resentment
among governments. As one Western aid offi cial told us, “Sometimes
we don’t have anything to tell the country when they ask, ‘Why didn’t
we score well?’”
Efforts to make corruption indicators more useful to national
actors has been accompanied by increasing efforts to promote local
“ownership” of such assessments. In a broad sense, national ownership
refers to a situation where responsibilities for policy setting, skills
training and resources are held by local governments and stakeholders,
A USERS’ GUIDE TO MEASURING CORRUPTION
25
not foreign actors. In the more narrow focus of this guide, nationally
owned governance assessments are initiated, implemented and
sustained by national actors. National stakeholders lead the work on
the assessment, believe in its legitimacy and hold it to be relevant.
National ownership is based on the premise of consulting with
a broad range of national participants, such as the government, civil
society and business associations. This inclusive, bottom-up, and lo-
cally generated approach is important to making corruption indicators
locally relevant, legitimate and trustworthy. If corruption assessments
are not locally owned, they will likely be shelved and will not feed into
policymaking processes.43
However, country-specifi c indicators that are not aligned with
normative standards of democratic governance may suffer from a lack
of trust and legitimacy over the rigor of a self-assessment’s methodol-
ogy. A balance between local “satellite” indicators (those contextu-
ally specifi c to a country) and global “core” indicators (those that are
common to a majority of countries) could strengthen the legitimacy,
reduce the costs, and enrich the dataset of nationally owned assess-
ments.44 In a UNDP-supported assessment of the state of governance
in Mongolia conducted in cooperation with the government, satellite
indicators were designed to refl ect the specifi c national characteristics
of the country. Fourteen satellite indicators complemented the 117 core
indicators. Core indicators included questions about the existence of
anti-corruption legislations, while satellite indicators were grounded
in country specifi cs such as the civil, economic, and social rights of
migrants (e.g., access to health service, employment and poverty).45
Achieving this balance between core and satellite indicators is
particularly important (and challenging) when harmonizing country
driven corruption assessments with national policies and related do-
nor-oriented instruments such as the Millennium Development Goals
(MDGs) and Poverty Reduction Strategy Papers (PRSP). Few corrup-
tion indicators have been integrated into national development plans
and aligned with MDG/PRSP goals.
An example of a formal process that helps to integrate self-assess-
ment results into the national plan is the Africa Peer Review Mechanism
(APRM), a tool used by member states to assist each other in develop-
ing, preparing and implementing effective programs of action to improve
economic, political, corporate and social governance. Member states
“Sometimes we don’t have anything to tell the country when they ask, ‘Why didn’t we score well?’”
National Ownership: Refers to when local stakeholders, not outsiders, have driven and controlled the produc-tion of an assessment. Moreover, it is based on the premise of consulting with a broad range of national stake-holders, such as the government, civil society and the private sector.
A USERS’ GUIDE TO MEASURING CORRUPTION
26
contribute by facilitating the devel-
opment of the national program of
action, sharing best practices and
supporting each other in capacity
building, constructive peer dialogue
and persuasion. In South Africa, the
APRM Country Self-Assessment
Report was based on questionnaires
developed by the APRM Secretariat
(with input from civil society and
NGOs) that focused on four the-
matic areas: democracy and political
governance, economic governance
and management, corporate gover-
nance, and socio-economic devel-
opment. Indicators were grouped
according to objectives within each
of the four areas. Under democ-
racy and political governance, for
example, indicators that measured
progress toward “fi ghting corrup-
tion in the political sphere” provided
assessments of the overall percep-
tions of corruption and measures
taken to combat it.46
Regarding UNCAC, one of
the Convention’s requirements, as
stipulated in Article 5, is the estab-
lishment of national anti-corrup-
tion policies and the development
of monitoring strategies. They are
normally prepared by a commission
staffed by representatives from gov-
ernment agencies, civil society and
the private sector. Measurement
tools are integrated into country
anti-corruption strategies as a way
of diagnosing and analyzing cor-
ruption and governance issues, as
well as monitoring preventive anti-
corruption measures. In general,
there are four kinds of corruption
measurement tools that have been
Nationally owned cor-
ruption measurement tools
are the new “new-thing.” As
such, it has become almost
impolitic to suggest that
assessments prepared in
any other fashion are useful
or appropriate. The reality
is that they are useful, but
only when they involve local
expertise and can engender
local buy-in from national
stakeholders.
For instance, indicators
such as the Global Integrity
Index and the Open Budget
Index are published by
external, international
NGOs, but are prepared and
scored locally by in-country
groups of experts who
conduct original interviews
and research. The result is
bottom-up, credible data
from experts who know their
countries far better than an
outsider ever would – the
hallmarks of a nationally
owned assessment. But
unlike a traditionally “owned”
assessment (i.e., initiated by
national stakeholders), such
approaches are generally
far more cost-effective and
quicker to produce. The
same benefi ts are apparent
in DIAL’s household surveys,
which yield a legitimate and
accurate local voice without
the delays and self-censoring
effect of a full-fl edged,
nationally owned assessment.
While nationally owned
assessments are in vogue for
good reason, there are other
alternatives that offer many
of the same benefi ts without
nearly the same costs. For
users of corruption measures,
the question to ask is “what
is my purpose in using a
measurement tool?” Is it go-
ing to serve as a diagnostic
tool for analysis? In this case,
a quicker and cheaper locally
generated (but not fully lo-
cally owned) assessment is
likely suffi cient. However, if
the goal of the assessment is
to mobilize public opinion or
formally engage government
in an anti-corruption reform
program, then a full-fl edged,
nationally owned assessment
may be the best tool – it will
more likely engender buy-in
from key domestic constitu-
encies, including the govern-
ment itself.
QUICK TIP:Finding the Right Kind of Ownership
A USERS’ GUIDE TO MEASURING CORRUPTION
27
integrated into national anti-corruption planning processes:
Public Opinion Surveys: These are household, governmental,
and business surveys that explore how people perceive the level of
corruption in particular institutions. These surveys are often the fi rst
type of corruption measurement tool used. They are integrated into
national anti-corruption plans to underline how important and seri-
ous corruption is, from the citizens’ perspectives. Policy makers use
these perspectives to determine policy priorities, exploring whether
corruption is perceived to be greater within certain governmental
entities or certain parts of society. Ghana’s “Voice of the People”
survey conducted in March 2005 provides an example of opinion
surveys focused on a single country. The urban household question-
naires surveyed ordinary peoples’ perceptions of the degree of cor-
ruption and bribery, with the intent of providing useful information
to make policy reforms. Cross-country opinion surveys contrasting
public perceptions of corruption in Ghana to other African countries
include the Afrobarometer, which surveys public opinion on democ-
racy, governance and economic issues, including corruption.47
Public Sector Diagnostics: These are studies that assess the
strengths and weaknesses of public institutions. Policy makers use
these indicators to identify which public sector departments or agen-
cies are more susceptible to corruption. They also assist in crafting pol-
icy recommendations. The Kenyan government, for instance, initiated
a household survey in 2006 to measure public perceptions and experi-
ences with key governance and legal institutions in the public sector,
such as the anti-corruption commission and police. The survey gener-
ated data from interviews with more than 12,000 adult Kenyans.48
Private Sector Surveys: The growing acknowledgement that cor-
ruption is not limited to the public sector, but to businesses as well, has
given rise to tools that measure perceptions and experiences with cor-
ruption in the private sector. One example is Uganda’s Cost of Doing
Business survey (2000) developed by the World Bank and implemented
by a local organization (Ugandan Manufacturers’ Association). The
survey includes bribery data across more than 170 fi rms.49
Multi-Country Tools: These tools are integrated into national anti-
corruption plans to show where a particular country stands in relation
to other countries. Using them, policy makers can perform cross-coun-
While broad participation and consultation with stakeholders outside the national government is key to this bottom-up process, it is not enough to capture the concerns of the poor and marginalized groups.
A USERS’ GUIDE TO MEASURING CORRUPTION
28
try comparisons and determine a baseline for regional analysis (which
may foster a “race to the top” competition between countries). These
tools afford opportunities to forge cooperation with other countries in
the region and strengthen local know-how. For example, the Afroba-
rometer has been integrated into various national government programs
in sub-Saharan Africa, such as Tanzania’s Poverty Reduction Strategy
Paper, the Ugandan Parliament’s Strategic Investment and Development
Plan, and the African Peer Review Mechanism (APRM).50
Despite what appears to be a growing consensus that national
ownership of corruption indicators is desirable, challenges remain as
to how one actually goes about undertaking such assessments. While
broad participation and consultation with stakeholders outside the
national government is key to this bottom-up process, it is not enough.
To fully include the perspectives of low-income groups and women,
users must take the additional step of creating sub-indicators that ad-
dress the concerns of these disadvantaged populations via household
opinion and experience surveys. These household surveys are poten-
tially more democratic because they include the concerns of poor,
female and rural populations – groups that may not be represented by
civil society whose members are often more educated and urban.51
Locally generated indicators are particularly conducive to disag-
gregating data according to gender and income/poverty status and to
drawing linkages with corruption and other dimensions of governance.
Pro-poor and gender sensitive indicators could be developed to address
the following questions:
• How do poor women’s experiences with corruption compare to
poor men’s experiences with corruption?
• How do poor households rate the incidence of corruption across
different public agencies?
• Do poor households believe that the incidence of corruption is
increasing or decreasing?
• Is anti-corruption legislation actively enforced, according to poor
households?
• How satisfi ed are women in poor households with the delivery of
public services?
• Are policies of particular relevance to women (e.g., child and repro-
ductive health) monitored and evaluated effectively?52
Some governments are uninterested in giving civil society a robust role in the process and seek to
monopolize control of the policy agenda.
A USERS’ GUIDE TO MEASURING CORRUPTION
29
A few countries have developed pro-poor and gender sensitive cor-
ruption and governance indicators as part of their national strategy. A
recent mapping exercise of national corruption and governance tools in
Latin America conducted by Transparency International and supported
by UNDP provides an example. Data relevant to gender and poverty
demonstrated that the poor disproportionately shoulder the burden of
corruption, and that men are more likely victims of corruption than
women (which is likely due to the fact that men, especially in Latin
America, are more likely to conduct offi cial transactions than women).
However, only a limited number of indicators mapped in this
study are addressing gender and poverty dimensions, in part because
a large sample size is needed to disaggregate, which is not the case
for most existing tools.53 A similar mapping exercise of national
measurement tools in sub-Saharan Africa, also produced by TI and
UNDP, demonstrated the same relative scarcity of pro-poor and
gender sensitive indicators.
There are, however, tools focused on particular sectors that are
believed to be of particular signifi cance to women and low-income
populations. For example, fi ndings from Kenya’s Citizen’s Report Card
on citizen access to safe water and sanitation demonstrate that poor
households do not have access to adequate sanitation facilities, com-
pared to the non-poor.54
Local “ownership” of governance assessments is not without its
problems. As the political scientist Goran Hyden notes, there are sig-
nifi cant challenges to aligning corruption and governance assessments
with local needs on the conceptual, institutional, political and opera-
tional levels. The conceptual vagueness of the concepts of governance
and corruption makes it diffi cult to determine the most appropriate
indicator framework. Furthermore, national ownership can be a highly
politicized issue. Some governments are uninterested in giving civil
society a robust role in the process and seek to monopolize control of
the policy agenda. The underlying question for any nationally owned
assessment is whether it can yield appropriately self-critical results,
when warranted.
Advocates of nationally owned corruption assessments or indi-
cators may run up against institutional/operational burdens. Local
assessors may be overwhelmed by dozens of stakeholders, creating an
increase in workload, time and resource commitments, as well as the
number of indicators.55 The time and resources required to carry out
just the fi rst six APRM assessments are a testament to these opera-
tional challenges. Many developing countries also lack a developed
research infrastructure and NGO sector capable of executing what can
be extremely complex and challenging measurement exercises.
A USERS’ GUIDE TO MEASURING CORRUPTION
30
Corruption Indicators: Country Context
The previous section provided an informal taxonomy of cur-
rent corruption (and some related governance) indicators, highlight-
ing some major strengths and weaknesses within each category.
This section briefl y focuses on how indicators have been used in
Sierra Leone. The example illustrates the real-world challenges fac-
ing policy makers in any country, and the lessons learned can be ap-
plied in future initiatives.
Sierra Leone: After more than a decade of civil war that ended in
2002, the government of Sierra Leone launched its National Anti-Cor-
ruption Strategy in February 2005. There are three major components
to the report. The fi rst examines the root causes of corruption in the
country: what native Sierra Leoneans think about corruption and the
costs of corruption to the nation. In other words, a brief political-econ-
omy analysis. The second focuses on the institutions most vulnerable
to corruption and the priority areas that need to be addressed. The
third provides a series of corruption reducing policy recommendations
for each sector.
Data from various corruption and governance indicators are
mentioned in the fi rst two sections of the strategy report. The fi rst set
of (mainly perception) indicators are used to provide a snapshot of the
depth of corruption compared to other countries: “The recent Trans-
parency International Corruption Perception [sic] Index places Sierra
Leone 118 out of 146 in their ranking, which places Sierra Leone in
the bottom 10% of the perceived most corrupt countries.” A separate
national perceptions survey conducted over fi ve years and published
in 2000 “indicated that: 95.6 percent of respondents maintained that
it (corruption) was rampant and widespread and about 94 percent of
respondents indicated that corruption is rampant in most government
departments. The 2002 Governance and Corruption Study supported
by DFID and the World Bank supports these fi gures.”56
To support its contention that poverty is one of the leading
causes of corruption in Sierra Leone, the report refers to the coun-
try’s ranking at the very bottom of the Human Development Index
as evidence.57 In addition, the report cites the Development Finance
International (DFI)/World Bank 2002 survey – in conjunction with
The point is that the panoply of corruption indicators are complementary rather than inimical to each
other. It depends on the context and objectives.
A USERS’ GUIDE TO MEASURING CORRUPTION
31
focus group meetings, citizen complaints received by the Anti-Cor-
ruption Commission, and sector reports – to identify the areas of
governance that are most in need of reform. These corruption “hot
spots” include education, health, local government, judiciary, agricul-
ture and mineral resources.58
To provide deeper insight into priority reform areas, such as
the severity of corruption and lack of accountability in the health
sector, the National Anti-Corruption Strategy Secretariat turned
to the Public Expenditure Tracking Survey (PETS) to examine the
depth of the problem. The report quotes from the statistical consul-
tant to PETS: “The equivalent of only 9 percent of essential drugs
transferred from the Central Medical Stores could be accounted
for by District Medical Offi ces, while the corresponding fi gure for
transfers from the District Medical Offi ces to Primary Health Units
(PHU) was estimated at 55 percent. Therefore in total, only an esti-
mated 5 percent of resources provided by central government could
be accounted for by PHUs.” However, evidence from another gov-
ernance and corruption survey focusing on health services provides
a counterpoint to the expenditure survey by showing that “systemic
corruption of the health system is not occurring in the minds of
the public.”59 Clearly, perceptions of corruption in this part of the
Sierra Leonean economy (corruption “outputs”) were not matching
objective measures of the sector’s “inputs.”
Sierra Leone’s National Anti-Corruption Strategy report demon-
strates how a range of corruption measurement tools were integrated
into a development plan. Certain indicators were mobilized to provide
a quick country survey of the state of corruption, while others were
used to disaggregate data by sector and poverty/income level. In short,
the Sierra Leone case draws upon the appropriate measurement tool to
meet specifi c needs and objectives. The point, again, is that the pano-
ply of corruption indicators are complementary rather than inimical to
each other. One set of indicators is not necessarily better or inferior to
another – it depends what is being measured and toward what end.
.

A USERS’ GUIDE TO MEASURING CORRUPTION
33
Chapter 2: Voices from the Trenches
The aim of this chapter is to
single out some of the most
pressing issues that the users of
corruption measurement tools
face today, based on their own
fi rst-hand experience. Representa-
tives in the government, donor
and practitioner communities
have shared what they believe
are strengths and opportunities
for improvement within current
indicators and measurement tools.
Much of this thinking has been
anecdotal, and has
yet to be recorded
and digested
systematically.
With this in
mind, more than 30
colleagues work-
ing as researchers, on-the-ground
practitioners, donor offi cials and
government policy makers respond-
ed to our requests for informal in-
terviews (see list on page 58). They
were located in NGOs, interna-
tional development agencies (e.g.,
the World Bank, UNDP country
offi ces and bilateral donors),
government offi ces in developing
countries, universities and think
tanks. The conversations, conduct-
ed via telephone over a two-month
period, were loosely structured
around some basic questions con-
cerning what corruption assess-
ments and indicators (if any) they
use in their daily work, the role of
such indicators and assessments in
development and policy planning
processes, and the major strengths
and gaps of governance and cor-
ruption indicators/assessments.
The thoughtful and candid
comments provided by these users
intersect with the discussions raised
in the previous chapter. The feed-
back collected reinforces the points
made about the strengths and limi-
tations of measurement tools with
real-world examples.
Several people brought up the
“labeling problem” – the diffi cul-
ties that arise because of the broad
scope of the term “corruption”
(and similarly, “good governance”).
The vast and overwhelming range
of “governance” and “corruption”
assessments and indicators has led
to tremendous frustration over the
extent to which the information
produced is actionable (or not) and
amenable to policy intervention (or
not) [see fi nding 1].
More than 30 colleagues working as researchers, on-the-ground practitioners, donor offi cials and government policy makers were contacted for informal interviews.
A USERS’ GUIDE TO MEASURING CORRUPTION
34
Another recurring discussion revolved around what one re-
spondent provocatively referred to as the “demand for meaningless
numbers,” and the careless, imprecise manner in which indicators
and assessments have been applied. This occurs because concepts like
“corruption,” “governance,” and even the “rule of law” have proven
so labile (see fi nding 7). Others mentioned the need for greater com-
plementarity among the wide range of metrics, especially those that
integrate qualitative assessments, since no single indicator can capture
the complexities of corruption (see fi nding 5).
Another issue that emerged from the interviews centered on the
second conceptual category we identifi ed in the previous chapter: What
is being measured by these indicators/assessments? The desire for ac-
tionable data was raised once again as users decried how most indica-
tors – whether they focus on inputs, outputs, or both – seldom provide
contextual information on the political-economic causes of corruption.
Interviewees also had much to say about the methodology of
existing corruption indicators and assessments, the third conceptual
category. While perception-based surveys continue to dominate the
landscape in terms of usage, many express frustration with their lim-
ited application to potential solutions, as well as the subjective mea-
sures employed that they felt were out of step with reality (see fi nding
3). Several cited the usefulness of qualitative assessments, or at least a
combination of quantitative and qualitative tools, to add context and
depth to a country situation (see fi nding 5). Interviewees also highlight
the usefulness of indicators that are disaggregated according to specifi c
institutions, population groups, and problem areas, such as legal
mechanisms, courts, gender, and poverty status (see fi nding 2). Lastly,
a fi nal group of respondents acknowledged the diffi cult and confl ict-
ing demands made on corruption and governance metrics to satisfy the
varying needs of users (see fi nding 6).
The fi nal category discussed in Chapter 1, internal and exter-
nal stakeholders, was energetically picked up by respondents. Many
expressed a desire for greater use of local knowledge, internal as-
sessments and national ownership in order to cultivate government
“buy-in”. Indeed, they argued, such indigenous and internally gen-
erated tools may be more effective in assessing political-economic
incentives to change – including political will – which several users
identifi ed as a major gap in existing corruption assessments and
indicators (see fi nding 4).
The following seven themes are the most salient to emerge from
these discussions, and they feed into the suggested good practices and pos-
sibilities for next-generation work discussed in this guide’s fi nal chapter.

A USERS’ GUIDE TO MEASURING CORRUPTION
35
Findings
Finding 1: Practitioners want actionable data to guide decisions, and existing metrics are not getting the job done.
The ultimate purpose of information is to guide decision making.
In interviews with corruption indicator users, there was tremendous
variety in the scope of decisions facing people working under the rath-
er vague umbrella of “governance practitioners.” Experiences ranged
from academics teasing out subtle relationships between variables, to
donors deciding where to most effectively spend millions of dollars or
euros, to advocates forced to quickly decide whether an election is free
and fair, to government offi cials trying to challenge deeply entrenched
patterns of corruption and abuse of power.
These people are facing diffi cult strategic and tactical decisions
and are hungry for information to guide them. Yet despite the great va-
riety of corruption and governance metrics available, in interview after
interview we heard the same complaint: The information provided by
most metrics is not helpful in guiding their real-world decision making
efforts. Indeed, several people who were interviewed said they found
no use for existing corruption metrics, despite devoting their profes-
sional lives to designing policy initiatives to improve governance and
anti-corruption performance.
Simply put, many of the practitioners we interviewed fi nd that
the data contained in currently available metrics are only loosely
relevant to the daily work of putting together specifi c governance
and anti-corruption reforms. These users, scattered primarily across
the developing world, are far removed from the hand-wringing over
the perceived duplication and redundancy of metrics mentioned in
the previous chapter!
Despite the variety of experiences, practitioners share a common
goal: they are looking to improve governance and anti-corruption. It
is here that actionable corruption data must be rooted. Users complain
that indicators may tell them that a specifi c area (e.g., corruption in
health care service delivery) is problematic, but rarely give insights into
what is causing the problem, or even what specifi c criteria are being
judged. Competing defi nitions of “corruption” and “governance,”
Practitioners fi nd... the data contained in currently available metrics are only loosely relevant to the daily work of putting together specifi c reforms.

A USERS’ GUIDE TO MEASURING CORRUPTION
36
as well as other terms, amplify this confusion. Many of these profes-
sionals have little time to dig through methodology white papers for
explanations of fundamental concepts (assuming they even exist).
When a Latin American government working group wanted to
improve its nation’s overall governance and anti-corruption perfor-
mance, it looked to international corruption perception datasets. The
group quickly abandoned the effort because nothing in the data identi-
fi ed actual points of intervention. An NGO development offi cer in a
South Asian country reported nearly identical frustrations as she tried
to provide the government with data that could inform their reform ef-
forts. The well-known international perception datasets, again, proved
to be too vague to be helpful.
Finding 2: Disaggregated* indicators are more likely to lead to actionable insights.
The practitioners interviewed often asked for more disaggregated
data, particularly data supported by narrative explanations of why a
score was assigned. As discussed above, evaluation approaches that as-
sign a single country score, or scores to just a few broad categories, are
of limited use to practitioners seeking to curb corruption. Even sector-
specifi c or topical indices can be challenging to decipher in the absence
of clear scoring criteria.
To explore one hypothetical example, a quantitative rating of the
extent of corruption within the traffi c police force may seem fairly
focused in scope, but is still of limited use without further informa-
tion. For instance, a poor assessment of “corruption” among traffi c
police in one country may refl ect an environment where the police are
simply incompetent, poorly trained and poorly equipped, especially
if the measurement tool lacks defi nitional clarity. In another country,
however, the police may indeed be extracting bribes on a regular basis
and abusing their positions through explicit extortion. Each situation
produces the same low score for “corruption among the traffi c police,”
but each requires a very different solution.
This paradox can be avoided with a disaggregated dataset that
measures bribes and extortion by the traffi c police separately from
measurements of the police force’s capacity, or by supporting quantita-
tive scores with qualitative explanations that unpack the situation in
Practitioners deeply value narrativeto go along with the numbers.
* “Disaggregation” can mean dif-ferent things in different contexts. In this context, it refers to breaking down a concept into component parts so that it eventually leads to possible points of intervention, instead of a broad conceptual con-struct like “accountability”. It does not refer here to a focus on different sets of survey respondents, such as the poor or minorities.
A USERS’ GUIDE TO MEASURING CORRUPTION
37
narrative terms. When corruption indicators are more specifi c, they’re
also more useful for devising solutions to specifi c corruption problems.
Practitioners working to develop anti-corruption projects told
us they prefer to use indicators that are more disaggregated and are
generated through a bottom-up approach; they also deeply value
narrative to go along with the numbers. The World Bank’s Country
Policy and Institutional Assessment (CPIA), Freedom House’s ratings,
the POLITY databases, the World Bank’s Doing Business ratings, and
the Global Integrity Report were the datasets referred to most often.
The development practitioners interviewed consistently said that the
most useful indicators are those that provide deep contextual informa-
tion: Are there suffi cient legal mechanisms to hold executive offi cials
accountable for their actions? Are law enforcement offi cials paid ap-
propriately? Are civil servants hired based on their qualifi cations and
merits? Answers to these questions lead naturally to a discussion of
possible points of intervention.
Disaggregated data sources also can be used to address a long-
standing concern in the anti-corruption community: the disproportion-
ate impact of corruption and abuses of power on poor and minority
populations. The experiences of corruption can vary greatly with
class, gender, and race. Survey data that rely on international business
travelers or expatriates can potentially exclude the experiences of the
communities most impacted by corruption. Even representative survey
data can be misleading by masking deeply divergent experiences within
a single set of results. Practitioners are asking for disaggregated data
with more depth. Disaggregating the experiences of distinct communi-
ties is one way to do this, but it is unfortunately uncommon.
Finding 3: Decision makers fi nd corruption perception data to be the least useful.
The interviews confi rmed that the most widely known corrup-
tion datasets are Transparency International’s Corruption Perceptions
Index and the World Bank Institute’s WGI (specifi cally its Control of
Corruption indicator). This comes as no surprise to anyone familiar
with the fi eld – these annual assessments have admirably extensive
global coverage, and their results are widely reported in media. Both
measures are based on aggregates of third-party data dealing with
perceived levels of corruption, indicators of governance outcomes, and
expert assessments of governance and anti-corruption performance.
However, the widespread familiarity with these datasets does
not seem to lead to many endorsements. Many interviewees began the
A USERS’ GUIDE TO MEASURING CORRUPTION
38
discussion by unloading their frustrations with corruption perception
data. Some feel that perception data have their uses, but are troubled
by the willingness of donors to link aid conditionality to these con-
troversial measures, both of which have come under fairly withering
criticism in recent years.
The complaints come from two directions. Several of the inter-
viewees, particularly those who are designing corruption and gover-
nance assessments, are skeptical of specifi c details of the methodolo-
gies used in these indices. Many of these methodological challenges
were discussed in the last chapter.
But when practitioners discussed working directly on improving
governance, more fundamental complaints often emerged. Interviewees
suggest that these indices are disadvantaged because they are based on
the popular opinions of citizens or visitors to various countries. Gov-
ernment offi cials and advocates working to improve governance see a
frustrating disconnect between early but important steps toward fi ght-
ing corruption, and the sometimes fi ckle moods of popular opinion.
“Perceptions change very slowly, so there is a huge gap between
our actions and the international evaluation,” said a government
offi cial whose foreign aid fl ows depend on improving his country’s per-
formance on international indices. One offi cial said that broadcasting
the progress occurring in her reform-minded government has become
a priority, so corruption perception measures more closely refl ect the
reality (as she saw it) of improved governance.
Advocates point out that even if perception-based measures are
perfectly effective in tracking public opinion, and even if public opin-
ion is perfectly responsive to changes in levels of corruption, the results
of these measures are still rather limited in their application, since
assigning a single number score to an entire country yields little insight
into potential solutions.
Champions of governance reform complained that these draw-
backs have diminished the credibility of corruption perception mea-
sures in the eyes of many governments. An advocate at an international
NGO said their chapters face problems working with governments
because perception-based indicators fail to provide suffi cient leverage
to start a discussion on what needs to be tackled on the governance
and anti-corruption agenda.
“Perceptions change very slowly, so there is a huge gap between our actions and the
international evaluation.”
A USERS’ GUIDE TO MEASURING CORRUPTION
39
Finding 4: Internal assessments have more relevance and credibility with national stakeholders than international assessments.
Some of the professionals interviewed insist that localized in-
dicators, developed in-country by local stakeholders rather than by
international or external actors, should be the future of the corrup-
tion metrics fi eld. These metrics are, by some standards, quite limited:
they have little or no international coverage, are often purely qualita-
tive, and may not be continued from year to year. But highly localized
indicators that are customized to national or sub-national needs have
the signifi cant advantage of being designed from the beginning to yield
actionable data.
Internal assessments have another advantage over broad interna-
tional toolkits: locally generated efforts typically enjoy better credibil-
ity with skeptical government policy makers. Governance, democracy
and corruption are always politically sensitive. Foreign advocacy and
criticism from abroad can provoke refl exive dismissals and can be a
barrier to local advocates working with governments to acknowledge
governance shortcomings in a non-polemical manner. Some experts
interviewed feel external indicators and assessments are burdened by
built-in disincentives for governments to embrace the fi ndings, even if
they are accurate and free from bias.
An NGO development professional noted that when negative exter-
nal evaluations of a country are published, it is diffi cult for NGOs that
are actively collaborating with governments to use such fi ndings. “To
promote buy-in, it is better to focus on the concerns [expressed] from
within countries – from citizens,” he said. “No government wants to be
seen as siding with corruption when citizens are against it.”
Interviewees argue that the use of local researchers, collaborative
frameworks between international and local NGOs, and consultation
with civil society groups produce frameworks that are more useful to
practitioners. Practitioners appear to prefer these approaches because
they are politically feasible and because they strengthen citizens’ abili-
ties to monitor their government. This stress on the “local” reinforces a
“It is better to focus on the concerns [expressed] from within countries – from citizens... No government wants to be seen as siding with corruption when citizens are against it.”
A USERS’ GUIDE TO MEASURING CORRUPTION
40
point raised in regards to the “fi nding the right kind of ownership.” If
indicators are published by external bodies, they can elicit buy-in from
national stakeholders if they are prepared and scored by local experts.
Finding 5: Qualitative assessments offer deep-er insight than statistics at the cost of quick comparisons.
Given the lack of precision inherent with terms such as “gover-
nance” and “corruption,” it is not surprising that numerical evaluations
of these fuzzy concepts are met with skepticism by many indicator users.
Many of the practitioners interviewed insist on working with qualitative
data, and many wish that existing tools incorporate more qualitative
analysis. “Corruption is such a complex phenomenon ... a single metric
will not be able to uniquely measure corruption,” said an NGO offi cer
based in South Asia.
Some practitioners feel that quantitative indicators provide an
initial snapshot of a country, but they are quick to add that these indica-
tors’ usefulness does not extend far beyond that function. For deeper,
more nuanced understanding, interviewees suggest that numerical data
must be accompanied by qualitative assessments. Donors such as the
United States Agency for International Development (USAID) report
that they rely more on qualitative assessments than numerical indicators
to develop anti-corruption programs.
A drawback of qualitative assessments, however, is that they can
be bulky, hard to summarize, and diffi cult to compare across countries.
One expert pointed out that the National Integrity Systems’ (NIS) coun-
try studies, comprehensive qualitative assessments produced by Trans-
parency International, are large documents – not quick reads. Compari-
sons across countries are diffi cult. The assessments nevertheless provide
more information on the loopholes in governance institutions and help
put other corruption indicators into context.
One NGO expert said assessments that blend qualitative and
quantitative evaluations, such as the Social Audits in Pakistan
and the Citizen Report Cards in Bangalore, India, provide more
useable (or at least accessible) models of qualitative corruption and
governance assessments.
“Corruption is such a complex phenomenon... a single metric will not be able to uniquely measure it.”
A USERS’ GUIDE TO MEASURING CORRUPTION
41
Finding 6: Indicator producers struggle to satisfy confl icting demands for data that is current, com-parable worldwide, but still locally relevant.
All too often, indicator data are years old, even when published
as part of a “new” index. Stakeholders in governments and advocacy
groups are frustrated with this approach and are occasionally dismis-
sive of new research due to the age of the data source. Similar com-
plaints were lodged about datasets that apply a single methodology to
all countries, particularly aggregate measures, which ignore key issues
when third-party data are not available in any given country.
This presents a problem for indicator producers, who are also
under pressure to include as many countries as possible in their indi-
ces, sometimes up to the gold standard of “worldwide” coverage. The
advent of the Millennium Challenge Corporation’s (MCC) practice of
comparing all countries on a uniform, single metric of anti-corruption
performance to determine aid allocation has heightened the perceived
need for global data.
Some indicator developers suggest that practitioners should resist
this trend and instead dig deeper in just a few countries with original
research. The main advantage of this approach, they argue, is that the
data collected are then tailored to each location. This improves the
data’s relevance by linking the research design with policy implica-
tions. Government buy-in is also improved with local assessments.
Having worldwide coverage in a dataset – a claim that can be
made by Transparency International, Freedom House, the World
Bank Institute, and very few others – often leads to the widespread
adoption of these datasets by academics looking to test variables.
Ironically, many of these same academics are critical of the meth-
odologies used to generate these indices. But for academic users
and researchers, the global coverage of data seems to trump data
quality. After all, it is much easier and quicker to run a regression
analysis using someone else’s data, compared to the hard work of
generating one’s own.
For academic users and researchers, the global coverage of data seems to trump data quality.
A USERS’ GUIDE TO MEASURING CORRUPTION
42
Finding 7: There is a demand for numbers regardless of their appropriate use.
Indicator users and producers alike acknowledge that indicators
can be used as post-facto rationalizations for desired policy decisions
or institutional inertia. In other words, many people simply want a
number to point to as evidence for the importance of anti-corruption
efforts, rather than a number they can use for more discrete policy-
making or programming. This intellectual sloppiness is exacerbated
by a lack of healthy skepticism toward terms such as “corruption,”
“governance,” and “rule of law,” which can refl ect widely different
concepts in different countries and cultures. Again, the labeling prob-
lem looms large.
Attitudes regarding the misuse of indicators vary among indicator
producers. Some researchers express concern that users are supporting
invalid claims or misguided policies by misusing otherwise valid indi-
cators. Other researchers are dismissive of these concerns and point
out that bad policy can happen with or without corruption indicators.
What is inescapable is that many corruption indicators take on
offi cial status simply because of the notoriety of the publishing institu-
tion. The rankings can quickly (and dangerously) grow beyond a sum-
mary of a set of observations and become a proxy for offi cial judgment
on the moral qualities of a country. Media outlets are all too eager to
use indicators in this way by naming and shaming countries at the bot-
tom of a given index.
Indicator producers are generally aware of these misuses, but
often don’t know how to deal with them. Most indicator producers
welcome media coverage of their work and loathe to publicly call out
misuses of the information.
Rankings can quickly (and dangerously) grow beyond a summary of a set of observations and become a proxy
for offi cial judgment on the moral qualities of a country.
A USERS’ GUIDE TO MEASURING CORRUPTION
43
Chapter 3: Good Practices & Case Studies
The previous chapters sought to
provide some conceptual co-
herence to the veritable explosion
of corruption indicators, as well as
a platform for indicator users to
voice some of their concerns.
Although respondents ac-
knowledge that existing indicators
and assessments play an important
role in their work, most interject
with trenchant critiques and sug-
gestions for improvement. They
often voice worries that existing
corruption metrics do not provide
suffi cient actionable information
to guide effective decisions or
evaluate the impact of particular
anti-corruption policies.
There is a sense that disag-
gregated, qualitative, and inter-
nal/local assessments will more
likely lead to actionable insights
than composite, perception-based
indicators. There also exists a
desire for indicators that assess
political-economy incentives for
change and reform.
This fi nal chapter attempts
to link interviewees’ varied experi-
ences with a discussion of effec-
tive strategies for using existing
corruption indicators. To this
end, a list of “good practices” is
included. Although these practices
are not exhaustive, they capture
the most centrally important “do’s
and don’ts” that users should bear
in mind.
In addition, three fi ctional
case studies are presented to illus-
trate how these “good practices”
can be put to use. In these case
studies, we’ll explore how three
different types of users – govern-
ment offi cials, researchers and
development practitioners – might
approach corruption indicators.

A USERS’ GUIDE TO MEASURING CORRUPTION
44
Good Practices
Know what you want to measure or benchmark, and fi nd the appropriate measurement tool:
• Conceptual clarity is crucial.
• Avoid the labeling trap – dig underneath indicators to understand
the questions being asked in an effort to determine whether the as-
sessment is right for your work.
• Be prepared to discover that existing data sources or assessments
may not be the appropriate fi t for your needs.
• Be prepared to invest time and resources into generating your own
original research if existing data sources do not properly address
your issues, are too specifi c, overly broad or old.
Build your anti-corruption strategies and the indi-cators you need to measure progress in a modest, incremental fashion:
• Unpack what you are trying to measure into discrete concepts.
• Attempting to track the impact of corruption on the achievement of
macro development goals such as the UN Millennium Development
Goals (MDG) or implementation of the UNCAC is a dead end.
The concepts are too broad and the linkages between “corruption”
(without further defi nition) and those policy outcomes are nearly
impossible to trace.
• Gravitate, instead, to measuring corruption in a particular sector,
branch of government, or portion of society with more distinct, but
important, measures that feed into desired policy outcomes (i.e., a
particular section of the UNCAC or component element of a spe-
cifi c MDG target).
• For example, measuring corruption in hospital procurement
and its impact on health-related MDGs will be far more useful
than tracking the impact of “corruption” on the achievement of
all of the MDGs.
Look for actionable data:
• Corruption metrics should provide information that enables users
to address a specifi c problem. If they don’t, consider another source
of information.
• Disaggregated indicators are one of the more effective methods
to operationalize corruption data. They can be used to measure
A USERS’ GUIDE TO MEASURING CORRUPTION
45
the distinct components of a broad concept, or to capture the
different experiences that poorer groups in society and women
have of corruption.
• Look underneath the numbers to fi nd the actual questions asked and
the criteria used for scoring. These can be guides for follow-up action.
• Actionable data should always be complemented by output-based
indicators, but government users, in particular, can only take ac-
tion on the former.
Consider using existing data sources to construct indicators that capture the specifi c experience of poorer groups and women:
• Many relevant data sources already exist for constructing pro-poor
and gender sensitive indicators, though they may not be widely used.
• For instance, the indicator “level of trust in the police among the
poor” could be easily measured using a household survey asking
questions about both the level of trust and the economic status
of respondents.
• External assessments generated by international “experts” are
likely to exclude the experiences of those groups most impacted by
corruption: the poorest and most marginalized.
• It is possible to unveil the distinct experience of marginalized com-
munities by disaggregating survey data along poverty, ethnicity or
gender lines.
Whenever possible, combine quantitative data with qualitative assessments:
• Assessments should provide users with deeply contextual informa-
tion that captures a country’s specifi c situation.
• A single number means little when trying to understand a compli-
cated phenomenon such as corruption.
• Single numbers only capture a snapshot of a country’s corruption
condition and often exclude minority voices, such as the poor and
women.
Gravitate toward locally generated assessments:
• Indicators generated by local experts are more valuable in stimulat-
ing buy-in from national governments and other local stakeholders
than indicators generated externally.
• For grassroots groups, locally generated assessments are a more
A USERS’ GUIDE TO MEASURING CORRUPTION
46
politically useful tool, compared to external assessments.
• Locally generated assessments that draw on the knowledge of mul-
tiple stakeholders – including local academics, NGOs and policy
makers – lend themselves to a more participatory framework for
discussion.
• Producers of country-specifi c corruption surveys and indicators
should include input from civil society. This engagement allows
indicators to serve as accountability mechanisms for citizens, espe-
cially for marginalized groups, and to provide bottom-up pressure
for reform.
Embrace the need for multiple assessments and complementarity:
• Corruption is a complex issue. A single tool is not suffi cient to
effectively obtain a comprehensive understanding and identify pos-
sible points of intervention.
• All measurements and toolkits are subject to bias in one form or an-
other. By using multiple sources of information, users can mitigate the
risks of pursuing ill-fated policies driven by skewed data.
Be responsible when using any measurement tool:
• Although many corruption metrics are driven by quantitative num-
bers (lending an authoritative air) and may be widely quoted in the
media and research circles, users should exercise particular caution
in linking corruption data with various development outcomes un-
less they understand the data they are using.
• Simplistic correlations or regression analyses are insuffi cient to
truly capture the interrelated dynamics that drive corruption in a
given country context.
• Using simplistic analyses to push a policy agenda can backfi re when
local stakeholders challenge suspect methodologies.
Transparency of methodology is crucial:
• Indicators are more reliable when the methodology used to devise
them is transparent.
• Take time to understand the methodology.
• If you can’t fi nd the underlying data or questions asked, look for a
better source that is more transparent, or develop your own.

A USERS’ GUIDE TO MEASURING CORRUPTION
47
Elsa is a civil servant in a
Latin American government
tasked with understanding her
country’s performance on interna-
tional corruption and governance
metrics. Her government has
been challenged by a bilateral aid
donor to improve anti-corruption
performance, as measured by the
World Bank Institute’s Worldwide
Governance Indicators (WGI).
Her role as the lead inter-
preter of governance metrics was
created in response to this donor’s
challenge, which explicitly links
performance on anti-corruption
indicators to future aid. Elsa pas-
sionately believes that her country
needs fair, accountable govern-
ment, but she also knows her job is,
to a large extent, simply to keep the
aid money fl owing. To do that, her
country’s performance on interna-
tional assessments of corruption
needs to improve. She is responsible
for making policy recommenda-
tions to improve these scores.
Elsa starts by directing her
team in a careful reading of the
World Bank Institute’s methodol-
ogy. They know that the index is
drawn from various third-party
surveys. Upon looking at those
component surveys closely, they
fi nd that the source material
can vary dramatically from year
to year. Elsa reads the reports
submitted by her research staff
with concern: survey questions
are generally directed at percep-
tions of corruption, but the target
audience, the phrasing of ques-
tions, and the time periods studied
seemed fairly random because
the index depends on third-party
survey data that have varying
methodologies or objectives. Some
look only at bribery, others look
at corruption in the courts, while
still others seek to assess regula-
tory hurdles and ineffi ciencies in
the bureaucracy. Additionally,
surveys from the past several years
are combined into a single year’s
index result. The outcome? Any
outlier data, such as a particularly
unfl attering survey result, do not
appear as a one-year dip in a noisy
pattern, but as part of a smooth,
multi-year trend.
This is not particularly good
news for Elsa and her policy
recommendations. It appears to
Case Studies
The following fi ctional case studies demonstrate how corruption indicators could be used to tackle
measurement problems. Often, these stories relate to key concepts and themes raised in earlier chap-
ters of this guide. Although the names are fi ctitious, examples have been drawn to approximate real-life
scenarios based on actual country experiences.
A Government Offi cial’s Story:

A USERS’ GUIDE TO MEASURING CORRUPTION
48
her that international perceptions of the government’s anti-corruption
performance can impact the index results at all times – whatever steps
the government decides to take need to be popular overseas. Moreover,
since the questions are directed at very general attitudes, policies need
to reinforce the image of a trustworthy government that keeps corrup-
tion well under control.
Elsa decides to put her reports down and takes a walk around
the humid capital city. If she could assume that any policy recom-
mendations she proposes would be adopted (and given the amount of
aid money at stake, this was not a bad assumption), what could she
do to infl uence these ratings? She realizes it all hinges on international
perceptions of rather unspecifi c “corruption” issues. It is clear that the
citizens of her country are frustrated with corruption. But what would
they like to see done about it?
She stops into a small cafe to get something cool to drink. On a
whim, she asks her waiter if he thinks corruption is a problem. He is
surprised at the question but assures her that, yes, corruption is a ter-
rible blight on the country. Elsa then asks him what he would like to
see done about it. “I’d like to see the people responsible exposed, and
sent to jail! Forever!” he says. Several cafe patrons nod their heads at
this exchange.
Their enthusiasm was hard to miss. Elsa thinks about this as
she sips her drink. Perhaps some high profi le prosecutions would be
enough to improve the public’s mood. A focus on strong investigations
and aggressive law enforcement would give shape to her proposal – she
wonders whether a basket of policy reforms to advance the goal of
more high profi le prosecutions would do the trick.
The next week, Elsa presents her plan to a meeting of the ruling
party leadership: the government needs to catch a big fi sh and send a
message that no one is above the law. The key ministers receive this
recommendation in silence. A particularly ambitious member of parlia-
ment begins speculating about who would likely be prosecuted. Soon,
the ministers’ aids are brainstorming deserving candidates for a highly
public humiliation. Elsa cannot help but notice that the “big fi sh” are
all members of the opposition party. This is not going well at all, she
thinks to herself.
Finally, the Minister of the Interior cuts off the debate. Speaking
slowly, as if to children, he addresses the room:
“Aid money is very important to this country. Our aid money
depends on the international corruption rankings. Our performance
on these metrics is dependent on international perception of the level
of corruption in government. Your solution is to have some big public
trials,” he said.
A USERS’ GUIDE TO MEASURING CORRUPTION
49
“When you do,” the minister continues, “you will fi ll every
radio station, every newspaper, every cafe in this country rife with
talk of corruption. And when the next survey happens, and the inter-
national businessmen are asked if there is corruption in our country,
what do you think they will say? And what do you think will happen
to that index score?”
The minister then gently suggests that Elsa develop some new rec-
ommendations and consider metrics that focus on addressing some of
the fundamental problems that are causing corruption in the country,
rather than on manipulating public opinion.
Elsa leaves the meeting knowing she needs some new indicators.
Global Integrity’s Integrity Indicators approach seems like a possible
solution. These indicators don’t focus on corruption; instead they
look at distinct anti-corruption mechanisms such as asset disclosure
practices, auditing capacities and campaign fi nance reporting, along
with their practical implementation in a country. Because the Global
Integrity Report lacks full international coverage, no data are available
for her country. However, the indicator questions themselves serve as a
starting place for an anti-corruption policy wish list.
Elsa and her team embark on a review of existing corruption
literature and research, but they don’t fi nd much that directly applies
to her country. Instead they fi nd some novel approaches in other coun-
tries that used custom-designed reporting programs to track imple-
mentation of existing anti-corruption policies across different areas
of the civil service. Each program was designed to provide incentives
to departments and ministries to better implement a specifi c area of
anti-corruption policy, such as improving whistle-blower protections
or more closely monitoring outside business interests of civil servants.
When these programs identify top performers, they serve as local case
studies that other ministries could replicate.
In light of her unproductive meeting, Elsa begins to appreciate the
appeal of this indirect, less volatile approach. There is still a place for
high-profi le prosecutions, but it did not look like that would happen this
year. However, steady incremental improvements directed at policy goals
that are already in place seem like something her team could accomplish.
Her new plan meets with little resistance, and soon her team is
gathering data from across the civil service and from different regions
of the country. After publishing results in the form of agency and
regional rankings, she is surprised to see how much media attention
the initiative receives. She expected the rankings to put pressure on
the worst performers, but was pleasantly surprised to see the better
performers energized by the results as well. Soon healthy competition
develops across agencies and regions.
A USERS’ GUIDE TO MEASURING CORRUPTION
50
Mindful of the aid money that is based on good international
perceptions of the fi ght against corruption, Elsa dedicates some of
her team’s efforts to broadcasting the work that they are doing, and
occasionally her team’s efforts make their way into the media as
positive stories.
It isn’t clear how the new initiative is going to impact the inter-
national assessments of corruption, but Elsa no longer spends her time
worrying about the next batch of international rankings. Instead, she
is overwhelmed with reports and data from regions and ministries
from each new reporting program that her team puts into place. These
data are local, up-to-date, and, best of all, directly relevant to the per-
formance of her country’s institutions.
A USERS’ GUIDE TO MEASURING CORRUPTION
51
Sarah is a lead researcher at a
think tank located in Free-
town, Sierra Leone. The think
tank is involved in conducting ap-
plied research on governance and
corruption issues, disseminating
its fi ndings through seminars and
policy dialogues and collaborat-
ing with NGOs and government
offi cials to promote good gover-
nance. Sarah works in the Cor-
ruption group and her research
focuses on natural resources and
extractive industries.
After a decade of civil war
fi nanced by illegally smuggled
diamonds (Sierra Leone’s main
natural resource), Sarah wants to
devise strategies to mitigate cor-
ruption in the diamond industry.
She wants to identify key points
of government intervention and
plausible regulatory frameworks
to make sure that the proceeds
from the diamond trade are
channeled toward social sectors
such as education, health, agri-
culture, employment generation
and infrastructure.
While Sarah’s colleagues are
in charge of exploring the frame-
work of the diamond industry and
private corporations involved in it,
Sarah focuses her research on the
political angle of corruption in this
extractive industry. She is looking
for information regarding:
• The structure of the govern-
ment: How involved is the
legislative branch in overseeing
mining agreements? Is the
legislative branch independent
from the executive branch?
Who controls its budget?
How much are legislators paid?
• The experience of civil society
actors trying to collaborate
with government offi cials
• Whether citizens and non-state
actors (CSOs, media) can hold
the government accountable for
their fi scal actions
• The transparency of the state’s
fi nancial transactions regarding
diamonds
In her quest for informa-
tion, Sarah looks for objective
indicators. She also strives to
find assessments that disaggre-
gate information on corruption
so she can devise specific policy
proposals based on the institu-
tional drawbacks identified in
those assessments.
Case Studies
A Researcher’s Story:
A USERS’ GUIDE TO MEASURING CORRUPTION
52
Sarah knows that Sierra Leone has implemented some mandates
of the Extractive Industries Transparency Initiative (EITI), an initia-
tive that aims to strengthen governance by improving transparency and
accountability in the extractives industry sector. A basic regulatory
framework also governs the diamond sector: the parliament has made
amendments to certain acts regarding possession and smuggling of
diamonds, and the country has passed laws in sectors such as banking.60
Despite these efforts, audits that track diamonds from mines to markets
are lacking, and fi nancial resources to carry out such audits are limited.
In her initial look at the comprehensive list of global sources of
indicators in the UNDP Users’ Guide to Measuring Corruption, Sarah
selects indices that she thinks might be most useful for her purpose,
such as:
• Bertelsmann Transformation Index (BTI),
• Business Environment & Enterprise Performance Survey (BEEPS),
• Open Budget Index (OBI),
• Global Integrity Index (GII),
• Public Expenditure & Financial Accountability (PEFA).
These assessments are most useful because some are disaggre-
gated (OBI), some are quantitative (BEEPS), and others complement
indicators with qualitative assessments (GII). Moreover, they mainly
take into account corruption at the political and national levels, which
is what interests Sarah the most.
As Sarah explores these indicators, she realizes that BEEPS,
OBI, and PEFA do not have information on Sierra Leone. She under-
stands that she may come across similar problems with other indica-
tors and datasets. Sierra Leone has only recently emerged from civil
war, so externally generated data on the country are limited. Out
of these indicators and assessments, only the BTI and the GII have
information and data on Sierra Leone.
In BTI and GII, Sarah fi nds general and specifi c information on
the structure of the government, political participation, the economy,
the role and work of legislators in serving as a watchdog over the gov-
ernment, and the effectiveness of civil society activists. Disaggregated
information on whether legislators are regularly paid or not helps
Sarah decipher whether inadequate compensation of legislators might
lead to solicitation of bribes from the mining companies. The fact that
some of these indices are generated by local researchers – the GII uses
local experts and journalists and a local peer review panel – will also
help her advocate certain policies to the government and engender their
buy-in to such reforms.
A USERS’ GUIDE TO MEASURING CORRUPTION
53
A Development Practitioner’s Story:
Case Studies
John is a lifelong development
practitioner who has spent
the past 20 years working for his
country’s bilateral aid agency.
Over time, he has become some-
what of an expert on governance
and corruption, and his next
posting takes him to Timor-Leste,
where the government proposed
the creation of a new anti-cor-
ruption commission to tackle the
country’s pervasive and growing
corruption problem.
After settling in at his new
post in Dili, John receives a cable
from the capital requesting his
thoughts on the merits of the
government’s proposal and to sup-
port his recommendations.
An experienced “governance
hand,” John knows that there
is no single ranking or dataset
focused solely on anti-corruption
agencies. He also knows that a
ranking index of anti-corruption
agencies around the world would
be meaningless.
He needs to provide a bal-
anced and detailed rationale for
whether his government should
support the establishment of an
anti-corruption commission in
the context of what are unique
political and social circumstances:
a country with extremely lim-
ited institutional capacity, but an
impending infl ux of oil revenue. At
the same time, his newly installed
minister for development coopera-
tion back home, a fan of quantita-
tive indicators, has requested more
evidence-based policy decisions.
As such, John must balance con-
fl icting demands.
He begins by exploring
existing corruption and gover-
nance indices covering Timor-
Leste, including the World Bank’s
Worldwide Governance Indicators
(WGI), Transparency Internation-
al’s Corruption Perceptions Index
(CPI), and Global Integrity’s most
recent country assessment. Apart
from the latter’s treatment of the
performance of anti-corruption
agencies in each country covered
(including Timor-Leste), John
soon realizes he will not fi nd his
answers in numbers alone.
Instead, he turns to quali-
tative sources to complement
his numbers. A Transparency
International National Integrity

A USERS’ GUIDE TO MEASURING CORRUPTION
54
Systems report is not available on Timor-Leste. He accesses a 2007
assessment of corruption in the reconstruction process in Timor-
Leste published by the anti-corruption NGO Tiri, which explores
various country-specifi c corruption phenomena through detailed
narrative.61 He next turns to the academic literature, which over the
years has generated specifi c research exploring the effi cacy of central-
ized anti-corruption commissions in various countries. He learns that
Hong Kong and Singapore have well-respected and effective anti-cor-
ruption agencies, albeit in very different social, political, and eco-
nomic environments. He also fi nds that anti-corruption commissions
in many other countries are often ineffective, in part because they
have been used by politicians to cover their wrongdoings or persecute
political rivals.
By combining the various data sources, John reaches this conclu-
sion: both the numbers and the qualitative sources note successes and
failures derived from investing in a single anti-corruption commission.
A deep look into the qualitative assessments shows many disturb-
ing similarities between Timor-Leste’s political situation and failed
experiences in other nations. He is able to reference these experiences
in detail to build the case that a centralized anti-corruption commis-
sion will unlikely be effective and may detract from ongoing efforts
to bolster existing anti-corruption mechanisms within government.
Happy that he has satisfi ed his minister’s desire for numbers and his
own desire for complementary narrative, he fi les his recommendation
with the home offi ce.

A USERS’ GUIDE TO MEASURING CORRUPTION
55
Annex A: Endnotes & References
1 Mapping of Corruption and Governance Measurement Tools in Sub-Saharan Africa, Transparency International and UNDP, 2007; Corruption and Governance Measurement Tools in Latin American Countries, Transparency International and UNDP, 2006.
2 Joachim Nahem and Matthew Sudders (2007), Governance Indicators: A Users’ Guide, UNDP, 2nd edition.
3 U4 Corruption Glossary.
4 Measuring Democratic Governance: A Framework for Selecting Pro-Poor and Gender Sensitive Indicators, UNDP, Oslo, Norway, 2006.
5 Susan Rose-Ackerman (2007), U4 Brief, no. 5, “Measuring Private Sector Corruption”.
6 Ibid.
7 Fredrik Galtung, (N.D.), “Corruption in Post-Confl ict Reconstruction: Confronting the Vicious Cycle”, www.tiri.org, 6.
8 See for instance , Åse B. Grødeland, Tatyana Y. Koshechkina, William L. Miller, A Culture of Corruption? Coping with Government in Postcommunist Europe, Central European University Press, Budapest, 2001.
9 Hannes Hechler and Karen Hussmann (2008), “Anti-Corruption Policy Making in Practice: Implications for Imple-menting UNCAC”, U4 Brief, no. 1.
10 Ibid.
11 Strengthening World Bank Group Engagement on Governance and Anticorruption, World Bank, 2007.
12 OECD Glossary of Statistical Terms, 2007.
13 Marie Besancon, “Good Governance Rankings: The Art of Measurement”, World Peace Foundation Reports, Vol. 36, 2003, 1.
14 UNDP Human Development Report, 2002.
Endnotes
Endnotes
A USERS’ GUIDE TO MEASURING CORRUPTION
56
15 Michael Johnston (1996). “The Search for Defi nitions: The Vitality of Politics and the Issue of Corruption,” Inter-national Social Science Journal 149: 321-335.
16 Daniel Kaufmann (1997). “Corruption: The Facts,” Foreign Policy, no. 107: 114-131; UNDP Practice Note: Anti-Corruption (2004): 2.
17 Dieter Haller and Cris Shore, editors (2005). Corruption: Anthropological Perspectives. London: Pluto Press; Janine R. Wedel (2007). “The Corruption Conundrum: Bridging Perspectives Between East and West,” National Institute of Justice Report.
18 Tina Søreide (2006). “Is it Wrong to Rank? A Critical Assessment of Corruption Indices,” Chr. Michelsen Institute Working Paper: 1-13.
19 Daniel Kaufmann and Aart Kraay (2007). “Governance Indicators: Where Are We, Where Should We Be Going?” World Bank Policy Research Working Paper: 6.
20 Goran Hyden, “The Challenges of Making Governance Assessments Nationally Owned,” (2007), paper presented at the 2007 Bergen Seminar on “Governance Assessments and the Paris Declaration,” organized by the UNDP Oslo Governance Centre and the Chr. Michelsen Institute, Bergen, September 24-25.
21 Christiane Arndt and Charles Oman (2006). Uses and Abuses of Governance Indicators. Paris: OECD Develop-ment Centre: 72.
22 Goran Hyden, “The Challenges of Making Governance Assessments Nationally Owned,” (2007), paper presented at the 2007 Bergen Seminar on “Governance Assessments and the Paris Declaration,” organized by the UNDP Oslo Governance Centre and the Chr. Michelsen Institute, Bergen, September 24-25.
23 Daniel Kaufmann and Aart Kraay (2007). “Governance Indicators: Where Are We, Where Should We Be Going?” World Bank Policy Research Working Paper.
24 Ibid., 7-15.
25 Milos Besic, Veselin Pavicevic, MA Nenead Koprivica, Rajko Radevic, Nikola Djurovic, and Aleksandar Pajevic (2007). Democracy Index: Montenegro 2007. Center for Democracy and Human Rights.
26 Measuring Democratic Governance: A Framework for Selecting Pro-Poor and Gender Sensitive Indicators (2006). Oslo, Norway: UNDP.
27 Ibid.
28 Ibid.
29 Karen Hussmann and Hannes Hechler (2008). “Anti-Corruption Policy Making in Practice: Implications for Imple-menting UNCAC,” U4 Brief, no. 1.
30 David Booth, Richard Crook, E. Gyimah-Boadi, Tony Killick and Robin Luckham, with Nana Boateng (2005). “What are the Drivers of Change in Ghana?” CDD/ODI Policy Brief, No. 1: 1-10.
31 Helena Bjuremalm (2005). “Introduction,” Methods of Analysing Power – A Workshop Report. SIDA: Division for Democratic Governance: 5.
32 OECD/DAC GOVNET Conference on Governance Assessment and Aid Effectiveness (2008). Concept Paper and Agenda Annotations: 3.
33 Christiane Arndt and Charles Oman (2006). Uses and Abuses of Governance Indicators. Paris, France: OECD Development Centre.
34 Ibid.
35 Ibid.
36 There are four region-specifi c barometers: in addition to the Afrobarometer, there is the East Asia Barometer, Lati-nobarometro, and the Eurobarometer.
Endnotes
A USERS’ GUIDE TO MEASURING CORRUPTION
57
37Christiane Arndt and Charles Oman (2006), Uses and Abuses of Governance Indicators. Paris, France: OECD Development Centre: 90-91; see also Richard Rose and William Mishler (2007). “Explaining the Gap Between the Experience and Perception of Corruption,” Centre for the Study of Public Policy, University of Aberdeen, Studies in Public Policy Number 432: 1-28.
38 Christiane Arndt and Charles Oman (2006). Uses and Abuses of Governance Indicators. Paris, France: OECD Development Centre: 30-31.
39 Daniel Kaufmann and Aart Kraay (2007). “Governance Indicators: Where Are We, Where Should We Be Going?” World Bank Policy Research Working Paper: 30.
40 Measuring Democratic Governance: A Framework for Selecting Pro-Poor and Gender Sensitive Indicators (2006). Oslo, Norway: UNDP: 14-17.
41 Ibid., 15-16, 35.
42 Ibid., 34.
43 UNDP Practice Note: Supporting Country Led Governance Assessments (forthcoming).
44 Governance Assessments and the Paris Declaration: Opportunities for Inclusive Participation and National Own-ership (2001). Oslo, Norway: UNDP Oslo Governance Centre/Chr. Michelsen Institute Seminar Report: 11.
45 Democratic Governance Indicators: Assessing the State of Governance in Mongolia (2006). Ulaanbaatar: UNDP Mongolia.
46 www.aprm.org.za.
47 Mapping of Corruption and Governance Measurement Tools in Sub-Saharan Africa (2007). Transparency Inter-national and UNDP: 14-15, 41-43. For examples of measurement tools in national assessments in Latin America, see Corruption and Governance Measurement Tools in Latin America (2006). Transparency International and UNDP.
48 Ibid., 27-28.
49 Ibid., 32.
50 Ibid.,7, 42.
51 “Evaluation of UNDP’s Role in the PRSP Process: Vol. 1: Main Report” (2003). New York, NY: UNDP: 12.
52 Measuring Democratic Governance: A Framework for Selecting Pro-Poor and Gender Sensitive Indicators (2006). Oslo, Norway: UNDP: 34.
53 Corruption and Governance Measurement Tools in Latin American Countries (2006). Transparency International and UNDP: 6.
54 Mapping of Corruption and Governance Measurement Tools in Sub-Saharan Africa (2007). Transparency Interna-tional and UNDP: 8, 35-36.
55 Goran Hyden (2007). “The Challenges of Making Governance Assessments Nationally Owned,” paper presented at the 2007 Bergen Seminar on “Governance Assessments and the Paris Declaration,” organized by the UNDP Oslo Governance Centre and the Chr. Michelsen Institute, Bergen, Norway, September 24-25.
56 National Anti-Corruption Strategy: Government of Sierra Leone (2005). Freetown, Sierra Leone: National Anti-Corruption Strategy Secretariat: 7.
57 Ibid., 13.
58 Ibid., 15 ff.
59 Ibid., 15-16.
60 Shari Bryan and Barrie Hofmann (2007). Transparency and Accountability in Africa’s Extractive Industries: The Role of the Legislature. Washington, DC: National Democratic Institute for International Affairs.
61 Francisco da Costa Guterres, Joao M. Saldanha, and Anacleto a Costa Riberio (2007). Reconstruction National
Endnotes
A USERS’ GUIDE TO MEASURING CORRUPTION
58
Interviewees
Jairo Acuna-Alfaro (UNDP Vietnam)
Saku Akmeemana (World Bank)
Marawan Al Faouri (Moderation Assembly for Thought, Jordan)
Veronika Baumgartner (UNDP Burkina Faso)
Octavio Chavez (International City/County Management Association [ICMA])
Ingrid Crowe-Aycinena (FUNDESA Guatemala)
Andreas Danevad (NORAD)
Dan Dionisie (UNDP Slovakia)
Ahmed El Sawy (Professor at Ain Shams University, Egypt)
Vincent Fruchart (World Bank)
Ramesh Gampat (UNDP Colombo Regional Centre)
Shirin Gul (UNDP Pakistan)
Emmanuel Gyimah-Boadi (Ghana Center for Democratic Development)
Elizabeth Hart (USAID)
Constance Hybsier (UNDP Vietnam)
Aart Kraay (World Bank)
Lawrence Lachmansingh (UNDP Guyana)
Robert Leventhal (U.S. State Department, Anti-Corruption Programs)
Jockely Mbeye (UNDP Johannesburg)
Gerardo Munck (University of Southern California)
Anton Op de Beke (IMF)
Lucrecia Palacios (El Salvador Government)
Rae-Ann Peart (UNDP Maldives)
James Polehumus (independent governance consultant)
Anuradha Rajivan (UNDP Colombo Regional Centre)
Sarah Repucci (Transparency International Secretariat, Berlin)
Richard Rose (University of Aberdeen, Scotland)
Robert Rotberg (Belfer Center, Harvard University)
Fernando Spross (FUNDESA Guatemala)
Stefanie Teggemann (World Bank)
Stephen Weber (Program on International Policy Attitudes [PIPA])
Hanan Yossef (Arab Organization for International Communication, Egypt)
A USERS’ GUIDE TO MEASURING CORRUPTION
59
Arndt, Christiane and Charles Oman (2006), Uses and Abuses of Governance Indicators, OECD Development Cen-tre, Paris, France. http://www.oecd.org/dataoecd/21/16/40037762.pdf
Besancon, Marie (2003), Good Governance Rankings: The Art of Measurement, World Peace Foundation Reports, Vol. 36.http://belfercenter.ksg.harvard.edu/fi les/wpf36governance.pdf
Besic, Milos, Nikola Djurovic, MA Nenead Koprivica, Aleksandar Pajevic, Veselin Pavicevic and Rajko Radevic (2007), Democracy Index: Montenegro 2007, Center for Democracy and Human Rights.http://www.cedem.cg.yu/publications/fi les/DemocracyIndex_report2007.pdf
Bjuremalm, Helena (2005), “Methods of Analysing Power – A Workshop Report”, SIDA: Division for Democratic Governance, Introduction.http://www.sida.se/sida/jsp/sida.jsp?d=118&a=3485
Booth, David and Richard Crook, E., Gyimah-Boadi, Tony Killick, Robin Luckham with Nana Boateng (2005), “What are the Drivers of Change in Ghana?”, CDD/ODI Policy Brief, No. 1, 1-10.http://www.odi.org.uk/PPPG/politics_and_governance/what_we_do/Developmental_state/drivers_of_change/GhanaDoC_ODI-CDD_Policy%20Brief_1.pdf
Bryan, Shari and Barrie Hofmann (2007). Transparency and Accountability in Africa’s Extractive Industries: The Role of the Legislature, National Democratic Institute for International Affairs, Washington, DC. http://www.accessdemocracy.org/library/2191_extractive_080807.pdf
“Concept Paper and Agenda Annotations”, OECD/DAC GOVNET Conference on Governance Assessment and Aid Effectiveness, 2008, 1-8.http://www.oecd.org/dataoecd/16/27/40266891.pdf
“Corruption and Governance Measurement Tools in Latin American Countries”, Transparency International and UNDP, 2006http://www.transparency.org/content/download/8686/56295/fi le/TI2006_Corruption_Governance_Measure-ment_Tools_LA.pdf
“Democratic Governance Indicators: Assessing the State of Governance in Mongolia”, UNDP Mongolia, Ulaan-baatar, Mongolia, 2006.http://www.undp.org/oslocentre/docs07/DGI-Mongolia.pdf
“Evaluation of UNDP’s Role in the PRSP Process: Vol. 1: Main Report”, UNDP, New York, NY, 2003.http://www.jposc.dk/documents/evaluation_of%20the%20role%20of%20UNDP%20in%20the%20PRSP%20Process.pdf
Galtung, Fredrik (N.D.), “Corruption in Post-Confl ict Reconstruction: Confronting the Vicious Cycle”, www.tiri.org, 1-10.
References
A USERS’ GUIDE TO MEASURING CORRUPTION
60
“Glossary of Statistical Terms”, OECD, 2007. http://stats.oecd.org/glossary/detail.asp?ID=7236.
“Governance Assessments and the Paris Declaration: Opportunities for Inclusive Participation and National Owner-ship”, UNDP Oslo Governance Centre/Chr. Michelsen Institute Seminar Report, Oslo, Norway, 2007.http://www.undp.org/oslocentre/docs07/BergenSeminar.pdf
Grødeland, Åse B., Tatyana Y. Koshechkina, William L. Miller, A Culture of Corruption? Coping with Government in Postcommunist Europe, Central European University Press, Budapest, 2001.
Guterres, Francisco da Costa, Joao M. Saldanha, and Anacleto a Costa Riberio (2007). Reconstruction National Integrity System Survey: East Timor. Tiri.
Haller, Dieter and Cris Shore, editors (2005). Corruption: Anthropological Perspectives, London, Pluto Press.
Hechler, Hannes and Karen Hussmann (2008), “Anti-Corruption Policy Making in Practice: Implications for Imple-menting UNCAC”, U4 Brief, no. 1.http://www.cmi.no/publications/fi le/?2915=anti-corruption-policy-making-in-practice
Hyden, Goran (2007), “The Challenges of Making Governance Assessments Nationally Owned,” Bergen Seminar on Governance Assessments and the Paris Declaration, Bergen, Norway.
Johnston, Michael (1996), “The Search for Defi nitions: The Vitality of Politics and the Issue of Corruption,” Interna-tional Social Science Journal, 149: 321-335.http://people.colgate.edu/mjohnston/MJ%20papers%2001/issj.pdf
Kaufmann, Daniel and Aart Kraay (2007), “Governance Indicators: Where Are We, Where Should We Be Going?”, World Bank Policy Research Working Paper, 1-43.http://www.oecd.org/dataoecd/18/35/40041515.pdf
Kaufmann, Daniel (2007), “Corruption: The Facts”, Foreign Policy, no. 107, 114-131.http://www.worldbank.org/wbi/governance/pdf/fp_summer97.pdf
Mapping of Corruption and Governance Measurement Tools in Sub-Saharan Africa, Transparency International and UNDP, 2007. http://www.undp.org/oslocentre/docs08/mapping_corruption_africa.pdf
Measuring Democratic Governance: A Framework for Selecting Pro-Poor and Gender Sensitive Indicators, UNDP, Oslo, Norway, 2006.http://www.undp.org/oslocentre/docs06/Framework%20paper%20%20entire%20paper.pdf
Nahem, Joachim and Matthew Sudders (2007), Governance Indicators: A Users’ Guide: UNDP, 2nd edition.http://www.undp.org/oslocentre/docs07/undp_users_guide_online_version.pdf
National Anti-Corruption Strategy: Government of Sierra Leone, National Anti-Corruption Strategy Secretariat, Freetown, Sierra Leone, 2005.http://www.anticorruptionsl.org/pdf/accstrategy.pdf
Practice Note, “Anti-Corruption, 2004”, UNDP.http://www.undp.org/governance/docs/AC_PN_English.pdf
Practice Note, “Supporting Country Led Governance Assessments”, UNDP, forthcoming.
Rose, Richard and William Mishler (2007), Studies in Public Policy Number 432, “Explaining the Gap Between the Experience and Perception of Corruption”, Centre for the Study of Public Policy, University of Aberdeen, 1-28.
A USERS’ GUIDE TO MEASURING CORRUPTION
61
Rose-Ackerman, Susan (2007), U4 Brief, no. 5, “Measuring Private Sector Corruption”. http://www.cmi.no/publications/fi le/?2755=measuring-private-sector-corruption
Søreide, Tina (2006), “Is it Wrong to Rank? A Critical Assessment of Corruption Indices”, Chr. Michelsen Institute, 1-13. http://www.cmi.no/publications/fi le/?2120=is-it-wrong-to-rank
“Strengthening World Bank Group Engagement on Governance and Anticorruption”, World Bank, 2007. http://www.worldbank.org/html/extdr/comments/governancefeedback/gacpaper-03212007.pdf
U4 Corruption Glossary http://www.u4.no/document/glossary.cfm#pettycorruption
Wedel, Janine R. (2007), “The Corruption Conundrum: Bridging Perspectives Between East and West”, National Institute of Justice.http://www.ncjrs.gov/pdffi les1/nij/grants/218356.pdf
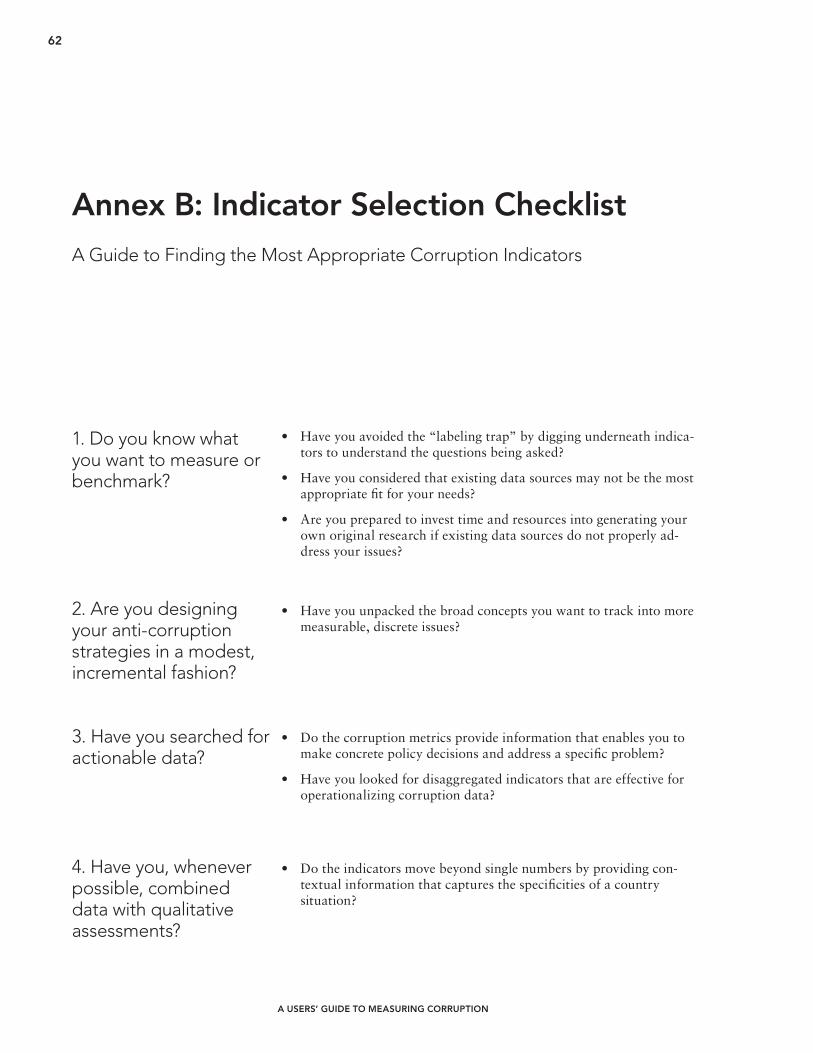
A USERS’ GUIDE TO MEASURING CORRUPTION
62
1. Do you know what you want to measure or benchmark?
2. Are you designing your anti-corruption strategies in a modest, incremental fashion?
3. Have you searched for actionable data?
4. Have you, whenever possible, combined data with qualitative assessments?
• Have you avoided the “labeling trap” by digging underneath indica-tors to understand the questions being asked?
• Have you considered that existing data sources may not be the most appropriate fi t for your needs?
• Are you prepared to invest time and resources into generating your own original research if existing data sources do not properly ad-dress your issues?
• Have you unpacked the broad concepts you want to track into more measurable, discrete issues?
• Do the corruption metrics provide information that enables you to make concrete policy decisions and address a specifi c problem?
• Have you looked for disaggregated indicators that are effective for operationalizing corruption data?
• Do the indicators move beyond single numbers by providing con-textual information that captures the specifi cities of a country situation?
Annex B: Indicator Selection ChecklistA Guide to Finding the Most Appropriate Corruption Indicators
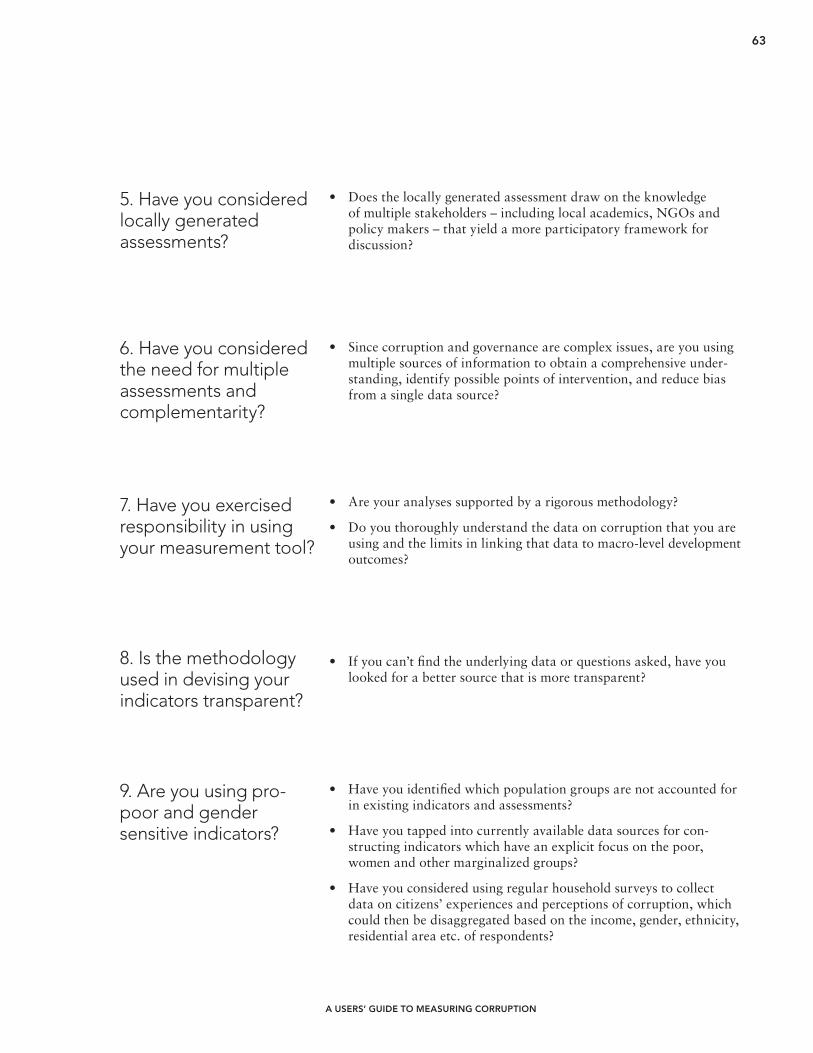
A USERS’ GUIDE TO MEASURING CORRUPTION
63
5. Have you considered locally generated assessments?
6. Have you considered the need for multiple assessments and complementarity?
7. Have you exercised responsibility in using your measurement tool?
8. Is the methodology used in devising your indicators transparent?
9. Are you using pro-poor and gender sensitive indicators?
• Does the locally generated assessment draw on the knowledge of multiple stakeholders – including local academics, NGOs and policy makers – that yield a more participatory framework for discussion?
• Since corruption and governance are complex issues, are you using multiple sources of information to obtain a comprehensive under-standing, identify possible points of intervention, and reduce bias from a single data source?
• Are your analyses supported by a rigorous methodology?
• Do you thoroughly understand the data on corruption that you are using and the limits in linking that data to macro-level development outcomes?
• If you can’t fi nd the underlying data or questions asked, have you looked for a better source that is more transparent?
• Have you identifi ed which population groups are not accounted for in existing indicators and assessments?
• Have you tapped into currently available data sources for con-structing indicators which have an explicit focus on the poor, women and other marginalized groups?
• Have you considered using regular household surveys to collect data on citizens’ experiences and perceptions of corruption, which could then be disaggregated based on the income, gender, ethnicity, residential area etc. of respondents?

64
Annex C: Corruption IndicesAnnotated Table of Selected International Corruption Indices
Index/Publisher:
What is being Measured:
Conceptual Dimension of (Anti-) Corruption:
Input (Rule-based) vs. Output (Outcomes-based):
Composite vs. Original Data:
Objective vs. Subjective Data:
Internal vs. External:
Strengths:
Weaknesses:
URL:
BRIBE PAYERS INDEX / TRANSPARENCY INTERNATIONAL
Ranks 30 leading exporting countries according to the propensity of fi rms with headquarters within their borders to bribe when operating abroad.
Original, Bribery.
Outcome-based assessment.
Original.
Subjective.
Internal and external. Based on responses of 11,232 business executives from 125 countries – they are asked to identify the country of origin of companies doing the most business in their country.
Gauges the likelihood of companies to pay bribes.
Does not identify underlying institutional problems that lead to bribe paying/seeking.
www.transparency.org/policy_research/surveys_indices/bpi
Index/Publisher:
What is being Measured:
Conceptual Dimension of (Anti-) Corruption:
Input (Rule-based) vs. Output (Outcomes-based):
Composite vs. Original Data:
Objective vs. Subjective Data:
Internal vs. External:
Strengths:
Weaknesses:
URL:
BERTELSMANN TRANSFORMATION INDEX (BTI)
Examines and assesses whether and how developing and transformation countries manage social change toward democracy and a market econo-my. The fi ndings on transformation processes and political management are synthesized in two sets of rankings: The Status Index and Manage-ment Index. These indices rank countries on the status of democracy, market economy, and the quality of political management.
Proxy
Outcome-based assessment.
Original.
Subjective.
Internal. Questionnaire is answered and reviewed by country experts and index fi nalized by BTI board.
Disaggregated data helps pinpoint specifi c drawbacks/loopholes of mar-kets or governments. Uses qualitative assessments of experts in compos-ing the index.
Takes into account economic institutions so index does not solely mirror quality of governments.
www.bertelsmann-transformation-index.de/
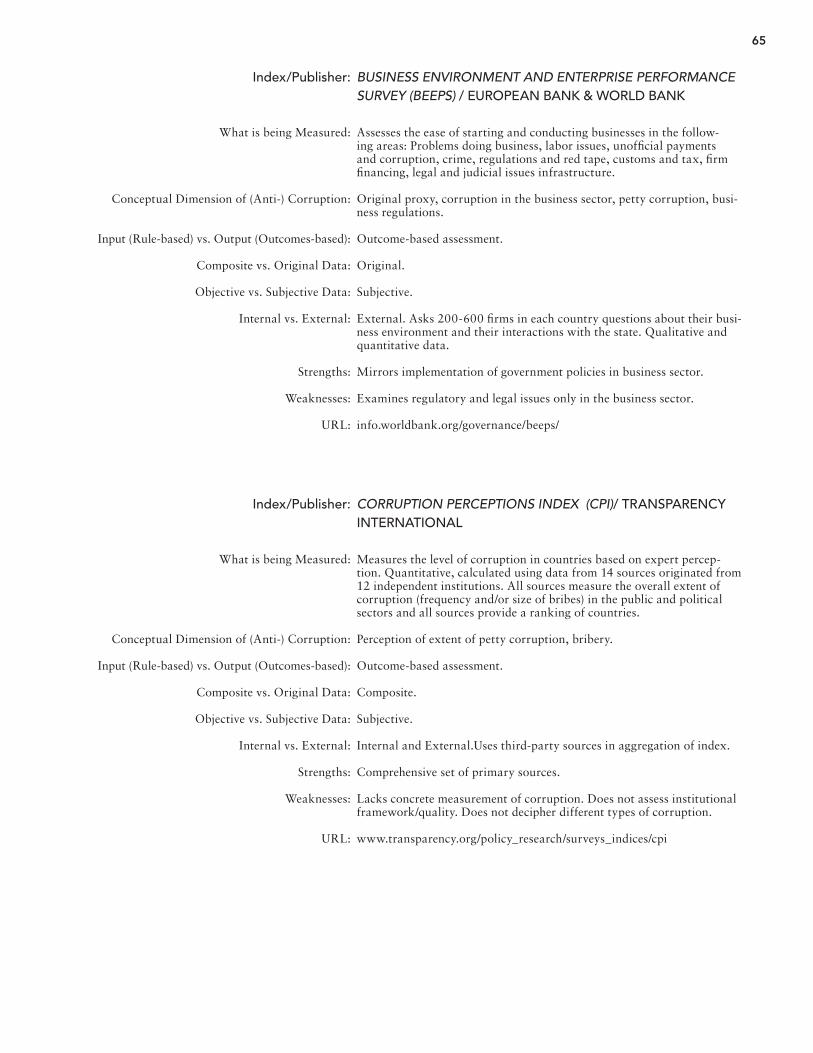
65
BUSINESS ENVIRONMENT AND ENTERPRISE PERFORMANCE SURVEY (BEEPS) / EUROPEAN BANK & WORLD BANK
Assesses the ease of starting and conducting businesses in the follow-ing areas: Problems doing business, labor issues, unoffi cial payments and corruption, crime, regulations and red tape, customs and tax, fi rm fi nancing, legal and judicial issues infrastructure. Original proxy, corruption in the business sector, petty corruption, busi-ness regulations.
Outcome-based assessment.
Original.
Subjective.
External. Asks 200-600 fi rms in each country questions about their busi-ness environment and their interactions with the state. Qualitative and quantitative data.
Mirrors implementation of government policies in business sector.
Examines regulatory and legal issues only in the business sector.
info.worldbank.org/governance/beeps/
Index/Publisher:
What is being Measured:
Conceptual Dimension of (Anti-) Corruption:
Input (Rule-based) vs. Output (Outcomes-based):
Composite vs. Original Data:
Objective vs. Subjective Data:
Internal vs. External:
Strengths:
Weaknesses:
URL:
Index/Publisher:
What is being Measured:
Conceptual Dimension of (Anti-) Corruption:
Input (Rule-based) vs. Output (Outcomes-based):
Composite vs. Original Data:
Objective vs. Subjective Data:
Internal vs. External:
Strengths:
Weaknesses:
URL:
CORRUPTION PERCEPTIONS INDEX (CPI)/ TRANSPARENCY INTERNATIONAL
Measures the level of corruption in countries based on expert percep-tion. Quantitative, calculated using data from 14 sources originated from 12 independent institutions. All sources measure the overall extent of corruption (frequency and/or size of bribes) in the public and political sectors and all sources provide a ranking of countries.
Perception of extent of petty corruption, bribery.
Outcome-based assessment.
Composite.
Subjective.
Internal and External.Uses third-party sources in aggregation of index.
Comprehensive set of primary sources.
Lacks concrete measurement of corruption. Does not assess institutional framework/quality. Does not decipher different types of corruption.
www.transparency.org/policy_research/surveys_indices/cpi
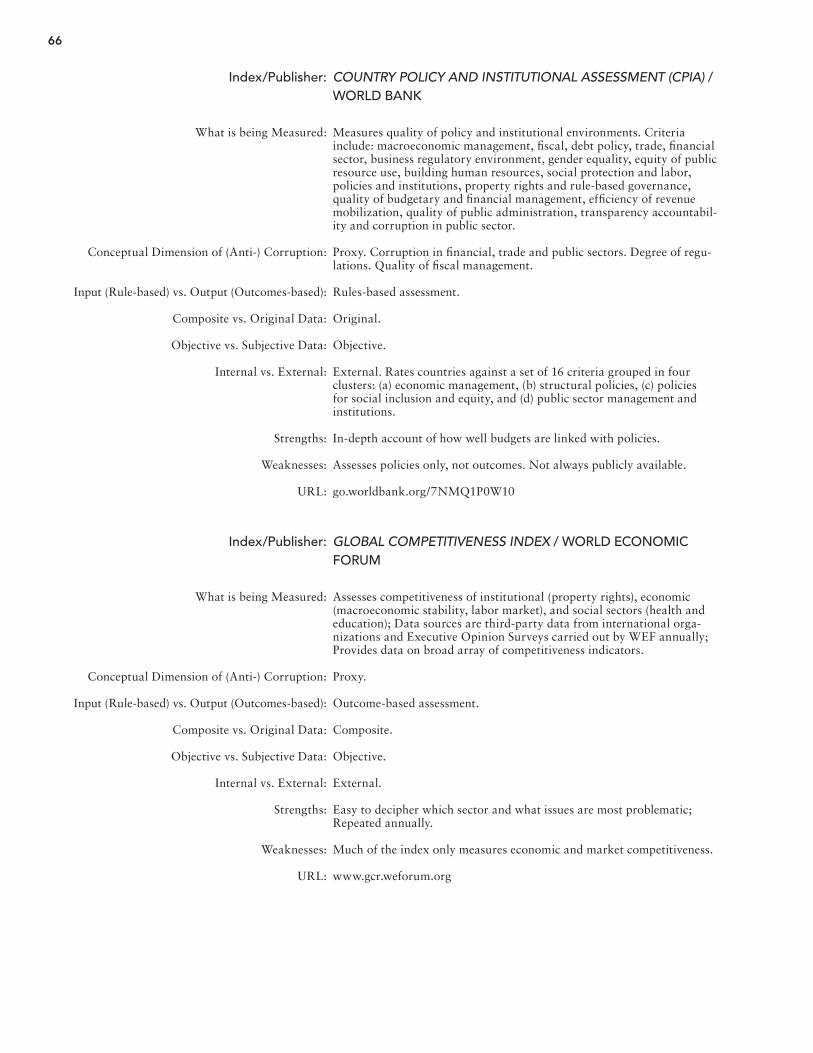
66
Index/Publisher:
What is being Measured:
Conceptual Dimension of (Anti-) Corruption:
Input (Rule-based) vs. Output (Outcomes-based):
Composite vs. Original Data:
Objective vs. Subjective Data:
Internal vs. External:
Strengths:
Weaknesses:
URL:
COUNTRY POLICY AND INSTITUTIONAL ASSESSMENT (CPIA) / WORLD BANK
Measures quality of policy and institutional environments. Criteria include: macroeconomic management, fi scal, debt policy, trade, fi nancial sector, business regulatory environment, gender equality, equity of public resource use, building human resources, social protection and labor, policies and institutions, property rights and rule-based governance, quality of budgetary and fi nancial management, effi ciency of revenue mobilization, quality of public administration, transparency accountabil-ity and corruption in public sector.
Proxy. Corruption in fi nancial, trade and public sectors. Degree of regu-lations. Quality of fi scal management.
Rules-based assessment.
Original.
Objective.
External. Rates countries against a set of 16 criteria grouped in four clusters: (a) economic management, (b) structural policies, (c) policies for social inclusion and equity, and (d) public sector management and institutions.
In-depth account of how well budgets are linked with policies.
Assesses policies only, not outcomes. Not always publicly available.
go.worldbank.org/7NMQ1P0W10
Index/Publisher:
What is being Measured:
Conceptual Dimension of (Anti-) Corruption:
Input (Rule-based) vs. Output (Outcomes-based):
Composite vs. Original Data:
Objective vs. Subjective Data:
Internal vs. External:
Strengths:
Weaknesses:
URL:
GLOBAL COMPETITIVENESS INDEX / WORLD ECONOMIC FORUM
Assesses competitiveness of institutional (property rights), economic (macroeconomic stability, labor market), and social sectors (health and education); Data sources are third-party data from international orga-nizations and Executive Opinion Surveys carried out by WEF annually; Provides data on broad array of competitiveness indicators.
Proxy.
Outcome-based assessment.
Composite.
Objective.
External.
Easy to decipher which sector and what issues are most problematic; Repeated annually.
Much of the index only measures economic and market competitiveness.
www.gcr.weforum.org
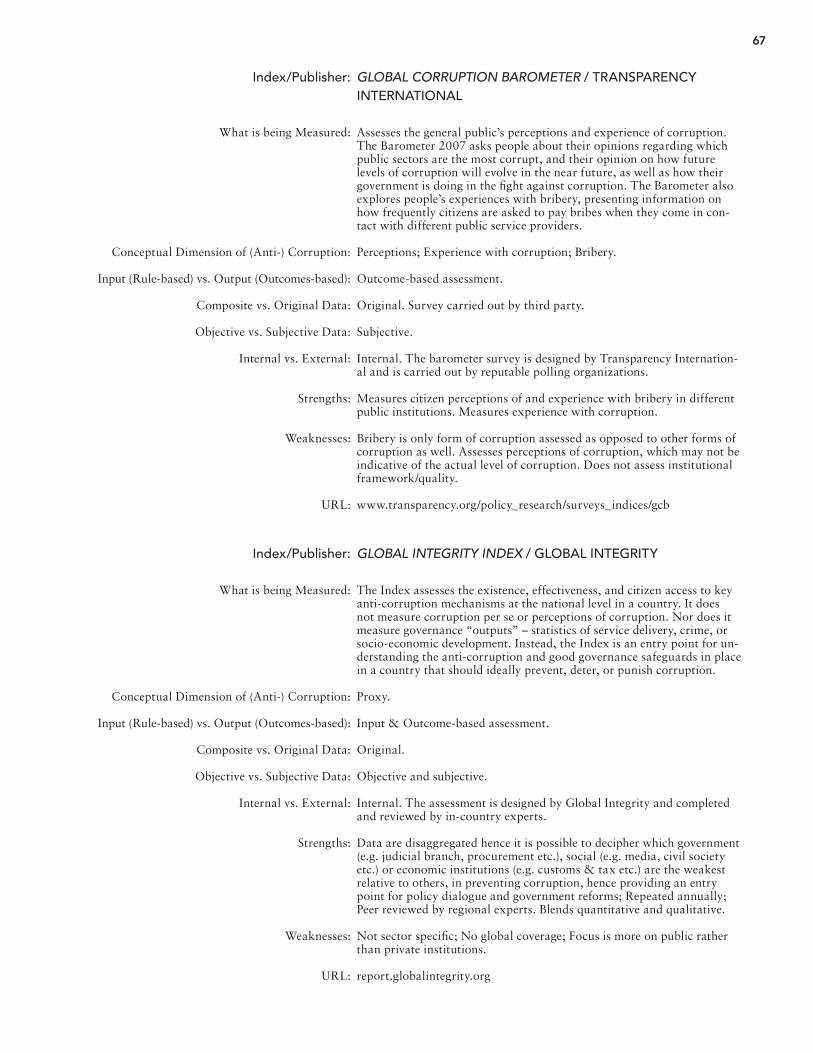
67
Index/Publisher:
What is being Measured:
Conceptual Dimension of (Anti-) Corruption:
Input (Rule-based) vs. Output (Outcomes-based):
Composite vs. Original Data:
Objective vs. Subjective Data:
Internal vs. External:
Strengths:
Weaknesses:
URL:
GLOBAL CORRUPTION BAROMETER / TRANSPARENCY INTERNATIONAL
Assesses the general public’s perceptions and experience of corruption. The Barometer 2007 asks people about their opinions regarding which public sectors are the most corrupt, and their opinion on how future levels of corruption will evolve in the near future, as well as how their government is doing in the fi ght against corruption. The Barometer also explores people’s experiences with bribery, presenting information on how frequently citizens are asked to pay bribes when they come in con-tact with different public service providers.
Perceptions; Experience with corruption; Bribery.
Outcome-based assessment.
Original. Survey carried out by third party.
Subjective.
Internal. The barometer survey is designed by Transparency Internation-al and is carried out by reputable polling organizations.
Measures citizen perceptions of and experience with bribery in different public institutions. Measures experience with corruption.
Bribery is only form of corruption assessed as opposed to other forms of corruption as well. Assesses perceptions of corruption, which may not be indicative of the actual level of corruption. Does not assess institutional framework/quality.
www.transparency.org/policy_research/surveys_indices/gcb
Index/Publisher:
What is being Measured:
Conceptual Dimension of (Anti-) Corruption:
Input (Rule-based) vs. Output (Outcomes-based):
Composite vs. Original Data:
Objective vs. Subjective Data:
Internal vs. External:
Strengths:
Weaknesses:
URL:
GLOBAL INTEGRITY INDEX / GLOBAL INTEGRITY
The Index assesses the existence, effectiveness, and citizen access to key anti-corruption mechanisms at the national level in a country. It does not measure corruption per se or perceptions of corruption. Nor does it measure governance “outputs” – statistics of service delivery, crime, or socio-economic development. Instead, the Index is an entry point for un-derstanding the anti-corruption and good governance safeguards in place in a country that should ideally prevent, deter, or punish corruption.
Proxy.
Input & Outcome-based assessment.
Original.
Objective and subjective.
Internal. The assessment is designed by Global Integrity and completed and reviewed by in-country experts.
Data are disaggregated hence it is possible to decipher which government (e.g. judicial branch, procurement etc.), social (e.g. media, civil society etc.) or economic institutions (e.g. customs & tax etc.) are the weakest relative to others, in preventing corruption, hence providing an entry point for policy dialogue and government reforms; Repeated annually; Peer reviewed by regional experts. Blends quantitative and qualitative.
Not sector specifi c; No global coverage; Focus is more on public rather than private institutions.
report.globalintegrity.org
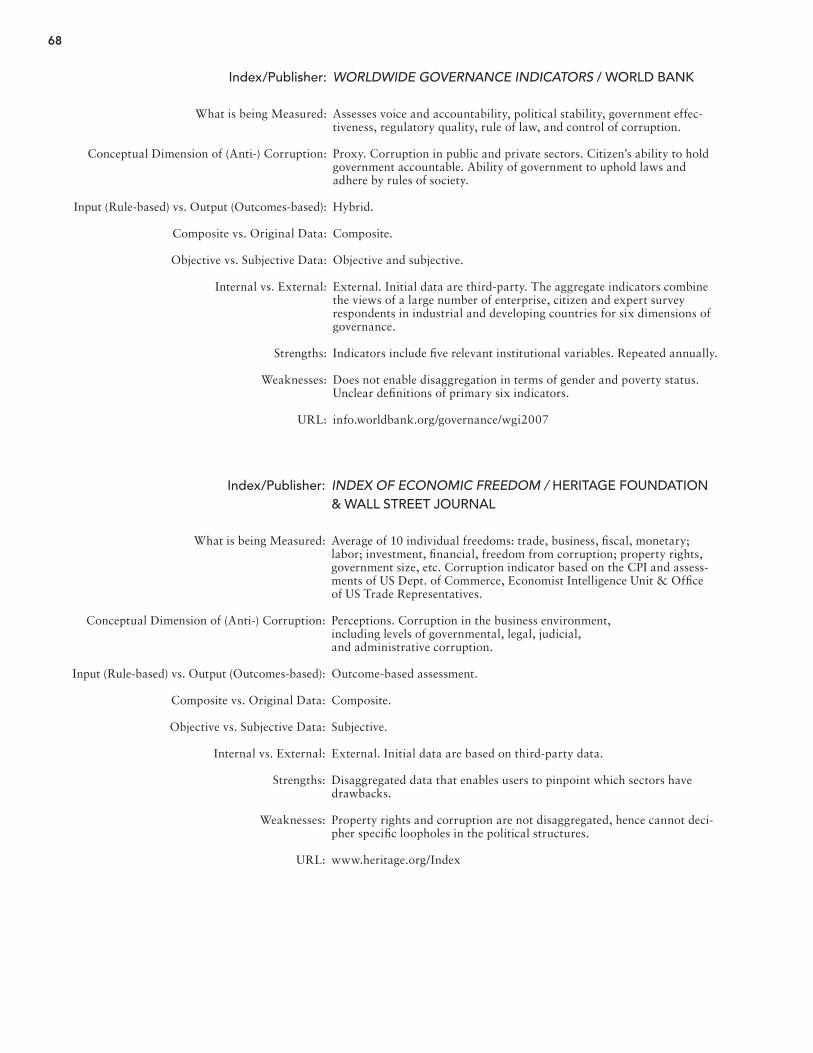
68
Index/Publisher:
What is being Measured:
Conceptual Dimension of (Anti-) Corruption:
Input (Rule-based) vs. Output (Outcomes-based):
Composite vs. Original Data:
Objective vs. Subjective Data:
Internal vs. External:
Strengths:
Weaknesses:
URL:
INDEX OF ECONOMIC FREEDOM / HERITAGE FOUNDATION & WALL STREET JOURNAL
Average of 10 individual freedoms: trade, business, fi scal, monetary; labor; investment, fi nancial, freedom from corruption; property rights, government size, etc. Corruption indicator based on the CPI and assess-ments of US Dept. of Commerce, Economist Intelligence Unit & Offi ce of US Trade Representatives.
Perceptions. Corruption in the business environment,including levels of governmental, legal, judicial,and administrative corruption.
Outcome-based assessment.
Composite.
Subjective.
External. Initial data are based on third-party data.
Disaggregated data that enables users to pinpoint which sectors have drawbacks.
Property rights and corruption are not disaggregated, hence cannot deci-pher specifi c loopholes in the political structures.
www.heritage.org/Index
Index/Publisher:
What is being Measured:
Conceptual Dimension of (Anti-) Corruption:
Input (Rule-based) vs. Output (Outcomes-based):
Composite vs. Original Data:
Objective vs. Subjective Data:
Internal vs. External:
Strengths:
Weaknesses:
URL:
WORLDWIDE GOVERNANCE INDICATORS / WORLD BANK
Assesses voice and accountability, political stability, government effec-tiveness, regulatory quality, rule of law, and control of corruption.
Proxy. Corruption in public and private sectors. Citizen’s ability to hold government accountable. Ability of government to uphold laws and adhere by rules of society.
Hybrid.
Composite.
Objective and subjective.
External. Initial data are third-party. The aggregate indicators combine the views of a large number of enterprise, citizen and expert survey respondents in industrial and developing countries for six dimensions of governance.
Indicators include fi ve relevant institutional variables. Repeated annually.
Does not enable disaggregation in terms of gender and poverty status. Unclear defi nitions of primary six indicators.
info.worldbank.org/governance/wgi2007
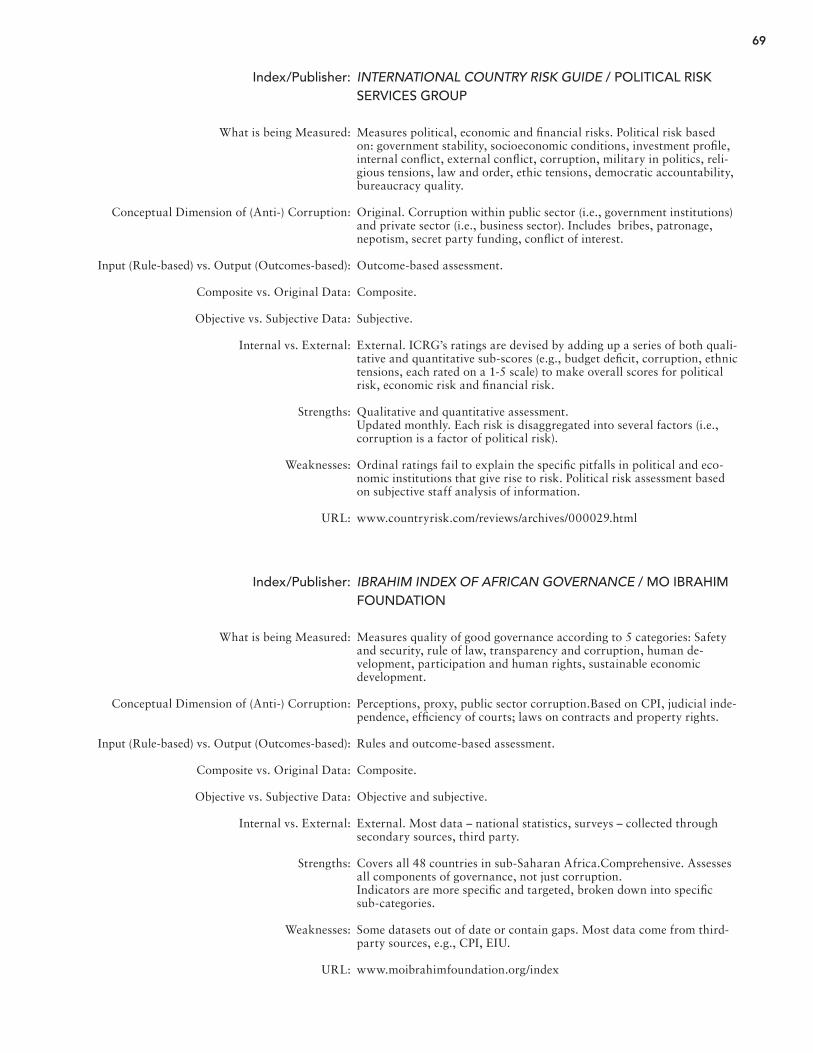
69
Index/Publisher:
What is being Measured:
Conceptual Dimension of (Anti-) Corruption:
Input (Rule-based) vs. Output (Outcomes-based):
Composite vs. Original Data:
Objective vs. Subjective Data:
Internal vs. External:
Strengths:
Weaknesses:
URL:
INTERNATIONAL COUNTRY RISK GUIDE / POLITICAL RISK SERVICES GROUP
Measures political, economic and fi nancial risks. Political risk based on: government stability, socioeconomic conditions, investment profi le, internal confl ict, external confl ict, corruption, military in politics, reli-gious tensions, law and order, ethic tensions, democratic accountability, bureaucracy quality.
Original. Corruption within public sector (i.e., government institutions) and private sector (i.e., business sector). Includes bribes, patronage, nepotism, secret party funding, confl ict of interest.
Outcome-based assessment.
Composite.
Subjective.
External. ICRG’s ratings are devised by adding up a series of both quali-tative and quantitative sub-scores (e.g., budget defi cit, corruption, ethnic tensions, each rated on a 1-5 scale) to make overall scores for political risk, economic risk and fi nancial risk.
Qualitative and quantitative assessment.Updated monthly. Each risk is disaggregated into several factors (i.e., corruption is a factor of political risk). Ordinal ratings fail to explain the specifi c pitfalls in political and eco-nomic institutions that give rise to risk. Political risk assessment based on subjective staff analysis of information.
www.countryrisk.com/reviews/archives/000029.html
Index/Publisher:
What is being Measured:
Conceptual Dimension of (Anti-) Corruption:
Input (Rule-based) vs. Output (Outcomes-based):
Composite vs. Original Data:
Objective vs. Subjective Data:
Internal vs. External:
Strengths:
Weaknesses:
URL:
IBRAHIM INDEX OF AFRICAN GOVERNANCE / MO IBRAHIM FOUNDATION
Measures quality of good governance according to 5 categories: Safety and security, rule of law, transparency and corruption, human de-velopment, participation and human rights, sustainable economic development.
Perceptions, proxy, public sector corruption.Based on CPI, judicial inde-pendence, effi ciency of courts; laws on contracts and property rights.
Rules and outcome-based assessment.
Composite.
Objective and subjective.
External. Most data – national statistics, surveys – collected through secondary sources, third party.
Covers all 48 countries in sub-Saharan Africa.Comprehensive. Assesses all components of governance, not just corruption.Indicators are more specifi c and targeted, broken down into specifi c sub-categories.
Some datasets out of date or contain gaps. Most data come from third-party sources, e.g., CPI, EIU.
www.moibrahimfoundation.org/index
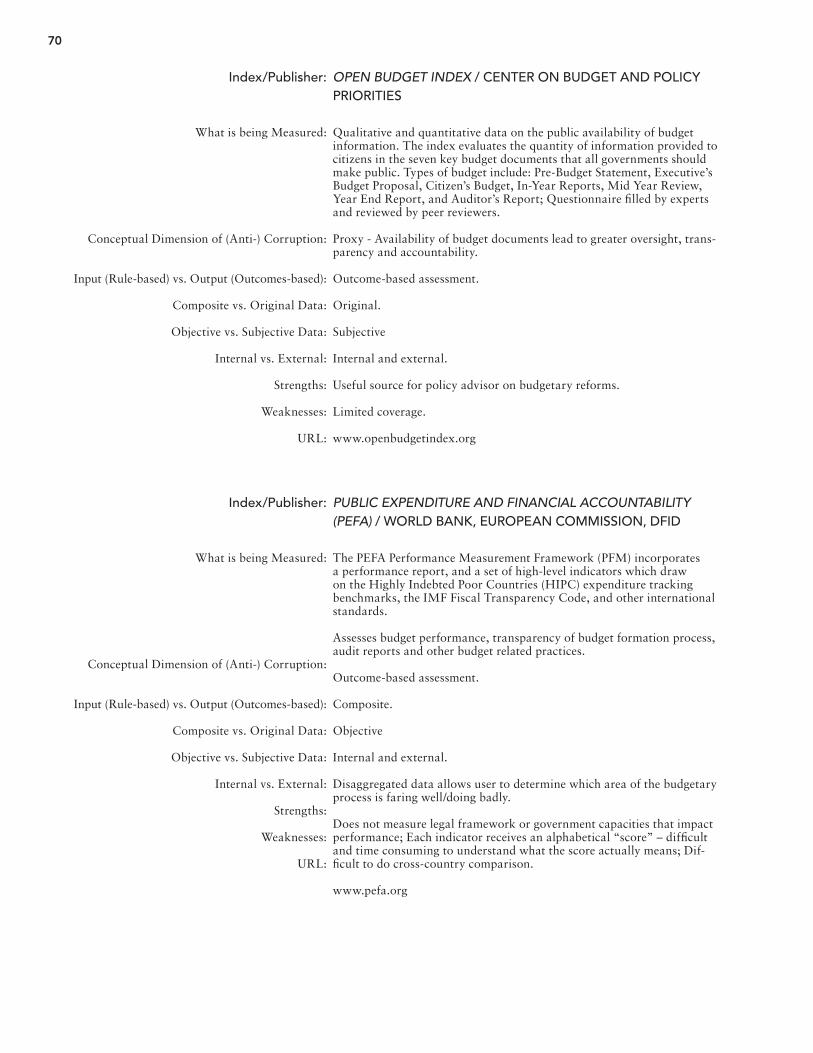
70
Index/Publisher:
What is being Measured:
Conceptual Dimension of (Anti-) Corruption:
Input (Rule-based) vs. Output (Outcomes-based):
Composite vs. Original Data:
Objective vs. Subjective Data:
Internal vs. External:
Strengths:
Weaknesses:
URL:
PUBLIC EXPENDITURE AND FINANCIAL ACCOUNTABILITY (PEFA) / WORLD BANK, EUROPEAN COMMISSION, DFID
The PEFA Performance Measurement Framework (PFM) incorporates a performance report, and a set of high-level indicators which draw on the Highly Indebted Poor Countries (HIPC) expenditure tracking benchmarks, the IMF Fiscal Transparency Code, and other international standards.
Assesses budget performance, transparency of budget formation process, audit reports and other budget related practices.
Outcome-based assessment.
Composite.
Objective
Internal and external.
Disaggregated data allows user to determine which area of the budgetary process is faring well/doing badly.
Does not measure legal framework or government capacities that impact performance; Each indicator receives an alphabetical “score” – diffi cult and time consuming to understand what the score actually means; Dif-fi cult to do cross-country comparison.
www.pefa.org
Index/Publisher:
What is being Measured:
Conceptual Dimension of (Anti-) Corruption:
Input (Rule-based) vs. Output (Outcomes-based):
Composite vs. Original Data:
Objective vs. Subjective Data:
Internal vs. External:
Strengths:
Weaknesses:
URL:
OPEN BUDGET INDEX / CENTER ON BUDGET AND POLICY PRIORITIES
Qualitative and quantitative data on the public availability of budget information. The index evaluates the quantity of information provided to citizens in the seven key budget documents that all governments should make public. Types of budget include: Pre-Budget Statement, Executive’s Budget Proposal, Citizen’s Budget, In-Year Reports, Mid Year Review, Year End Report, and Auditor’s Report; Questionnaire fi lled by experts and reviewed by peer reviewers.
Proxy - Availability of budget documents lead to greater oversight, trans-parency and accountability.
Outcome-based assessment.
Original.
Subjective
Internal and external.
Useful source for policy advisor on budgetary reforms.
Limited coverage.
www.openbudgetindex.org
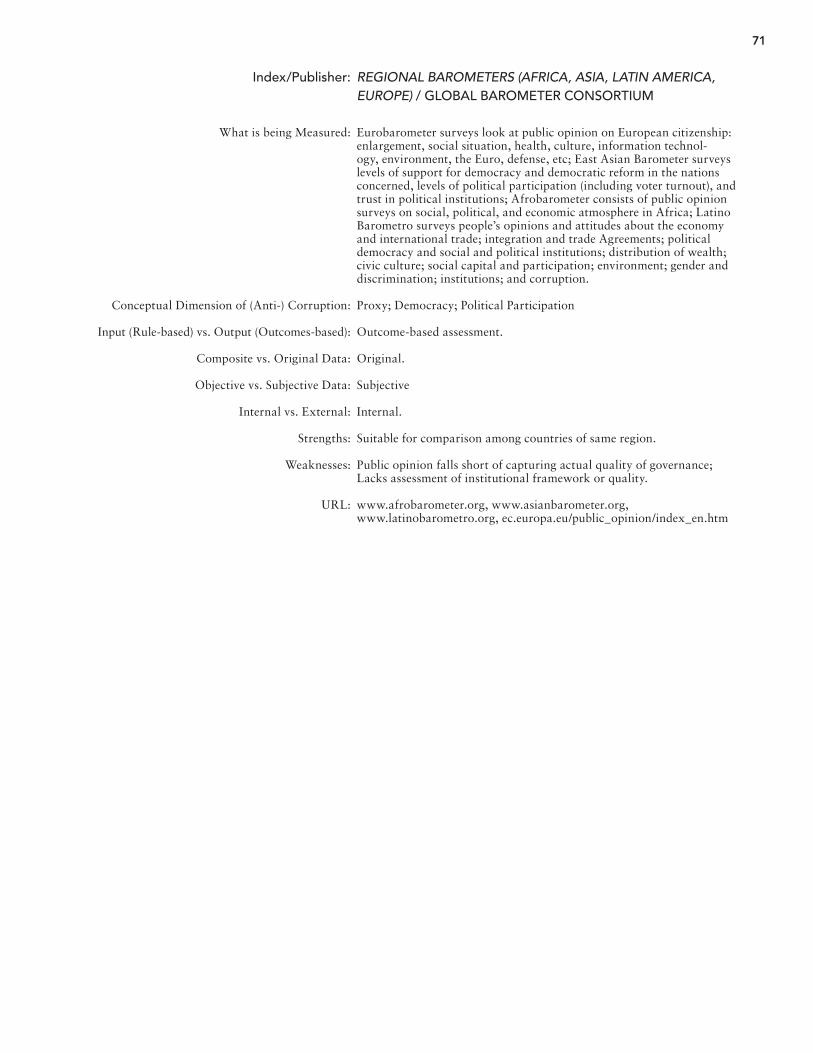
71
Index/Publisher:
What is being Measured:
Conceptual Dimension of (Anti-) Corruption:
Input (Rule-based) vs. Output (Outcomes-based):
Composite vs. Original Data:
Objective vs. Subjective Data:
Internal vs. External:
Strengths:
Weaknesses:
URL:
REGIONAL BAROMETERS (AFRICA, ASIA, LATIN AMERICA, EUROPE) / GLOBAL BAROMETER CONSORTIUM
Eurobarometer surveys look at public opinion on European citizenship: enlargement, social situation, health, culture, information technol-ogy, environment, the Euro, defense, etc; East Asian Barometer surveys levels of support for democracy and democratic reform in the nations concerned, levels of political participation (including voter turnout), and trust in political institutions; Afrobarometer consists of public opinion surveys on social, political, and economic atmosphere in Africa; Latino Barometro surveys people’s opinions and attitudes about the economy and international trade; integration and trade Agreements; political democracy and social and political institutions; distribution of wealth; civic culture; social capital and participation; environment; gender and discrimination; institutions; and corruption.
Proxy; Democracy; Political Participation
Outcome-based assessment.
Original.
Subjective
Internal.
Suitable for comparison among countries of same region.
Public opinion falls short of capturing actual quality of governance; Lacks assessment of institutional framework or quality.
www.afrobarometer.org, www.asianbarometer.org, www.latinobarometro.org, ec.europa.eu/public_opinion/index_en.htm
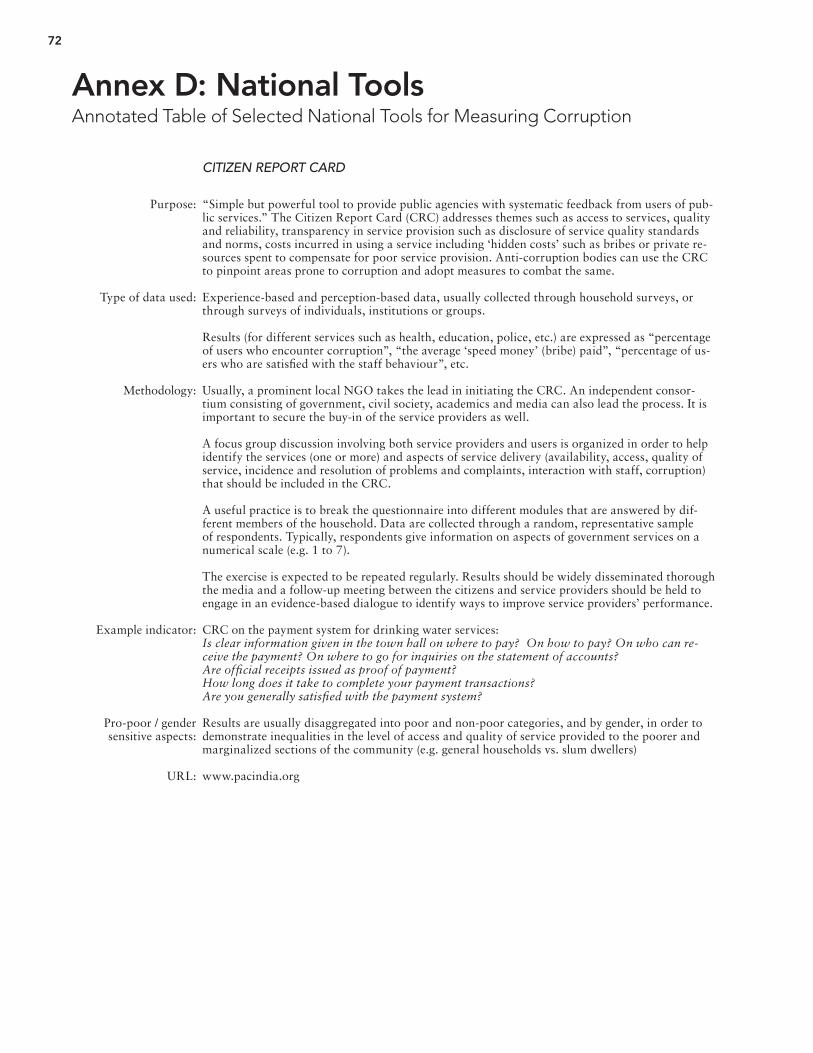
72
Annex D: National Tools Annotated Table of Selected National Tools for Measuring Corruption
Purpose:
Type of data used:
Methodology:
Example indicator:
Pro-poor / gender sensitive aspects:
URL:
CITIZEN REPORT CARD
“Simple but powerful tool to provide public agencies with systematic feedback from users of pub-lic services.” The Citizen Report Card (CRC) addresses themes such as access to services, quality and reliability, transparency in service provision such as disclosure of service quality standards and norms, costs incurred in using a service including ‘hidden costs’ such as bribes or private re-sources spent to compensate for poor service provision. Anti-corruption bodies can use the CRC to pinpoint areas prone to corruption and adopt measures to combat the same.
Experience-based and perception-based data, usually collected through household surveys, or through surveys of individuals, institutions or groups.
Results (for different services such as health, education, police, etc.) are expressed as “percentage of users who encounter corruption”, “the average ‘speed money’ (bribe) paid”, “percentage of us-ers who are satisfi ed with the staff behaviour”, etc.
Usually, a prominent local NGO takes the lead in initiating the CRC. An independent consor-tium consisting of government, civil society, academics and media can also lead the process. It is important to secure the buy-in of the service providers as well.
A focus group discussion involving both service providers and users is organized in order to help identify the services (one or more) and aspects of service delivery (availability, access, quality of service, incidence and resolution of problems and complaints, interaction with staff, corruption) that should be included in the CRC.
A useful practice is to break the questionnaire into different modules that are answered by dif-ferent members of the household. Data are collected through a random, representative sample of respondents. Typically, respondents give information on aspects of government services on a numerical scale (e.g. 1 to 7).
The exercise is expected to be repeated regularly. Results should be widely disseminated thorough the media and a follow-up meeting between the citizens and service providers should be held to engage in an evidence-based dialogue to identify ways to improve service providers’ performance.
CRC on the payment system for drinking water services:Is clear information given in the town hall on where to pay? On how to pay? On who can re-ceive the payment? On where to go for inquiries on the statement of accounts? Are offi cial receipts issued as proof of payment? How long does it take to complete your payment transactions? Are you generally satisfi ed with the payment system?
Results are usually disaggregated into poor and non-poor categories, and by gender, in order to demonstrate inequalities in the level of access and quality of service provided to the poorer and marginalized sections of the community (e.g. general households vs. slum dwellers)
www.pacindia.org
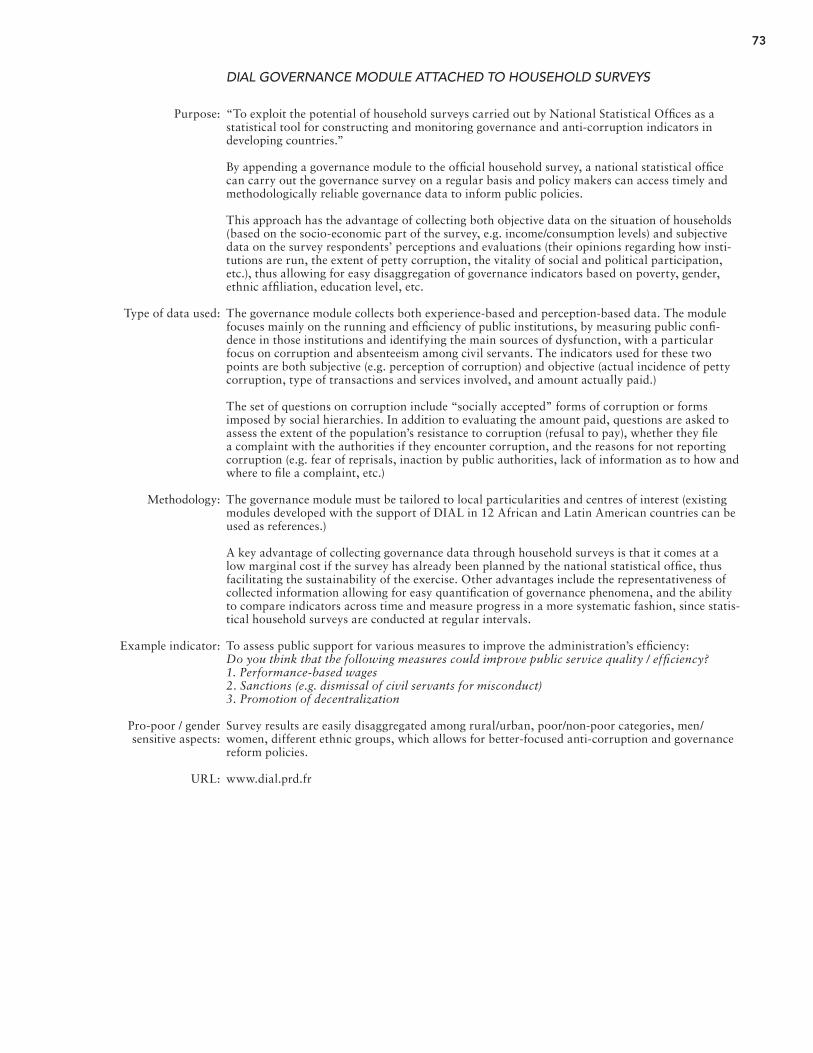
73
Purpose:
Type of data used:
Methodology:
Example indicator:
Pro-poor / gender sensitive aspects:
URL:
DIAL GOVERNANCE MODULE ATTACHED TO HOUSEHOLD SURVEYS
“To exploit the potential of household surveys carried out by National Statistical Offi ces as a statistical tool for constructing and monitoring governance and anti-corruption indicators in developing countries.”
By appending a governance module to the offi cial household survey, a national statistical offi ce can carry out the governance survey on a regular basis and policy makers can access timely and methodologically reliable governance data to inform public policies.
This approach has the advantage of collecting both objective data on the situation of households (based on the socio-economic part of the survey, e.g. income/consumption levels) and subjective data on the survey respondents’ perceptions and evaluations (their opinions regarding how insti-tutions are run, the extent of petty corruption, the vitality of social and political participation, etc.), thus allowing for easy disaggregation of governance indicators based on poverty, gender, ethnic affi liation, education level, etc.
The governance module collects both experience-based and perception-based data. The module focuses mainly on the running and effi ciency of public institutions, by measuring public confi -dence in those institutions and identifying the main sources of dysfunction, with a particular focus on corruption and absenteeism among civil servants. The indicators used for these two points are both subjective (e.g. perception of corruption) and objective (actual incidence of petty corruption, type of transactions and services involved, and amount actually paid.)
The set of questions on corruption include “socially accepted” forms of corruption or forms imposed by social hierarchies. In addition to evaluating the amount paid, questions are asked to assess the extent of the population’s resistance to corruption (refusal to pay), whether they fi le a complaint with the authorities if they encounter corruption, and the reasons for not reporting corruption (e.g. fear of reprisals, inaction by public authorities, lack of information as to how and where to fi le a complaint, etc.)
The governance module must be tailored to local particularities and centres of interest (existing modules developed with the support of DIAL in 12 African and Latin American countries can be used as references.)
A key advantage of collecting governance data through household surveys is that it comes at a low marginal cost if the survey has already been planned by the national statistical offi ce, thus facilitating the sustainability of the exercise. Other advantages include the representativeness of collected information allowing for easy quantifi cation of governance phenomena, and the ability to compare indicators across time and measure progress in a more systematic fashion, since statis-tical household surveys are conducted at regular intervals.
To assess public support for various measures to improve the administration’s effi ciency:Do you think that the following measures could improve public service quality / effi ciency? 1. Performance-based wages 2. Sanctions (e.g. dismissal of civil servants for misconduct) 3. Promotion of decentralization
Survey results are easily disaggregated among rural/urban, poor/non-poor categories, men/women, different ethnic groups, which allows for better-focused anti-corruption and governance reform policies.
www.dial.prd.fr
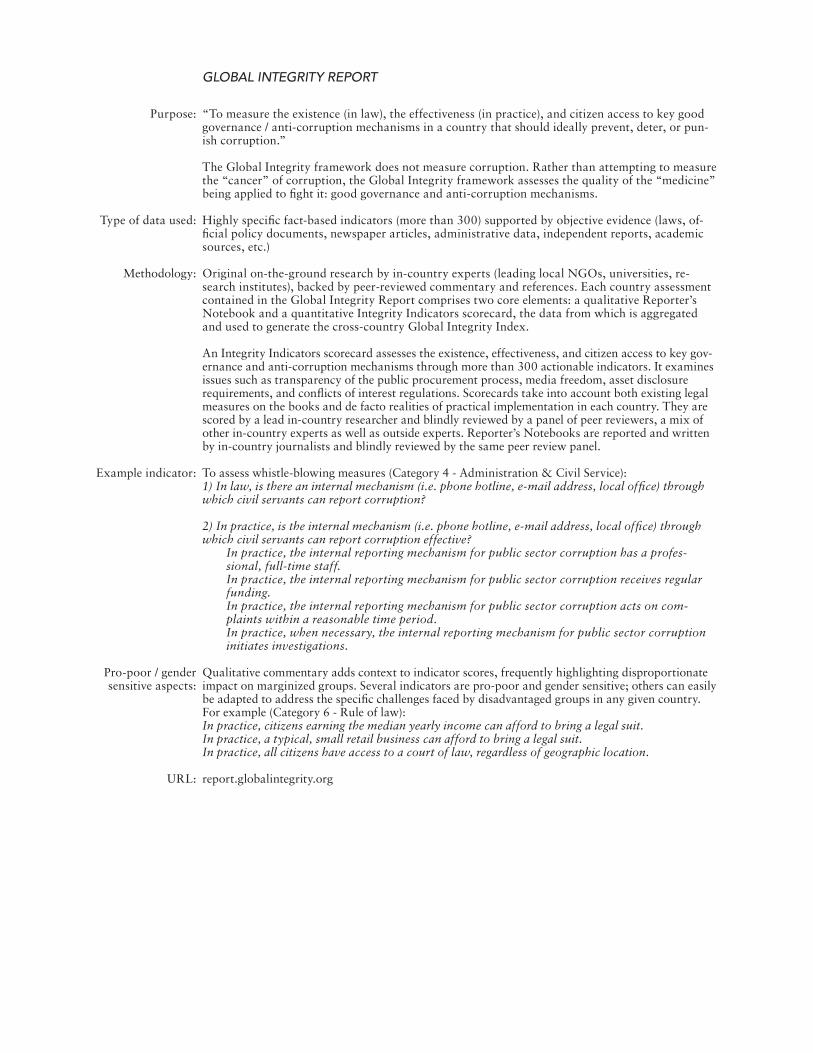
74
Purpose:
Type of data used:
Methodology:
Example indicator:
Pro-poor / gender sensitive aspects:
URL:
GLOBAL INTEGRITY REPORT
“To measure the existence (in law), the effectiveness (in practice), and citizen access to key good governance / anti-corruption mechanisms in a country that should ideally prevent, deter, or pun-ish corruption.”
The Global Integrity framework does not measure corruption. Rather than attempting to measure the “cancer” of corruption, the Global Integrity framework assesses the quality of the “medicine” being applied to fi ght it: good governance and anti-corruption mechanisms.
Highly specifi c fact-based indicators (more than 300) supported by objective evidence (laws, of-fi cial policy documents, newspaper articles, administrative data, independent reports, academic sources, etc.)
Original on-the-ground research by in-country experts (leading local NGOs, universities, re-search institutes), backed by peer-reviewed commentary and references. Each country assessment contained in the Global Integrity Report comprises two core elements: a qualitative Reporter’s Notebook and a quantitative Integrity Indicators scorecard, the data from which is aggregated and used to generate the cross-country Global Integrity Index.
An Integrity Indicators scorecard assesses the existence, effectiveness, and citizen access to key gov-ernance and anti-corruption mechanisms through more than 300 actionable indicators. It examines issues such as transparency of the public procurement process, media freedom, asset disclosure requirements, and confl icts of interest regulations. Scorecards take into account both existing legal measures on the books and de facto realities of practical implementation in each country. They are scored by a lead in-country researcher and blindly reviewed by a panel of peer reviewers, a mix of other in-country experts as well as outside experts. Reporter’s Notebooks are reported and written by in-country journalists and blindly reviewed by the same peer review panel.
To assess whistle-blowing measures (Category 4 - Administration & Civil Service): 1) In law, is there an internal mechanism (i.e. phone hotline, e-mail address, local offi ce) through which civil servants can report corruption?
2) In practice, is the internal mechanism (i.e. phone hotline, e-mail address, local offi ce) through which civil servants can report corruption effective?
In practice, the internal reporting mechanism for public sector corruption has a profes-sional, full-time staff.In practice, the internal reporting mechanism for public sector corruption receives regular funding.In practice, the internal reporting mechanism for public sector corruption acts on com-plaints within a reasonable time period.In practice, when necessary, the internal reporting mechanism for public sector corruption initiates investigations.
Qualitative commentary adds context to indicator scores, frequently highlighting disproportionate impact on marginized groups. Several indicators are pro-poor and gender sensitive; others can easily be adapted to address the specifi c challenges faced by disadvantaged groups in any given country. For example (Category 6 - Rule of law): In practice, citizens earning the median yearly income can afford to bring a legal suit. In practice, a typical, small retail business can afford to bring a legal suit.In practice, all citizens have access to a court of law, regardless of geographic location.
report.globalintegrity.org
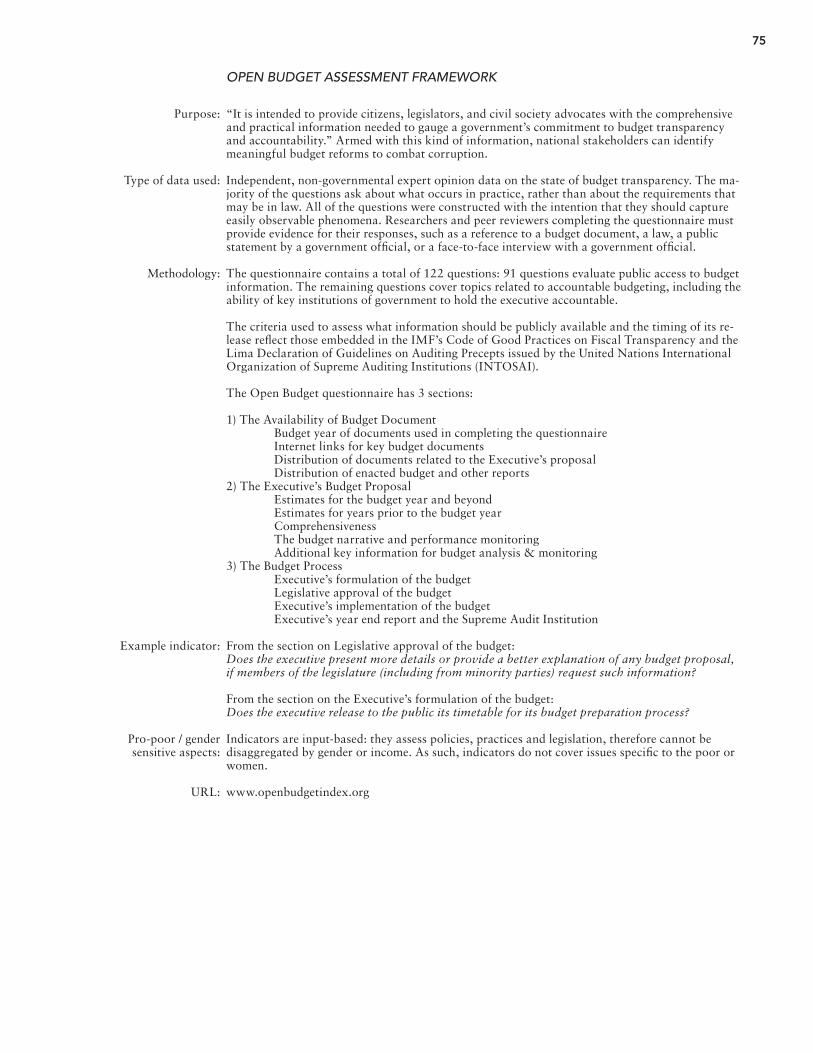
75
Purpose:
Type of data used:
Methodology:
Example indicator:
Pro-poor / gender sensitive aspects:
URL:
OPEN BUDGET ASSESSMENT FRAMEWORK
“It is intended to provide citizens, legislators, and civil society advocates with the comprehensive and practical information needed to gauge a government’s commitment to budget transparency and accountability.” Armed with this kind of information, national stakeholders can identify meaningful budget reforms to combat corruption.
Independent, non-governmental expert opinion data on the state of budget transparency. The ma-jority of the questions ask about what occurs in practice, rather than about the requirements that may be in law. All of the questions were constructed with the intention that they should capture easily observable phenomena. Researchers and peer reviewers completing the questionnaire must provide evidence for their responses, such as a reference to a budget document, a law, a public statement by a government offi cial, or a face-to-face interview with a government offi cial.
The questionnaire contains a total of 122 questions: 91 questions evaluate public access to budget information. The remaining questions cover topics related to accountable budgeting, including the ability of key institutions of government to hold the executive accountable.
The criteria used to assess what information should be publicly available and the timing of its re-lease refl ect those embedded in the IMF’s Code of Good Practices on Fiscal Transparency and the Lima Declaration of Guidelines on Auditing Precepts issued by the United Nations International Organization of Supreme Auditing Institutions (INTOSAI).
The Open Budget questionnaire has 3 sections:
1) The Availability of Budget Document Budget year of documents used in completing the questionnaire Internet links for key budget documents Distribution of documents related to the Executive’s proposal Distribution of enacted budget and other reports 2) The Executive’s Budget Proposal Estimates for the budget year and beyond Estimates for years prior to the budget year Comprehensiveness The budget narrative and performance monitoring Additional key information for budget analysis & monitoring 3) The Budget Process Executive’s formulation of the budget Legislative approval of the budget Executive’s implementation of the budget Executive’s year end report and the Supreme Audit Institution
From the section on Legislative approval of the budget: Does the executive present more details or provide a better explanation of any budget proposal, if members of the legislature (including from minority parties) request such information?
From the section on the Executive’s formulation of the budget: Does the executive release to the public its timetable for its budget preparation process?
Indicators are input-based: they assess policies, practices and legislation, therefore cannot be disaggregated by gender or income. As such, indicators do not cover issues specifi c to the poor or women.
www.openbudgetindex.org
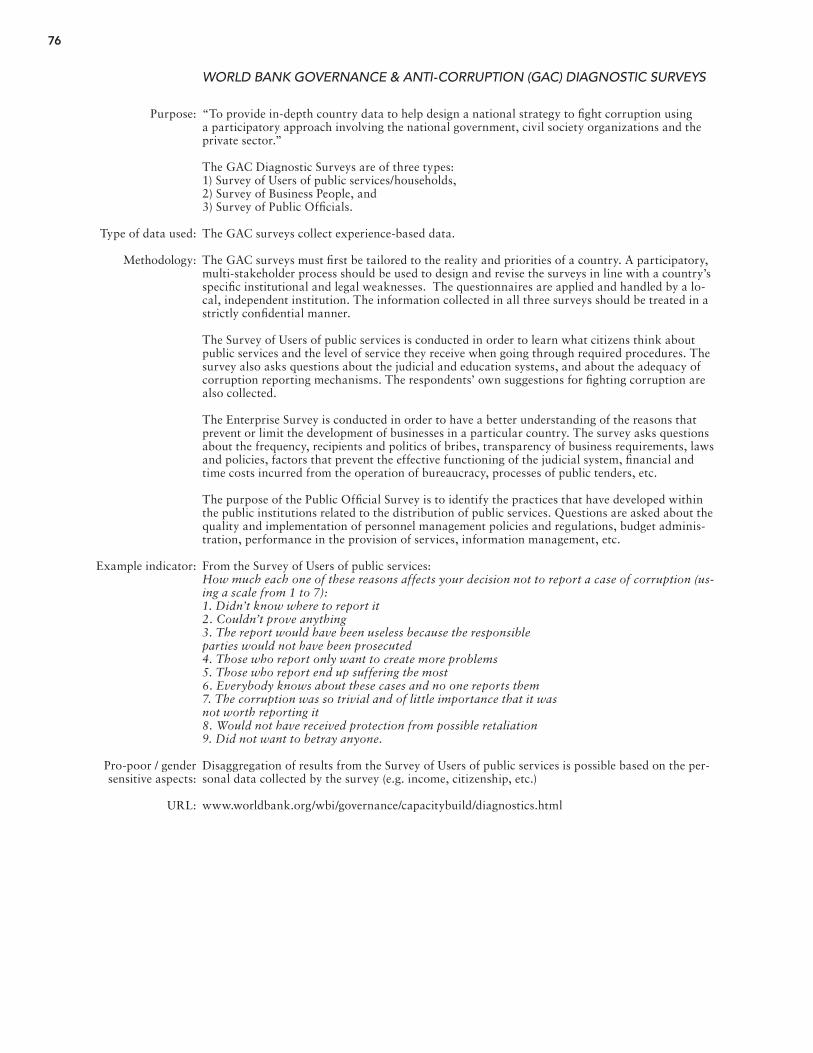
76
Purpose:
Type of data used:
Methodology:
Example indicator:
Pro-poor / gender sensitive aspects:
URL:
WORLD BANK GOVERNANCE & ANTI-CORRUPTION (GAC) DIAGNOSTIC SURVEYS
“To provide in-depth country data to help design a national strategy to fi ght corruption using a participatory approach involving the national government, civil society organizations and the private sector.”
The GAC Diagnostic Surveys are of three types: 1) Survey of Users of public services/households, 2) Survey of Business People, and 3) Survey of Public Offi cials.
The GAC surveys collect experience-based data.
The GAC surveys must fi rst be tailored to the reality and priorities of a country. A participatory, multi-stakeholder process should be used to design and revise the surveys in line with a country’s specifi c institutional and legal weaknesses. The questionnaires are applied and handled by a lo-cal, independent institution. The information collected in all three surveys should be treated in a strictly confi dential manner.
The Survey of Users of public services is conducted in order to learn what citizens think about public services and the level of service they receive when going through required procedures. The survey also asks questions about the judicial and education systems, and about the adequacy of corruption reporting mechanisms. The respondents’ own suggestions for fi ghting corruption are also collected.
The Enterprise Survey is conducted in order to have a better understanding of the reasons that prevent or limit the development of businesses in a particular country. The survey asks questions about the frequency, recipients and politics of bribes, transparency of business requirements, laws and policies, factors that prevent the effective functioning of the judicial system, fi nancial and time costs incurred from the operation of bureaucracy, processes of public tenders, etc.
The purpose of the Public Offi cial Survey is to identify the practices that have developed within the public institutions related to the distribution of public services. Questions are asked about the quality and implementation of personnel management policies and regulations, budget adminis-tration, performance in the provision of services, information management, etc.
From the Survey of Users of public services: How much each one of these reasons affects your decision not to report a case of corruption (us-ing a scale from 1 to 7):1. Didn’t know where to report it 2. Couldn’t prove anything 3. The report would have been useless because the responsibleparties would not have been prosecuted 4. Those who report only want to create more problems 5. Those who report end up suffering the most 6. Everybody knows about these cases and no one reports them 7. The corruption was so trivial and of little importance that it wasnot worth reporting it8. Would not have received protection from possible retaliation 9. Did not want to betray anyone.
Disaggregation of results from the Survey of Users of public services is possible based on the per-sonal data collected by the survey (e.g. income, citizenship, etc.)
www.worldbank.org/wbi/governance/capacitybuild/diagnostics.html