Embed Size (px)
Citation preview

Week 5Chapter 12
Strategy, Balanced Scorecard, and Strategic Profitability
Analysis1
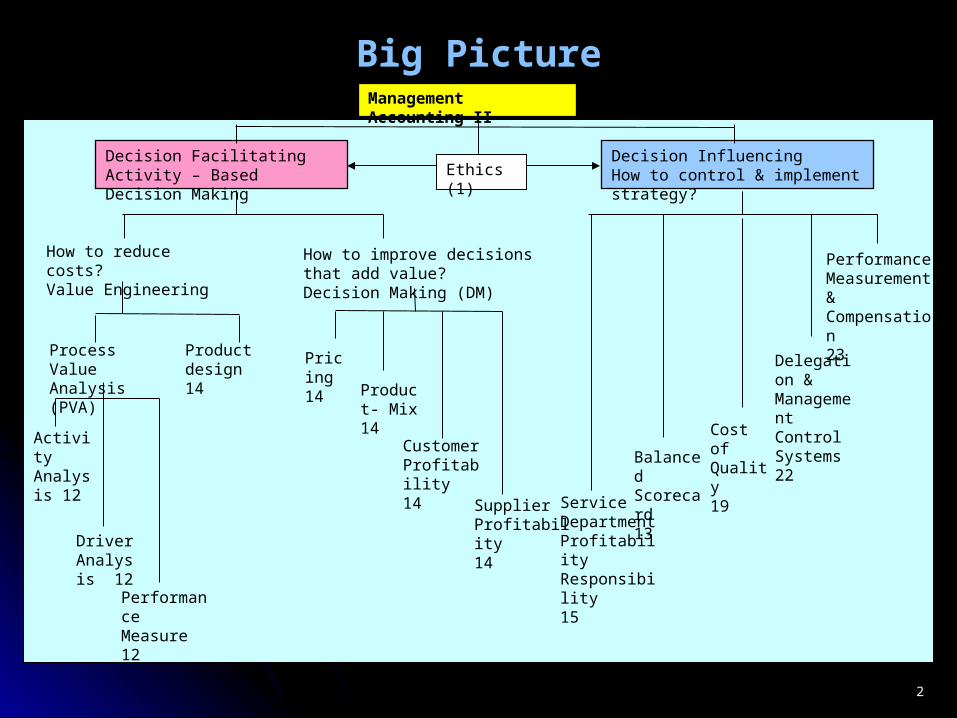
Decision FacilitatingActivity – Based Decision Making
Decision InfluencingHow to control & implement strategy?
Management Accounting II
How to reduce costs?Value Engineering
Driver Analysis 12
Activity Analysis 12
Performance Measure12
How to improve decisions that add value?Decision Making (DM)
ServiceDepartmentProfitabilityResponsibility15
Balanced Scorecard13
Cost of Quality19
Delegation & Management Control Systems 22
Performance Measurement & Compensation23
Ethics (1)
2
Process Value Analysis (PVA)
Pricing14
Product- Mix14
Customer Profitability14
Supplier Profitability14
Product design14
Big Picture
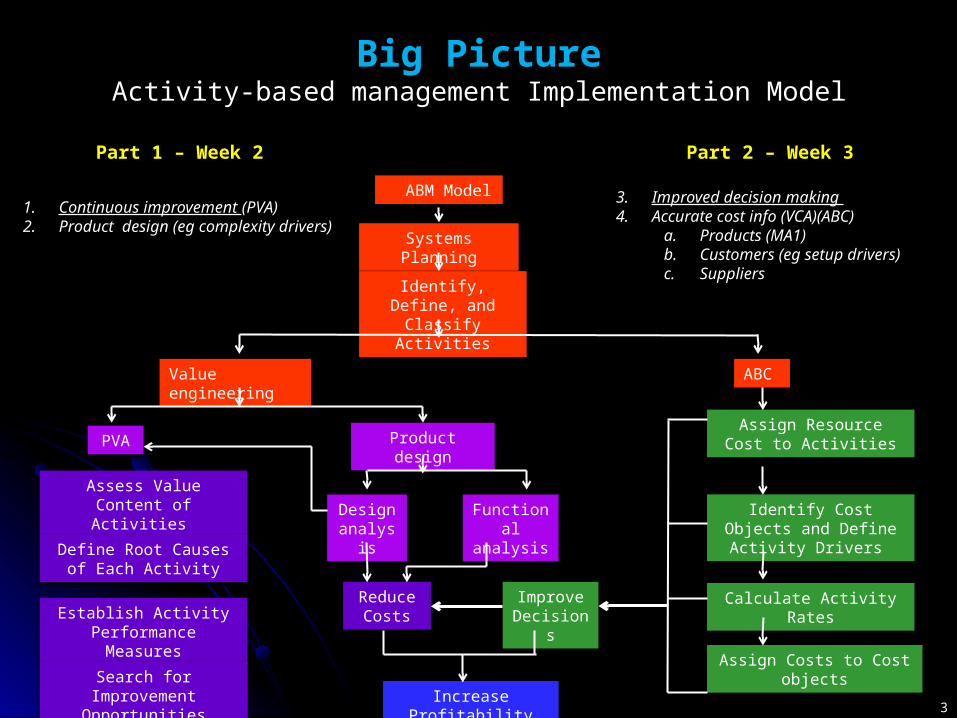
Big PictureActivity-based management Implementation Model
3
ABM Model
Systems Planning
Identify, Define, and Classify Activities
Reduce Costs
Improve Decisions
Increase Profitability
ABC
1. Continuous improvement (PVA) 2. Product design (eg complexity drivers)
3. Improved decision making 4. Accurate cost info (VCA)(ABC)
a. Products (MA1)b. Customers (eg setup drivers)c. Suppliers
PVA
Assess Value Content of Activities
Define Root Causes of Each Activity
Establish Activity Performance Measures
Search for Improvement Opportunities
Part 1 – Week 2 Part 2 – Week 3
Assign Resource Cost to Activities
Identify Cost Objects and Define Activity Drivers
Calculate Activity Rates
Assign Costs to Cost objects
Product design
Value engineering
Design analysis
Functional analysis

Big PictureActivity-Based versus Strategic-Based Responsibility Accounting
4
Responsibility Accounting
Financial-based centers (Cost,
Revenue, Profit, Investment)
Strategy-basedResponsibility accounting system translates the
strategy of the organization into operational objectives and measures
Which one is bottom up/top down?
Activity-based AB system adds a process perspective to the financial perspective of the functional-based
responsibility accounting system.


7
Communication Content, Management Control and the Balanced Scorecard?
Strategy Alignment FWK• Focusing• Competitors• Customers
Systems Thinking• Visualizing• Strategy Map
Measurement• Formalizing• Attributes
Strategic Responsibility Systems

8
• System – role of employees
• Creating alignment with strategy
Visualizing, Formalizing the System (Long term)
• Employee skills, attitude, teamwork
• Customer behavior - satisfaction
Decision making
(Problem Solving)
(Short term)
Outcomes• Empowerment• Learning• Fun place to work
• Low turnoverOutputs• On-time delivery• Less Errors• Fast cycle time• Cheques processed • Customer return• Word of mouth marketing
• What do we have to do today?
• To get what we want tomorrow?
Strategic Responsibility SystemsCreating alignment with non-financial
performance measures

1. Familiarization
2. Learning Objectives
3. Game Objectives
17 Quarters
Highest profit
Diary One-Page summary of learning
Chapter
12 & 23 14 19Accounting Customer Internal
Strategy
Systems Thinking
Measurement
Week 5-8: Learning Objective Summary

10
Week 5: Learning Objective Summary
Strategy Learning objective 1: Recognize which of two generic strategies a company is using
Reengineering Learning objective 2: Understand what comprises reengineering
Balanced Scorecard Learning objective 3: Understand the four perspectives of the balanced scorecard
Evaluating Strategy Learning objective 4: Analyze changes in operating income to evaluate strategy
Engineered & Discretionary Cost Learning objective 5: Distinguish engineered costs from discretionary costs
Managing Unused Capacity Learning objective 6: Identify unused capacity and how to manage it
Balanced ScorecardreengineeringStrategyEngineered &
Discretionary CostManaging Unused
CapacityEvaluating Strategy

1Strategy – How do firms succeed?
11
© Neale O'Connor 2010
Strategy Reengineering Balanced Scorecard Engineered & Discretionary Cost
Managing Unused CapacityEvaluating Strategy

12
Strategy Alignment FWK•Focusing•Competitors•Customers
Strategy Reengineering Balanced Scorecard Engineered & Discretionary Cost
Managing Unused CapacityEvaluating Strategy

13
Why are we doing this? – to help your firm become more successful
What do you mean by success?
Name some successful firms?
Strategy - Every firm has to have a plan that will lead to success?
Measurement - How to we measure progress towards success?
Strategy – How do firms succeed?
Strategy Reengineering Balanced Scorecard Engineered & Discretionary Cost
Managing Unused CapacityEvaluating Strategy
Learning objective 1:Recognize which of two generic strategies a company is using… product differentiation or cost leadership
1

14
Strategy Reengineering Balanced Scorecard Engineered & Discretionary Cost
Managing Unused CapacityEvaluating Strategy

16
How do we implement strategy?
Strategy Formulation
Strategy Execution
SCA
Com
petit
ors
Customer
Customer Internal
Processes Learning &
Growth
Strategy Map-Business Model
Benchmarking , Memory, Learning
Action PlansMKT
OPHRM
Rank Action Date
Initiatives Measure(KPI) Target
Balanced Scorecard
CommunicatingPeople controls-Personnel-Culture
Formulation of actions + targetsAction controls-Behavioral Constraint (Locks)-Preaction Reviews (Budget setting)-Action Accountability (Standard operating procedures)-Redundancy
Formulation of targets + rewardsResults controls-Measure-Targets-Rewards
HRM
MKT
OP
1. Focusing 2. Visualizing 3. Formalizing
MEASUREMENT
3. Formalizing
Cannot manage what you cannot measureAligning (role clarity)Action controls(dos and don’ts)Results controls(incentives)
Strategy Reengineering Balanced Scorecard Engineered & Discretionary Cost
Managing Unused CapacityEvaluating Strategy

17
Basic Business Strategies
1. Product Differentiation – an organization’s ability to offer products or services perceived by its customers to be superior and unique relative to the products or services of its competitors
Leads to brand loyalty and the willingness of customers to pay high prices
Example: A retailer of computers might offer on-site repair service, a feature not offered by other rivals in the local market.
2. Cost Leadership – an organization’s ability to achieve lower costs relative to competitors through productivity and efficiency improvements, elimination of waste, and tight cost control
Leads to lower selling prices
Example: A company might redesign a product so that fewer parts are needed, lowering production costs and the costs of maintaining the product after purchase.
Strategy Reengineering Balanced Scorecard Engineered & Discretionary Cost
Managing Unused CapacityEvaluating Strategy

Which product function offering can we best compete with?
Price range (HK$)
15,000-55,000
5,000-10,000
2,000-4,000
2,000-4000
18
Strategy Reengineering Balanced Scorecard Engineered & Discretionary Cost
Managing Unused CapacityEvaluating Strategy
Basic Business Strategies
3. A focusing strategy happens when a firm selects or emphasizes a market or customer segment in which to compete.

19
Exercise – How do firms succeed?
List some cost leaders/differentiators that you know of
Why do you use a particular service?Save moneyGood quality service
Strategy Reengineering Balanced Scorecard Engineered & Discretionary Cost
Managing Unused CapacityEvaluating Strategy
Commodities Cost leadership business Fast food? It is not because that it is cheap but how a firm competes People go to a product and pay more (differentiation) Different industries

20
Strategy Reengineering Balanced Scorecard Engineered & Discretionary Cost
Managing Unused CapacityEvaluating Strategy
Q. Which phone vendors follow cost leadership and/or product differentiation strategy?
Basic Business Strategies : Example

21
Strategy Reengineering Balanced Scorecard Engineered & Discretionary Cost
Managing Unused CapacityEvaluating Strategy
Q. Which phone vendors follow cost leadership and/or product differentiation strategy?
Basic Business Strategies : Example

22
Strategy Alignment FWK•Customer preference map
Strategy Reengineering Balanced Scorecard Engineered & Discretionary Cost
Managing Unused CapacityEvaluating Strategy

Chipset, a integrated-circuits company produces a single specialized product, CX1, a standard, high-performance microchip. It can be used in multiple applications and enjoys a reputation for superior features with flexible design to meet customers’ needs.
23
Strategy Reengineering Balanced Scorecard Engineered & Discretionary Cost
Managing Unused CapacityEvaluating Strategy
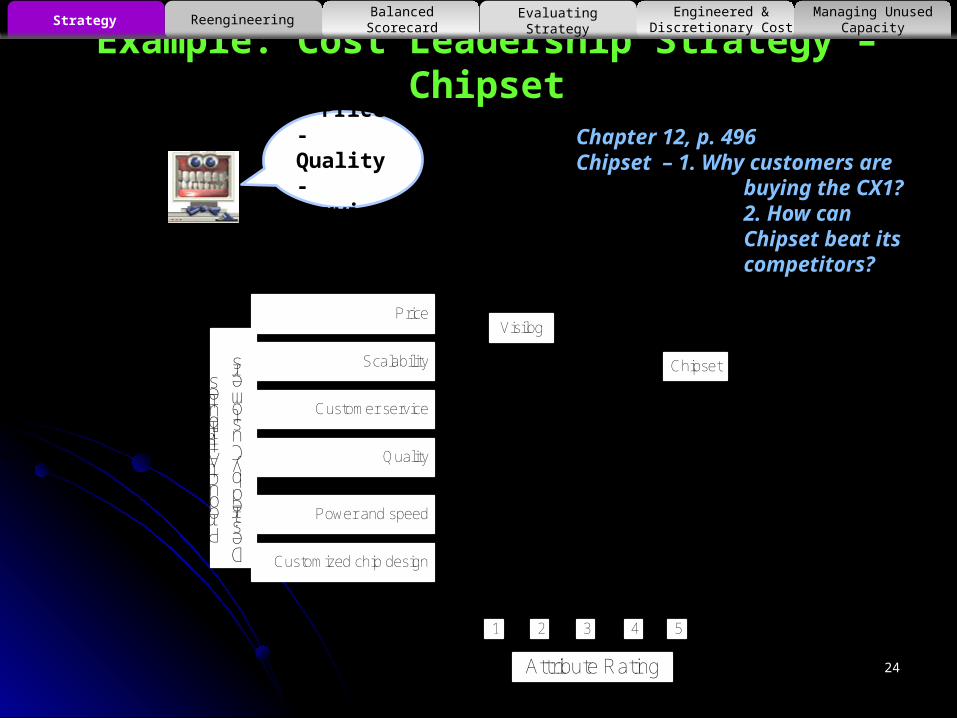
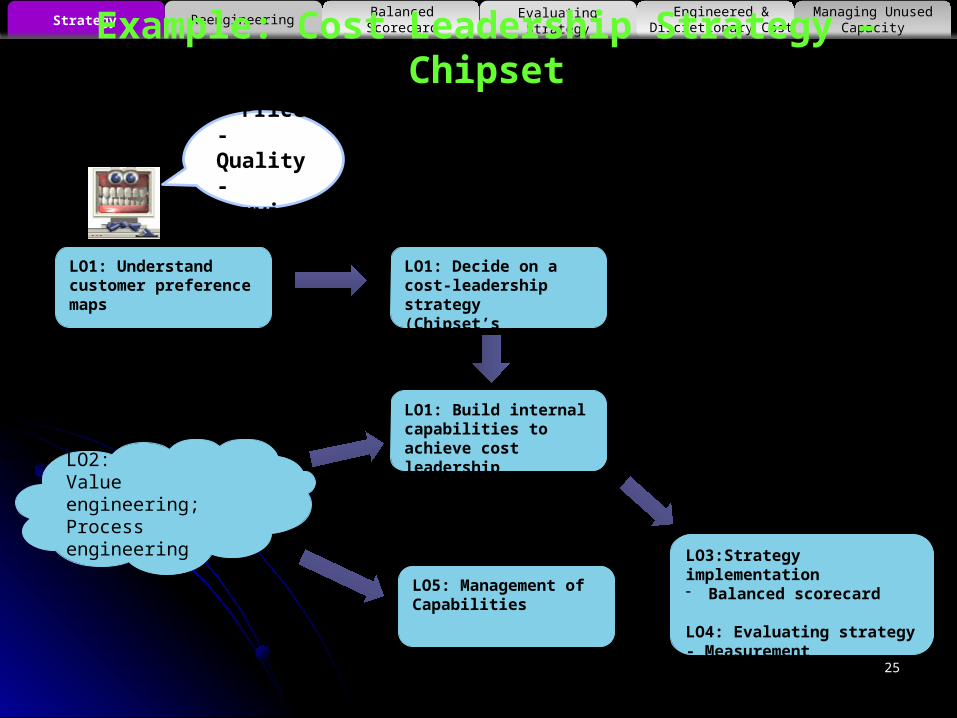
Example: Cost Leadership Strategy – Chipset
24
Example: Cost Leadership Strategy – ChipsetChapter 12, p. 496Chipset – 1. Why customers are
buying the CX1? 2. How can Chipset beat its competitors?
Strategy Reengineering Balanced Scorecard Engineered & Discretionary Cost
Managing Unused CapacityEvaluating Strategy
Attribute Rating
1 2
Customized chip design
53 4
Power and speed
Quality
Customer service
Scalability
Price
Product Attributes
Desired by Customers
Chipset
Visilog
- Price- Quality- Service
25
LO1: Understand customer preference maps
LO1: Decide on a cost-leadership strategy(Chipset’s strategy)
LO1: Build internal capabilities to achieve cost leadership
LO3:Strategy implementation- Balanced scorecard
LO4: Evaluating strategy- Measurement
LO5: Management of Capabilities
LO2: Value engineering;Process engineering
- Price- Quality- Service
Strategy Reengineering Balanced Scorecard Engineered & Discretionary Cost
Managing Unused CapacityEvaluating Strategy
Example: Cost Leadership Strategy – Chipset
2What is Reengineering?
27
© Neale O'Connor 2010
Strategy Reengineering Balanced Scorecard Engineered & Discretionary Cost
Managing Unused CapacityEvaluating Strategy

28
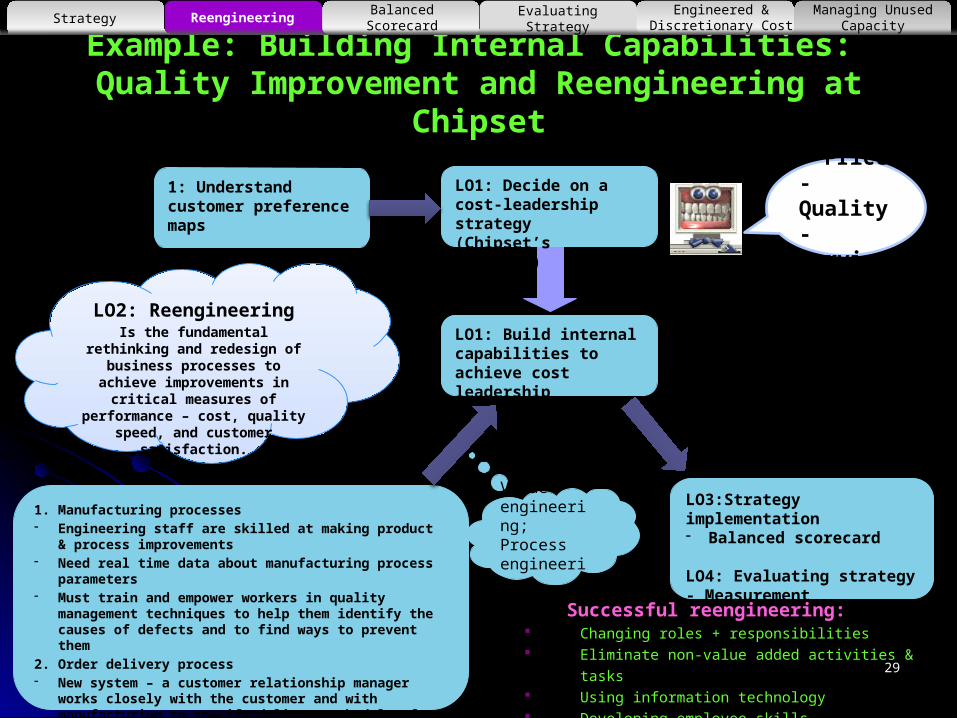
Example: Building Internal Capabilities: Quality Improvement and Reengineering at Chipset
When do we maximize the benefits of reengineering?
When the reengineered process cuts across functional lines.
Successful reengineering: Changing roles + responsibilities Eliminate non-value added activities & tasks Using information technology Developing employee skills Learning objective 2 :
Understand what comprises reengineering… redesigning business processes to improve performance by reducing cost and improving quality
2
Strategy Reengineering Balanced Scorecard Engineered & Discretionary Cost
Managing Unused CapacityEvaluating Strategy
29
1. Manufacturing processes- Engineering staff are skilled at making product & process
improvements- Need real time data about manufacturing process parameters- Must train and empower workers in quality management
techniques to help them identify the causes of defects and to find ways to prevent them
2. Order delivery process- New system – a customer relationship manager works closely
with the customer and with manufacturing to specify delivery schedules for CX1 one month in advance of shipment.
Example: Building Internal Capabilities: Quality Improvement and Reengineering at Chipset
- Price- Quality- Service
LO1: Build internal capabilities to achieve cost leadership
LO3:Strategy implementation- Balanced scorecard
LO4: Evaluating strategy- Measurement
LO1: Decide on a cost-leadership strategy(Chipset’s strategy)
LO2: ReengineeringIs the fundamental rethinking and redesign of business processes to achieve improvements in critical measures of performance – cost,
quality speed, and customer satisfaction.
Strategy Reengineering Balanced Scorecard Engineered & Discretionary Cost
Managing Unused CapacityEvaluating Strategy
Successful reengineering: Changing roles + responsibilities Eliminate non-value added activities & tasks Using information technology Developing employee skills
Value engineering;Process engineering
1: Understand customer preference maps

3What is the Balanced Scorecard?
30
© Neale O'Connor 2010
Strategy Reengineering Balanced Scorecard Engineered & Discretionary Cost
Managing Unused CapacityEvaluating Strategy

What is the Balanced Scorecard?Environment- Government regulations- Securities laws- Financial reporting
Customer- Customer values & needs- Competitor offerings
Learning and Growth– People (Skills, Satisfaction)
- Information system- Organization culture (Norms & Values)
- Highest control over change- Change takes longer = less attention
CustomerProduct/Service attributes,
Relationship, Image- Low control over
change- Change can be fast
= more attention
FinancialRevenue – Costs
- No control
Increasing amount of control over the business model
Increasing amount of attention that is typically given by management
Least attention
Internal Business Process– Innovation, Operations, Customer Service, Regulatory requirements
- Medium control over change- Change can be fast (ie BPR)
© Neale O'Connor 2014
Most attention
31
Strategy Reengineering Balanced Scorecard Engineered & Discretionary Cost
Managing Unused CapacityEvaluating Strategy
Learning objective 3 :Understand the four perspectives of the balanced scorecard…financial, customer, internal business process, learning and growth
3

It is about balancing:
Strategy and operations Measurement of financial and non-financial
indicators Systems thinking – lead and lag indicators
© Neale O'Connor 2014
What is the Balanced Scorecard?
32
Strategy Reengineering Balanced Scorecard Engineered & Discretionary Cost
Managing Unused CapacityEvaluating Strategy

33
SMS GOAL
Strategic objectives
Measures
SystemsThinking
Goal Alignment
On-TimeDecisionMaking
AccurateDecisionMaking
Learning
What is the Balanced Scorecard?
Strategy Reengineering Balanced Scorecard Engineered & Discretionary Cost
Managing Unused CapacityEvaluating Strategy

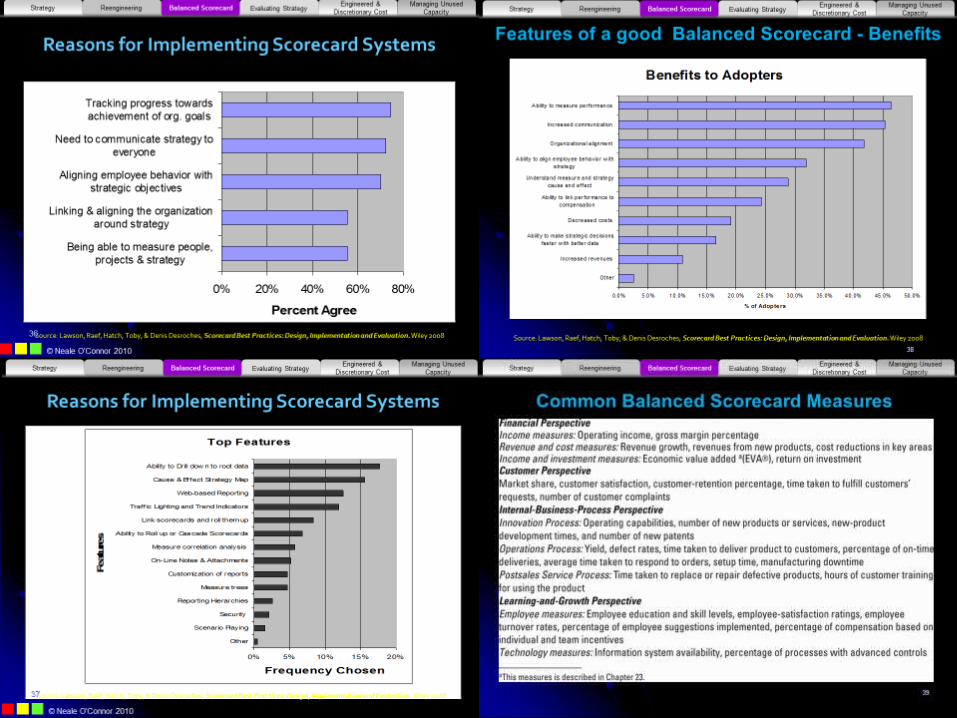
Features of a good Balanced Scorecard - Benefits Linking vision and strategy to employees’ everyday actions
Helps managers to manage the balance between financial and non-financial measures of cause and effect relations in the business system between internal and external perspectives
Setting priorities: This helps organizational participants to understand the priorities – the things that need to be done in order to create the right product or service to deliver value to the customer.
Managing change: The balanced scorecard also helps to manage change by determining the appropriate objectives and performance measures once the SCA and the strategy map of the business has been formulated. This helps organizations to manage change by helping to align participants’ attention, skills and effort towards the processes that matter for delivering value to the customer.
34
Strategy Reengineering Balanced Scorecard Engineered & Discretionary Cost
Managing Unused CapacityEvaluating Strategy
35

40
3.Example: Balanced
scorecard - Chipset (P.501)
Strategy Reengineering Balanced Scorecard Engineered & Discretionary Cost
Managing Unused CapacityEvaluating Strategy
Chipset, a integrated-circuits company produces a single specialized product, CX1, a standard, high-performance microchip. It can be used in multiple applications and enjoys a reputation for superior features with flexible design to meet customers’ needs.
Chipset’s manager implemented the Balance Scorcard approach to further its cost leadership strategy: improve quality and reengineer process.

Customer perspective ( example from CHIPSET INCORP.)
Objectives Measures Initiatives Target perf.
Actual perf.
Increase market share
Market share in market segment
Identify future needs of customers 78% 79.3%
Increase customer satisfaction
No .of new customers
Identify new target-customer segments
1 1
Increase customer satisfaction
Customer-satisfaction ratings
Increase customer focus of sales organization
90% 87%
Strategy Reengineering Balanced Scorecard Engineered & Discretionary Cost
Managing Unused CapacityEvaluating Strategy
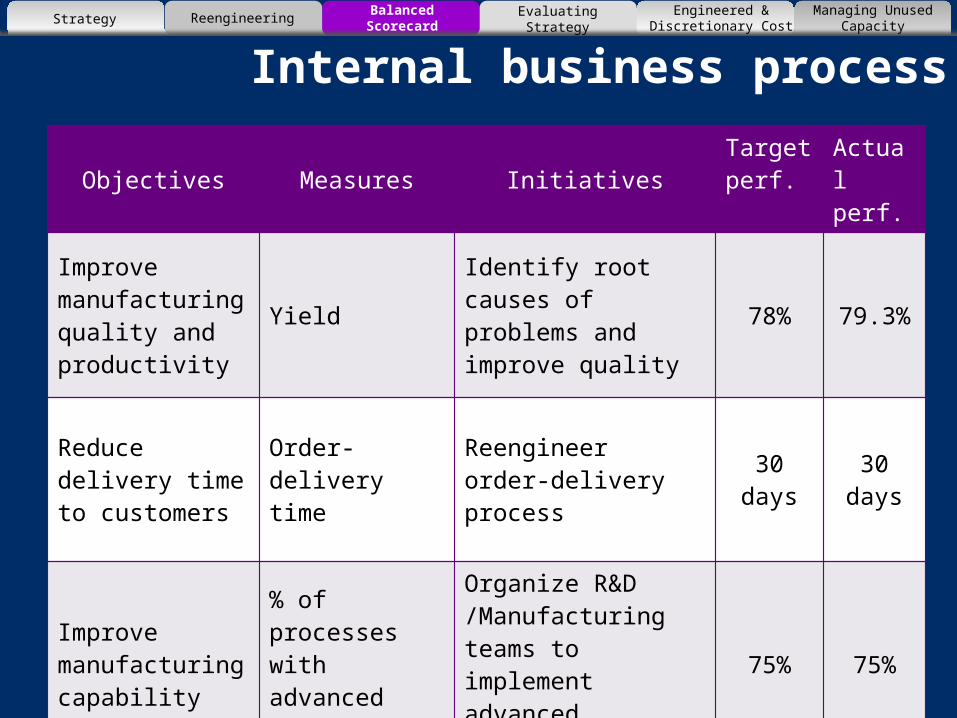
Internal business processObjectives Measures Initiatives Target
perf.Actual perf.
Improve manufacturing quality and productivity
YieldIdentify root causes of problems and improve quality
78% 79.3%
Reduce delivery time to customers
Order-delivery time
Reengineer order-delivery process
30 days
30 days
Improve manufacturing capability
% of processes with advanced controls
Organize R&D /Manufacturing teams to implement advanced controls
75% 75%
Strategy Reengineering Balanced Scorecard Engineered & Discretionary Cost
Managing Unused CapacityEvaluating Strategy

Learning-and-growth perspective
Objectives Measures Initiatives Target perf.
Actual perf.
Empower workforce
% of workers empowered to manage processes
Have supervisors act as coaches rather than decision makers
85% 90%
Align employees & organization goals
Employee-satisfaction ratings
Employees participation and suggestions program to build teamwork
80% 88%
Develop process skills
% of workers trained in process and quality management
Employee training program 90% 92%
Strategy Reengineering Balanced Scorecard Engineered & Discretionary Cost
Managing Unused CapacityEvaluating Strategy
44
Systems Thinking•Visualizing•Strategy Map
Strategy Reengineering Balanced Scorecard Engineered & Discretionary Cost
Managing Unused CapacityEvaluating Strategy
45
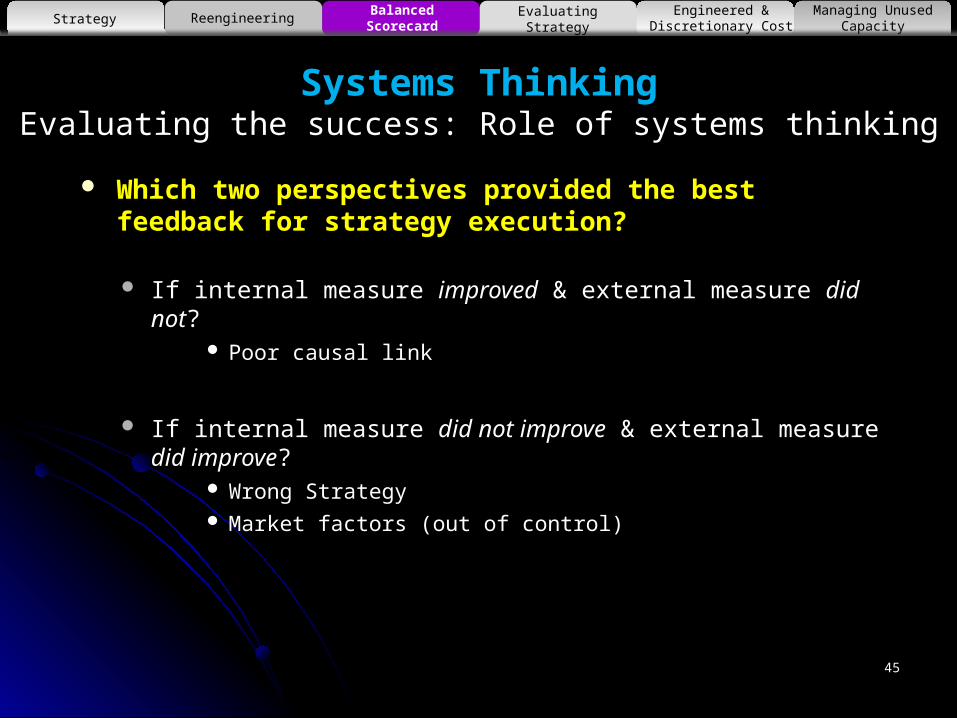
Systems ThinkingEvaluating the success: Role of systems thinking
Which two perspectives provided the best feedback for strategy execution?
If internal measure improved & external measure did not? Poor causal link
If internal measure did not improve & external measure did improve? Wrong Strategy Market factors (out of control)
Strategy Reengineering Balanced Scorecard Engineered & Discretionary Cost
Managing Unused CapacityEvaluating Strategy

46
Systems ThinkingWhat would success look like?
Use strategy map (systems thinking) to link long term success (strategy) to daily operational success
Strategy Reengineering Balanced Scorecard Engineered & Discretionary Cost
Managing Unused CapacityEvaluating Strategy

47
Systems Thinking•Visualizing•Strategy Map•Connecting the Dots
Systems ThinkingStrategy Reengineering Balanced Scorecard Engineered &
Discretionary CostManaging Unused
CapacityEvaluating Strategy

Factors leading to failure of BSCat Philips Lighting
Fishbone diagram
FAILUREUnreliable and
untimely information
No clear link to strategy
Information overload
Strategy Reengineering Balanced Scorecard Engineered & Discretionary Cost
Managing Unused CapacityEvaluating Strategy

49
3. Example: Balanced scorecard - Chipset Strategy Map (P.500)
Strategy Reengineering Balanced Scorecard Engineered & Discretionary Cost
Managing Unused CapacityEvaluating Strategy

50
Systems Thinking
Example: Fast food: map the following process and outcomes T
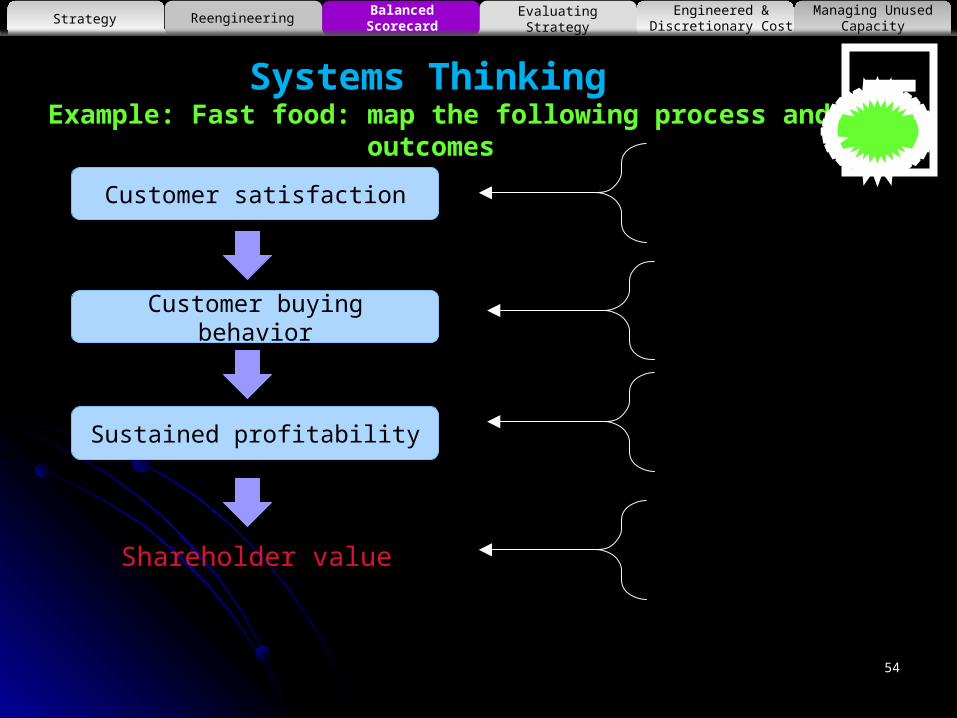
Shareholder value
Strategy Reengineering Balanced Scorecard Engineered & Discretionary Cost
Managing Unused CapacityEvaluating Strategy
Customer buying behavior
Sustained profitability
Employee satisfaction
Employee-added value
Customer satisfaction
Selection and staffing

51
Systems Thinking Example: Fast food: map the following process and outcomes
1.2.3.
1.2.3.
1.2.
TStrategy Reengineering Balanced Scorecard Engineered &
Discretionary CostManaging Unused
CapacityEvaluating Strategy
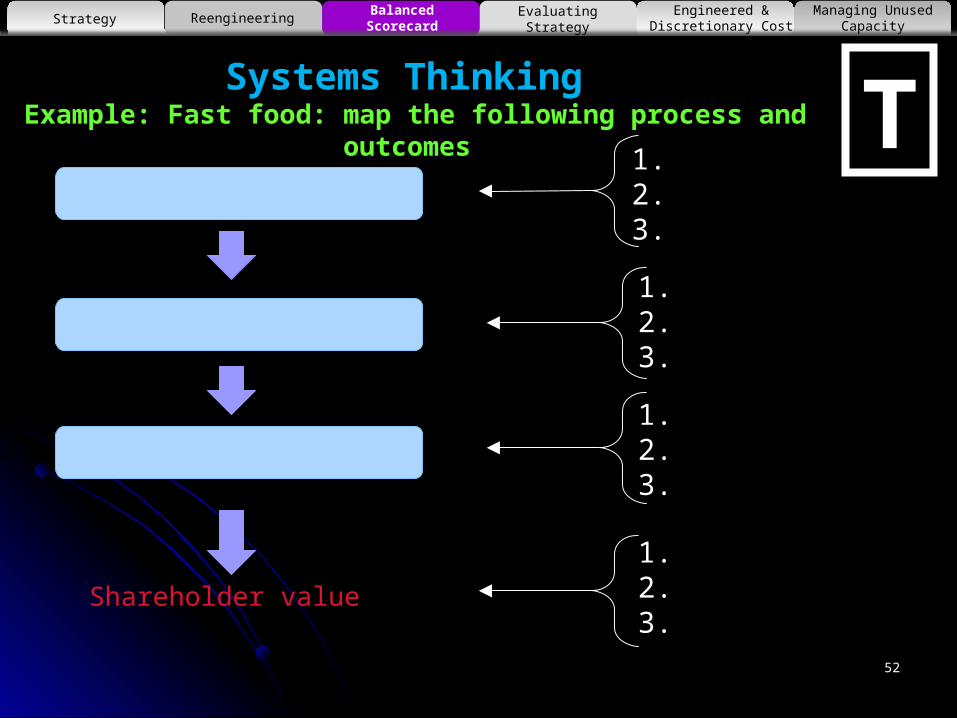
52
Shareholder value
1.2.3.
1.2.3.
1.2.3.
1.2.3.
TSystems Thinking Example: Fast food: map the following process and outcomes
Strategy Reengineering Balanced Scorecard Engineered & Discretionary Cost
Managing Unused CapacityEvaluating Strategy

53
Systems Thinking Example: Fast food: map the following process and outcomes
Strategy Reengineering Balanced Scorecard Engineered & Discretionary Cost
Managing Unused CapacityEvaluating Strategy
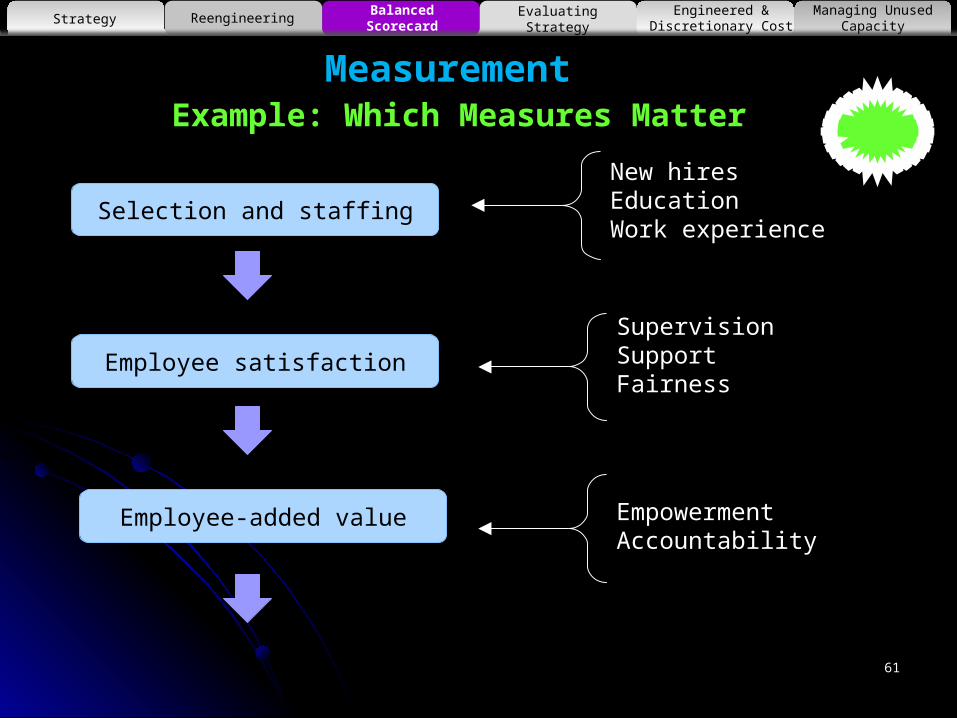
TSelection and staffing
Employee satisfaction
Employee-added value
54
Systems Thinking Example: Fast food: map the following process and outcomes
Strategy Reengineering Balanced Scorecard Engineered & Discretionary Cost
Managing Unused CapacityEvaluating Strategy
TCustomer satisfaction
Customer buying behavior
Sustained profitability
Shareholder value

55
Measurement•Formalizing•Attributes
Strategy Reengineering Balanced Scorecard Engineered & Discretionary Cost
Managing Unused CapacityEvaluating Strategy

Types of Measures / Indicators Key Result Indicators
Customer Satisfaction Profitability/campaign
Performance Indicators % Sales Increase % Campaign Conversion
Key Performance Indicator Availability Delays in delivary Resolution on 1st touch
56
Key Result Indicator
Key Performance
Indicator
Source Key Performance Indicators. D. Pamenter
Strategy Reengineering Balanced Scorecard Engineered & Discretionary Cost
Managing Unused CapacityEvaluating Strategy

57
3.Example: Balanced scorecard - Chipset Strategy Map (P.496)
Strategy Reengineering Balanced Scorecard
Engineered & Discretionary Cost
Managing Unused Capacity
Evaluating Strategy

58
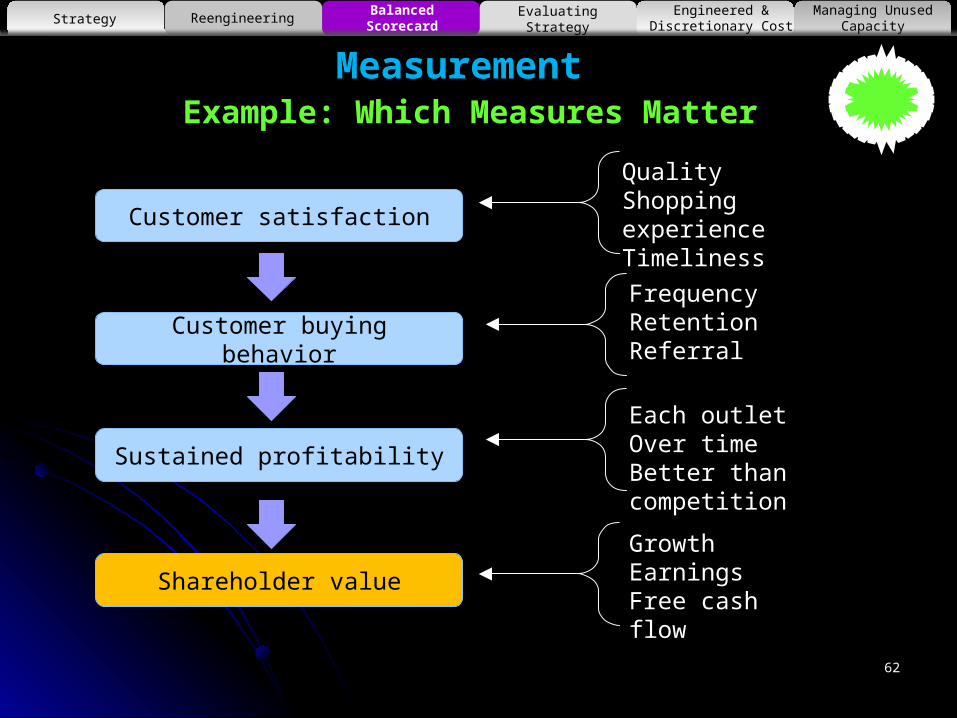
Measurement Example: Which Measures Matter
Strategy Reengineering Balanced Scorecard Engineered & Discretionary Cost
Managing Unused CapacityEvaluating Strategy
Supervision Support Fairness
New hires Education
Work experience
QualityShopping experience
Timeliness
GrowthEarnings
Free cash flow
Each outletOver time
Better than competition
EmpowermentAccountability
FrequencyRetentionReferral

59
Systems Thinking Example: Fast food: map the following process and outcomes
Strategy Reengineering Balanced Scorecard Engineered & Discretionary Cost
Managing Unused CapacityEvaluating Strategy
TSelection and staffing
Employee satisfaction
Employee-added value

60
Systems Thinking Example: Fast food: map the following process and outcomes
Strategy Reengineering Balanced Scorecard Engineered & Discretionary Cost
Managing Unused CapacityEvaluating Strategy
TCustomer satisfaction
Customer buying behavior
Sustained profitability
Shareholder value
New hiresEducationWork experience
SupervisionSupportFairness
EmpowermentAccountability
61
Measurement Example: Which Measures Matter
Strategy Reengineering Balanced Scorecard Engineered & Discretionary Cost
Managing Unused CapacityEvaluating Strategy
Selection and staffing
Employee satisfaction
Employee-added value
QualityShopping experienceTimeliness
FrequencyRetentionReferral
Each outletOver timeBetter than competition
GrowthEarningsFree cash flow
Measurement Example: Which Measures Matter
62
Strategy Reengineering Balanced Scorecard Engineered & Discretionary Cost
Managing Unused CapacityEvaluating Strategy
Customer satisfaction
Customer buying behavior
Sustained profitability
Shareholder value
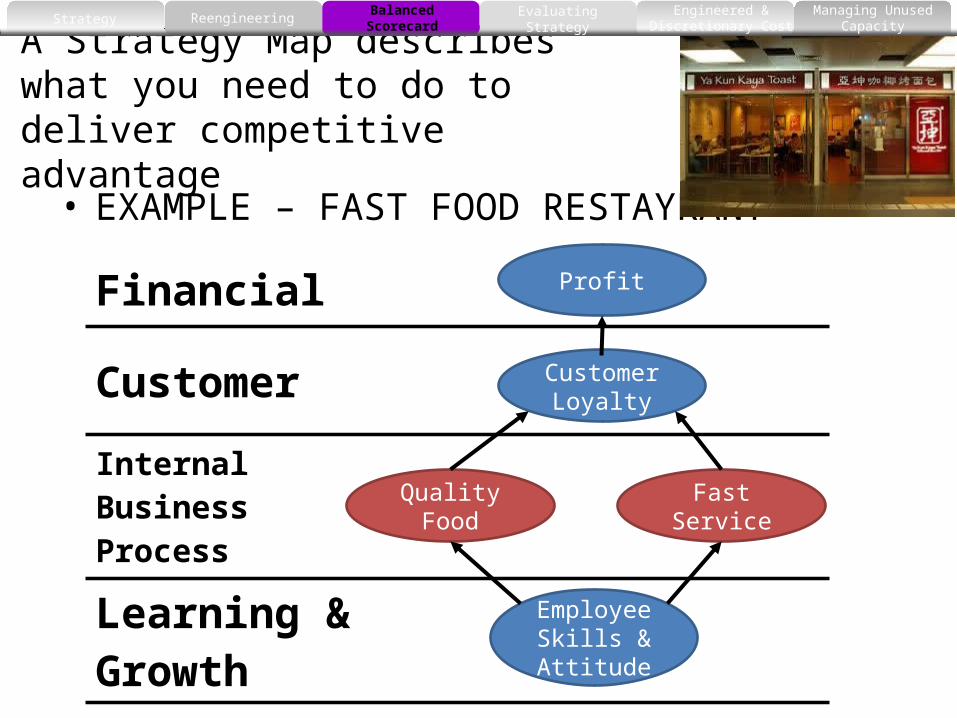
A Strategy Map describes what you need to do to deliver competitive advantage
• EXAMPLE – FAST FOOD RESTAYRANT
Financial
Customer
InternalBusinessProcess
Learning &Growth
Profit
Customer Loyalty
Quality Food
Fast Service
Employee Skills & Attitude
Strategy Reengineering Balanced Scorecard Engineered & Discretionary Cost
Managing Unused CapacityEvaluating Strategy

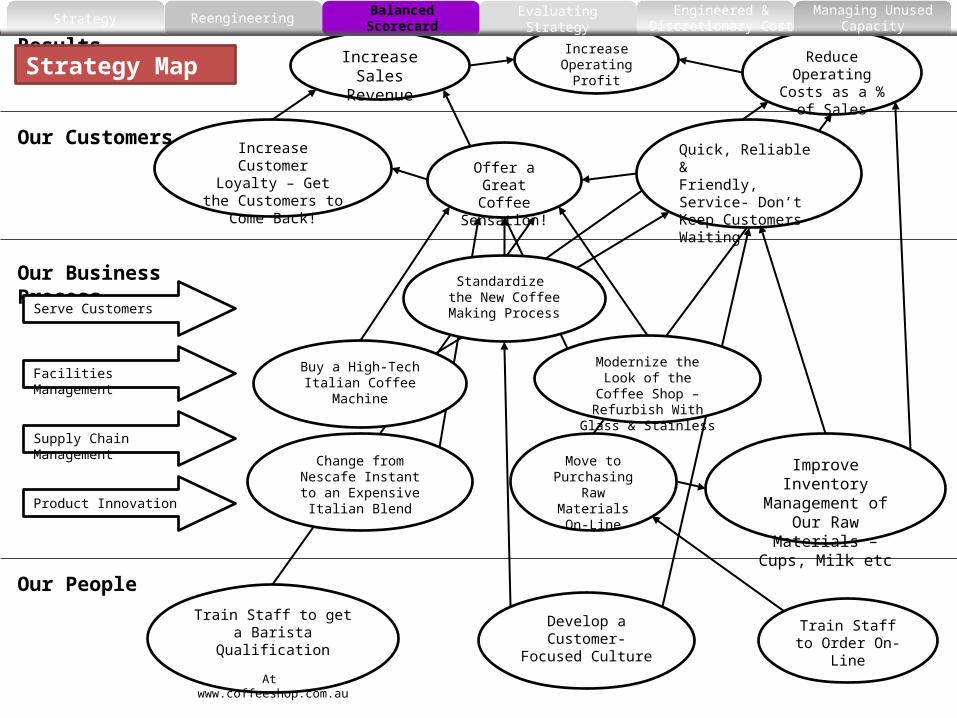
Class ExerciseStrategic Themes (The “Strategies”!)
1. Drive Sales through fantastic coffee2. Improve loyalty by providing a great
customer experience3. Improve margins by being an efficient
business
Format for a Strategic Theme –Desired “Business” Outcome [by the means to achieve it]
Strategy Reengineering Balanced Scorecard Engineered & Discretionary Cost
Managing Unused CapacityEvaluating Strategy

Financial Results
Our Customers
Our Business Process
Our People
Increase Sales Revenue
Increase Operating Profit
Reduce Operating Costs as a % of Sales
Offer a Great Coffee
Sensation!
Increase CustomerLoyalty – Get the
Customers toCome Back!
Quick, Reliable &Friendly, Service- Don’t Keep Customers Waiting
Serve Customers
Facilities Management
Supply Chain Management
Product Innovation
Standardize the New Coffee Making Process
Modernize the Look of the Coffee Shop –
Refurbish With Glass & Stainless
Buy a High-TechItalian Coffee
Machine
Change from Nescafe Instant to an Expensive
Italian Blend
Move to Purchasing Raw
Materials On-Line
Improve Inventory Management of Our
Raw Materials – Cups, Milk etc
Train Staff to get a Barista Qualification
At www.coffeeshop.com.au
Develop a Customer-Focused
Culture
Train Staff to Order On-Line
Strategy Reengineering Balanced Scorecard Engineered & Discretionary Cost
Managing Unused CapacityEvaluating Strategy

Financial Results
Our Customers
Our Business Process
Our People
Increase Operating Profit
Reduce Operating Costs as a % of Sales
Offer a Great Coffee
Sensation!
Increase CustomerLoyalty – Get the
Customers toCome Back!
Quick, Reliable &Friendly, Service- Don’t Keep Customers Waiting
Serve Customers
Facilities Management
Supply Chain Management
Product Innovation
Standardize the New Coffee Making Process
Modernize the Look of the Coffee Shop –
Refurbish With Glass & Stainless
Buy a High-TechItalian Coffee
Machine
Change from Nescafe Instant to an Expensive
Italian Blend
Move to Purchasing Raw
Materials On-Line
Improve Inventory Management of Our
Raw Materials – Cups, Milk etc
Train Staff to get a Barista Qualification
At www.coffeeshop.com.au
Develop a Customer-Focused
Culture
Train Staff to Order On-Line
Theme 1: Drive Sales Through Fantastic Coffee
Increase Sales Revenue
Strategy Reengineering Balanced Scorecard Engineered & Discretionary Cost
Managing Unused CapacityEvaluating Strategy

Financial Results
Our Customers
Our Business Process
Our People
Increase Operating Profit
Reduce Operating Costs as a % of Sales
Offer a Great Coffee
Sensation!
Increase CustomerLoyalty – Get the
Customers toCome Back!
Quick, Reliable &Friendly, Service- Don’t Keep Customers Waiting
Serve Customers
Facilities Management
Supply Chain Management
Product Innovation
Standardize the New Coffee Making Process
Modernize the Look of the Coffee Shop –
Refurbish With Glass & Stainless
Buy a High-TechItalian Coffee
Machine
Change from Nescafe Instant to an Expensive
Italian Blend
Move to Purchasing Raw
Materials On-Line
Improve Inventory Management of Our
Raw Materials – Cups, Milk etc
Train Staff to get a Barista Qualification
At www.coffeeshop.com.au
Develop a Customer-Focused
Culture
Train Staff to Order On-Line
Theme 2: Improve Loyalty by Providing a Great Customer Experience
Increase Sales Revenue
Strategy Reengineering Balanced Scorecard Engineered & Discretionary Cost
Managing Unused CapacityEvaluating Strategy

Financial Results
Our Customers
Our Business Process
Our People
Increase Operating Profit
Reduce Operating Costs as a % of Sales
Offer a Great Coffee
Sensation!
Increase CustomerLoyalty – Get the
Customers toCome Back!
Quick, Reliable &Friendly, Service- Don’t Keep Customers Waiting
Serve Customers
Facilities Management
Supply Chain Management
Product Innovation
Standardize the New Coffee Making Process
Modernize the Look of the Coffee Shop –
Refurbish With Glass & Stainless
Buy a High-TechItalian Coffee
Machine
Change from Nescafe Instant to an Expensive
Italian Blend
Move to Purchasing Raw
Materials On-Line
Improve Inventory Management of Our
Raw Materials – Cups, Milk etc
Train Staff to get a Barista Qualification
At www.coffeeshop.com.au
Develop a Customer-Focused
Culture
Train Staff to Order On-Line
Theme 3: Improve Margins by Being an Efficient Business
Increase Sales Revenue
Strategy Reengineering Balanced Scorecard Engineered & Discretionary Cost
Managing Unused CapacityEvaluating Strategy
Financial Results
Our Customers
Our Business Process
Our People
Increase Sales Revenue
Increase Operating Profit Reduce
Operating Costs as a % of Sales
Offer a Great Coffee
Sensation!
Increase CustomerLoyalty – Get the
Customers toCome Back!
Quick, Reliable &Friendly, Service- Don’t Keep Customers Waiting
Serve Customers
Facilities Management
Supply Chain Management
Product Innovation
Standardize the New Coffee Making Process
Modernize the Look of the Coffee Shop –
Refurbish With Glass & Stainless
Buy a High-TechItalian Coffee
Machine
Change from Nescafe Instant to an Expensive
Italian Blend
Move to Purchasing Raw
Materials On-Line
Improve Inventory Management of Our
Raw Materials – Cups, Milk etc
Train Staff to get a Barista Qualification
At www.coffeeshop.com.au
Develop a Customer-Focused
Culture
Train Staff to Order On-Line
Strategy Map
Strategy Reengineering Balanced Scorecard Engineered & Discretionary Cost
Managing Unused CapacityEvaluating Strategy

Financial Results
Our Customers
Our Business Process
Our People
Increase Sales Revenue
Increase Operating Profit Reduce
Operating Costs as a % of Sales
Offer a Great Coffee
Sensation!
Increase CustomerLoyalty – Get the
Customers toCome Back!
Quick, Reliable &Friendly, Service- Don’t Keep Customers Waiting
Serve Customers
Facilities Management
Supply Chain Management
Product Innovation
Standardize the New Coffee Making Process
Modernize the Look of the Coffee Shop –
Refurbish With Glass & Stainless
Buy a High-TechItalian Coffee
Machine
Change from Nescafe Instant to an Expensive
Italian Blend
Move to Purchasing Raw
Materials On-Line
Improve Inventory Management of Our
Raw Materials – Cups, Milk etc
Train Staff to get a Barista Qualification
At www.coffeeshop.com.au
Develop a Customer-Focused
Culture
Train Staff to Order On-Line
Sales x ProductExpenses/Sales %
Service Quality Index
NOPATNet Operating Profit
After TaxCustomer Satisfaction Survey Result
Sales Repeat Customers/Total Sales %
Non-Conformances to Standardized Coffee
Making Process
Install Italian Coffee Machine (Y/N?)
Cleanliness Index
% Progress Barrista Training
Staff Satisfaction Survey % Staff Trained On-Line Ordering
Number & Type of Stockouts
Refurbishment Project (On Time, On Budget, On
Spec)
% Materials Ordered On-Line
Strategy Reengineering Balanced Scorecard Engineered & Discretionary Cost
Managing Unused CapacityEvaluating Strategy

4Evaluating Strategy
71
© Neale O'Connor 2010
Strategy Reengineering Balanced Scorecard Engineered & Discretionary Cost
Managing Unused CapacityEvaluating Strategy
72
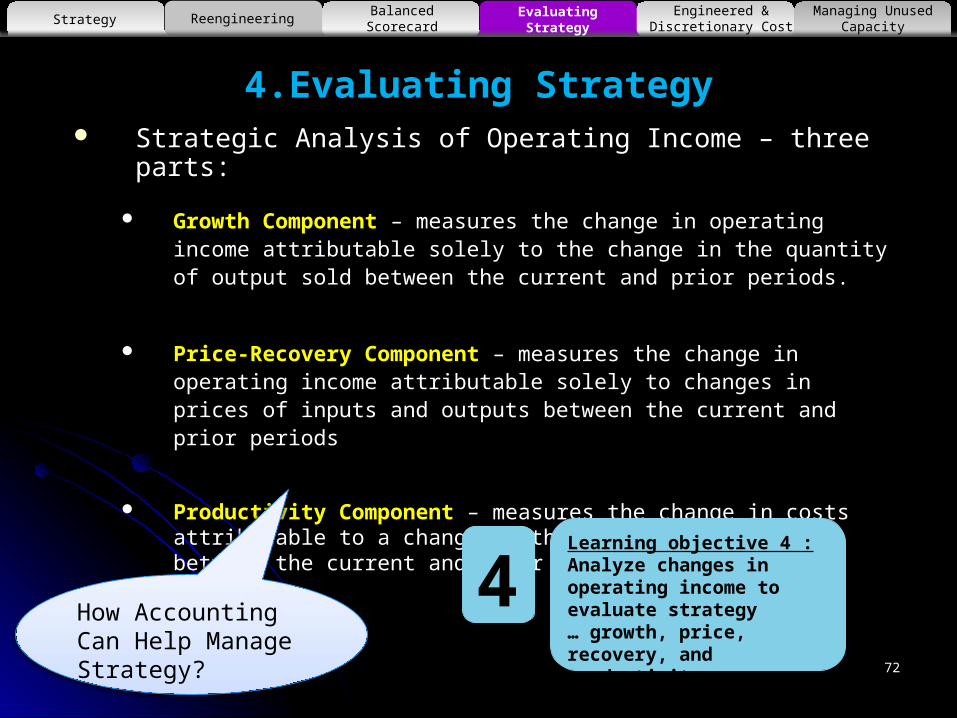
4.Evaluating Strategy Strategic Analysis of Operating Income – three parts:
Growth Component – measures the change in operating income attributable solely to the change in the quantity of output sold between the current and prior periods.
Price-Recovery Component – measures the change in operating income attributable solely to changes in prices of inputs and outputs between the current and prior periods
Productivity Component – measures the change in costs attributable to a change in the quantity of inputs between the current and prior periods
Strategy Reengineering Balanced Scorecard Engineered & Discretionary Cost
Managing Unused CapacityEvaluating Strategy
Learning objective 4 :Analyze changes in operating income to evaluate strategy… growth, price, recovery, and productivity
4How Accounting Can Help Manage Strategy?
73
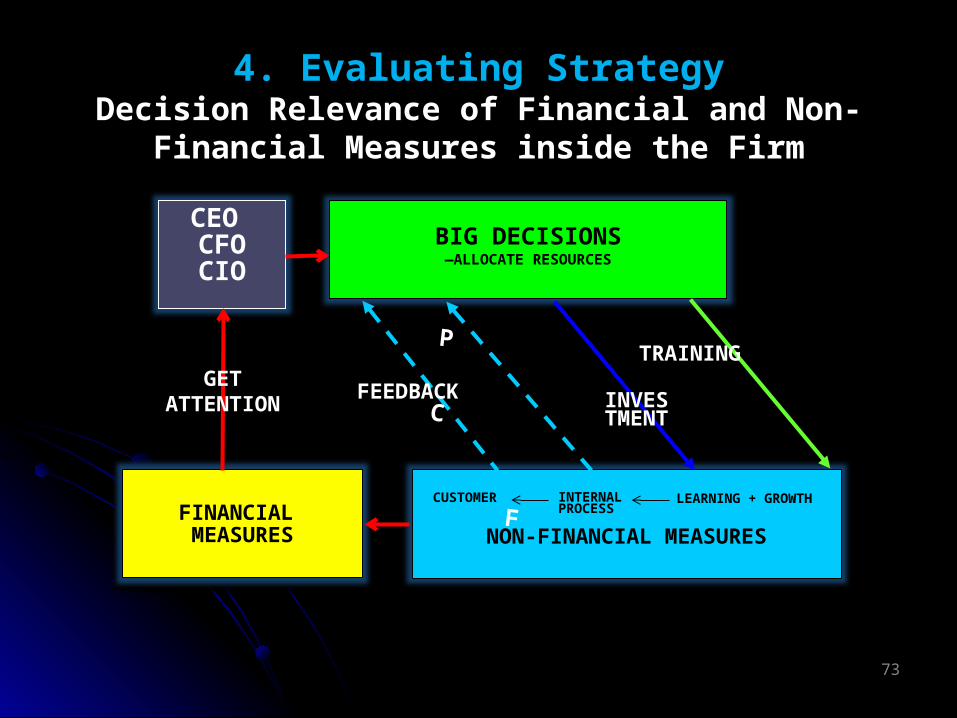
NON-FINANCIAL MEASURES
BIG DECISIONS—ALLOCATE RESOURCES
FEEDBACK
CEO CFOCIO
P C
F
CUSTOMER INTERNAL
PROCESSLEARNING + GROWTH
FINANCIAL MEASURES
TRAININGGET
ATTENTION
4. Evaluating StrategyDecision Relevance of Financial and Non-Financial
Measures inside the Firm
INVESTMENT

74

75
Strategic Analysis of Operating Income
Cost leadership Product differentiation
Growth √ √ Price √ Productivity √
Strategy Reengineering Balanced Scorecard Engineered & Discretionary Cost
Managing Unused CapacityEvaluating Strategy
Other accounting measures to support cost leadership?Manage costs through
Value engineering, Activity based costing, Activity based budgeting
Other measures to support differentiation?Focus on non-financial measures
Lead indicators of long term customer valueMeasures of innovation for long term sustainable differentiation
How Accounting Can Help Manage Strategy?
Example: Strategic Analysis of Operating Income
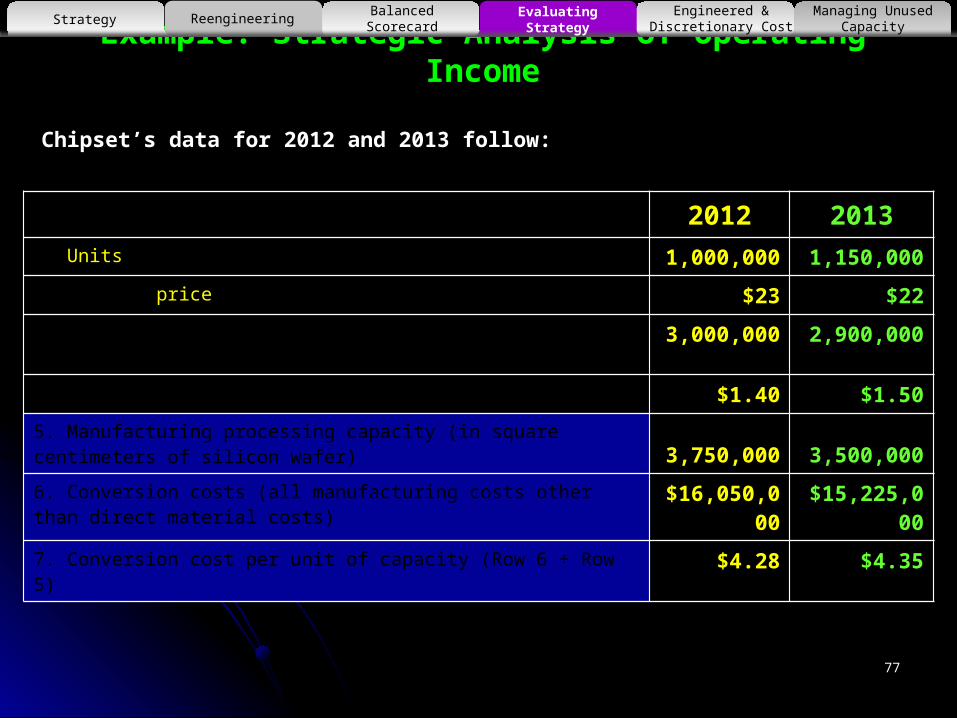
2012 20131. Units of CX1 produced and sold 1,000,000 1,150,0002. Selling price $23 $223. Direct materials (square centimeters of silicon wafers) 3,000,000 2,900,0004. Direct material cost per square centimeter $1.40 $1.505. Manufacturing processing capacity (in square centimeters of silicon wafer) 3,750,000 3,500,0006. Conversion costs (all manufacturing costs other than direct material costs) $16,050,000 $15,225,0007. Conversion cost per unit of capacity (Row 6 ÷ Row 5) $4.28 $4.35
Chipset’s data for 2012 and 2013 follow:
77
Strategy Reengineering Balanced Scorecard Engineered & Discretionary Cost
Managing Unused CapacityEvaluating Strategy
Example: Strategic Analysis of Operating Income
2012 2013
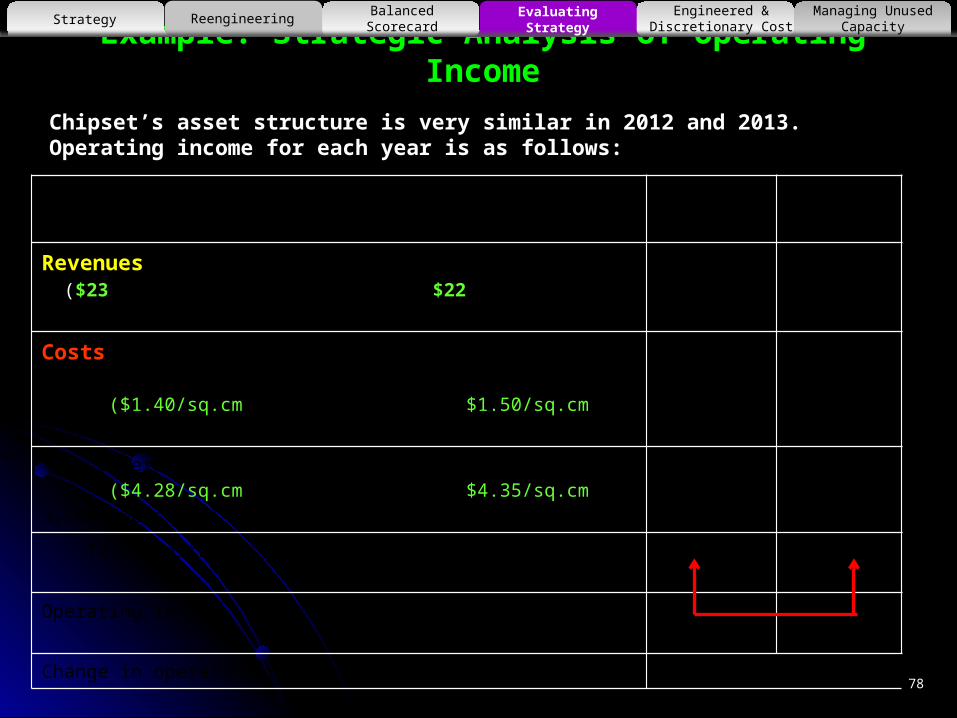
Revenues ($23 per unit x 1,000,000 units; $22per unit x 1,150,000 units) $23,000,000 $25,300,000Costs Direct material costs ($1.40/sq.cm x 3,000,000 sq.cm; $1.50/sq.cm x 2,900,000 sq.cm)
4,200,000 4,350,000 Conversion costs ($4.28/sq.cm x 3,750,000 sq.cm; $4.35/sq.cm x 3,500,000 sq.cm)
16,050,000 15,225,000 Total costs 20,250,000 19,575,000Operating income $2,750,000 $5,725,000Change in operating income $2,975,000 F
Chipset’s asset structure is very similar in 2012 and 2013. Operating income for each year is as follows:
78
Strategy Reengineering Balanced Scorecard Engineered & Discretionary Cost
Managing Unused CapacityEvaluating Strategy

79
Example: Strategic
Analysis of Operating
Income
Basic Data for Growth
80
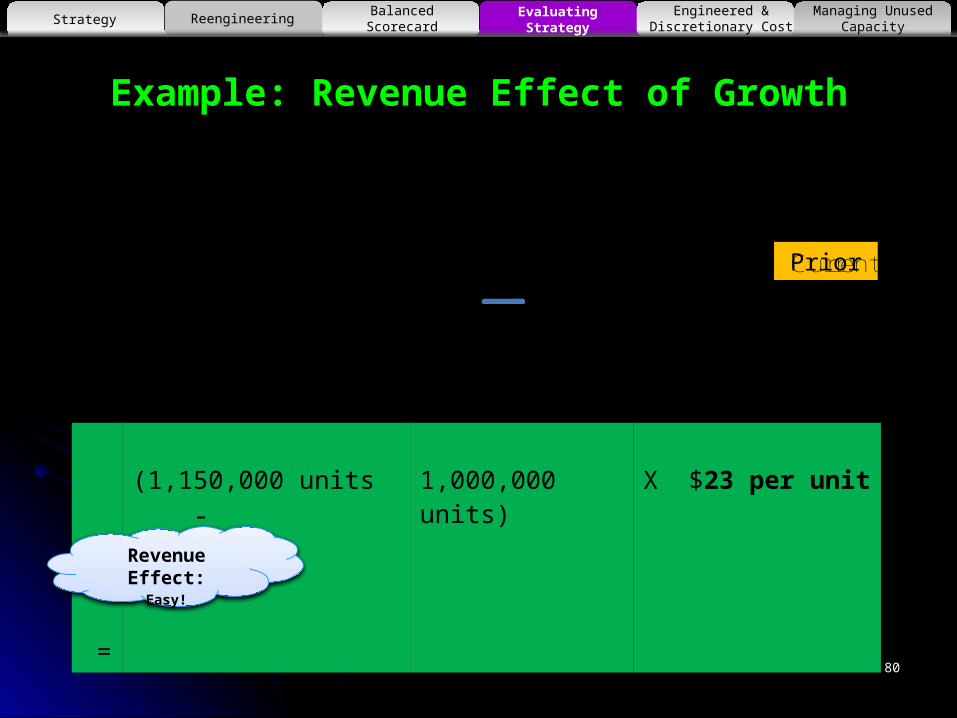
Example: Revenue Effect of Growth
Actual Units of Output Sold in
the Prior Period
Actual Units of Output Sold in the Current Period
XCurrentPeriodSellingPrice
RevenueEffect
OfGrowth
=
=
(1,150,000 units - 1,000,000 units) X $23 per unit
Strategy Reengineering Balanced Scorecard Engineered & Discretionary Cost
Managing Unused CapacityEvaluating Strategy
Revenue Effect:Easy!
Prior

81
Example: Cost Effect of Growth for Variable Costs
Actual Units of Input used to produce
Prior Period Output
Units of Input required to produce Current Output in the Prior Period
XCurrentPeriodInputPrice
CostEffect
OfGrowth
For Variable
Costs
=
Cost effect of growth for direct materials
= (3,000,000 sq.cm. x
1,150,000 units
- 3,000,000 sq.cm.) X $1.40 per sq.cm.
1,000,000 units
= (3,450,000sq.cm. -
3,000,000 sq.cm.) X $1.40 per sq.cm. = $630,000 U
Strategy Reengineering Balanced Scorecard Engineered & Discretionary Cost
Managing Unused CapacityEvaluating Strategy
Cost Effect:Keeping productivity constant – what should DM cost you in the
second period?
Prior
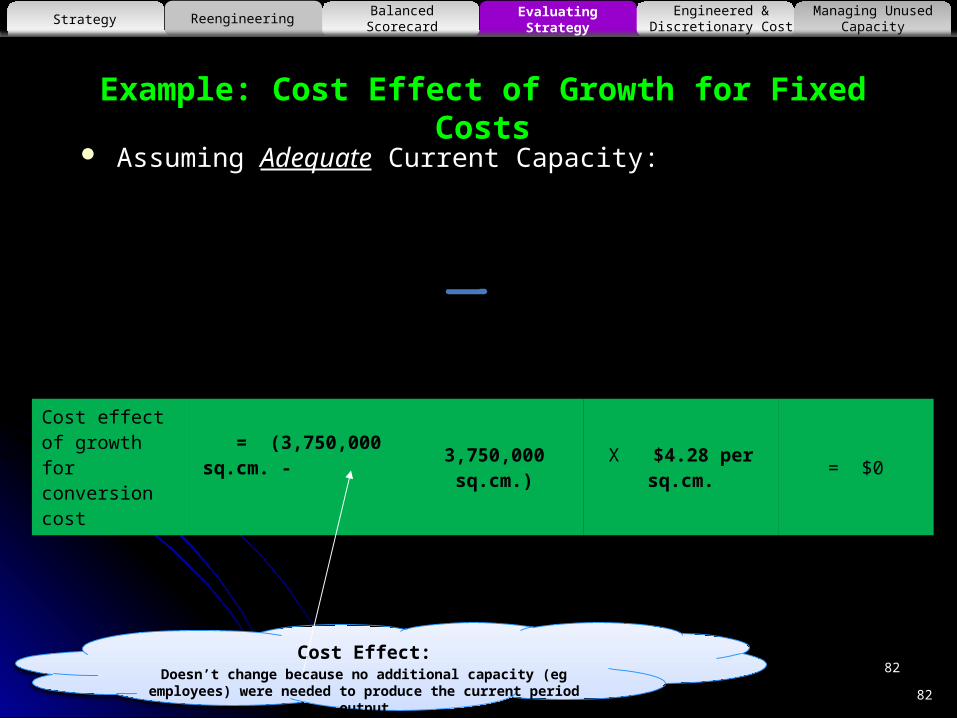
Example: Cost Effect of Growth for Fixed Costs
Assuming Adequate Current Capacity:
Actual Units of Capacity
in the Prior
Period
Actual Units of capacity in Prior Period to Produce Current Period Output
X
Prior Period Price
per unit of
capacity
CostEffect
OfGrowth
For FixedCosts
=
Cost effect of growth for conversion cost
= (3,750,000 sq.cm. - 3,750,000 sq.cm.) X $4.28 per sq.cm. = $0
Strategy Reengineering Balanced Scorecard Engineered & Discretionary Cost
Managing Unused CapacityEvaluating Strategy
82
82Cost Effect:
Doesn’t change because no additional capacity (eg employees) were needed to produce the current period output

83
Example: Cost Effect of Growth for Fixed Costs
Assuming Inadequate Current Capacity:
Actual Units
of Capacity in the Prior
Period
Units of Capacity required to produce Current Period Output in the Prior Period
X
Prior Period Price
per unit of
capacity
CostEffect
OfGrowth
For FixedCosts
=
Strategy Reengineering Balanced Scorecard Engineered & Discretionary Cost
Managing Unused CapacityEvaluating Strategy
Inadequate Capacity Effect:Fixed Costs don’t change because no additional capacity (eg employees) were needed to produce the current period output

84
Example: Strategic
Analysis of Operating
Income
Basic Data for
Price
85
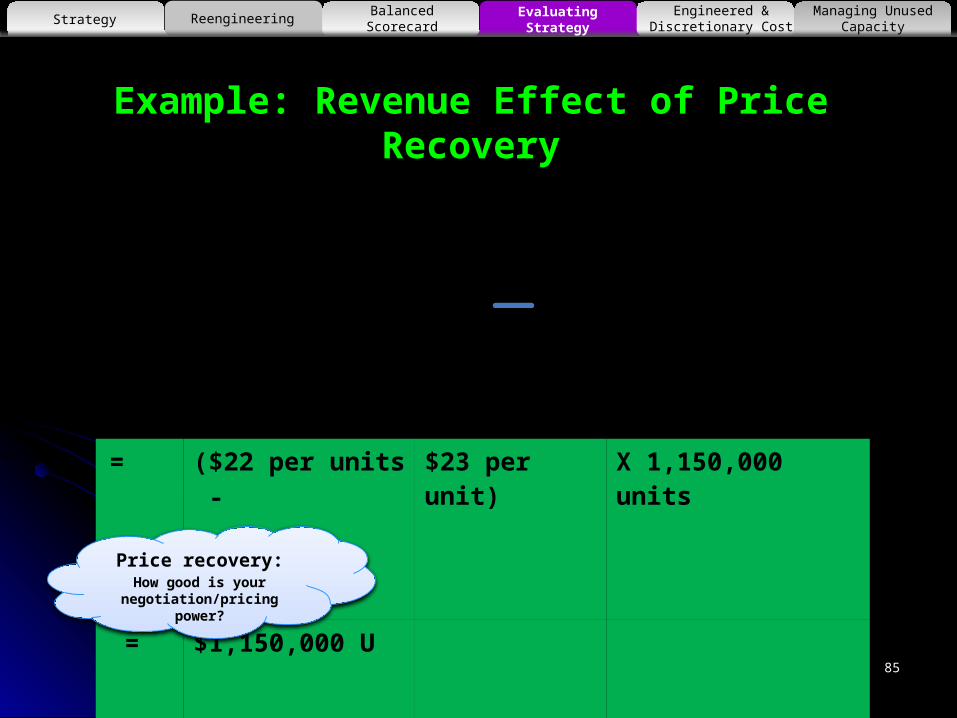
Example: Revenue Effect of Price Recovery
Prior Period Selling Price
Current Period Selling Price X
CurrentPeriod Units Sold
RevenueEffect
OfPrice-
Recovery
=
=
($22 per units - $23 per unit) X 1,150,000 units
=
$1,150,000 U
Strategy Reengineering Balanced Scorecard Engineered & Discretionary Cost
Managing Unused CapacityEvaluating Strategy
Price recovery:How good is your
negotiation/pricing power?

86
Example: Cost Effect of Price Recovery Variable Costs:
Prior Period Input Price
Current Period Input Price X
Units of Input
required to produce Current Period’s Output in the Prior Period
CostEffect
OfPrice-
Recovery for
Variable Costs
=
Cost effect of price recovery for direct materials
= ($1.50 per sq.cm. - $1.40 per sq.cm.) X 3,450,000 sq. = $345,000U
Strategy Reengineering Balanced Scorecard Engineered & Discretionary Cost
Managing Unused CapacityEvaluating Strategy
Price recovery:How good is your negotiation/pricing power?
This is the unit price effect due to increase in unit costs?
87
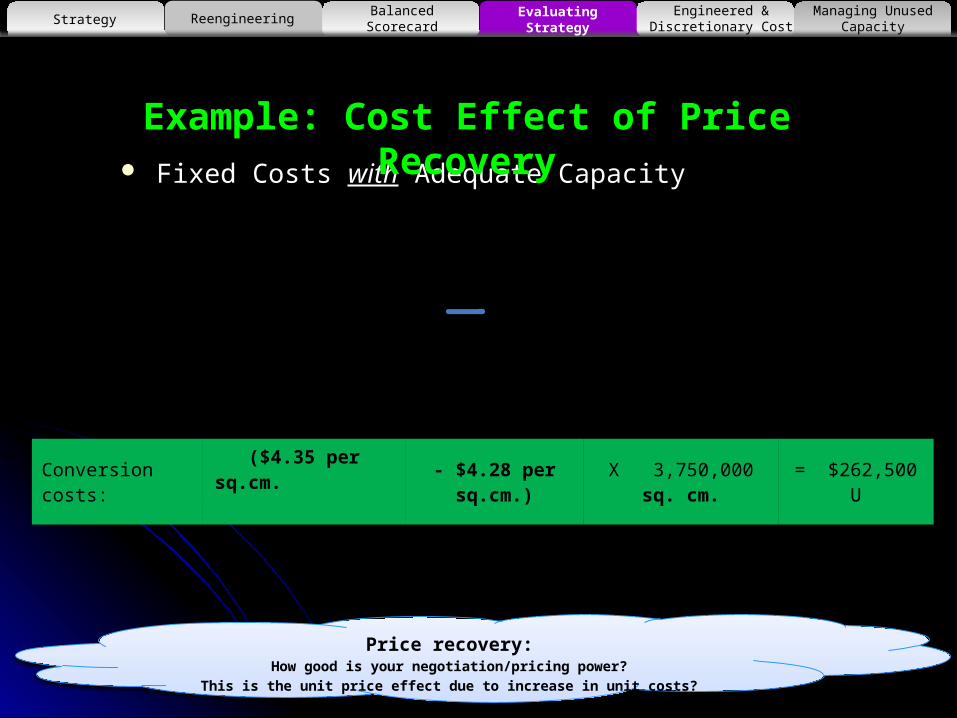
Fixed Costs with Adequate Capacity
Prior Period Price per Unit
of Capacity
Current Period Price per Unit of Capacity
X
Actual Units of Capacity on
Prior Period to Produce Current
Period’s Output
CostEffect
OfPrice-
Recovery for Fixed
Costs
=
Example: Cost Effect of Price Recovery
Conversion costs: ($4.35 per sq.cm.
- $4.28 per sq.cm.)
X 3,750,000 sq. cm. = $262,500 U
Strategy Reengineering Balanced Scorecard Engineered & Discretionary Cost
Managing Unused CapacityEvaluating Strategy
Price recovery:How good is your negotiation/pricing power?
This is the unit price effect due to increase in unit costs?

88
Fixed Costs without Adequate Capacity
Prior Period Price per Unit
of Capacity
Current Period Price per Unit of Capacity
X
Units of Capacity
Required to Produce Current Period’s Output
in the Prior Period
CostEffect
OfPrice-
Recovery for Fixed
Costs
=
Example: Cost Effect of Price Recovery
Strategy Reengineering Balanced Scorecard Engineered & Discretionary Cost
Managing Unused CapacityEvaluating Strategy

89
Example: Strategic
Analysis of Operating
Income
Basic Data for
Producti-vity

90
Example: Cost Effect of Productivity for Variable Costs
Units of Input Required to
Produce Current Period’s Output
in Prior Period
Actual Units of Input used to Produce Current Period Output
X Input Price in Current Period
CostEffect
OfProductivity for Variable
Costs
=
Cost effect of productivity of direct materials
= (2,900,000 sq.cm. - 3,450,000 sq.cm.) X $1.50 per sq.cm.
= 550,000 sq.cm. x $1.50 per sq.cm. = $825,000 F
Strategy Reengineering Balanced Scorecard Engineered & Discretionary Cost
Managing Unused CapacityEvaluating Strategy
Efficiency:How good is your
production process?

91
Example: Cost Effect of Productivity for Fixed Costs With Adequate Capacity
Actual Units of Capacity in Prior
Period to Produce Current Period’s Output
Actual Units of Capacity in Current Period
XPrice Per Unit of
Capacity in Current Period
CostEffect
OfProductivity
for Fixed Costs
=
Conversion costs: (3,500,000 sq.cm. - 3,750,000sq.cm.) X $4.35 per sq.
cm. = $1,087,500 F
Strategy Reengineering Balanced Scorecard Engineered & Discretionary Cost
Managing Unused CapacityEvaluating Strategy
Efficiency:How efficient is your
capacity?

92
Example: Cost Effect of Productivity for Fixed Costs
Without Adequate Capacity
Units of Capacity Required to
Produce Current Period’s Output in
the Prior Period
Actual Units of Capacity in Current Period
XPrice Per Unit of
Capacity in Current Period
CostEffect
OfProductivity
for Fixed Costs
=
Strategy Reengineering Balanced Scorecard Engineered & Discretionary Cost
Managing Unused CapacityEvaluating Strategy
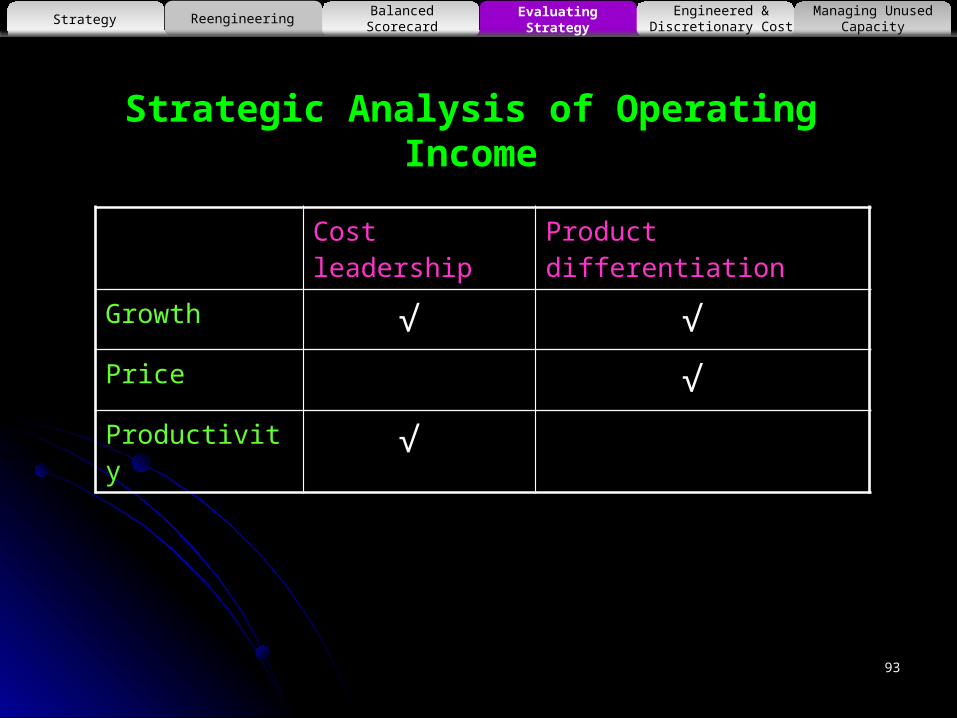
93
Strategic Analysis of Operating Income
Cost leadership Product differentiation
Growth √ √ Price √ Productivity √
Strategy Reengineering Balanced Scorecard Engineered & Discretionary Cost
Managing Unused CapacityEvaluating Strategy

94
Example: Strategic Analysis of Profitability - Chipset
Strategy Reengineering Balanced Scorecard Engineered & Discretionary Cost
Managing Unused CapacityEvaluating Strategy
Strategy Reengineering Balanced Scorecard Engineered & Discretionary Cost
Managing Unused CapacityEvaluating Strategy
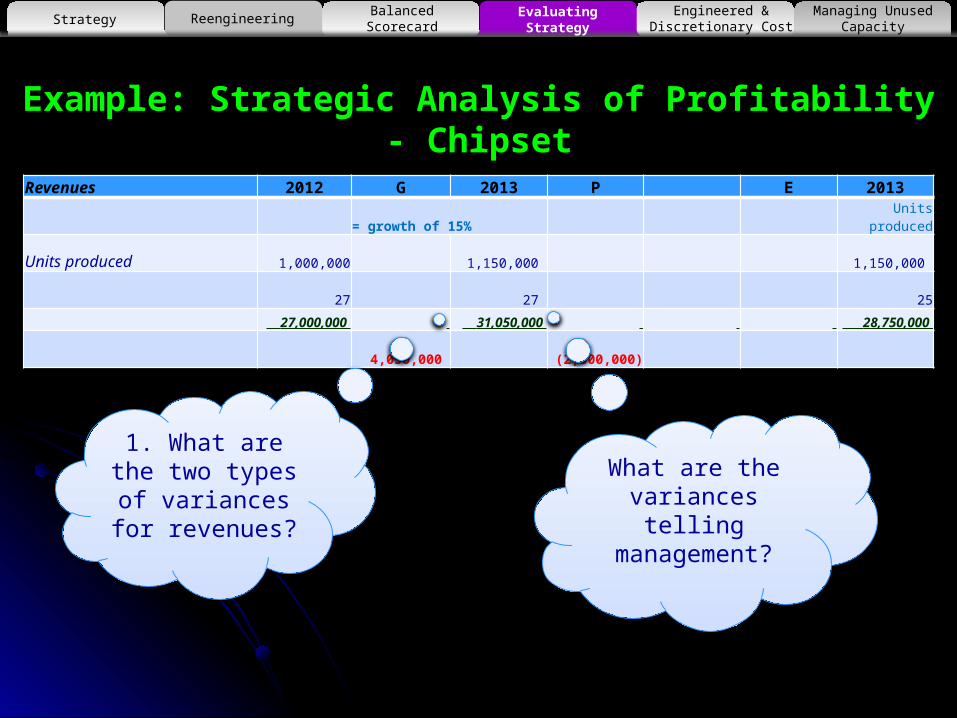
Example: Strategic Analysis of Profitability - Chipset
Revenues 2012 G 2013 P E 2013= growth of 15% Units produced
Units produced 1,000,000 1,150,000 1,150,000 27 27 25
27,000,000 31,050,000 28,750,000 4,050,000 (2,300,000)
1. What are the two types of variances for revenues?
What are the variances telling management?

Strategy Reengineering Balanced Scorecard Engineered & Discretionary Cost
Managing Unused CapacityEvaluating Strategy
Example: Strategic Analysis of Profitability - Chipset
Costs 2012 G 2013 P E 2013 For growth of 15% should have req 3450000 sq cm
Actual
Materials costs 3,000,000 3,450,000 3,450,000 2,900,000
1.40 1.40 1.50 1.50
4,200,000 4,830,000 5,175,000 4,350,000
630,000 345,000 (825,000)
1. What are the two types of variances for
ordinary standard costing analysis?
2. Where does the third variance come
from?
Growth Price Productivity

Strategy Reengineering Balanced Scorecard Engineered & Discretionary Cost
Managing Unused CapacityEvaluating Strategy
Example: Strategic Analysis of Profitability - ChipsetCosts 2012 G 2013 P E 2013
Actual units of capacity in prior period to produce current periods output Fixed Conversion costs 3,750,000 3,750,000 3,750,000 3,500,000
Processing capacity -
4.28 4.28
4.35
4.35 sq cm of silicon wafer 16,050,000 16,050,000 16,312,500 15,225,000
- 262,500 (1,087,500) Actual units of capacity in prior period to produce current periods output
R & D Costs 40 40 40 39 Employees 100,000 100,000 100,000 100,000
4,000,000 4,000,000 4,000,000 3,900,000 - - (100,000)
24,250,000 24,880,000 25,487,500 23,475,000 630,000 607,500 (2,012,500)
Growth Price Productivity
1. What are the two types of variances for
ordinary standard costing analysis?
2. Where does the third variance come
from?

Strategy Reengineering Balanced Scorecard Engineered & Discretionary Cost
Managing Unused CapacityEvaluating Strategy
Example: Strategic Analysis of Profitability - ChipsetRevenues 2012 G 2013 P E 2013
= growth of 15% Units producedUnits produced 1,000,000 1,150,000 1,150,000
27 27 25 27,000,000 31,050,000 28,750,000
4,050,000 (2,300,000)Costs 2012 G 2013 P E 2013
For growth of 15% should have req 3450000 sq cm
Actual
Materials costs 3,000,000 3,450,000 3,450,000 2,900,000
1.40 1.40 1.50 1.50
4,200,000 4,830,000 5,175,000 4,350,000
630,000 345,000 (825,000) Actual units of capacity in prior period to produce current periods output
Fixed Conversion costs 3,750,000 3,750,000 3,750,000 3,500,000
Processing capacity -
4.28 4.28
4.35
4.35 sq cm of silicon wafer 16,050,000 16,050,000 16,312,500 15,225,000
- 262,500 (1,087,500) Actual units of capacity in prior period to produce current periods output
R & D Costs 40 40 40 39 Employees 100,000 100,000 100,000 100,000
4,000,000 4,000,000 4,000,000 3,900,000 - - (100,000)
24,250,000 24,880,000 25,487,500 23,475,000 630,000 607,500 (2,012,500)

Revenues 2012 G 2013 P E 2013= growth of 15% Units produced
Units produced 1,000,000 1,150,000 1,150,000 27 27 25
27,000,000 31,050,000 28,750,000 4,050,000 (2,300,000)
Costs 2012 G 2013 P E 2013 For growth of 15% should have req 3450000 sq cm Actual
Materials costs 3,000,000 3,450,000 3,450,000 2,900,000
1.40 1.40 1.50 1.50
4,200,000 4,830,000 5,175,000 4,350,000
630,000 345,000 (825,000) Actual units of capacity in prior period to produce current periods output
Fixed Conversion costs 3,750,000 3,750,000 3,750,000 3,500,000
Processing capacity -
4.28 4.28
4.35
4.35 sq cm of silicon wafer 16,050,000 16,050,000 16,312,500 15,225,000
- 262,500 (1,087,500) Actual units of capacity in prior period to produce current periods output
R & D Costs 40 40 40 39 Employees 100,000 100,000 100,000 100,000
4,000,000 4,000,000 4,000,000 3,900,000 - - (100,000)
24,250,000 24,880,000 25,487,500 23,475,000 630,000 607,500 (2,012,500)
Strategy Reengineering Balanced Scorecard Engineered & Discretionary Cost
Managing Unused CapacityEvaluating Strategy
Example: Strategic Analysis of Profitability - Chipset
5Analysis of Unused Capacity
100
© Neale O'Connor 2010
Strategy Reengineering Balanced Scorecard Engineered & Discretionary Cost
Managing Unused CapacityEvaluating Strategy

101
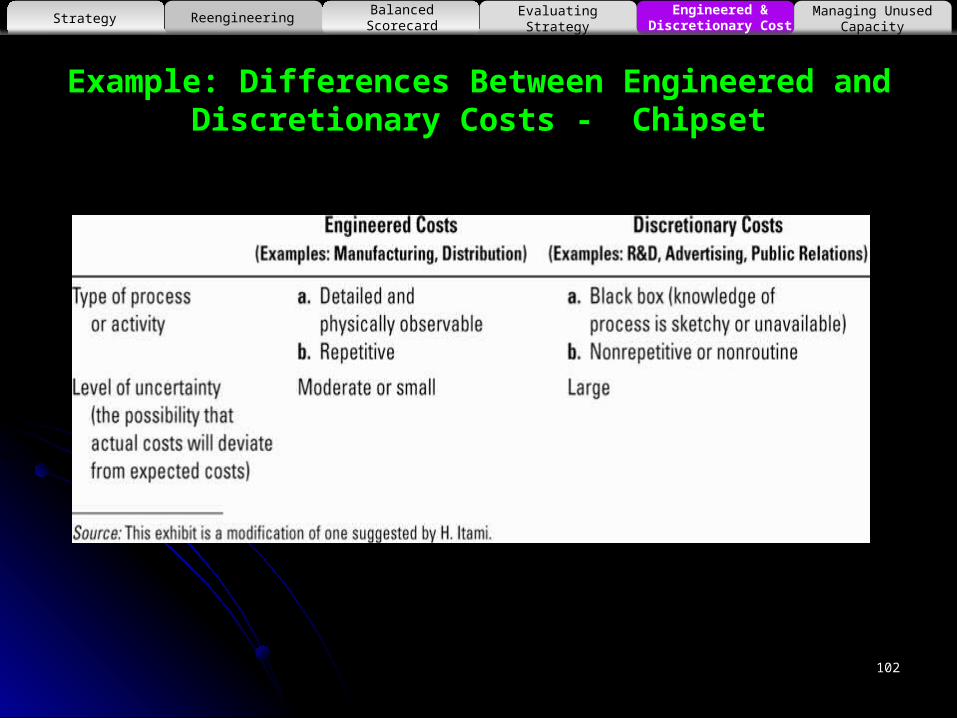
5. Analysis of Unused Capacity Two Important Features:
1. Engineered Costs result from a cause-and-effect relationship between the cost driver and the resources used to produce that output
2. Discretionary Costs have two parts:1. They arise from periodic (annual) decisions regarding the maximum
amount to be incurred
2. They have no measurable cause-and-effect relationship between output and resources used
Strategy Reengineering Balanced Scorecard Engineered & Discretionary Cost
Managing Unused CapacityEvaluating Strategy
Learning objective 5 :Distinguish engineered costs… a cause-and-effect relationship exists between output produced and costs incurred
from discretionary costs… no cause-and-effect relationship exists between outputProduced and costs incurred
5
102
Example: Differences Between Engineered and Discretionary Costs - Chipset
Strategy Reengineering Balanced Scorecard Engineered & Discretionary Cost
Managing Unused CapacityEvaluating Strategy

6Managing Unused Capacity
103
© Neale O'Connor 2010
Strategy Reengineering Balanced Scorecard Engineered & Discretionary Cost
Managing Unused CapacityEvaluating Strategy

104
Managing Unused Capacity
Managers can reduce capacity-based fixed costs by measuring and managing unused capacity
Unused Capacity is the amount of productive capacity available over and above the productive capacity employed to meet consumer demand in the current period
Strategy Reengineering Balanced Scorecard Engineered & Discretionary Cost
Managing Unused CapacityEvaluating Strategy
Learning objective 6 :Identify unused capacity… capacity available minus capacity used
and how to manage it…downsize to reduce capacity
6

105
Example: Differences Between Engineered and Discretionary Costs - Chipset
Strategy Reengineering Balanced Scorecard Engineered & Discretionary Cost
Managing Unused CapacityEvaluating Strategy

106
Managing Unused Capacity
Downsizing (Rightsizing) is an integrated approach of configuring
processes, products, and people to match costs to the activities that
need to be performed to operate effectively and efficiently in the present
and future
Strategy Reengineering Balanced Scorecard Engineered & Discretionary Cost
Managing Unused CapacityEvaluating Strategy

107
Summary
Strategy Learning objective 1: Recognize which of two generic strategies a company is using
Reengineering Learning objective 2: Understand what comprises reengineering
Balanced Scorecard Learning objective 3: Understand the four perspectives of the balanced scorecard
Evaluating Strategy Learning objective 4: Analyze changes in operating income to evaluate strategy
Engineered & Discretionary Cost Learning objective 5: Distinguish engineered costs from discretionary costs
Managing Unused Capacity Learning objective 6: Identify unused capacity and how to manage it
Strategy Reengineering Balanced Scorecard Engineered & Discretionary Cost
Managing Unused CapacityEvaluating Strategy

APPENDIX
108
109109
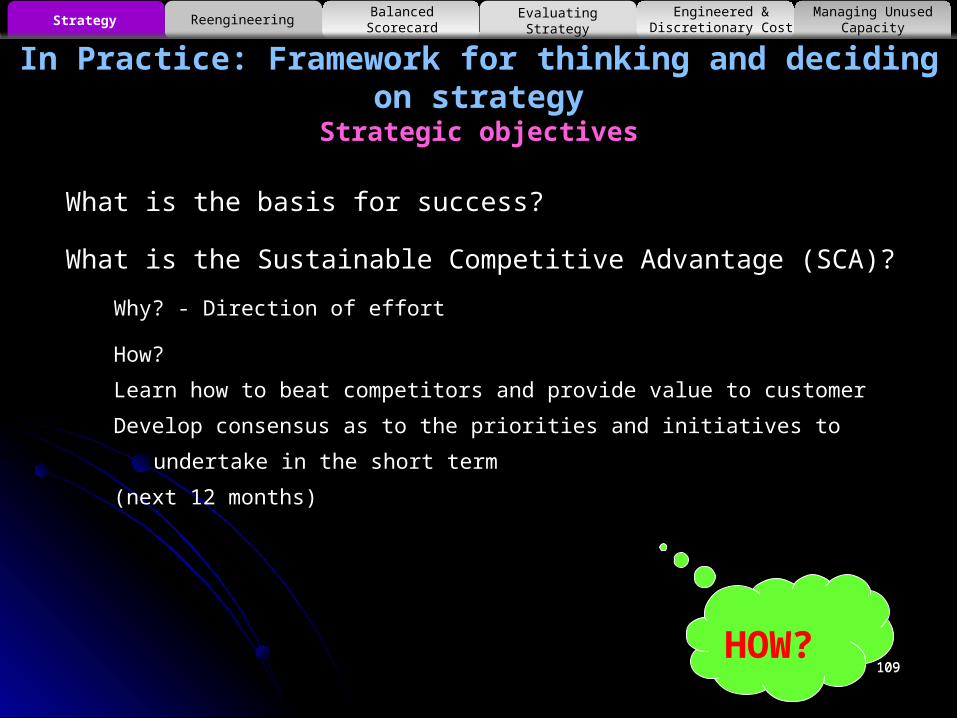
In Practice: Framework for thinking and deciding on strategyStrategic objectives
What is the basis for success?
What is the Sustainable Competitive Advantage (SCA)?
Why? - Direction of effort
How?
Learn how to beat competitors and provide value to customer
Develop consensus as to the priorities and initiatives to undertake in the short term
(next 12 months)
Strategy Reengineering Balanced Scorecard Engineered & Discretionary Cost
Managing Unused CapacityEvaluating Strategy
HOW?
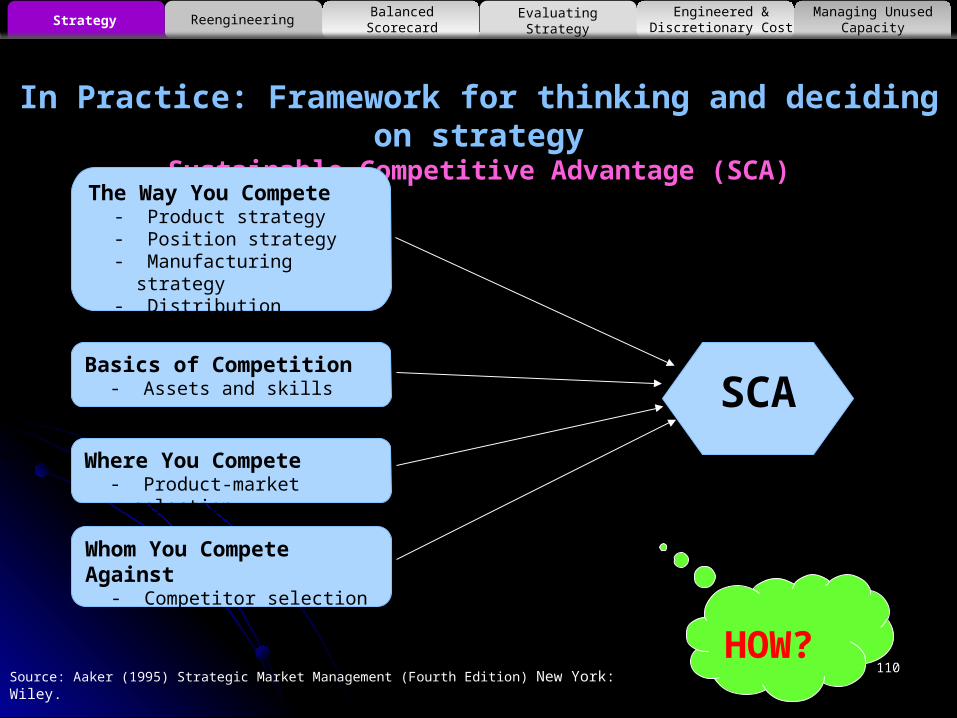
In Practice: Framework for thinking and deciding on strategySustainable Competitive Advantage (SCA)
Source: Aaker (1995) Strategic Market Management (Fourth Edition) New York: Wiley. 110
Strategy Reengineering Balanced Scorecard Engineered & Discretionary Cost
Managing Unused CapacityEvaluating Strategy
SCA
The Way You Compete- Product strategy- Position strategy- Manufacturing strategy- Distribution strategy, etc.
Basics of Competition- Assets and skills
Where You Compete- Product-market selection
Whom You Compete Against- Competitor selection
HOW?
111
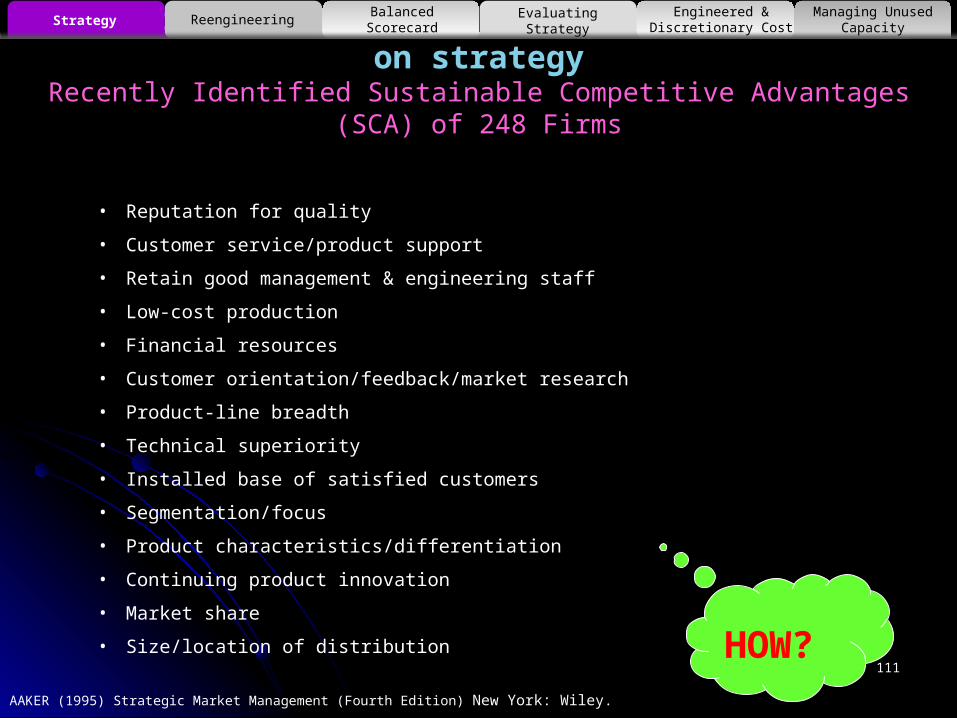
In Practice: Framework for thinking and deciding on strategyRecently Identified Sustainable Competitive Advantages (SCA) of 248 Firms
AAKER (1995) Strategic Market Management (Fourth Edition) New York: Wiley.
• Reputation for quality
• Customer service/product support
• Retain good management & engineering staff
• Low-cost production
• Financial resources
• Customer orientation/feedback/market research
• Product-line breadth
• Technical superiority
• Installed base of satisfied customers
• Segmentation/focus
• Product characteristics/differentiation
• Continuing product innovation
• Market share
• Size/location of distribution
Strategy Reengineering Balanced Scorecard Engineered & Discretionary Cost
Managing Unused CapacityEvaluating Strategy
HOW?

In Practice: Framework for thinking and deciding on strategyYour Sustainable Competitive Advantage
Ability to beat competitors
10 High5Low 0
5
High 10
Valu
e to
Cus
tom
er
Top Five Issues12345
© Neale O’Connor 2005
T
112
Strategy Reengineering Balanced Scorecard Engineered & Discretionary Cost
Managing Unused CapacityEvaluating Strategy
HOW?

© Neale O'Connor 2010
What is the BSC Strategic Objectives Simulation GameSystems Thinking
115
Case Example #2
Xinan JVBalanced Scorecard
SystemAppendix A

Xinan JV - Two Challenges
1. Product development Pharmaceutical Market reform by the Chinese
government, through the State Drug Product Council.
2. Sales manager development Sales force had an “old Chinese way of thinking” (short
term) mindset.
© Neale O'Connor 2010
Case Study
116

Xinan JV - Product development
1. Reduced drug prices Reforms in the Chinese pharmaceutical market, such as the
reduction of drug prices of between 30% to 50% across the board,
2. Increased competition Introduction of tendering in hospitals, which increased the
competition for the supply of drugs. For example, local generic product manufacturers were bidding between 30% and 50% below Xinan JV’s price.
3. Speed up the development of new products This served as a wake-up call for Xinan JV, which had an aging
portfolio of products that were largely protected from competition, and the challenge for the company was to speed up the development of new products.
© Neale O'Connor 2010
Case Study
117

Xinan JV - Sales manager development1. “old Chinese way of thinking” mindset
Fail to develop customer relationships Lack of motivation to develp product knowledge
Faced with these two challenges, Xinan JV set up an action plan that focused on the development and management of its intangible assets. This included the development of new products and the restructuring and development of the skills of its sales managers.
© Neale O'Connor 2010
Case Study
118

Xinan JV - Balanced Scorecard Implementation (2002)
Objective Strategy - Making medicine accessible – To be a
leader in China branded generic business in 5 years time.
Improve communication and control over strategy and the associated objectives and initiatives
© Neale O'Connor 2010
Case Study
119
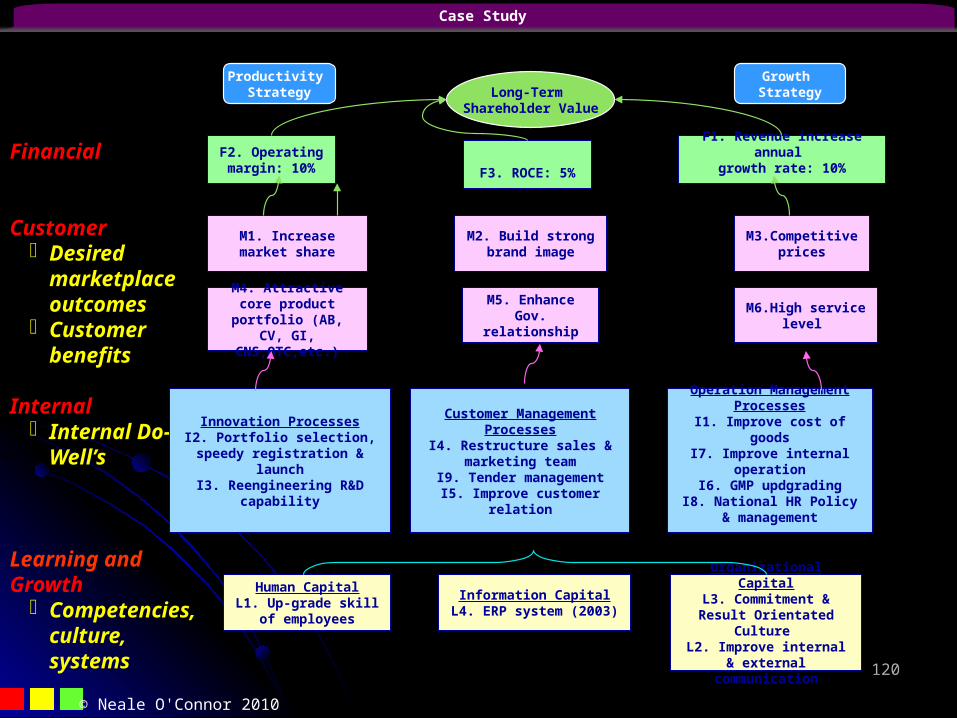
Information CapitalL4. ERP system (2003)
Financial
Customer– Desired
marketplace outcomes
– Customer benefits
Internal – Internal Do-
Well’s
Learning and Growth
– Competencies, culture, systems
M2. Build strong brand image
M1. Increase market share
M4. Attractive core product
portfolio (AB, CV, GI, CNS,OTC,etc.)
M5. Enhance Gov.
relationshipM6.High service
level
Operation Management Processes
I1. Improve cost of goods
I7. Improve internal operation
I6. GMP updgradingI8. National HR Policy &
management
Human CapitalL1. Up-grade skill
of employees
M3.Competitive prices
Organizational CapitalL3. Commitment & Result Orientated
Culture L2. Improve internal &
external communication
F3. ROCE: 5%
Customer Management Processes
I4. Restructure sales & marketing team
I9. Tender managementI5. Improve customer
relation
Innovation ProcessesI2. Portfolio selection, speedy registration &
launchI3. Reengineering R&D
capability
F2. Operating margin: 10%
F1. Revenue increase annual
growth rate: 10%
Long-Term Shareholder Value
Productivity Strategy
Growth Strategy
© Neale O'Connor 2010
Case Study
120

Problems in implementing the balanced scorecard
1. Training and participation2. Frequent reviews3. Contingency plans were difficult to show
© Neale O'Connor 2010
Case Study
121
© Neale O'Connor 2010
What is the BSC Strategic Objectives Simulation GameSystems Thinking
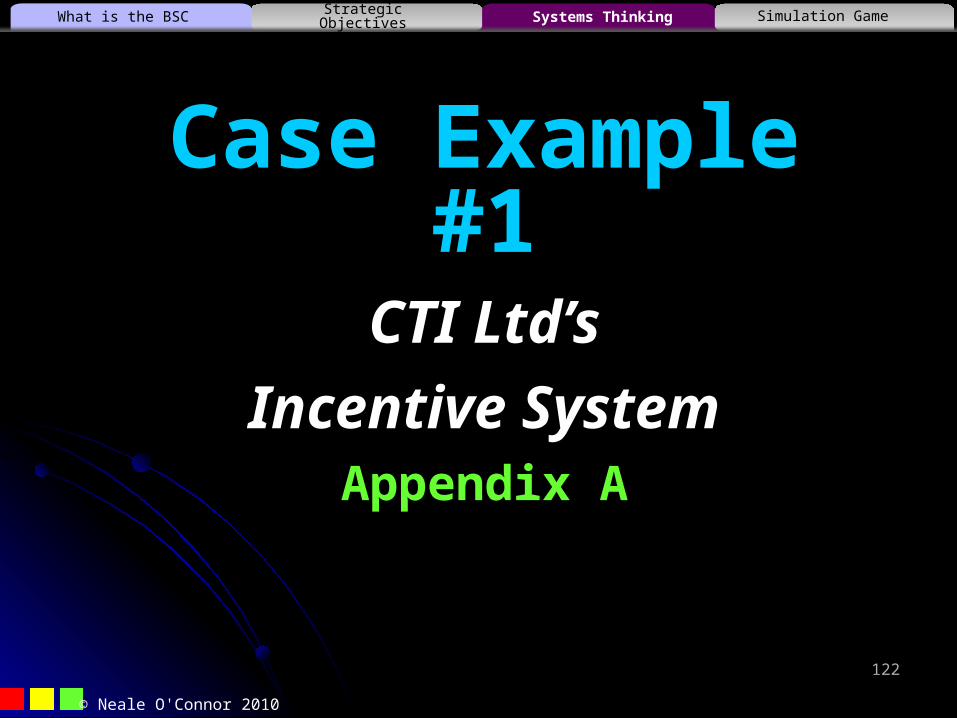
122
Case Example #1
CTI Ltd’sIncentive System
Appendix A

Critical factors in CTI’s strategyCTI
Two factors were critical to CTI’s profit growth strategy:Reliance on sales of higher margin products
Cash collection.
Incentive plan change With increasing introduction of new products and growth in sales
– these two factors drove CTI to change the incentive plan to direct management effort towards these objectives.
© Neale O'Connor 2010
Case Study
123

Setting of this study Quotes on the incentive plan
“We want people to be able to see everything. They
should not just be able to make sales, but should be able to motivate people, organize things strategically, putting down their thoughts into paper, think logically, and express themselves in a coherent fashion.”
© Neale O'Connor 2010
Case Study
124

Components of General multiple measure formula
© Neale O'Connor 2010
Bonus compensation formula = (Employees + 1) * (General formula) + (Direct sales formula)
Direct sales formula = Products - 50 cents per old product sold,
1.00 per new product sold.General formula = 5000 + (Points – 60) * 100
Points awarded according to
Objective assessment formula
and Objective (Financial) Measures
(45 points)
Points awarded according to Subjective
assessment and Objective (Non-
Financial) Measures(30 points)
Points awarded according to Subjective assessment and
Subjective measures(25- 35 points)
Sales components-Cash collection (40)a
-Relative branch office costs (5)a
Service level components-Execution of routine maintenance (5)b
-Major incident complaint (10)b
-Customer satisfaction survey (15)b
Management capability components-Regional office daily management (15)-Evaluation by VP – Teamwork, cooperativeness (10)-Evaluation by President and VP sales – proactive, innovative e.g., Making suggestions doing things beyond responsibility and solving difficult problems - Bonus points (10)
Case Study
125
Introduction Situation
Old incentive plan – sale bonus (up to 40%)… resulted in Cash collection problems 6-10 months of sales in ACCREC New products were being developed with increasing numbers of
features that allowed CTI to gain higher margins from the units sold
Other problems How to manage uncontrollable factors – market factors? How to encourage communication, teamwork, and managerial skill development?
Elaborate performance measurement and incentive plan introduced
Case Study
© Neale O'Connor 2010 126