Embed Size (px)
DESCRIPTION
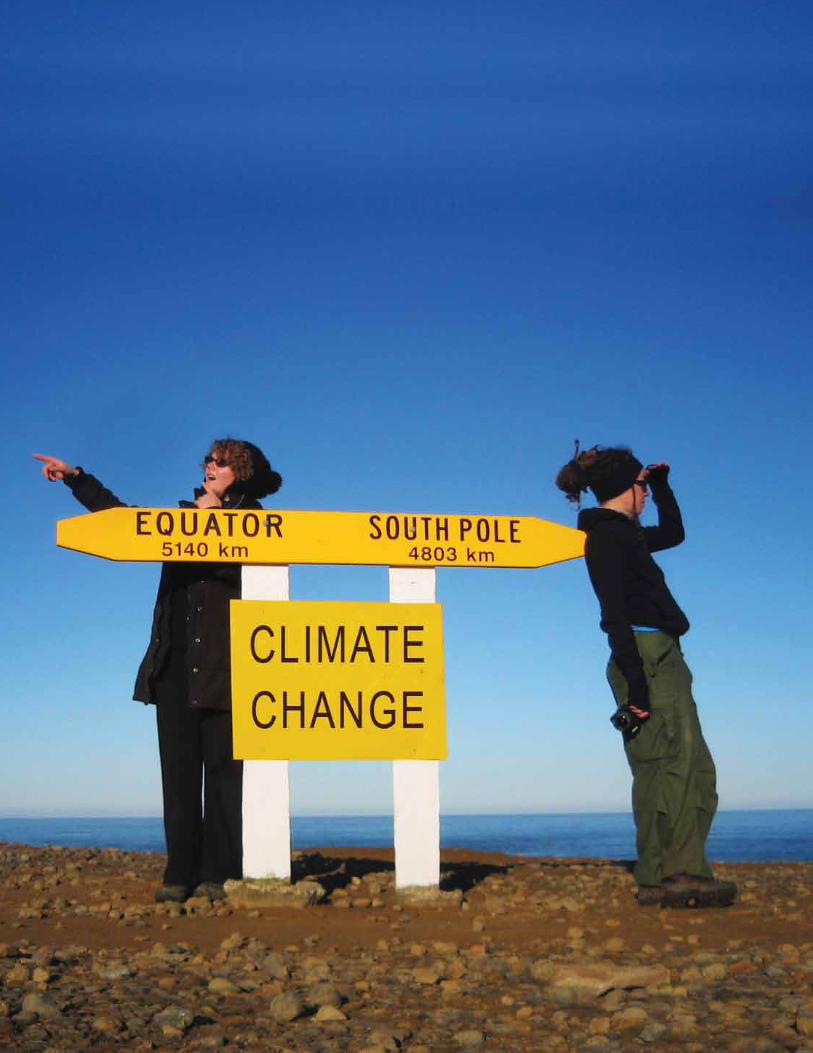
The World Youth Report focus on youth and climate change, and is intended to highlight the important role young people play in addressing climate change, and to offer suggestions on how young people might be more effectively integrated as individuals and collective agents of change within the realm of climate change adaptation and mitigation. The Report is designated to assist youth and youth organizations in educating themselves and to become more actively involved in combating the threat of climate change. It is also meant to affirm the status of young people as key stakeholders in the fight against climate change. The publication comes at a time when efforts to address climate change are receiving unparalleled attention on the international arena, offering youth a unique opportunity for their voice to be heard in the debate.
Citation preview
... young people have made it abundantly clear that they want to be involved in the decisions impacting soci-ety and addressing climate change is no exception. Throughout the world, youth have developed creative ways to raise awareness, share information, build capacities, and work together on climate change mitigation and adaptation practices–often achieving impressive results through their own initiatives. Young people can combat c l i m a t e change not only as members of youth organiza- tions, but also as individuals. Each of the world’s 1 . 2 billion young women and men has an impact on the environment. Through the choices they make in their everyday lives, they contribute to the preservation or degradation of their natural sur-roundings. Historically, the younger generation has promoted change and embraced innovative values. In many cases, youth have been the initiators of social movements that have given rise to cultural and social transformations. While the young people of today constitute
a major consumer group, many of them are dissatisfied with the consumer
societies in which they live and are seeking alternative lifestyles. This could mean a drive for change. Young people around the world are increasingly making small but important changes that represent essential steps in their transition to a more sustainable lifestyle. Youth can start right where they are, and many...
WorldReport
Youth &


United Nations publication
Sales No. E.10.IV.11
ISBN 978-92-1-130303-2
Copyright © United Nations, 2010
All rights reserved.
Printed by the United Nations, New York
This publication is available at www.un.org/youth. It is also available for Kindle, iPad, Nook and other e-book readers. For more details, please visit www.un.org/publications.
V
AcknowledgementsThe World Youth Report: Youth and Climate Change represents a collabora-tive effort, made possible by the input and feedback received from experts in the field of youth and climate change and from partners throughout the United Nations system working on issues relating to youth development and climate change. The contributions from youth around the world were invaluable in the preparation of the Report.
To obtain background information for the Report, the United Nations Programme on Youth issued a call for input. The positive response from young individuals, youth-led and youth-focused organizations, and in-stitutions working in the area of climate change is a testimony to the extensive interest in the topic of youth and climate change. Contribu-tions were carefully screened and helped inform the content of the final Report. They provided an important overview of the broad range of cli-mate change adaptation and mitigation activities in which young people around the world are engaged. Most of the examples provided in chap-ter IV of the present Report are based on these contributions. Unfor-tunately, owing to the large volume of contributions received, it is not possible to list all those who provided input individually. The United Na-tions Programme on Youth is deeply grateful for all the inputs received.
VI
desAThe Department of Economic and Social Affairs of the United Nations Secretariat is a vital interface between global policies in the economic, social and environmental spheres and na-tional action. The Department works in three main interlinked areas: it compiles, generates and analyses a wide range of economic, social and environmental data and information on which Members States of the United Nations draw to review common problems and to take stock of policy options; it facilitates the negotiations of Member States in many intergovernmental bod-ies on joint courses of action to address ongoing or emerging global challenges; and it advises interested Governments on the ways and means of translating policy frameworks developed in United Nations conferences and summits into programmes at the country level and, through technical assistance, helps build national capacities.
noteThe designations employed and the presentation of material in this publication do not imply the expression of any opinion whatsoever on the part of the Secretariat of the United Nations concerning the legal status of any country, territory, city or area or of its authorities, or con-cerning the delimitation of its frontiers or boundaries. The assignment of countries or areas to specific groupings is for analytical convenience and does not imply any assumption regarding political or other affiliation of countries or territories by the United Nations. The designations “developed” and “developing” are intended for statistical and analytical convenience and do not necessarily express a judgment about the stage reached by a particular country or area in the development process.
VII
Ac air conditioner
c celsius
cdm clean development mechanism
ceR certified emission reduction
cFl compact fluorescent lighting
co2 carbon dioxide
coP conference of the Parties to the United nations Framework convention on climate change
csd commission on sustainable development
dHF dengue haemorrhagic fever
eRU emission reduction unit
F Fahrenheit
FAo Food and Agriculture organization of the United nations
gHg greenhouse gas
IcmYo International coordination meeting of Youth organisations
IPcc Intergovernmental Panel on climate change
kcYP kibera community Youth Programme
ngo non-governmental organization
nYU new York University
oecd organization for economic cooperation and development
Unesco United nations educational, sci-entific and cultural organization
UnFccc United nations Framework convention on climate change
UneP United nations environment Programme
UnIceF United nations children’s Fund
UsP University of the south Pacific
YJF Youth Forum Jeunesse
YmcA Young men’s christian Association
YoUngo youth constituency (coP sessions)
Technical note
In this publication, unless otherwise indicated, the term “youth” refers to all those between the ages of 15 and 24, as reflected in the World Programme of Action for Youth. The term “young people” may be used interchangeably with the word “youth” in the text.
Note on country groupings and subgroupings
Unless otherwise indicated, the following coun-try groupings and subgroupings have been used in this Report:
Asia: Afghanistan, Bangladesh, Bhutan, Brunei Darussalam, Cambodia, China, Hong Kong Special Administrative Region of China, Macao Special Administrative Region of China, Democratic People’s Republic of Korea, India, Indonesia, Islamic Republic of Iran, Japan, Lao People’s Democratic
exPlAnAtoRY-notesReferences to dollars ($) indicate United States dollars, unless otherwise stated.
When a print edition of a source exists, the print version is the authoritative one. United Nations docu-ments reproduced online are deemed official only as they appear in the United Nations Official Docu-ment System. United Nations documentation obtained from other United Nations and non-United Nations sources are for informational purposes only. The Organization does not make any warranties or representations as to the accuracy or completeness of such materials.
The following abbreviations have been used in the Report:
VIII
Republic, Malaysia, Maldives, Mongolia, Myanmar, Nepal, Pakistan, Philippines, Republic of Korea, Singapore, Sri Lanka, Thailand, Timor-Leste, Viet Nam;
Sub-Saharan Africa: Angola, Benin, Botswana, Burkina Faso, Burundi, Cameroon, Cape Verde, Central African Republic, Chad, Comoros, Congo, Côte d’Ivoire, Democratic Republic of the Congo, Djibouti, Equatorial Guinea, Eritrea, Ethiopia, Gabon, Gambia, Ghana, Guinea, Guinea-Bissau, Kenya, Lesotho, Liberia, Madagascar, Malawi, Mali, Mauritania, Mauritius, Mayotte, Mozambique, Namibia, Niger, Nigeria, Réunion, Rwanda, Saint Helena, Sao Tome and Principe, Senegal, Seychelles, Sierra Leone, Somalia, South Africa, Swaziland, Togo, Uganda, United Republic of Tanzania, Zambia, Zimbabwe;
Latin America: Argentina, Belize, Bolivia, Brazil, Chile, Colombia, Costa Rica, Ecuador, El Salvador, Falkland Islands (Malvinas), French Guiana, Guatemala, Guyana, Honduras, Mexico, Nicaragua, Panama, Paraguay, Peru, Suriname, Uruguay, Venezuela;
Middle East and North Africa: Algeria, Bahrain, Djibouti, Egypt, Islamic Republic of Iran, Iraq, Israel, Jordan, Kuwait, Lebanon, Libyan Arab Jamahiriya, Malta, Morocco, Oman, Qatar, Saudi Arabia, Syrian Arab Republic, Tunisia, United Arab Emirates, Occupied Palestinian Territory, Yemen;
Eastern Europe and the Commonwealth of Independent States: Albania, Armenia, Azerbaijan, Belarus, Bosnia and Herzegovina, Bulgaria, Croatia, Czech Republic, Estonia, Georgia, Hungary, Kazakhstan, Kyrgyzstan, Latvia, Lithuania, Montenegro, Poland, Moldova, Romania, Russian Federation, Serbia, Slovakia, Slovenia, Tajikistan, Turkmenistan, Ukraine, Uzbekistan, former Yugoslav Republic of Macedonia;
Small island developing States: American Samoa, Anguilla, Antigua and Barbuda, Aruba, Bahamas, Barbados, Belize, British Virgin Islands, Cape Verde, Comoros, Cook Islands,
Cuba, Dominica, Dominican Republic, Fiji, French Polynesia, Grenada, Guam, Guinea-Bissau, Guyana, Haiti, Jamaica, Kiribati, Maldives, Marshall Islands, Mauritius, Federated States of Micronesia, Montserrat, Nauru, Netherlands Antilles, New Caledonia, Niue, Northern Mariana Islands, Palau, Papua New Guinea, Puerto Rico, Samoa, Sao Tome and Principe, Seychelles, Singapore, Solomon Islands, Saint Kitts and Nevis, Saint Lucia, Saint Vincent and the Grenadines, Suriname, Timor-Leste, Tonga, Trinidad and Tobago;
Developed market economies: Australia, Austria, Belgium, Cyprus, Denmark, Finland, France, Germany, Greece, Iceland, Ireland, Italy, Japan, the Netherlands, New Zealand, Norway, Portugal, Spain, Sweden, Switzerland, United Kingdom of Great Britain and Northern Ireland, United States of America.
The following symbols have been used in the annex tables included in the Report:
Two dots (..) indicate that data are not available or are not separately reported.
An em dash (—) indicates that the item is nil or negligible.
A hyphen (-) indicates that the item is not applicable.
A minus sign (-) indicates a deficit or de-crease, except as indicated.
A full stop (.) is used to indicate decimals.
A slash (/) between years indicates a statis-tical year, for example, 1990/91.
Use of a hyphen (-) between years, for example, 1990-1991, signifies the full period involved, in-cluding the beginning and end years.
Details and percentages in tables do not nec-essarily add to totals, because of rounding.
Annual rates of growth or change, unless oth-erwise stated, refer to annual compound rates.

IX
PHoto cRedIts:shootnations.org produced by Plan International and Shoot Experience:
Agnieszka Kozlowska: page ii-iii
Lauren Card page xviii - 1
William Lyte: page 10
Filipciuc Andrada: page 19
Alex Kozobolis: page 29
Filipciuc Andrada-Diana: page 38
Nilyma Khan: page 43
Lameck Nyagudi: page 47
Zabir Hasan: page 56
Katharina Kuehnel: page 62
Edna Loureiro: page 67
Ruli Amrullah: page 71
Claudia Morais: page 75
Mark-David Pfeifer: page 88-89
Florin Kiritescu: page 94
Wei Yun Chung: page 172-173

X

XI
contents Acknowledgements V
explanatory notes VII
INTRoDuCTIoN XVI
why “youth and climate change” now? xVI
overview of the Report xVII
I. CLIMATE CHANgE: THE bASICS 2
the facts about climate change 3
the impact of a changing climate on ecosystems and livelihoods 6
the international framework for combating climate change 7
the United nations Framework convention on climate change 8
the kyoto Protocol to the United nations Framework convention on climate change 9
Youth and Rio+20 10
suggestions for further reading 11
II. CoMPRoMISED FuTuRES? YouTH DEVELoPMENT AND THE EFFECTS oF CLIMATE CHANgE 14
the compound effects of climate change on health and safety 15
extreme weather events increase health hazards… 15
…particularly where sanitation is poor and waste- water management Insufficient 16
Reduced access to clean water compromises health 16
Higher temperatures increase exposure to disease… 16
…and increase the threat of heat stress 17
the food security dilemma 18
climate change mitigation and food security: an added challenge? 20
the impact of climate change on young people’s livelihoods 20
negative consequences 21

XII
Potential positive consequences— including green jobs 22
the migration equation 22
climate, conflict, and youth 24
Final analysis 26
suggestions for further reading 28
III. ADDRESSINg CLIMATE CHANgE AT ITS RooTS 30
consumption patterns and sustainable lifestyles 31
the dominant youth market 32
Young people’s ecological footprint 32
the consumption paradox: do young people walk the talk? 33
education for change 35
key features of effective education for sustainable development 35
challenges in implementing education for sustainable development 38
non-formal climate change education 39
Preparing young people to take advantage of green job opportunities 39
education and training 42
Youth entrepreneurship 44
environmental public employment programmes 44
suggestions for further reading 46
IV. MoVINg FoRWARD: YouTH TAKINg ACTIoN AND MAKINg A DIFFERENCE 48
Promoting youth participation within the United nations 49
Youth participation and the United nations Framework convention on climate change 51
Youth participation: climbing the ladder towards genuine empowerment 54
the ladder of participation 54
Youth participation in climate change initiatives around the world 55
Informing and educating youth 55
XIII
Young people sharing information and building capacity 57
Youth applying information and communication technologies 58
Youth gathering and analysing information 59
Youth involvement in campaigning, lobbying, and advocacy 60
Youth engaging in consultation 61
Youth taking the initiative 61
Youth participating in policy development 63
Youth as partners in decision-making 64
Youth mobilizing themselves: youth-led organizations 65
the role of young people in promoting and effecting change 66
Barriers to youth engagement and the way forward 69
conclusion 69
CALLINg ALL YouTH 72
bIbLIogRAPHY 76
STATISTICAL ANNEX 90
Introduction 90
1. Youth population indicators, 2010 95
2. Urban and rural distribution of youth, 1990-2005 102
3. Youth literacy rates, 1985-2008 108
4. gross enrolment ratios for primary, secondary and tertiary education, 2008 116
5. net enrolment ratios for primary and secondary education, 2008 124
6. Primary to secondary school transition rates, 2007-2008 132
7. Youth labour force participation rates, 2008 138
8. Youth unemployment indicators 144
9. Youth undernutrition and shelter deprivation 154
10. Youth access to sanitation and water 158
11. leading causes of death among youth 164
XIV
PRoFILE oF YouTH 170
Brief demographic and development profile of youth 170
FIguRES
I.1 trends in global average surface temperature 3
I.2 extreme weather events, 1970-2005 4
I.3 share of different sectors in total anthropogenic greenhouse gas emissions in terms of co2-equivalent emissions, 2004 5
I.4 Annual per capita emissions in selected regions, 1950-2005 5
I.5 Projected impacts of climate change 6
II.1 the complex relationship between conflict over natural resources and climate change 25
II.2 dependency ratio in renewable water 26
III.1 the consumption process 31
IV.1 Youth actions for sustainable lifestyles 68
boXES
I.1 the Intergovernmental Panel on climate change 7
I.2 growing green globally: A snapshot on the green growth model for development 12
II.1 dengue: a resurgent virus 17
II.2 marjorie’s story: a Filipina shell fisher in warm waters 21
II.3 Permanent inundation and forced migration 23
II.4 climate change and indigenous youth 26
III.1 defining sustainable lifestyles ` 34
III.2 the ozonAction education Pack 36
III.3 Promoting education for sustainable development at the highest level 37
III.4 tertiary climate change education in the Pacific Islands 39
III.5 Youth harnessing the power of the sun through the production of solar photovoltaic panels 40
III.6 city garbage recyclers in low-income estates 41
III.7 Youth employment through invasive alien species eradication 45
XV
IV.1 the world Programme of Action for Youth on the importance of participation 49
IV.2 mainstreaming indigenous peoples’ issues in inter- national development assistance programmes and funds dedicated to addressing climate change 50
IV.3 Youth voices at the fifteenth session of the conference of the Parties (coP 15) 52
IV.4 the status of the youth constituency in activities carried out under the auspices of the United nations Framework convention on climate change 53
IV.5 Youth climate campaigning “down under” 65
Int
Ro
dU
ct
Ion
IntRodUctIonWhy “youth and climate change” now?
Climate change is one of the defining chal-lenges of the twenty-first century. It is a chal-lenge that is global in both its impact and its solutions but one that is not shared equally, as developing countries are likely to be among the most seriously affected by and the least able to address the consequences of climate change. Climate change touches every aspect of life and impinges on development efforts, with consequences ranging from immediate to long term. Major adjustments are required to promote more sustainable patterns of pro-duction and consumption at both the collec-tive and individual levels. Solid evidence exists that climate change will have a more serious impact than initially anticipated and that ad-aptation and mitigation will entail significantly higher costs if action is deferred than if the problem is addressed now.
Addressing and adjusting to the challenge of climate change is certain to be a defining fea-ture of the future of today’s youth. It is there-fore critical that young people educate them-selves and become more actively involved in combating this threat. The present Report is designed to assist youth and youth organiza-tions in such an endeavour. It is also meant to affirm the status of young people as key stake-holders in the fight against climate change. The publication comes at a time when efforts to address climate change are receiving un-paralleled attention in the international arena, offering youth a unique opportunity for their voice to be heard in the debate.
XVII
Youth have long been involved in environmen-tal protection activities at the school and com-munity levels, but the time has come for them to participate more actively in shaping global decisions relating to climate change. Young people must contribute to the process of ad-dressing this critical challenge, as they will feel its impact most acutely throughout their lives.
Young advocates for the environment are be-coming more insistent that their voices be heard. In recent years, youth have been rec-ognized as a constituency, albeit with proba-tionary status, at the annual sessions of the Conference of the Parties to the United Nations Framework Convention on Climate Change (UNFCCC), the world’s most important inter-governmental forum dealing with international efforts and commitments to combat climate change. Young people must continue to move forward, strengthening their position until they occupy a secure place in the decision-making process. To that end, the current World Youth Report provides an assessment of youth participation today and identifies steps that can be taken at the local and international levels to facilitate wider and more effective participation among youth in addressing climate change.
overview of the Report
Chapter I provides basic information on climate change as well as an overview of the United Nations Framework Convention on Climate Change and its Kyoto Protocol, the relevant international legal and policy framework rec-ognized by most countries. The chapter con-cludes with a brief outline of the aims of the upcoming United Nations Conference on Sus-tainable Development, Rio +20.
Chapter II focuses on the consequences of cli-mate change, exploring how the threat it poses to health and safety, food security, and liveli-hood sustainability may directly affect youth development in developing countries. The chapter also addresses the possibility of ensu-ing tensions and conflicts over the control of basic natural resources and livelihood opportu-nities—and their potential outcomes, including migration.
In chapters III and IV, the focus shifts from how young people are likely to be affected by cli-mate change to how they can contribute to remedying the situation. Chapter III identifies trends in young people’s consumption behav-iours and lifestyles. Youth, especially those in developed countries, constitute a critical mass of present and future consumers, and their con-sumption decisions could become a key factor in reducing or aggravating climate change and its consequences.
An overwhelming majority of youth indicate that world leaders should do all they can to stop climate change, but do young people take their own responsibilities in this context just as seriously? Education has been identified as a crucial tool in raising environmental aware-ness and promoting behaviour change among youth. Chapter III highlights education for sus-tainable development and the role of education in preparing young people to take advantage of “green” job opportunities. It also includes brief mention of additional measures that might be taken to promote green employment options for youth.
Chapter IV showcases existing youth mobili-zation efforts and initiatives to combat climate change. Youth-led environmental organiza-tions constitute a highly successful model of self-mobilization among young people, and such bodies are likely to play a critical role in tackling climate change challenges. The chap-ter concludes with an assessment of where youth currently stand in terms of involvement, celebrating recent political developments ac-knowledging young people as legitimate stake-holders in intergovernmental negotiations on climate change but also identifying barriers to effective youth participation.
The first three chapters end with a short anno-tated list of references for readers interested in more in-depth information on climate change.
Ultimately, the present World Youth Report is intended to highlight the important role played by youth in addressing climate change and to offer suggestions on how young people might be more effectively integrated as individual and collective agents of change within the realm of climate change adaptation and mitigation.


cHAPteR I YouTH AND CLIMATE CHANgE: THE bASICS
Climate change … is the defining challenge of our era. No issue is more fundamental to the global challenges we face—reducing poverty…maintaining economic growth…ensuring peace and stability.
— Ban Ki-moon, Secretary-General of the United Nations1
1 UN News Centre (2009), “Remarks at UNFCCC COP15 High Level Segment”.
cH
AP
te
R I
0.6
0.4
0.2
0
-0.2
-0.4
-0.6
The facts about climate change
Climate change is happening, and it is hap-pening quickly. Although the issue has been a source of controversy among scientists and policymakers, there is growing evidence that the earth’s temperature is rising and that polar ice caps and glaciers are melting. For many key pa-rameters, the climate system is already moving beyond the patterns of natural variability (Inter-governmental Panel on Climate Change, 2007a).
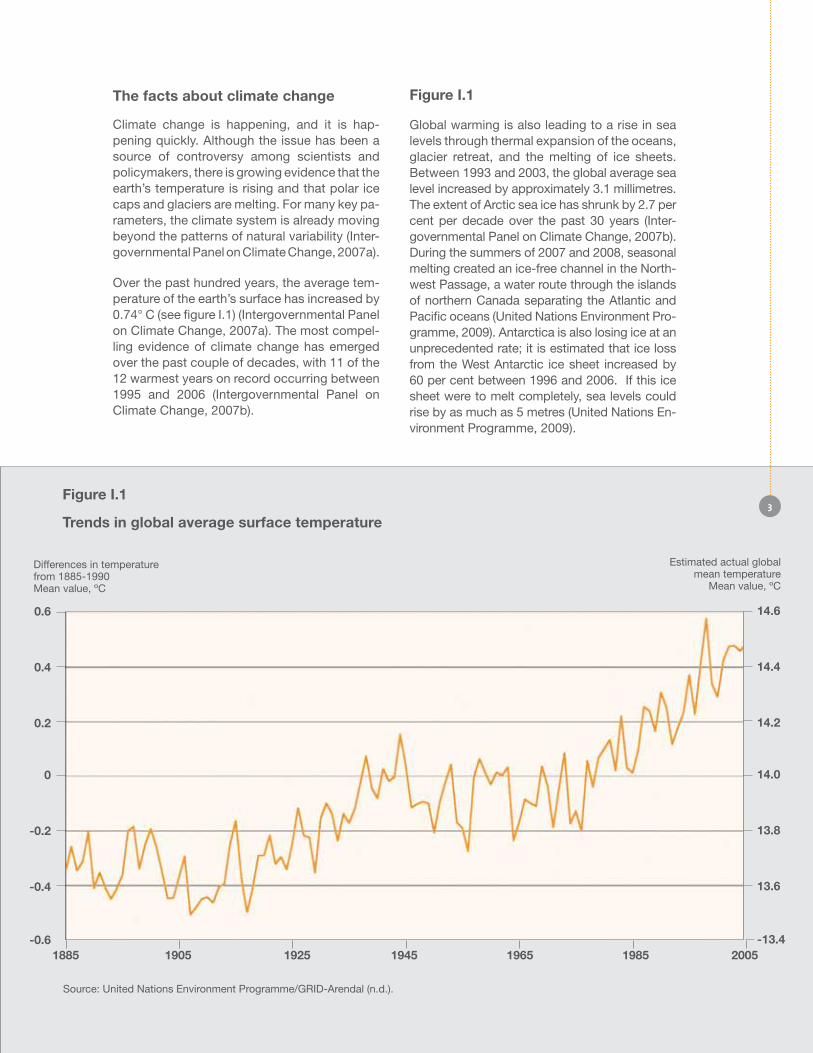
Over the past hundred years, the average tem-perature of the earth’s surface has increased by 0.74° C (see figure I.1) (Intergovernmental Panel on Climate Change, 2007a). The most compel-ling evidence of climate change has emerged over the past couple of decades, with 11 of the 12 warmest years on record occurring between 1995 and 2006 (Intergovernmental Panel on Climate Change, 2007b).
Figure I.1
Global warming is also leading to a rise in sea levels through thermal expansion of the oceans, glacier retreat, and the melting of ice sheets. Between 1993 and 2003, the global average sea level increased by approximately 3.1 millimetres. The extent of Arctic sea ice has shrunk by 2.7 per cent per decade over the past 30 years (Inter-governmental Panel on Climate Change, 2007b). During the summers of 2007 and 2008, seasonal melting created an ice-free channel in the North-west Passage, a water route through the islands of northern Canada separating the Atlantic and Pacific oceans (United Nations Environment Pro-gramme, 2009). Antarctica is also losing ice at an unprecedented rate; it is estimated that ice loss from the West Antarctic ice sheet increased by 60 per cent between 1996 and 2006. If this ice sheet were to melt completely, sea levels could rise by as much as 5 metres (United Nations En-vironment Programme, 2009).
Source: United Nations Environment Programme/GRID-Arendal (n.d.).
Figure I.1
Trends in global average surface temperature
0.6
0.4
0.2
0
-0.2
-0.4
-0.61885 1905 1925 1945 1965 1985 2005
Differences in temperaturefrom 1885-1990Mean value, ºC
Estimated actual global mean temperature
Mean value, ºC
14.6
14.4
14.2
14.0
13.8
13.6
-13.4
3
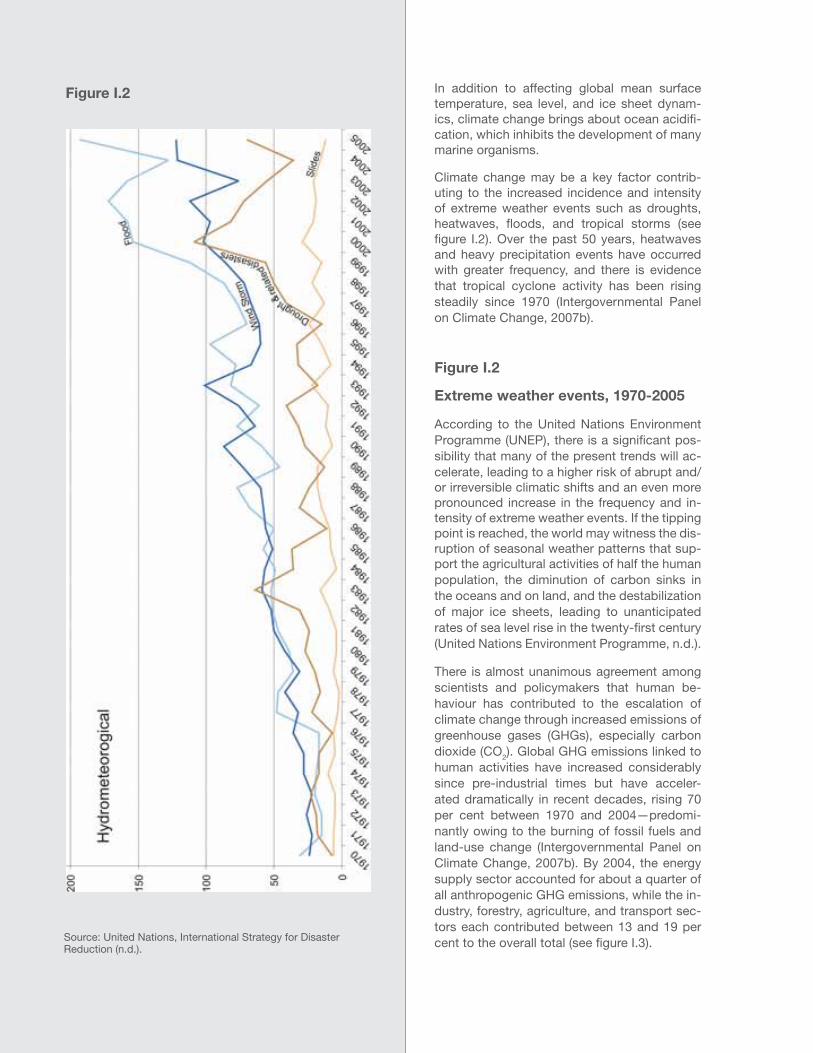
In addition to affecting global mean surface temperature, sea level, and ice sheet dynam-ics, climate change brings about ocean acidifi-cation, which inhibits the development of many marine organisms.
Climate change may be a key factor contrib-uting to the increased incidence and intensity of extreme weather events such as droughts, heatwaves, floods, and tropical storms (see figure I.2). Over the past 50 years, heatwaves and heavy precipitation events have occurred with greater frequency, and there is evidence that tropical cyclone activity has been rising steadily since 1970 (Intergovernmental Panel on Climate Change, 2007b).
Figure I.2
Extreme weather events, 1970-2005
According to the United Nations Environment Programme (UNEP), there is a significant pos-sibility that many of the present trends will ac-celerate, leading to a higher risk of abrupt and/or irreversible climatic shifts and an even more pronounced increase in the frequency and in-tensity of extreme weather events. If the tipping point is reached, the world may witness the dis-ruption of seasonal weather patterns that sup-port the agricultural activities of half the human population, the diminution of carbon sinks in the oceans and on land, and the destabilization of major ice sheets, leading to unanticipated rates of sea level rise in the twenty-first century (United Nations Environment Programme, n.d.).
There is almost unanimous agreement among scientists and policymakers that human be-haviour has contributed to the escalation of climate change through increased emissions of greenhouse gases (GHGs), especially carbon dioxide (CO2). Global GHG emissions linked to human activities have increased considerably since pre-industrial times but have acceler-ated dramatically in recent decades, rising 70 per cent between 1970 and 2004—predomi-nantly owing to the burning of fossil fuels and land-use change (Intergovernmental Panel on Climate Change, 2007b). By 2004, the energy supply sector accounted for about a quarter of all anthropogenic GHG emissions, while the in-dustry, forestry, agriculture, and transport sec-tors each contributed between 13 and 19 per cent to the overall total (see figure I.3).Source: United Nations, International Strategy for Disaster
Reduction (n.d.).
Figure I.2
5
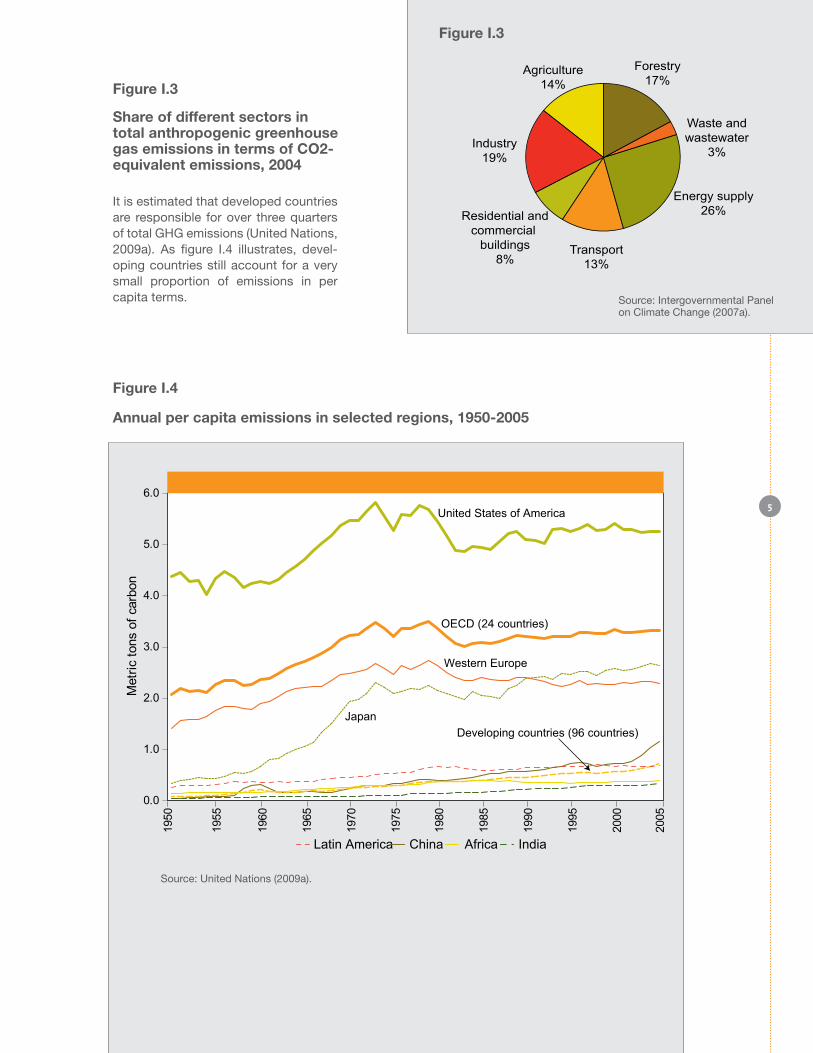
It is estimated that developed countries are responsible for over three quarters of total GHG emissions (United Nations, 2009a). As figure I.4 illustrates, devel-oping countries still account for a very small proportion of emissions in per capita terms.
Energy supply26%
Transport13%
Residential andcommercial
buildings8%
Industry19%
Forestry17%
Waste andwastewater
3%
Agriculture14%
Figure I. Annual per capita emissions, selected regions, 1950-2005
0.0
1.0
2.0
3.0
4.0
5.0
6.0
1950
1955
1960
1965
1970
1975
1980
1985
1990
1995
2000
2005
Metr
ic t
ons o
f carb
on
Latin America China Africa India
Developing countries (96 countries)
United States of America
OECD (24 countries)
Western Europe
Japan
Figure I.3
Share of different sectors in total anthropogenic greenhouse gas emissions in terms of Co2- equivalent emissions, 2004
Source: Intergovernmental Panel on Climate Change (2007a).
Source: United Nations (2009a).
Figure I.4
Annual per capita emissions in selected regions, 1950-2005
Figure I.3
6
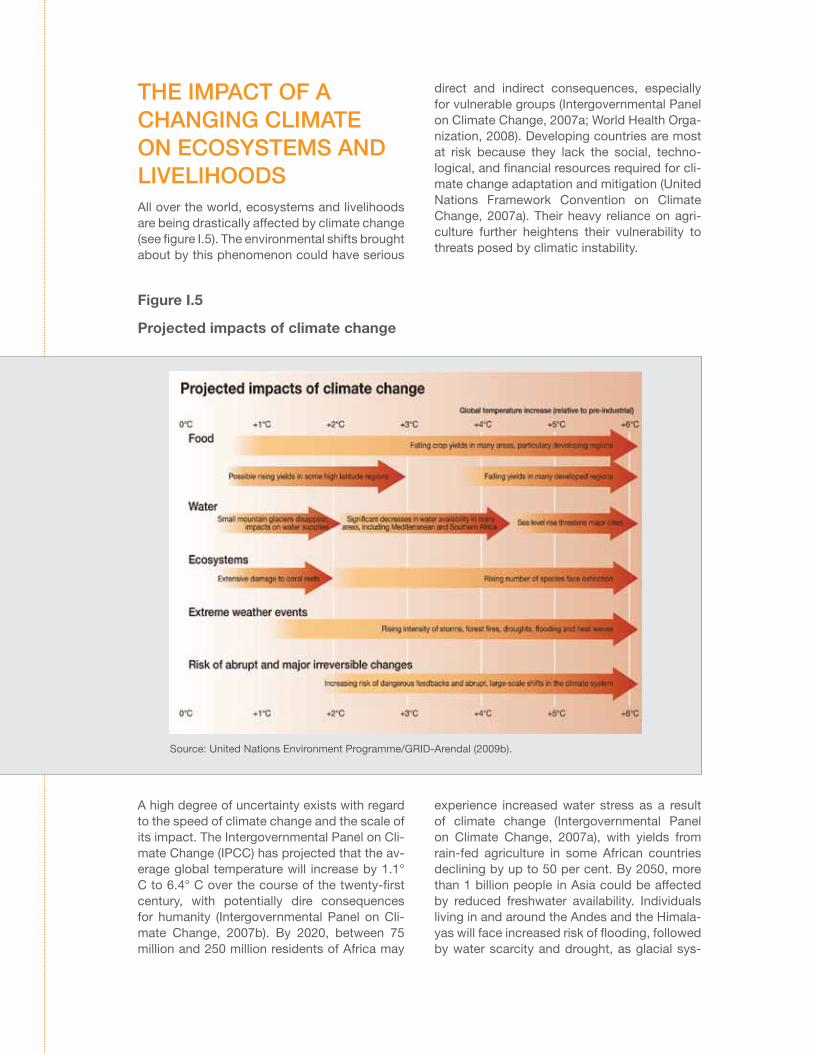
tHe ImPAct oF A cHAngIng clImAte on ecosYstems And lIVelIHoodsAll over the world, ecosystems and livelihoods are being drastically affected by climate change (see figure I.5). The environmental shifts brought about by this phenomenon could have serious
direct and indirect consequences, especially for vulnerable groups (Intergovernmental Panel on Climate Change, 2007a; World Health Orga-nization, 2008). Developing countries are most at risk because they lack the social, techno-logical, and financial resources required for cli-mate change adaptation and mitigation (United Nations Framework Convention on Climate Change, 2007a). Their heavy reliance on agri-culture further heightens their vulnerability to threats posed by climatic instability.
Source: United Nations Environment Programme/GRID-Arendal (2009b).
Figure I.5
Projected impacts of climate change
A high degree of uncertainty exists with regard to the speed of climate change and the scale of its impact. The Intergovernmental Panel on Cli-mate Change (IPCC) has projected that the av-erage global temperature will increase by 1.1° C to 6.4° C over the course of the twenty-first century, with potentially dire consequences for humanity (Intergovernmental Panel on Cli-mate Change, 2007b). By 2020, between 75 million and 250 million residents of Africa may
experience increased water stress as a result of climate change (Intergovernmental Panel on Climate Change, 2007a), with yields from rain-fed agriculture in some African countries declining by up to 50 per cent. By 2050, more than 1 billion people in Asia could be affected by reduced freshwater availability. Individuals living in and around the Andes and the Himala-yas will face increased risk of flooding, followed by water scarcity and drought, as glacial sys-
7
tems in these mountain ranges continue to re-cede. In Small Island Developing States (SIDS) in the Caribbean and Pacific regions, sea level rise and increasing sea temperatures are al-ready having a negative impact on freshwater resources, fisheries, and coastal ecosystems.
Increased exposure to aggravated environ-mental stress linked to longer or more intense droughts, storms, floods, or other major weath-er events has already begun to interfere with the efforts of some of the world’s most vulner-able to build a better life for themselves and their families. If climate change continues at its present pace, the health, shelter, and live-lihood situations of a significant proportion of the global population will be seriously affected, which could trigger large-scale reversals in hu-man development. Failure to address climate change today will result in diminished oppor-tunities and a widening of the inequality gap within and between countries.
Efforts to combat climate change at the local, national, and international levels have focused on mitigation and adaptation. Mitigation refers to measures that seek to reduce GHG emis-sions and thereby slow the progression of cli-mate change. Mitigation measures include not only using renewable energy and developing new technologies for transportation and indus-try, but also protecting and expanding forests, which play a crucial role in absorbing green-house gases. Adaptation refers to measures to protect people and ecosystems from the ef-fects of climate change. Since climate change is a transnational issue, effective mitigation and adaptation require international cooperation and coordination.
The international framework for com-bating climate change
At the United Nations Conference on Environ-ment and Development, held in Rio de Janeiro in 1992, 178 Governments agreed that climate change should be addressed from a sustain-able development perspective. Section 9.3 of Agenda 21 (1993) states that relevant efforts “should be coordinated with social and eco-nomic development in an integrated manner with a view to avoiding adverse impacts on the latter, taking into full account the legitimate priority needs of developing countries for the achievement of sustained economic growth and the eradication of poverty”.
The United Nations Framework Convention on Climate Change was also adopted in 1992 and entered into effect in 1994; most countries have since become signatories. The Frame-work Convention and its Kyoto Protocol are at the core of international efforts to address cli-mate change.
box I.1
The Intergovernmental Panel on Climate Change
The Intergovernmental Panel on Cli-mate Change (IPCC) was established by the United Nations Environment Programme and World Meteorological Organization in 1988 to help Govern-ments better understand changes in the world’s climate from a scientific perspective. The IPCC is an expert body that reviews and assesses the most recent scientific, technical, and socio-economic information produced worldwide relevant to the understand-ing of climate change.
The IPCC comprises three working groups that address different aspects of the climate change issue. Working Group I assesses the “physical scien-tific aspects of the climate system and climate change”, focusing on varia-tions in temperature, rainfall, sea level, and ice sheets, on climate models and projections, and on the “causes and attribution of climate change”. Work-ing Group II “assesses the vulner-ability of socio-economic and natural systems to climate change, negative and positive consequences of climate change, and options for adapting to it”. Working Group III “assesses op-tions for mitigating climate change through limiting or preventing green-house gas emissions and enhancing activities that remove them from the atmosphere”. Technical support units administer and organize the activities of the working groups.
The IPCC is made up of thousands of scientists from around the world who contribute to the Panel’s work on a volun-tary basis as authors, contributors,
8
and reviewers. The efforts of these scientists are supported by the IPCC secretariat, which plans, coordinates, and oversees the Panel’s activities.
The major output of the IPCC is its assessment reports, which comprise separate publications from each work-ing group and, since 1995, a synthesis report. These scientific reports provide the world’s most comprehensive cov-erage of climate change. The First As-sessment Report, published in 1990, identified climate change as an issue requiring an international political plat-form. The Report served as a catalyst leading to the establishment of the Framework Convention, the landmark international treaty created to reduce global warming and compel countries to deal with the consequences of cli-mate change. The Second Assess-ment Report: Climate Change 1995 contributed key input to the process leading to the adoption of the Kyoto Protocol to the Framework Convention in 1997. The third and fourth assess-ment reports were published in 2001 and 2007 respectively. The participa-tion of the scientific community in the work of the IPCC has grown substan-tially in terms of both the number of authors and contributors involved in the writing and reviewing of the re-ports and the geographic distribution and topics covered in the publications.
Along with the assessment reports, the IPCC produces special reports, meth-odology reports, technical papers, and supporting materials. Through these and other means the Panel provides the United Nations Climate Change secretariat, the Conference of the Par-ties to the Framework Convention, and other environmental conventions with information on technical and scientific matters.
Source: Information summarized and extracted from the Intergovernmen-tal Panel on Climate Change website (http://www.ipcc/ch).
The united Nations Framework Convention on Climate Change
The Framework Convention is an international treaty that establishes broad goals and rules for addressing climate change. Its ultimate objec-tive is to ensure that GHG emissions linked to human activity remain below the level at which the climate system is adversely affected. The Convention is general and flexible in character; its importance derives not from the provision of detailed environmental protection guidelines, but rather from its role in securing global recog-nition of climate change as a major challenge. The Convention has laid the groundwork for more focused action, including the adoption of the Kyoto Protocol (United Nations Framework Convention on Climate Change, 2009c).
The Conference of the Parties (COP) is the su-preme body of the Framework Convention. It comprises all countries that are Parties to the Convention and usually meets annually for a period of about two weeks within the larger context of the United Nations Climate Change Conference. The yearly sessions, which are at-tended by several thousand government del-egates, observer organizations, and journalists, provide the COP with an opportunity to evalu-ate the status of climate change and the effec-tiveness of the treaty (United Nations Frame-work Convention on Climate Change, 2009a; 2009b).
The fifteenth session of the Conference of the Parties (COP 15) was held in Copenhagen from 7 to 18 December 2009. The meeting was at-tended by 120 heads of State and Govern-ment, highlighting the growing importance and urgency attached to climate change by the international community. Country leaders and other high-ranking Government officials and delegates present at the United Nations Cli-mate Change Conference adopted the Copen-hagen Accord, through which they committed to significant emission reductions and to the establishment of the Copenhagen Green Cli-mate Fund to support action on climate change in developing countries. Following COP 15, 55 countries that together account for 78 per cent of global emissions pledged to cut and limit greenhouse gases by 2020 (United Nations Framework Convention on Climate Change, 2010), and developed countries agreed to pro-vide approximately US$ 30 billion for Climate
9
Fund activities during the period 2010-2012 (United Nations Framework Convention on Cli-mate Change, 2009c). Throughout 2010, nego-tiations will continue as Member States engage in sustained efforts to convert the Copenhagen Accord into a legally binding instrument.
At COP 15 for the first time, youth were offi-cially recognized as a formal constituency (al-beit on probationary terms), legitimizing their status as stakeholders. Over a thousand young environmental activists from approximately 100 countries attended COP 15 (UNFCCC Youth Constituency, 2009a), participating not only in formal interventions but also in activities such as workshops, media events, and silent dem-onstrations. On 10 December a youth day with the theme Young and Future Generations was held. A more detailed description of youth in-volvement in the activities surrounding COP 15 is provided in chapter IV of the present Report.
The Kyoto Protocol to the united Nations Framework Convention on Climate Change
The Kyoto Protocol was adopted on 11 Decem-ber 1997 after two and a half years of intensive negotiations, and entered into force on 16 Feb-ruary 2005. The Protocol established legally binding emissions targets for developed coun-tries and incorporated innovative mechanisms to assist those countries in meeting the targets.
Under the terms of the Kyoto Protocol, 37 in-dustrialized countries and the European Union as a whole are required to reduce GHG emis-sions by an average of 5 per cent relative to 1990 levels over the five-year period 2008-2012. While the Framework Convention en-courages industrialized countries to stabilize GHG emissions, the Protocol commits them to doing so. In recognition of the fact that the cur-rent high levels of GHG emissions are a result of more than 150 years of industrial activity, the Protocol places a heavier burden on developed nations.
The Kyoto Protocol introduces three mecha-nisms that provide countries with flexible op-tions for meeting their commitments. The first is emissions trading, which allows countries with spare emission units to sell this excess capacity to countries that have exceeded their
targets. Since carbon dioxide is the principal GHG, this mechanism is often referred to as the carbon market. Second is the Clean De-velopment Mechanism (CDM), which “allows a country with an emission-reduction or emis-sion-limitation commitment … to implement an emission-reduction project in developing countries. Such projects can earn saleable cer-tified emission reduction (CER) credits, each equivalent to one ton of CO2, which can be counted towards meeting Kyoto targets” (Inter-governmental Panel on Climate Change, n.d.). An example of a CDM project might be a rural electrification project using solar panels or the installation of more energy-efficient boilers. The CDM, operational since the beginning of 2006, has registered more than 1,650 projects to date (United Nations Framework Convention on Cli-mate Change, n.d.). The third mechanism is joint implementation, which “allows a country with an emission reduction or limitation com-mitment … to earn emission reduction units (ERUs) from an emission-reduction or emission removal project” in another country with low-er emission-reduction or emission-limitation targets (Intergovernmental Panel on Climate Change, n.d.).
The CDM and joint implementation mechanism allow developed countries to transfer some of their technologies for reducing GHG emissions to countries that are expected to become more industrialized. As stipulated in the Protocol, countries’ actual emissions, as well as their transactions, are monitored and recorded by the United Nations Climate Change secretariat, based in Bonn, Germany.
The Kyoto Protocol is generally regarded as an important first step towards the establishment of a truly global emission reduction regime that will stabilize GHG emissions, providing the essential architecture for international cli-mate change agreements yet to come (United Nations Framework Convention on Climate Change, n.d.).
Almost two decades after the adoption of the Framework Convention and more than a de-cade after the adoption of the Kyoto Protocol, there is a growing consensus that addressing climate change requires both stronger emis-sion reduction efforts among developed coun-tries and the active participation of develop-ing countries, in particular the large emerging
10

11
economies. Requiring developing countries to reduce emissions rests on the premise that these countries are set to pursue rapid and sustained economic growth. It also presumes that all developing countries have access to af-fordable technological solutions that will facili-tate the shift to new sources of energy and the adoption of low-emission patterns of produc-tion, consumption and development. In order to reach this point, most developing countries will require financial and technical assistance from the more industrialized nations as well as access to mitigation technology at affordable cost.
Against this background, youth and youth or-ganizations have an important role to play in helping to stem the tide of unsustainable de-velopment and in harnessing the political will to meet existing emission reduction commit-ments. In particular, young people can support and contribute to efforts aimed at ensuring that new mechanisms and financial facilities are put in place for transferring and providing access to green technologies. Youth can also play a role in monitoring the implementation and impact of specific initiatives within this framework.
Youth and Rio+20
In 2012, the United Nations Conference on Sustainable Development – or, Rio+20 – will take place in Rio de Janeiro, Brazil. The overall aims of the Conference are to: (i) follow-up to the United Nations Conference on Environment and Development by assessing progress made in achieving the goals set out in Agenda 21; (ii) consider strategies to implement sustainable and equitable green economies; (iii) strength-en the institutional framework for sustainable development governance, and (iv) secure re-newed political commitment for sustainable development. Rio+20 provides an opportunity for Governments to address emerging chal-lenges and establish a new framework for ad-vancing the implementation of the sustainable development agenda through international co-operation.
At the United Nations Conference on Environ-ment and Development held in 1992, also in Rio de Janeiro, the international community recognized the significance of integrating youth into decision-making and implementation pro-
cesses as a means to support the achievement of sustainable development goals. A compre-hensive programme of action was adopted – referred to as Agenda 21 – and included the following youth-focused objectives:
• Promoting dialogue between youth and decision-makers at all levels and the pro-vision of mechanisms to permit youth access to information and the opportu-nity to present their views on sustainable development policy, particularly those directly impacting youth;
• Providing improved access to second-ary education as well as vocational and practical skills training programmes, while ensuring that education reflects the economic and social needs of youth and incorporates the concepts of envi-ronmental awareness and sustainable development, and prepares them ad-equately to meet the technological ad-vances in industry and the labour market;
• Developing and implementing aware-ness raising programmes specifically tar-geted to the youth population on critical issues pertaining to youth;
• Implementing strategies to improve em-ployment opportunities for youth;
• Supporting mechanisms which facilitate youth representation in national, regional and international processes.
Despite good intentions and an ambitious pro-gramme of action, implementation of Agenda 21 is considered lacking. The less than desir-able progress is partly attributed to fragmented global environmental and development gover-nance as well as a lack of adequate national legal frameworks for addressing sustainable development. In addition, the onset of multiple socio-economic challenges over the past sev-eral years – financial crisis, food crisis, volatile oil prices, increase in climate variability, etc. – have also contributed to delayed action. Rio +20 marks an occasion for Governments, the United Nations system and Civil Society to re-view these challenges with a view to mitigating the effects and catalyzing progress.
box I.2
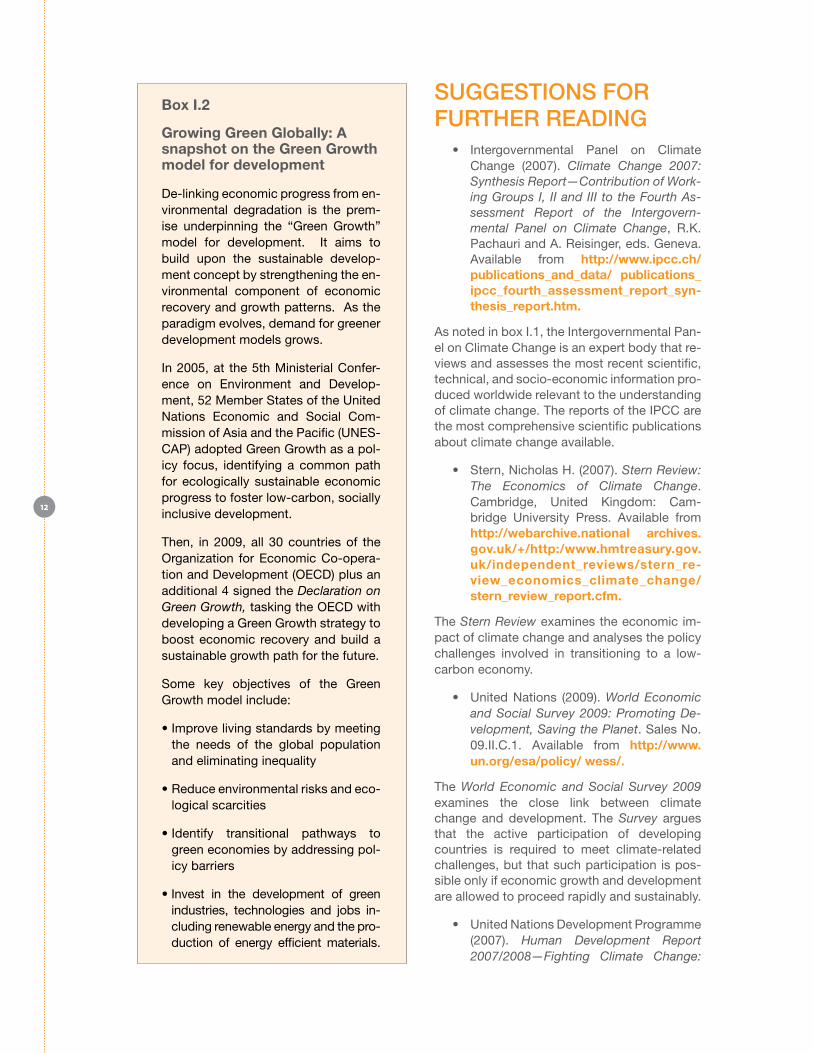
growing green globally: A snapshot on the green growth model for development
De-linking economic progress from en-vironmental degradation is the prem-ise underpinning the “Green Growth” model for development. It aims to build upon the sustainable develop-ment concept by strengthening the en-vironmental component of economic recovery and growth patterns. As the paradigm evolves, demand for greener development models grows.
In 2005, at the 5th Ministerial Confer-ence on Environment and Develop-ment, 52 Member States of the United Nations Economic and Social Com-mission of Asia and the Pacific (UNES-CAP) adopted Green Growth as a pol-icy focus, identifying a common path for ecologically sustainable economic progress to foster low-carbon, socially inclusive development.
Then, in 2009, all 30 countries of the Organization for Economic Co-opera-tion and Development (OECD) plus an additional 4 signed the Declaration on Green Growth, tasking the OECD with developing a Green Growth strategy to boost economic recovery and build a sustainable growth path for the future.
Some key objectives of the Green Growth model include:
• Improve living standards by meeting the needs of the global population and eliminating inequality
• Reduce environmental risks and eco-logical scarcities
• Identify transitional pathways to green economies by addressing pol-icy barriers
• Invest in the development of green industries, technologies and jobs in-cluding renewable energy and the pro-duction of energy efficient materials.
sUggestIons FoR FURtHeR ReAdIng
• Intergovernmental Panel on Climate Change (2007). Climate Change 2007: Synthesis Report—Contribution of Work-ing Groups I, II and III to the Fourth As-sessment Report of the Intergovern-mental Panel on Climate Change, R.K. Pachauri and A. Reisinger, eds. Geneva. Available from http://www.ipcc.ch/publications_and_data/ publications_ipcc_fourth_assessment_report_syn-thesis_report.htm.
As noted in box I.1, the Intergovernmental Pan-el on Climate Change is an expert body that re-views and assesses the most recent scientific, technical, and socio-economic information pro-duced worldwide relevant to the understanding of climate change. The reports of the IPCC are the most comprehensive scientific publications about climate change available.
• Stern, Nicholas H. (2007). Stern Review: The Economics of Climate Change. Cambridge, United Kingdom: Cam-bridge University Press. Available from http://webarchive.national archives.gov.uk/+/http:/www.hmtreasury.gov.uk/independent_reviews/stern_re-view_economics_climate_change/stern_review_report.cfm.
The Stern Review examines the economic im-pact of climate change and analyses the policy challenges involved in transitioning to a low-carbon economy.
• United Nations (2009). World Economic and Social Survey 2009: Promoting De-velopment, Saving the Planet. Sales No. 09.II.C.1. Available from http://www.un.org/esa/policy/ wess/.
The World Economic and Social Survey 2009 examines the close link between climate change and development. The Survey argues that the active participation of developing countries is required to meet climate-related challenges, but that such participation is pos-sible only if economic growth and development are allowed to proceed rapidly and sustainably.
• United Nations Development Programme (2007). Human Development Report 2007/2008—Fighting Climate Change:
12
13
Human Solidarity in a Divided World. Basingstoke, United Kingdom: Palgrave Macmillan. Available from http://hdr.undp.org/en/media/HDR_2007_2008_EN_Complete.pdf.
The Human Development Report 2007/2008 addresses the present and future impact of climate change on human development. The Report offers a comprehensive look at the so-cial, economic, political, and human aspects of climate change in developing countries.
• United Nations Development Programme and Peace Child International (2008). Two Degrees of Separation between Hope and Despair. A Young People’s Summary of the 2007/2008 Human Development Report—Fighting Climate Change: Hu-man Solidarity in a Divided World. New York and Buntingford, United Kingdom. Available from http://hdr.undp.org/en/media/Two_Degrees_En.pdf.
Jointly published by the United Nations Devel-opment Programme and Peace Child Interna-tional, this summary of the Human Develop-ment Report 2007/2008 was produced by and for young people.
• United Nations Population Fund (2009). At the Frontier: Young People and Cli-mate Change—UNFPA State of World Population 2009: Youth Supplement. Sales No. E.09.IIII.H.2. Available from http://www.unfpa.org/swp/2009/en/pdf/EN_YSWoP09.pdf.
This supplement to the United Nations Popula-tion Fund’s State of World Population 2009 in-cludes a compilation of first-hand accounts by young people from all parts of the world about how climate change is affecting their present lives and future prospects.
• World Wide Fund for Nature (2009). The New Climate Deal: A Pocket Guide. Gland, Switzerland. Available from http://assets.panda.org/downloads/wwf_climate_deal_1.pdf.
Produced by the World Wide Fund for Nature (formerly the World Wildlife Fund) during the period leading up to COP 15, this guide pro-vides a critical perspective on climate change and a call to action for all Governments to ad-dress relevant challenges.
cH
AP
te
R II
cHAPteR IICompromised futures? Youth development and the effects of climate change
Climate change is a real phenomenon, and its effects are apparent. There are important tipping points that may already have been reached or passed, causing irreversible dam-age to many human and ecological systems.
15
As highlighted in chapter I, the warming tem-peratures driving climate change can have a direct impact on human activities, and their negative effects can be compounded by ex-isting ecological and social situations. The im-pact of climate change is, and will continue to be, exacerbated by a variety of interlinked and overlapping factors, undermining the health and safety of populations, compromising food security, threatening livelihoods, and eroding economic security (Intergovernmental Panel on Climate Change, 2007a).
Although climate change affects individuals of all ages, young people can expect to bear a particularly heavy burden because they will live longer and will face this challenge through-out their lifetimes. The situation of youth in less developed countries is especially tenuous. The combination of geography, geology, and un-even social and economic development has made those living in certain areas of Africa, Asia, and the Small Island Developing States (SIDS) more vulnerable than others to climate change and its consequences. In some of the countries within these regions, youth make up as much as one third of the population (United Nations, 2009c), and many of them are already facing a difficult transition to adulthood owing to social and economic instability and wide-spread poverty. Should climate change con-tinue unabated, existing deficits and limitations could deepen. Such a situation would have im-mediate and short-term effects on youth and their communities, but it could also pose a major threat within the long-term trajectory of global development. As noted in chapter I, the young women and men living in Africa and Asia represent the vast majority of the world’s youth. Failing to address climate-related challenges that can undermine their successful integration into society could ultimately perpetuate or even exacerbate widespread poverty and inequality.
In this chapter the relationship between youth development and the impact of climate change is examined. Particular attention is given to the development of young people in those con-texts most vulnerable to the effects of climate change, including health and safety, food secu-rity, and livelihood stability. Migration and con-flict are also explored as possible consequenc-es of climatic instability. The chapter raises the question of compromised futures: Will climate change hinder the ability of young women and
men to participate fully in society, and can ad-dressing climate change bring about a better future?
The compound effects of climate change on health and safety
Good health constitutes an essential asset, as it lies at the core of human capacity to function effectively in any society. Unless timely and ef-fective action is taken, extreme weather events, water scarcity, higher sustained temperatures, and other phenomena associated with climate change are likely to pose a serious threat to hu-man health and safety.
Extreme weather events increase health hazards…
Extreme weather events constitute a serious natural hazard and can affect human health and safety both directly and indirectly. They are often responsible for physical injury and loss of life, and they may exacerbate already sub-standard living conditions, increasing the expo-sure of vulnerable residents to many types of disease (Abatzoglou and others, 2007; United Nations Development Programme, Bureau for Crisis Prevention and Recovery, 2004). The incidence of extreme weather is expected to grow with climate change. In fact, the frequen-cy and intensity of many natural hazards have already increased. Since 1980 the number of people affected by extreme weather events has doubled, and by 2015 it could increase by an-other 50 per cent. Between 1980 and 2007, 98 per cent of those affected by natural disasters were the victims of climate-related events (Ga-neshan and Diamond, 2009).
Many young people live in areas where extreme weather events tend to hit hardest. In parts of sub-Saharan Africa, the risk of drought is rel-atively high, while in the coastal areas of this subregion and in South Asia, Central America, and the Caribbean and Pacific islands, seri-ous flooding poses the greatest threat (United Nations Development Programme, Bureau for Crisis Prevention and Recovery, 2004). The intensification of extreme weather events is likely to be a major factor affecting the health and safety of many youth living in these areas, especially those residing in South Asia, Cen-tral America, and the small island developing States of the Caribbean and Pacific regions

16
(United Nations Development Programme, Bu-reau for Crisis Prevention and Recovery, 2004; Center for Hazards and Risk Research at Co-lumbia University, 2005).
While extreme weather events are more likely to affect the subregions mentioned above, other parts of the world are vulnerable as well, as climate change is a truly global phenom-enon. Populations unaccustomed to particular natural hazards often do not have adequate response mechanisms in place. An upsurge in demand for emergency services and supplies following a natural disaster may put a severe strain on institutions, creating a force multiplier effect whereby health concerns are elevated to a health and safety crisis.
…particularly where sanitation is poor and wastewater management insufficient
In many of these contexts, the higher incidence of extreme weather events combined with poor sanitation can give rise to pervasive health threats. Climate change is often associated with periods of excessive or insufficient pre-cipitation. Where flooding occurs the water can become contaminated with human and animal excrement, while extended drought can reduce the amount of water available for washing and sanitation. Under such circumstances, cholera, typhoid and diarrhoeal diseases can flourish (McMichael and others, 2003; Prüss-Üstün, Bos, and Gore, 2008).
More than a quarter of the world’s youth live in countries where at least two thirds of the population does not have access to adequate sanitation (World Health Organization and Unit-ed Nations Children’s Fund, 2006). All of these countries are in Africa, Asia, or Oceania. Ac-cording to the Townsend Centre for Interna-tional Poverty Research, some 30-50 per cent of youth in most African countries are deprived of adequate sanitation, and the situation is the same for at least 30 per cent of young people in six Asian countries (United Nations, 2007b). Health conditions can deteriorate rapidly un-der circumstances such as these. At present, the incidence of diarrhoeal diseases potential-ly attributable to climate change is highest in South-East Asia, where more than 100 million young women and men reside (United Nations
Framework Convention on Climate Change, 2007a; United Nations, 2009c).
Even in countries with adequate sanitation and water treatment facilities, extreme weath-er events may disrupt water supplies as sys-tems are overloaded during and after intense storm activity. Water contaminated with bio-logical and chemical toxins (wastewater) may spill over into bodies of water and agricultural lands. Wastewater exposure and consumption not only threatens human health but may also devastate ecosystems.
Reduced access to clean water com-promises health
Climate change has a direct impact on water quality, with negative implications for health. Clean water is essential for survival (Prüss-Üstün, Bos and Gore, 2008). However, potable supplies will come under growing pressure as the warming temperatures associated with climate change increase water pollution from bacterial growth and algal blooms (Intergov-ernmental Panel on Climate Change, 2007b), leading to a rise in the transmission of diar-rhoeal diseases and bacterial infections—often with deadly consequences. Already, more than 560 million African youth do not have access to safe drinking water (United Nations, 2007b).
Extended periods of drought expected in some areas as a result of climate change could further limit access to clean water for many, leading to health consequences associated with malnutri-tion, dehydration, and inadequate sanitation.
Higher temperatures increase expo-sure to disease…
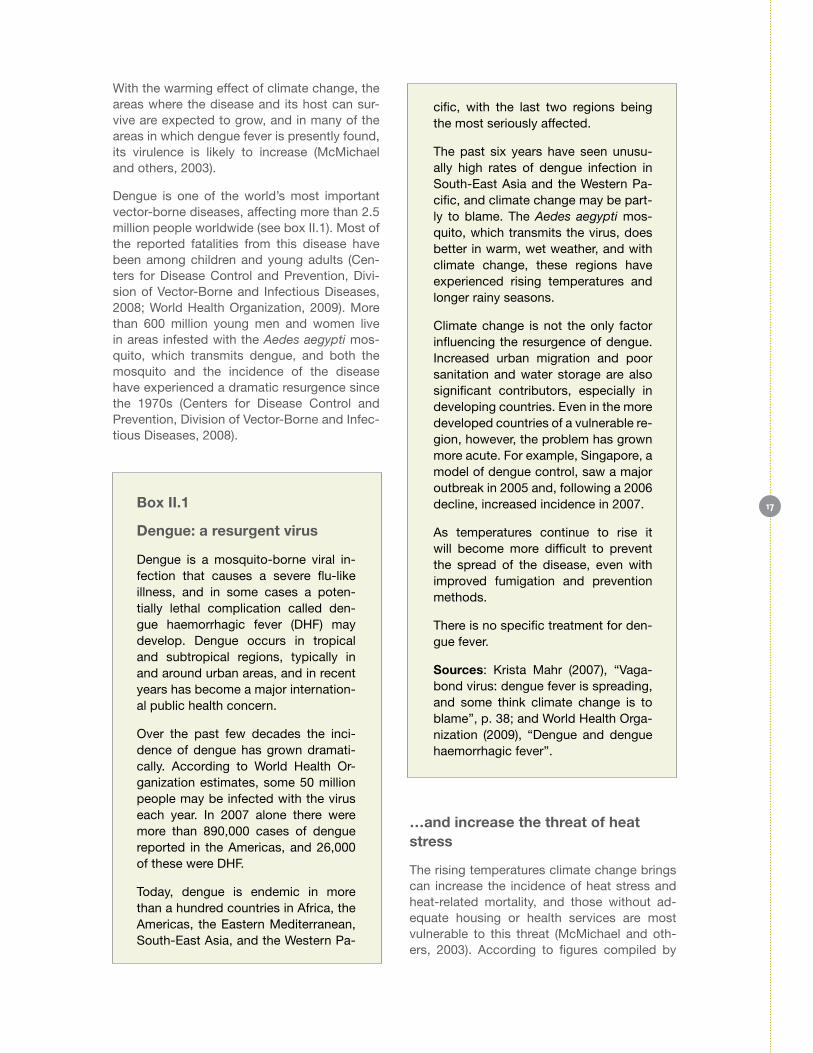
Not all of the manifestations of climate change with implications for health are as dramatic as the extreme weather events and water scar-city issues addressed above. The fact is that the warming temperatures alone can increase youth exposure to health risks, including vec-tor-borne diseases. A prime example is dengue fever, which has been identified by the World Health Organization as one of the endemic dis-eases to which a significant proportion of the global population will be exposed. The geog-raphy of this disease is related to consistently warm temperatures and adequate precipitation.
17
With the warming effect of climate change, the areas where the disease and its host can sur-vive are expected to grow, and in many of the areas in which dengue fever is presently found, its virulence is likely to increase (McMichael and others, 2003).
Dengue is one of the world’s most important vector-borne diseases, affecting more than 2.5 million people worldwide (see box II.1). Most of the reported fatalities from this disease have been among children and young adults (Cen-ters for Disease Control and Prevention, Divi-sion of Vector-Borne and Infectious Diseases, 2008; World Health Organization, 2009). More than 600 million young men and women live in areas infested with the Aedes aegypti mos-quito, which transmits dengue, and both the mosquito and the incidence of the disease have experienced a dramatic resurgence since the 1970s (Centers for Disease Control and Prevention, Division of Vector-Borne and Infec-tious Diseases, 2008).
box II.1
Dengue: a resurgent virus
Dengue is a mosquito-borne viral in-fection that causes a severe flu-like illness, and in some cases a poten-tially lethal complication called den-gue haemorrhagic fever (DHF) may develop. Dengue occurs in tropical and subtropical regions, typically in and around urban areas, and in recent years has become a major internation-al public health concern.
Over the past few decades the inci-dence of dengue has grown dramati-cally. According to World Health Or-ganization estimates, some 50 million people may be infected with the virus each year. In 2007 alone there were more than 890,000 cases of dengue reported in the Americas, and 26,000 of these were DHF.
Today, dengue is endemic in more than a hundred countries in Africa, the Americas, the Eastern Mediterranean, South-East Asia, and the Western Pa-
cific, with the last two regions being the most seriously affected.
The past six years have seen unusu-ally high rates of dengue infection in South-East Asia and the Western Pa-cific, and climate change may be part-ly to blame. The Aedes aegypti mos-quito, which transmits the virus, does better in warm, wet weather, and with climate change, these regions have experienced rising temperatures and longer rainy seasons.
Climate change is not the only factor influencing the resurgence of dengue. Increased urban migration and poor sanitation and water storage are also significant contributors, especially in developing countries. Even in the more developed countries of a vulnerable re-gion, however, the problem has grown more acute. For example, Singapore, a model of dengue control, saw a major outbreak in 2005 and, following a 2006 decline, increased incidence in 2007.
As temperatures continue to rise it will become more difficult to prevent the spread of the disease, even with improved fumigation and prevention methods.
There is no specific treatment for den-gue fever.
Sources: Krista Mahr (2007), “Vaga-bond virus: dengue fever is spreading, and some think climate change is to blame”, p. 38; and World Health Orga-nization (2009), “Dengue and dengue haemorrhagic fever”.
…and increase the threat of heat stress
The rising temperatures climate change brings can increase the incidence of heat stress and heat-related mortality, and those without ad-equate housing or health services are most vulnerable to this threat (McMichael and oth-ers, 2003). According to figures compiled by

18
the Townsend Centre for International Poverty Research, more than half of all African youth lack adequate shelter, and the same is true for more than one third of young people in some countries in Asia and in Latin America and the Caribbean (United Nations, 2007b). It is these youth who are most likely to feel the heat.
The food security dilemma
Food security is already being threatened by climatic shifts. This issue raises important concerns about hunger, poverty, health, and productivity—and therefore about broader prospects for human development. Food avail-ability and access constitute one of the most basic and essential requirements for maintain-ing healthy and productive lives. At present, hunger and malnutrition combined comprise the number-one threat to human health (World Food Programme, 2009). Climate change will continue to affect all aspects of food security, especially in Africa, Asia, and Latin America and the Caribbean (Bates and others, 2008; Food and Agriculture Organization of the United Na-tions, 2009b), where more than 1 billion young men and women live (United Nations, 2009c).
Food insecurity is likely to be particularly chal-lenging for developing countries that are vul-nerable to extreme weather events and that have low incomes and a high incidence of hun-ger and poverty (Intergovernmental Panel on Climate Change, 2007b; Food and Agriculture Organization of the United Nations, 2009b). Residents of these areas are already at risk and will find it hard to overcome the food produc-tion and income losses resulting from extreme weather events. Such a situation could mean short-term and long-term losses in food avail-ability and access. Short-term infrastructural damage from extreme weather events of grow-ing intensity may also make food distribution
difficult.
Young women are likely to be the most seri-ously affected by compromised food security. The results of research carried out in India indi-cate that nutritional deficits are greater among girls than among boys when food is scarce and/or when food prices are high. The research also shows that rainfall shortages, which serve to reduce food availability, are more strongly correlated with death among girls than among
boys (Stern, 2007). Distinct social and cultural preferences and customs affecting girls and boys translate into different gender-specific vulnerabilities within and across regions. In most cases, these norms work to the detriment of young females (United Nations Children’s Fund, Innocenti Research Centre, 2008).
Much of the potential threat to food security comes from the negative effect climate change could have on agriculture. Agricultural produc-tivity could decline between 9 and 21 per cent in developing countries as a result of climate change (Food and Agriculture Organization of the United Nations, 2009b). It is likely that such a decrease would derive largely from shifts in hydrological patterns and compromised water availability, as agriculture accounts for 70 per cent of global water use (Bates and others, 2008; Food and Agriculture Organization of the United Nations, 2009a).
Projections indicate that with the combina-tion of climate change, population growth, and the consequent increase in demand for food, energy, and biofuels, almost half of the global population could be living in areas of high wa-ter stress by 2030 (United Nations World Water Assessment Programme, 2009). The anticipat-ed rise in temperatures and sea levels owing to climate change will affect the availability of freshwater sources, with a negative impact on both quantity and quality. In addition, the rate of glacier and snow-cover retreat is likely to increase throughout the twenty-first century, reducing water availability and hydropower potential and changing the seasonality of melt-water flows in regions where major mountain ranges are key water supply sources (Intergov-ernmental Panel on Climate Change, 2007b).
Rice, wheat, and maize production has de-clined in some parts of Asia because of the in-crease in water stress brought about by climate change. At present, the world’s highest rates of malnutrition attributable to climate change are found in South-East Asia (United Nations Framework Convention on Climate Change, 2007a; Bates and others, 2008). Communities in China, India, and Pakistan, which together account for more than 40 per cent of the world’s youth, will be especially hard hit by the reduc-tion in meltwater flows from the Himalayas and other high, mountainous areas. In fact, India is

19
20
expected to be in a state of water stress before 2025 (United Nations Environment Programme/
GRID-Arendal, 2007; Bates and others, 2008).
Hardest hit by compromised food security will be the rural areas of Africa (Food and Agricul-ture Organization of the United Nations, 2009b), where more than half of the region’s young people live (United Nations, 2008). The greatest challenge within this context will arise from the impact of climate change on water resources. In rural Africa, groundwater and rainfall are es-sential inputs for food production and are the main sources of potable water. One area cur-rently experiencing a serious water deficit is the Sahel region, where longer and more intense droughts constitute one of the most dramatic climatic changes recorded in any region. The situation is expected to worsen in the coming years, affecting more than 60 million young women and men (Bates and others, 2008). Out-side the Sahel, groundwater supplies are ex-pected to decrease by as much as 10 per cent, even with a 1ºC increase in temperature (Bates and others, 2008).
Although the less developed nations are like-ly to face the greatest threat to food security, developed countries may be affected as well. In northern Australia and the southern United States, for example, food production could decline as a result of drier surface conditions (Cline, 2007). These countries are much better prepared to deal with such a challenge, how-ever, as any projected losses are buffered by the relative strength and stability of their econ-omies (Intergovernmental Panel on Climate Change, 2007a).
Climate change mitigation and food security: an added challenge?
Ironically, some climate change mitigation ef-forts may themselves undermine food security, especially in less developed areas. The produc-tion of biofuels and other forms of bioenergy presents one of the greatest challenges in this regard (Food and Agriculture Organization of the United Nations, 2009a). Bioenergy is the largest new source of agricultural demand in recent years, and this has important implica-tions for food production and availability in areas where agricultural capacity is diminish-ing. It takes a lot more grain to power the world than to feed it; the corn equivalent of the en-
ergy used for a few minutes of driving would feed a person for an entire day, and that same person could be fed for a year with the equiva-lent energy burned from a full tank of ethanol in a four-wheel-drive sports utility vehicle (Nel-leman and others, 2009). As noted above, the growing prevalence of this type of agricultural production will also contribute to increased wa-ter stress (United Nations World Water Assess-ment Programme, 2009).
With the rising demand for biofuel the com-modity value of feedstock grains will increase, making the production of corn and other source crops more profitable. However, this will pose a problem for areas lacking economic security, as the added value means higher food prices in the short and long terms and therefore reduced access to food (Food and Agriculture Organiza-tion of the United Nations, 2009a). Such pres-sures are already being felt: increased biofuel production was identified as one of the factors contributing to the food crisis in early 2008, which led to food riots in some countries. By 2016, food prices are expected to rise by 20 to 50 per cent (Organization for Economic Coop-eration and Development and Food and Agricul-ture Organization of the United Nations, 2008).
tHe ImPAct oF clImAte cHAnge on YoUng PeoPle’s lIVelIHoods Climate change is likely to affect employment patterns in different ways. Rates of unemploy-ment are already higher among youth than among adults, and with most of the world’s young people living in areas where depen-dence on natural resources and persistent poverty intersect, climate change could pose a serious threat to youth livelihood patterns and economic stability. On a more positive note, adaptation and mitigation efforts are opening the door to a new category of employment—green jobs—across a multitude of sectors, and young people could be the segment of the la-bour market best positioned to access them. However, as previously indicated, this new type of employment may be linked to other develop-ment challenges.
21
Negative consequences
As is the case in many of the other contexts described thus far, youth in developing coun-tries—especially those in rural areas—are likely to feel the impact of climate change on their livelihoods sooner and more directly than will their peers in developed countries (see box II.2). The more socio-economically vulnerable regions include many communities that depend on the natural environment for their livelihoods, with employment concentrated in sectors such as agriculture, forestry, and fisheries. The ef-fects of climate change on these sectors will vary, but the outlook is largely negative for the developing world as a whole (Intergovernmen-tal Panel on Climate Change, 2007a; Food and Agriculture Organization of the United Nations, 2009b; 2009c). Agriculture is one of the larg-est and most important employment sectors, but it is also extremely vulnerable to climate-related damage. In the short term, agricultural production is threatened by soil degradation and erosion, crop damage, and reduced har-vests resulting from extreme weather events such as droughts, heatwaves, severe storms, and floods—all of which are expected to oc-cur with greater frequency and intensity. The situation may be exacerbated in the long term by the higher sustained temperatures and sys-temic water scarcity linked to climate change. (Intergovernmental Panel on Climate Change, 2007b; International Assessment of Agricul-tural Knowledge, Science and Technology for Development, 2009).
The pressure climate change is exerting on traditional livelihood patterns will intensify throughout the lives of today’s young women and men if the agriculture sector continues to be the major source of employment in the developing world. At present, agriculture ac-counts for almost half of all employment in less developed countries (United Nations Develop-ment Programme, 2007). In Africa the majority of young people live in rural areas, where ag-riculture accounts for 65 per cent of total em-ployment (World Bank, 2008a). In several Asian countries youth employment has largely shifted to industry or services, but agriculture remains a significant source of employment for young workers (Asian Development Bank, 2008).
box II.2
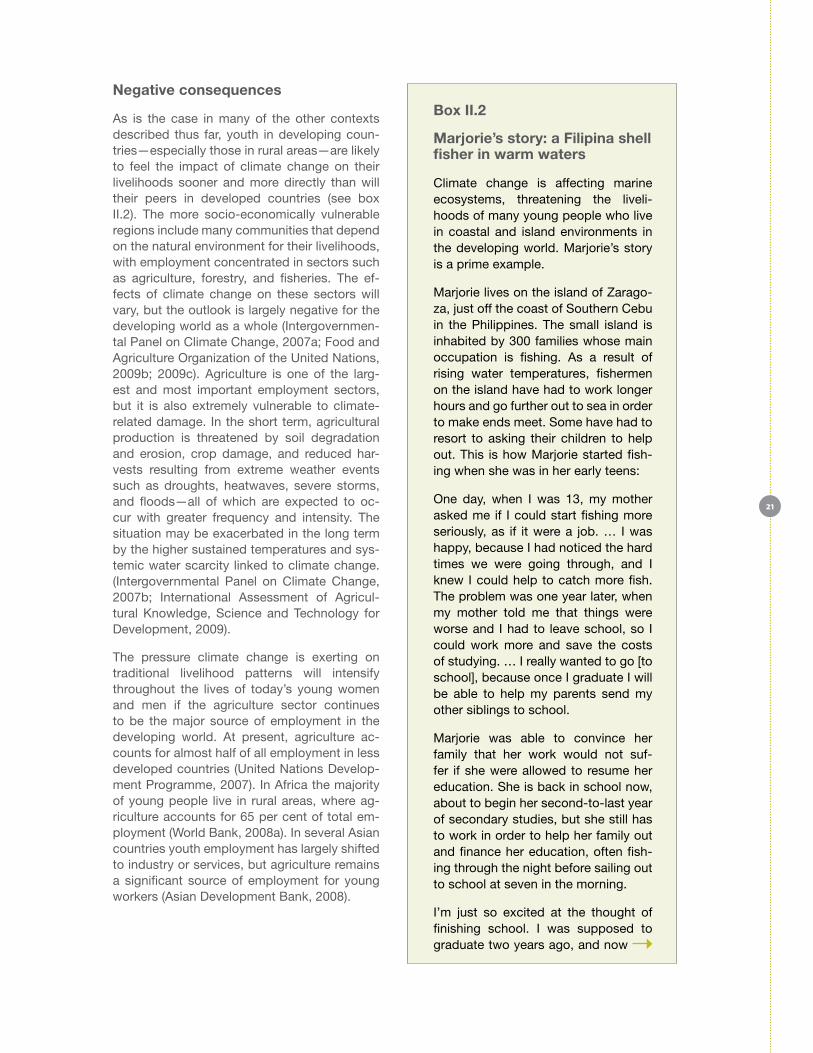
Marjorie’s story: a Filipina shell fisher in warm waters
Climate change is affecting marine ecosystems, threatening the liveli-hoods of many young people who live in coastal and island environments in the developing world. Marjorie’s story is a prime example.
Marjorie lives on the island of Zarago-za, just off the coast of Southern Cebu in the Philippines. The small island is inhabited by 300 families whose main occupation is fishing. As a result of rising water temperatures, fishermen on the island have had to work longer hours and go further out to sea in order to make ends meet. Some have had to resort to asking their children to help out. This is how Marjorie started fish-ing when she was in her early teens:
One day, when I was 13, my mother asked me if I could start fishing more seriously, as if it were a job. … I was happy, because I had noticed the hard times we were going through, and I knew I could help to catch more fish. The problem was one year later, when my mother told me that things were worse and I had to leave school, so I could work more and save the costs of studying. … I really wanted to go [to school], because once I graduate I will be able to help my parents send my other siblings to school.
Marjorie was able to convince her family that her work would not suf-fer if she were allowed to resume her education. She is back in school now, about to begin her second-to-last year of secondary studies, but she still has to work in order to help her family out and finance her education, often fish-ing through the night before sailing out to school at seven in the morning.
I’m just so excited at the thought of finishing school. I was supposed to graduate two years ago, and now

22
I’m afraid that I won’t be able to make it. … If I don’t [graduate], people will assume that I don’t know anything and I won’t be able to work in the city. … If here on the island there were fish like before, I would stay, because people lived well here. But now, with the cli-mate change, it’s impossible to make a living here.
Source: Summarized and excerpted from United Nations Population Fund (2009), At the Frontier: Young People and Climate Change.
For youth in developed countries the impact of climate change on employment opportunities may not be as negative. In industrialized na-tions young people tend to be overrepresented in the service sector, which is less likely to be affected by changing weather trends. Statis-tics for 2007 indicate that in New Zealand, 25 per cent of youth aged 15-24 years were em-ployed in the retail industry and another 12 per cent worked in the accommodation, cafes, and restaurants sector, compared with respective rates of 13 and 5 per cent for all workers (New Zealand Department of Labour, 2007). A similar picture emerges from youth employment data in the United States; in 2008, 18 per cent of young people between the ages of 16 and 24 were employed in retail trade, and 23 per cent worked in the leisure and hospitality indus-try (United States Bureau of Labor Statistics, 2008). Although the service sector appears to be less vulnerable than many other sectors to the consequences of climate change, there may be some negative long-term effects, espe-cially in the hospitality industry, as the impact of climate change on snowcaps, waterways, and coastal environments may reduce the ap-peal of many popular tourist destinations.
Potential positive consequences— including green jobs
Shifting perspectives on sustainable develop-ment, including concerns over climate change, have created a growing market for green jobs across many sectors including energy sup-ply, recycling, agriculture, and transportation. Green jobs represent an opportunity to make development truly sustainable, as they are spe-
cifically geared towards reducing the ecologi-cal footprint of economic activities. Simultane-ously, they can play an important role in efforts to address rising unemployment. Green jobs will be explored in greater detail in chapter III.
tHe mIgRAtIon eqUAtIonThe nature and extent of the impact of climate change on human population distribution re-mains unclear. Historically, migration has been an important coping strategy for dealing with climate stress (Brown, 2008; Raleigh, Jordan and Salehyan, 2008). In Africa, droughts and floods have led to increased reliance on migra-tion as an adaptation measure (Bates and oth-ers, 2008); over the past 20 years more than 10 million people in the region have been dis-placed owing to environmental degradation and desertification (International Organization for Migration, 2009). In the Sahel, reduced ag-ricultural yields have been a key factor driving migration for roughly 30 years (Brown, 2008); climate change will continue to undermine ag-ricultural productivity in the area and may be responsible for prolonged periods of drought (Intergovernmental Panel on Climate Change, 2007a), further threatening the livelihoods of the nearly 60 million young women and men living there.
Analysing climate-induced migration can be difficult. There is no consensus on the defini-tion or measurement of this phenomenon, and very little relevant data are available. Moreover, migration flows in general have proven hard to predict. Nevertheless, it is reasonably safe to assert that over the next few decades more people may choose—or be forced—to move in response to the impact of climate change (Inter-national Organization for Migration, 2009). The nature and extent of climate-induced migration in the years to come will depend on a number of factors, including GHG emission levels, local population growth and distribution rates, the effects of climate change on weather patterns, and the success or failure of efforts undertaken by local and national communities to adapt to the changes. The motivation to migrate will be strongest among those whose economic secu-rity is seriously threatened or compromised by extreme weather events, water scarcity, and/or higher temperatures. It is virtually impossible
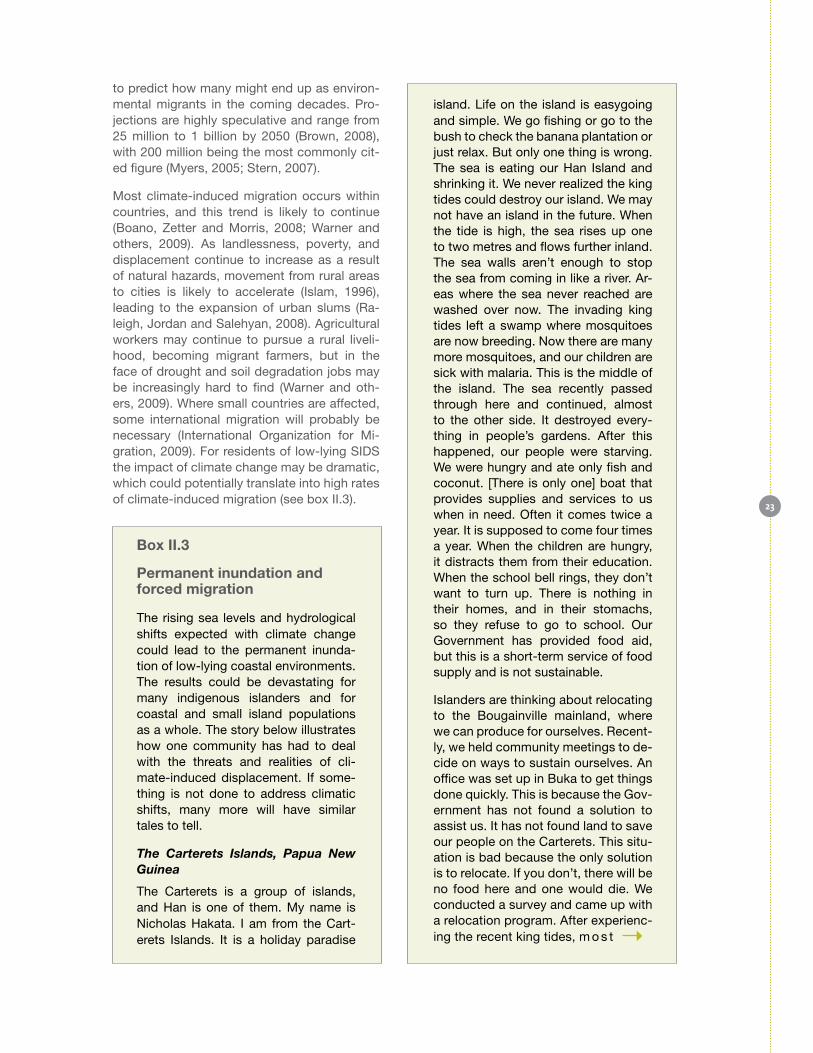
23
to predict how many might end up as environ-mental migrants in the coming decades. Pro-jections are highly speculative and range from 25 million to 1 billion by 2050 (Brown, 2008), with 200 million being the most commonly cit-ed figure (Myers, 2005; Stern, 2007).
Most climate-induced migration occurs within countries, and this trend is likely to continue (Boano, Zetter and Morris, 2008; Warner and others, 2009). As landlessness, poverty, and displacement continue to increase as a result of natural hazards, movement from rural areas to cities is likely to accelerate (Islam, 1996), leading to the expansion of urban slums (Ra-leigh, Jordan and Salehyan, 2008). Agricultural workers may continue to pursue a rural liveli-hood, becoming migrant farmers, but in the face of drought and soil degradation jobs may be increasingly hard to find (Warner and oth-ers, 2009). Where small countries are affected, some international migration will probably be necessary (International Organization for Mi-gration, 2009). For residents of low-lying SIDS the impact of climate change may be dramatic, which could potentially translate into high rates of climate-induced migration (see box II.3).
box II.3
Permanent inundation and forced migration
The rising sea levels and hydrological shifts expected with climate change could lead to the permanent inunda-tion of low-lying coastal environments. The results could be devastating for many indigenous islanders and for coastal and small island populations as a whole. The story below illustrates how one community has had to deal with the threats and realities of cli-mate-induced displacement. If some-thing is not done to address climatic shifts, many more will have similar tales to tell.
The Carterets Islands, Papua New Guinea
The Carterets is a group of islands, and Han is one of them. My name is Nicholas Hakata. I am from the Cart-erets Islands. It is a holiday paradise
island. Life on the island is easygoing and simple. We go fishing or go to the bush to check the banana plantation or just relax. But only one thing is wrong. The sea is eating our Han Island and shrinking it. We never realized the king tides could destroy our island. We may not have an island in the future. When the tide is high, the sea rises up one to two metres and flows further inland. The sea walls aren’t enough to stop the sea from coming in like a river. Ar-eas where the sea never reached are washed over now. The invading king tides left a swamp where mosquitoes are now breeding. Now there are many more mosquitoes, and our children are sick with malaria. This is the middle of the island. The sea recently passed through here and continued, almost to the other side. It destroyed every-thing in people’s gardens. After this happened, our people were starving. We were hungry and ate only fish and coconut. [There is only one] boat that provides supplies and services to us when in need. Often it comes twice a year. It is supposed to come four times a year. When the children are hungry, it distracts them from their education. When the school bell rings, they don’t want to turn up. There is nothing in their homes, and in their stomachs, so they refuse to go to school. Our Government has provided food aid, but this is a short-term service of food supply and is not sustainable.
Islanders are thinking about relocating to the Bougainville mainland, where we can produce for ourselves. Recent-ly, we held community meetings to de-cide on ways to sustain ourselves. An office was set up in Buka to get things done quickly. This is because the Gov-ernment has not found a solution to assist us. It has not found land to save our people on the Carterets. This situ-ation is bad because the only solution is to relocate. If you don’t, there will be no food here and one would die. We conducted a survey and came up with a relocation program. After experienc-ing the recent king tides, m o s t
24
islanders want to relocate and very quickly. We are also learning which skills and resources we can take to the mainland. We need to relocate 120 families. But we need finances to do this. We need 6 million kina [US$ 2 mil-lion] to build houses and other facilities for housing 120 families on the main island of Bougainville. In the future, we plan to come back to these reefs and manage them as our fishing ground. Our reefs will be a source of income, and our children will come back and connect with their ancestral homeland.
Source: Nicholas Hakata (personal communication).
It is difficult to predict the extent to which young people will take part in environmental migra-tion. On the one hand, research on famine relief has shown that in situations of induced migra-tion those without dependants usually leave first, followed by older men and then families (Raleigh, Jordan and Salehyan, 2008). This pat-tern implies that a first wave of climate-induced migration may involve mostly male youth. On the other hand, the ability to migrate is a func-tion of mobility, and prospects for success are heavily influenced by factors such as access to money, family networks, and contacts at the destination (Brown, 2008)—a reality that could limit the migratory flows of young men and women who are just beginning the process of integration into productive society.
A higher probability of conflict may also be linked to climate change and migration. The relationship between these three factors is dif-ficult to define, as it involves many causal path-ways and interlinkages. Essentially, though, it revolves around disputes over scarce resourc-es—a situation that could both lead to and arise from migrant flows (Boano, Zetter and Morris, 2008). Whatever the causes, increased conflict of any kind could significantly undermine youth development.
Climate, conflict, and youth
The relationship between climate change and conflict is complex but derives primarily from reduced economic security, increased resource scarcity (especially in areas economically de-pendent on natural resources), and the circum-stances surrounding displacement (Ohlsson, 2000; United Nations Environment Programme, 2009). These three factors are likely to have a significant impact on the world’s largest youth cohorts in Africa and Asia, where rural liveli-hoods and natural resource dependence are dominant.
As figure II.1 illustrates, many of the factors that push youth into situations of conflict—in-cluding economic instability, social and politi-cal exclusion, unemployment, dissatisfaction with public services, and the breakdown of traditional family and social networks (United States Agency for International Development, 2005)—may be exacerbated by the effects of climate change.
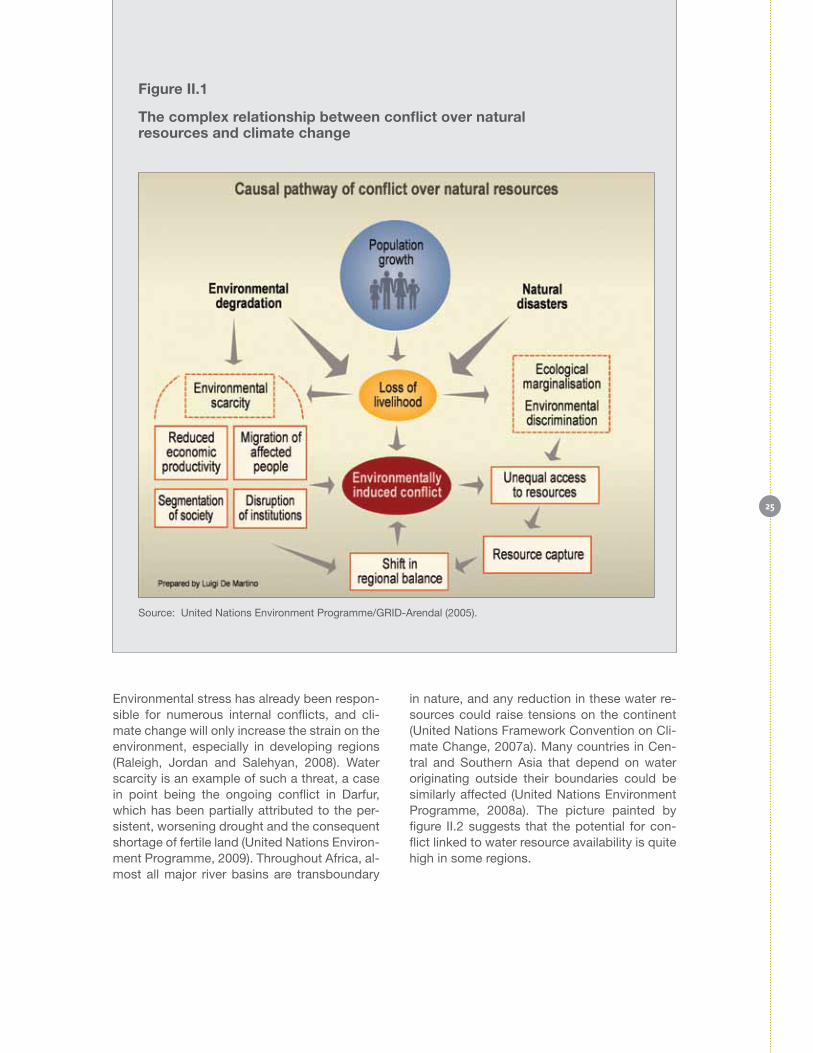
25
Environmental stress has already been respon-sible for numerous internal conflicts, and cli-mate change will only increase the strain on the environment, especially in developing regions (Raleigh, Jordan and Salehyan, 2008). Water scarcity is an example of such a threat, a case in point being the ongoing conflict in Darfur, which has been partially attributed to the per-sistent, worsening drought and the consequent shortage of fertile land (United Nations Environ-ment Programme, 2009). Throughout Africa, al-most all major river basins are transboundary
in nature, and any reduction in these water re-sources could raise tensions on the continent (United Nations Framework Convention on Cli-mate Change, 2007a). Many countries in Cen-tral and Southern Asia that depend on water originating outside their boundaries could be similarly affected (United Nations Environment Programme, 2008a). The picture painted by figure II.2 suggests that the potential for con-flict linked to water resource availability is quite high in some regions.
Source: United Nations Environment Programme/GRID-Arendal (2005).
Figure II.1
The complex relationship between conflict over natural resources and climate change
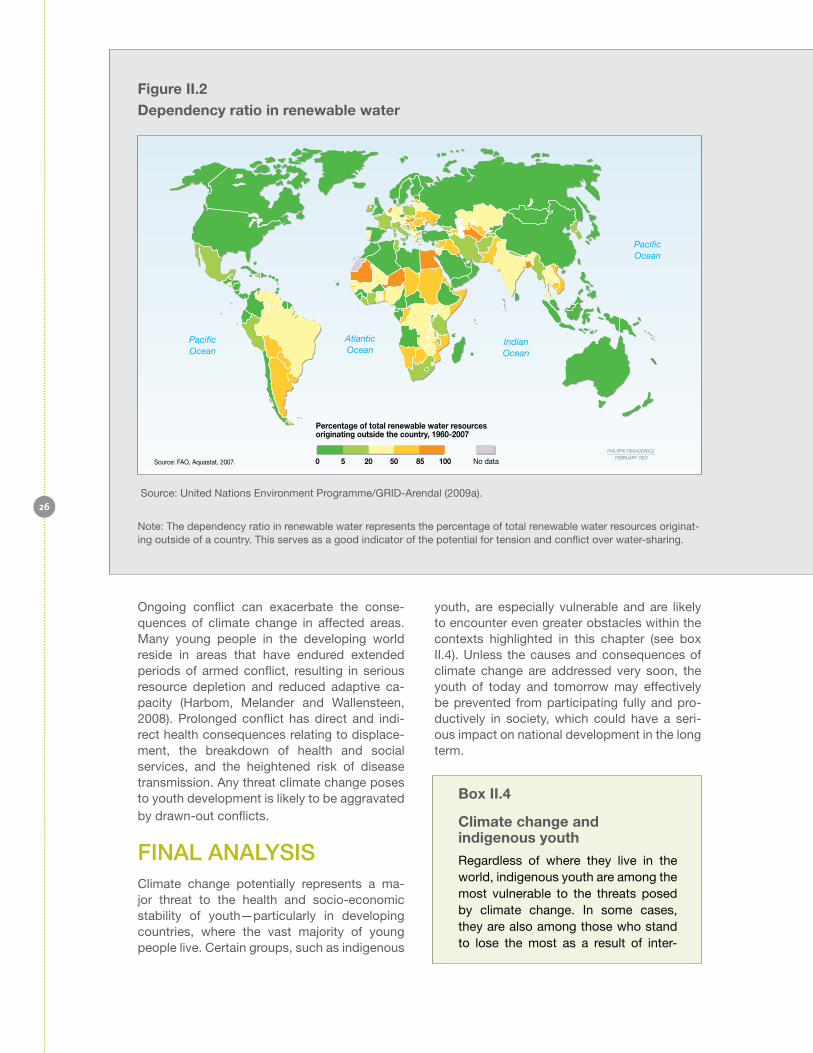
26
Ongoing conflict can exacerbate the conse-quences of climate change in affected areas. Many young people in the developing world reside in areas that have endured extended periods of armed conflict, resulting in serious resource depletion and reduced adaptive ca-pacity (Harbom, Melander and Wallensteen, 2008). Prolonged conflict has direct and indi-rect health consequences relating to displace-ment, the breakdown of health and social services, and the heightened risk of disease transmission. Any threat climate change poses to youth development is likely to be aggravated by drawn-out conflicts.
FInAl AnAlYsIsClimate change potentially represents a ma-jor threat to the health and socio-economic stability of youth—particularly in developing countries, where the vast majority of young people live. Certain groups, such as indigenous
youth, are especially vulnerable and are likely to encounter even greater obstacles within the contexts highlighted in this chapter (see box II.4). Unless the causes and consequences of climate change are addressed very soon, the youth of today and tomorrow may effectively be prevented from participating fully and pro-ductively in society, which could have a seri-ous impact on national development in the long term.
box II.4
Climate change and indigenous youth
Regardless of where they live in the world, indigenous youth are among the most vulnerable to the threats posed by climate change. In some cases, they are also among those who stand to lose the most as a result of inter-
Source: United Nations Environment Programme/GRID-Arendal (2009a).
Figure II.2Dependency ratio in renewable water
Note: The dependency ratio in renewable water represents the percentage of total renewable water resources originat-ing outside of a country. This serves as a good indicator of the potential for tension and conflict over water-sharing.
27
national mitigation efforts. Ironically, indigenous communities are at risk partly because of their sustainable, carbon-neutral, or even carbon-nega-tive lifestyles.
To understand how and why indig-enous youth will be affected by climate change, it is first necessary to recog-nize the unique, sacred relationship that exists between indigenous peo-ples and their environment. It is equally important to recognize that indigenous youth cannot be isolated from their cultural context. They are an integral part of their families and communities.
Indigenous peoples coexist with what have become some of the most frag-ile elements of the ecosystem. Many of them can be found in or around the majority of existing forest tracts, which are home to 80 per cent of the world’s biodiversity. Others are long-term in-habitants of the melting ice caps in the Arctic region, the diminishing land-forms of low-lying island atolls, and coastal areas (Salick and Byj, 2007). Indigenous peoples do not see land and water as commodities; for them, the earth is a living and sacred entity that provides food, medicine, shelter, and clothing (Borrows, 2006; LaDuke and Alexander, 2004). Their relation-ship with these elements is often a spiritual one. Once this is understood, it is easy to see why many indigenous peoples view climate change as a hu-man rights issue (Carmen, 2008). For the world’s indigenous groups, the impact of climate change on the envi-ronment and biodiversity represents a threat not only to their physical surviv-al, but also to their cultures, languag-es, and world views.
Indigenous youth live an already frag-ile existence. In several countries, this manifests itself in alarmingly high rates of depression and suicide (Pan American Health Organization, 2007; Health Canada, 2006; Human Rights and Equal Opportunity Commission of
Australia, 2003). These young people are part of the growing phenomenon of forced displacement, violence, social exclusion, and the erosion of cultural and linguistic traditions. With climate change, some of these problems could become much worse.
Indigenous youth living in the Arctic, in semi-arid regions, or on small, low-ly-ing islands may see their self-determi-nation compromised if their communi-ties are forced to relocate. Permanent displacement would a have profound physical and psychological impact, as they would lose access to nutritional inputs that make up their traditional di-ets and to traditional economic activi-ties such as agriculture, hunting, and fishing. There would also be a gradual loss of the long-standing cultural tra-ditions and location-specific language associated with their territories.
With a major disruption of their liveli-hood patterns, young displaced peo-ple with the least transferable skills and education run the highest risk of poverty. As they move to urban cen-tres to seek employment, they may encounter discrimination while also experiencing a loss of identity and, for perhaps the first time, a lack of family and community support.
Indigenous children and youth are also susceptible to certain health risks as-sociated with climate change, includ-ing plant and animal contamination, asthma and other respiratory diseases linked to declining air quality, and the increase in vector-borne diseases.
Indigenous youth and their communi-ties are likely to be affected not only by the problems stemming from climate change but also by some of the pro-posed solutions. Biofuel production of-ten involves the large-scale cultivation of single crops, which reduces biodi-versity. The clearing of land for this pur-pose can lead to the forced displace-ment of indigenous communities,
28
which violates the provisions of the United Nations Declaration on the Rights of Indigenous Peoples, ad-opted by the United Nations General Assembly on 13 September 2007. This is already occurring in some areas and in certain instances has led to conflict. Disputes may also arise over water, wood, or other dwindling resources in indigenous lands and territories.
sUggestIons FoR FURtHeR ReAdIng
• Food and Agriculture Organization of the United Nations (2009). New challenges: climate change and bioenergy. Issue pa-per prepared for the World Summit on Food Security, held in Rome from 16 to 18 November 2009. Available from ftp://ftp.fao.org/docrep/fao/meeting/018/ k5987e.pdf.
This brief paper, produced by the Food and Agriculture Organization of the United Nations for the 2009 World Summit on Food Security, provides a summary of the impact of climate change and bioenergy development on food security.
• Ganeshan, Shamanthy, and Wayne Dia-mond (2009). Forecasting the numbers of people affected by natural disasters up to 2015. Oxfam papers and reports on climate change, 2009. Available from http://www.oxfam.org.uk/resources/policy/climate_change/downloads/ forecasting_disasters_2015.pdf.
Ganeshan and Diamond offer projections on the human impact of climate change, predict-ing that by 2015 more than 375 million people per year will be affected by climate-related di-sasters.
• International Organization for Migration (2009). Migration, climate change and the environment. IOM Policy Brief. Ge-neva, May. Available from http://iom.ch/jahia/webdav/shared/shared/main-
site/policy_and_research/policy_doc-uments/policy_brief_envmig.pdf.
This policy brief provides a general introduction to the dynamic relationship between migration, climate change, and the environment and de-scribes the Organization’s perspectives and in-volvement in this field.
• McMichael, A. J., and others, eds. (2003). Climate Change and Human Health: Risks and Responses. Geneva: World Health Organization. Available from http://www.who.int/globalchange/publications/cchhbook/en/.
Produced jointly by the World Health Organi-zation, World Meteorological Organization, and United Nations Environment Programme, this publication addresses the present and future impact of climate change on human health and proposes ways in which societies can moder-ate those effects through adaptation strategies and the reduction of GHG emissions.
• United Nations Children’s Fund, Inno-centi Research Centre (2008). Climate Change and Children: A Human Security Challenge. Policy Review Paper. Avail-able from http://www.unicef-irc.org/publications/pdf/climate_change.pdf.
This policy review paper examines the vul-nerability of children and young people in the context of a changing climate and in the con-texts of global, national, and subnational poli-cies and frameworks on climate change and human security. It is argued in the publication that existing agreements and policies do not sufficiently address children’s issues within the broader frameword of climate change.
• United Nations Framework Conven-tion on Climate Change (2007). Climate Change: Impacts, Vulnerabilities and Ad-aptation in Developing Countries. Bonn, Germany. Available from http://unfccc.int/resource/docs/publications/im-pacts.pdf.
This publication highlights the needs and con-cerns of developing countries as they adapt to the effects of climate change. The book de-scribes the impact of and adaptation to climate change in Africa, Asia, Latin America, and small island developing States.

29
cHAPteR IIIAddressing climate change at its roots
Climate change is a global challenge, with dis-cussions tending to focus on the greenhouse gas emissions of countries or regions. Gov-ernments must impose solutions, but it is also essential that climate change be addressed sustainably at the human level. Developing a sense of ownership and accountability begins with explicit acknowledgement that it is the behaviour and lifestyles of individuals and the societies in which they live that are ultimately responsible for the emissions that drive cli-mate change. c
HA
Pt
eR
III

31
Chapter III examines how young people’s choices are affecting the environment. Many youth do not fully understand the environmental impact of their lifestyles. Education can play a key role in helping them make the connection between their consumption behaviour and ecological concerns. It can also help prepare young people to take ad-vantage of environmental advocacy opportunities and the growing number of green jobs available, providing them with opportunities to effect change in the workplace and the world.
consUmPtIon PAtteRns And sUstAInABle lIFestYlesHuman consumption is a major contributor to climate change. What people consume and how they consume it affects the natural envi-ronment. A significant amount of energy is re-quired for the production, transportation, use, and disposal of the goods consumed, result-ing in substantial GHG emissions. Moreover, the extraction of natural resources, the use of water, and the creation of pollution associated with the various stages of the consumption process contribute to environmental degrada-tion in general. Across the spectrum—from the desperate struggle to meet basic needs to the excessive use of resources to satisfy “wants”—consumption puts enormous stress on the en-vironment. The present chapter will focus on the latter end of the spectrum.
The human race has consumed more natural resources in the past 50 years than in all of the previous years of human history combined (Bentley, Fien and Neil, 2004). In many devel-oped and emerging economies, the growth of the market-based system has been paralleled by the emergence of a consumer society. In such a society, the quality of life of individu-als—and even the definition of happiness—is increasingly associated with the expansion of ownership of material goods (Clover, 2001).
What, exactly, is consumption? The term is generally associated with the use of goods and services, including food or energy. However, that is just one aspect of the consumption pro-cess. As illustrated in figure III.1, consumption
actually involves the selection and purchase of products, their use, and their disposal. Each of these three stages has an effect on the environment.
Consumption and energy-intensive lifestyles are not equally distributed around the world. It is estimated that the 12 per cent of the world’s population living in North America and West-ern Europe account for 60 per cent of global private consumer spending; in contrast, the one third living in South Asia and sub-Saharan Africa account for only 3 per cent (Gardner, As-sadourian and Sarin, 2004).
Much of the available data relating to young people’s sustainable consumption patterns and lifestyles focus on youth in the urban and suburban areas of developed countries. These youth constitute a minority, but it is their be-haviour that has the greatest environmental im-pact. Conversely, the 79 per cent of the world’s youth who live in regions where agriculture ac-counts for more than one third of employment and where almost half of all youth are rural resi-dents generally leave a substantially smaller carbon footprint, but will bear the brunt of cli-mate change over their lifetimes.
While inequalities in consumption remain high, growing numbers of people in developing coun-tries are adopting lifestyles that incorporate the manifestations of a modern existence, includ-ing refrigerators, televisions, computers, and automobiles. It is estimated that the number of individuals with discretionary spending power worldwide is approaching 1.7 billion people and that nearly half live in developing econo-mies (United Nations and United Nations Envi-ronment Programme, 2007). This trend seems
Figure III.1
The consumption process
Source: Anders Nyberg and Eivind Stø (2001).
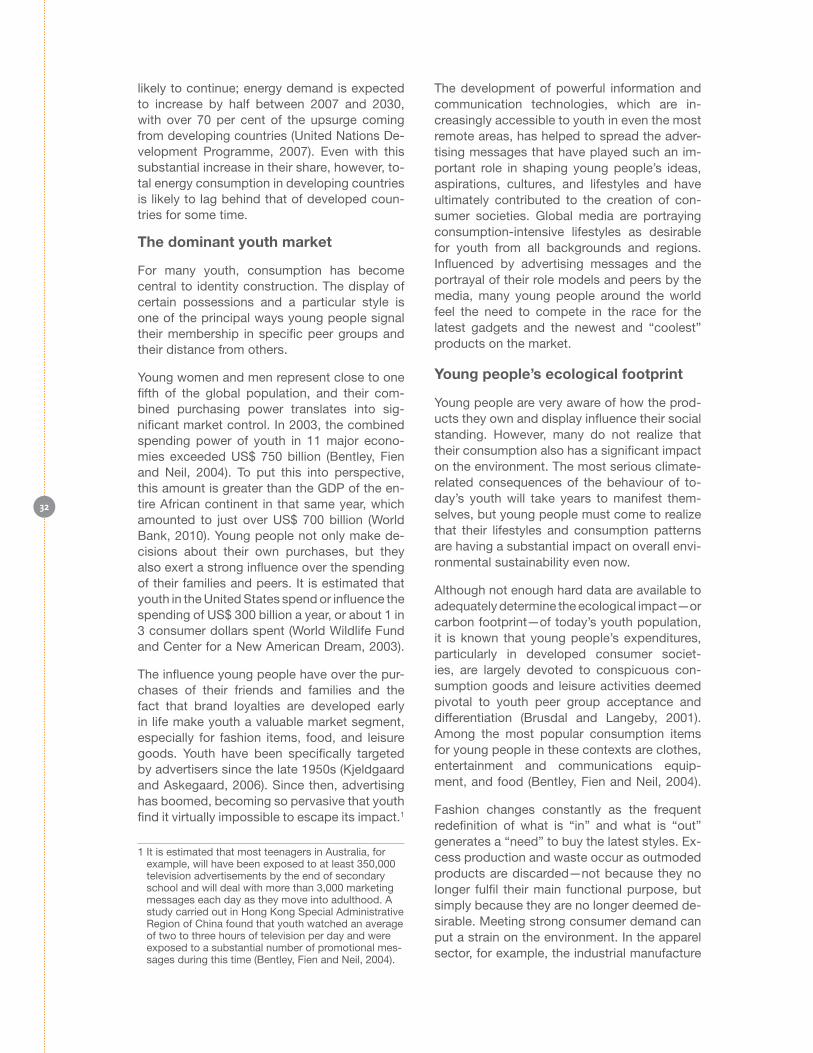
32
likely to continue; energy demand is expected to increase by half between 2007 and 2030, with over 70 per cent of the upsurge coming from developing countries (United Nations De-velopment Programme, 2007). Even with this substantial increase in their share, however, to-tal energy consumption in developing countries is likely to lag behind that of developed coun-tries for some time.
The dominant youth market
For many youth, consumption has become central to identity construction. The display of certain possessions and a particular style is one of the principal ways young people signal their membership in specific peer groups and their distance from others.
Young women and men represent close to one fifth of the global population, and their com-bined purchasing power translates into sig-nificant market control. In 2003, the combined spending power of youth in 11 major econo-mies exceeded US$ 750 billion (Bentley, Fien and Neil, 2004). To put this into perspective, this amount is greater than the GDP of the en-tire African continent in that same year, which amounted to just over US$ 700 billion (World Bank, 2010). Young people not only make de-cisions about their own purchases, but they also exert a strong influence over the spending of their families and peers. It is estimated that youth in the United States spend or influence the spending of US$ 300 billion a year, or about 1 in 3 consumer dollars spent (World Wildlife Fund and Center for a New American Dream, 2003).
The influence young people have over the pur-chases of their friends and families and the fact that brand loyalties are developed early in life make youth a valuable market segment, especially for fashion items, food, and leisure goods. Youth have been specifically targeted by advertisers since the late 1950s (Kjeldgaard and Askegaard, 2006). Since then, advertising has boomed, becoming so pervasive that youth find it virtually impossible to escape its impact.1
1 It is estimated that most teenagers in Australia, for example, will have been exposed to at least 350,000 television advertisements by the end of secondary school and will deal with more than 3,000 marketing messages each day as they move into adulthood. A study carried out in Hong Kong Special Administrative Region of China found that youth watched an average of two to three hours of television per day and were exposed to a substantial number of promotional mes-sages during this time (Bentley, Fien and Neil, 2004).
The development of powerful information and communication technologies, which are in-creasingly accessible to youth in even the most remote areas, has helped to spread the adver-tising messages that have played such an im-portant role in shaping young people’s ideas, aspirations, cultures, and lifestyles and have ultimately contributed to the creation of con-sumer societies. Global media are portraying consumption-intensive lifestyles as desirable for youth from all backgrounds and regions. Influenced by advertising messages and the portrayal of their role models and peers by the media, many young people around the world feel the need to compete in the race for the latest gadgets and the newest and “coolest” products on the market.
Young people’s ecological footprint
Young people are very aware of how the prod-ucts they own and display influence their social standing. However, many do not realize that their consumption also has a significant impact on the environment. The most serious climate-related consequences of the behaviour of to-day’s youth will take years to manifest them-selves, but young people must come to realize that their lifestyles and consumption patterns are having a substantial impact on overall envi-ronmental sustainability even now.
Although not enough hard data are available to adequately determine the ecological impact—or carbon footprint—of today’s youth population, it is known that young people’s expenditures, particularly in developed consumer societ-ies, are largely devoted to conspicuous con-sumption goods and leisure activities deemed pivotal to youth peer group acceptance and differentiation (Brusdal and Langeby, 2001). Among the most popular consumption items for young people in these contexts are clothes, entertainment and communications equip-ment, and food (Bentley, Fien and Neil, 2004).
Fashion changes constantly as the frequent redefinition of what is “in” and what is “out” generates a “need” to buy the latest styles. Ex-cess production and waste occur as outmoded products are discarded—not because they no longer fulfil their main functional purpose, but simply because they are no longer deemed de-sirable. Meeting strong consumer demand can put a strain on the environment. In the apparel sector, for example, the industrial manufacture
33
of fabric and other fashion goods can under-mine air quality; dyeing and printing use vast amounts of water and chemicals, and shipping garments around the world is energy-intensive and constitutes a source of GHG emissions. Even natural fibres are not always environ-mentally friendly. Cotton production accounts for less than 3 per cent of the world’s farmed land but consumes almost 25 per cent of the insecticides and 10 per cent of the herbicides used worldwide (United Nations Educational, Scientific and Cultural Organization and United Nations Environment Programme, 2008).
Technology, like fashion, is constantly evolving. New technology items are becoming increas-ingly important to young people for the manage-ment of their leisure time and social relations, so it is not surprising that youth are among the main consumers of mobile telephones, comput-ers, video game consoles, and other electronic equipment. These devices are becoming per-vasive even among youth in some developing regions. In Africa, which has the highest mobile phone growth rate in the developing world, mo-bile penetration had reached more than 25 per cent by 2008 (International Telecommunication Union, 2009). Although electronic items are often small, their collective carbon footprint is quite large. It is estimated that between 3 and 13 per cent of residential electricity use in Or-ganization for Economic Cooperation and De-velopment (OECD) countries can be attributed to standby power consumption alone (Euro-pean Environment Agency, 2005). High energy intensity characterizes not only the use but also the manufacture of many small electronic de-vices. In fact, manufacturing accounts for 80 per cent of a computer’s energy use over its life cycle. Taken together, their high energy use in manufacturing and typically short lifespans make computers more energy-intensive than refrigerators (Williams, 2005).
The technology embedded in computers, mobile phones, music players, and video game consoles changes rapidly, and youth are under constant pressure to buy the new-est models to take advantage of higher con-nectivity speeds and improvements in prod-uct size and sophistication. Once personal computers, televisions, mobile phones, video game consoles, and other electronic devic-es are discarded, they become e-waste. It is estimated that 20 million to 50 million metric tons of e-waste are generated worldwide ev-ery year, with developed countries accounting
for the bulk of the total (United Nations Envi-ronment Programme, 2006; Schmidt, 2006).
Youth in consumer societies tend to have rel-atively few financial commitments and thus devote a fairly high proportion of their dispos-able income to leisure activities such as tour-ism. Their travel choices, including the mode of transportation and type of accommodation selected, the distance travelled, and the ac-tivities undertaken, all affect the environment. The precise contribution of tourism to human-induced climate change has not been compre-hensively assessed. It is estimated, however, that emissions from three of the main tourism subsectors (transportation, accommodation and activities) represented between 3.9 and 6 per cent of global emissions in 2005, with a best estimate of 4.9 per cent (World Tourism Organization and United Nations Environment Programme, 2008). Staying longer in one loca-tion, using public transportation, and lodging with friends or relatives can reduce the envi-ronmental impact of tourism.
The consumption paradox: Do young people walk the talk?
Young people around the world are very con-cerned about the environment. A UNEP poll of nearly 2,000 twelve- to eighteen-year olds in five countries—Brazil, India, the Russian Fed-eration, South Africa, and the United States—found that close to 90 per cent believe world leaders should do whatever is necessary to ad-dress climate change (United Nations Environ-ment Programme, 2008b). A number of other surveys have confirmed that youth are worried about the environment and climate change (see, for example, Special Eurobarometer 300, Directorate General for Communication of the European Commission, 2008; and Bentley, Fien and Neil, 2004).
Young people say they care about the environ-ment, but to what extent does their consump-tion behaviour reflect this concern? Do they understand the environmental impact of their choices as consumers? Quantitative and quali-tative studies on young people’s perceptions of sustainable lifestyles (defined in box III.1) are limited in number and scope, particularly for youth living in developing countries. To provide an initial mapping of the attitudes, behaviours, and expectations of youth and their sense of power to change lifestyles and promote sus-tainable consumption, UNEP and the United

34
Nations Educational, Scientific and Cultural Organization (UNESCO) launched a survey in 2000 on the consumption patterns of more than 5,000 middle-class urban youth in 24 countries. The UNEP/UNESCO Survey on Youth and Con-sumption: Is the Future Yours? constituted part of the UNESCO/UNEP project on Youth, Sus-tainable Consumption and Life Styles. The few other existing studies on young people’s per-ceptions about sustainable consumption have supported the findings of the UNEP/UNESCO research. UNEP is currently in the process of conducting a follow-up study, the Global Sur-vey on Sustainable Lifestyles, which will shed more light on the perceptions and behaviours of youth in developing countries with regard to sustainable consumption and lifestyles.
box III.1
Defining sustainable lifestyles
Sustainable lifestyles can be defined as practices and choices at the indi-vidual and collective levels that enable individuals to meet their needs and aspirations with a sense of responsi-bility for the well-being of present and future populations, taking into account the environmental and social conse-quences of their actions. Sustainable consumption behaviour is an impor-tant component of a sustainable life-style and is characterized by the fol-lowing: satisfying basic human needs rather than the desire for luxuries; valuing quality-of-life concerns over material standards of living; minimiz-ing resource use, waste and pollution; taking a life-cycle perspective in con-sumer decision-making; and acting with concern for future generations.
Source: Matthew Bentley, John Fien and Cameron Neil (2004), Sustainable Consumption: Young Australians as Agents of Change.
The consumer behaviour of young people sug-gests that their concern for the environment is not reflected in their purchasing decisions. The UNEP/UNESCO study found that young peo-ple often failed to consider all three phases of consumption—shopping behaviour, the use of
products, and the disposal of products—in as-sessing the effect of their own consumption on the environment. Most recognized the environ-mental impact of the second and third phases but did not acknowledge the critical role their initial product selection and purchase played within this context. Whether it is a case of not knowing enough or not caring enough, environ-mental concerns appear to be given lower pri-ority than other criteria in shopping decisions. The UNEP/UNESCO Survey found that environ-mental impact was assigned less weight than factors such as trendiness, price, and quality in young people’s buying decisions (Nyberg and Stø, 2001). These results were confirmed by subsequent studies, which showed that vari-ables such as price, brand name, quality, and peer pressure all seemed to exert a greater influence on young people’s purchasing deci-sions than did sustainability considerations. In fact, an Australian study found that only 1 per cent of young respondents found the sustain-ability of a product to be the most important factor influencing their consumption (Bentley, Fien and Neil, 2004).
Several factors, including age, education, and gender, seem to influence youth perspectives on sustainable living. A number of studies have confirmed that younger members of the youth cohort are less inclined than older youth to be-lieve they consume too much and are less con-scious of the effects of their behaviour (see, for example, Bentley, Fien and Neil, 2004; and Au-tio and Heinonen, 2004). Interest in sustainable development and sustainable consumption ap-pears to be positively correlated with the level of education (Maggi and others, 2001). With respect to gender, many studies have shown a particular tendency among girls and women to favour green values. Whereas males seem to associate environmentally conscious behav-iour with limitations on their personal freedom, females generally appear to understand it as a reflection of the need to take action (Autio and Heinonen, 2004). In the UNEP/UNESCO study, more young women than young men reported basing their purchasing decisions on the eco-friendliness of a product (Nyberg and Stø, 2001).
The incongruity between young people’s pro-fessed concern for the environment and their consumption behaviour is linked to several real and perceived barriers that may deter them from adopting sustainable consumption practices and lifestyles (Bentley, Fien and Neil,

35
2004). Many young people perceive existing green products to be incompatible with their needs, too expensive, or not readily available. In some cases, there may be no green prod-ucts that can substitute for everyday goods or that serve the same identity-building function as the more popular consumer items. A sub-stantial number of young people acknowledge that they may require more information about alternative products and services. Youth also need to be made aware of what constitutes over-consumption, as they may find it increas-ingly difficult to ignore the constant barrage of advertising messages directed at them.
Although many young people are genuinely concerned about the environment and climate change, their purchasing behaviour and leisure activities suggest that they do not fully compre-hend the extent to which their purchases and actions affect the planet. Helping youth under-stand and acknowledge the impact their life-styles have on the environment can help them make the connection between their consump-tion behaviour and environmental concerns. Education plays a crucial role in this regard.
edUcAtIon FoR cHAngeEnvironmental education is a prerequisite for effective youth engagement and participation in efforts to address climate change. Young people need to be well-informed about climate change science and mitigation options and to be made aware of the consequences of their consumption behaviour so that they can play a strong role in combating climate change and promoting changes in attitudes and behav-iours. Education and training in the field of cli-mate change can also prepare young people to take advantage of new employment opportuni-ties arising from the shift to a greener economy.
Climate change education is an element of the broader interdisciplinary framework of educa-tion for sustainable development, which pro-motes understanding of the social, cultural, economic, and environmental dimensions of sustainability and teaches students how to make decisions that take into account the long-term future of the economy, ecology, and society.
In addition to helping put the world on a more sustainable path in the future, climate change
education can produce tangible benefits to-day. For instance, teaching energy-saving and resource-conserving behaviours not only pro-motes sustainable lifestyles but can also lead to cost savings. Similarly, learning about disas-ter risk reduction in schools can increase stu-dents’ awareness and understanding of their immediate environment and provide them with empowering tools that will facilitate their active involvement in preserving the safety of their communities. Young people can also dissemi-nate information on disaster risk management, educating their families and communities about disaster preparedness (Regional Consultative Committee on Disaster Management, 2007). When the residents of an area are aware of the risks around them and take the time to develop crisis response strategies, the injuries, dam-age, and trauma associated with disaster situ-ations are significantly reduced.
Key features of effective education for sustainable development
Education for sustainable development can be presented as a cross-cutting, interdisciplinary theme or integrated into the curricula of exist-ing subjects such as geography, earth science, chemistry, economics, social studies, biol-ogy, and technology. The learning outcomes of climate change education and education for sustainable development should include the acquisition of attitudes, knowledge, skills, and behaviour that promote scientific inquiry, ecological and social responsibility, community action and involvement, and global solidarity (Thoresen, 2008).
Experience has shown that it is important to complement thematic teaching with practical activities and projects. These help make ab-stract information and theories more concrete and allow young people to see the connection between the target messages and their every-day lives. Students who are able to identify the direct relevance of a concept to their own lives are more likely to retain the information and act upon it. An ineffective approach to promoting environmental awareness would be to teach only the scientific facts, leaving out any refer-ence to the personal and social relevance of the information (Uzzell, 1999). In environmental education, the connection between the stu-dent, climate change, and personal action is best emphasized through active learning meth-
36
ods. Students might, for example, be given an ecological footprint activity or asked to use a carbon footprint calculator to enhance their un-derstanding of how their personal energy con-sumption contributes to climate change (Cor-dero, Todd and Abellera, 2008).
Other elements of effective environmental edu-cation might include presentations by experts, field trips, hands-on exposure to meteorologi-cal equipment or the establishment of small meteorological stations in schools, and partici-pation in national science fair competitions that promote the development of environmental solutions. Media such as television and the In-ternet (including Web-based courses) can also be used effectively in teaching about climate change (United Nations Framework Conven-tion on Climate Change, 2006).
Education for sustainable development contin-ues to be driven by national circumstances and capacities. Educational materials should there-fore incorporate locally relevant and culturally appropriate content that takes into account specific conditions and contexts and is geared towards local needs and perceptions.
Effective approaches to integrating climate change and other environmental issues in classroom instruction should be incorporated into teacher education and training. Teachers who are already working should receive ad-ditional training in climate change education to strengthen their scientific and pedagogical knowledge in this area (United Nations Frame-work Convention on Climate Change, 2003). A number of resources are readily available on the Internet to support teachers’ efforts to raise environmental awareness. One example is the OzonAction Education Pack, jointly developed by several United Nations entities to ensure that high-quality, copyright-free instructional mate-rial on climate change would be available to all primary and secondary schools (see box III.2).
box III.2
The ozonAction Education Pack
Environmental education should begin at an early age and continue through- out every phase of schooling. In order to ensure the availability of appropri-
ate materials to achieve this objec-tive, the United Nations Environment Programme, the United Nations Edu-cational, Scientific and Cultural Orga-nization, and the World Health Orga-nization joined forces to develop an environmental awareness programme geared towards primary and second-ary school students.
The OzonAction Education Pack for primary schools includes entertaining hands-on curriculum materials that can be used to educate children about the protective role of the ozone layer and the causes and consequences of its depletion. The Pack contains a teaching and learning programme that incorporates basic information as well as practical skill-building and partici-patory opportunities to provide stu-dents with simple, concrete steps they can take to protect the ozone layer and safely enjoy the sun.
The OzonAction Education Pack for secondary schools includes teacher and student materials that explore the same concepts—ozone layer deple-tion and protection and the health risks of strong ultraviolet radiation—at a more advanced level. The Pack allows young people to acquire a deeper un-derstanding of the scientific concepts linked to ozone issues and provides them with opportunities to develop and apply policy solutions. Role-play is one strategy used to engage students right from the start. The first activity is one in which each student assumes the role of a young journalism graduate who is being considered for a job at an important news agency. The student is asked to write an article that not only informs the world about ozone deple-tion and its link to climate change but also provides practical tips for children and youth to help protect the planet.
In terms of educational outcomes, chil-dren and youth who have participated in this programme should exhibit the following:

37
• The ability to collect and analyse rel-
evant information and to use it to de-velop practical action plans;
• A sense of environmental responsi-bility and a desire to become more active in protecting the ozone layer;
• An understanding of the health is-sues at stake and of how to protect oneself from the dangers of ultravio-let radiation.
Teacher and student books may be downloaded free of charge from www.unep.fr/ozonaction/information/edu-cationpack.htm or www.unep.fr/ozon-action/information/ educationpack-sec_school.htm.
Sources: United Nations Environment Programme, Division of Technology, Industry and Economics, OzonAction Branch (2006), OzonAction Educa-tion Pack: A Guide for Primary School Teachers; and (2007), OzonAction Ed-ucation Pack for Secondary Schools.
The evaluation of existing tools and the iden-tification of baseline indicators to monitor and assess the effectiveness of climate change education are also necessary to ensure that young people are benefiting from appropriate environmental content and instruction (United Nations Framework Convention on Climate Change, 2007c).
As a result of coordinated efforts by Govern-ments and international organizations (see box III.3), climate change, sustainable develop-ment, and other environmental concerns are receiving increased attention in both developed and developing countries at all levels of educa-tion. In many countries, institutional and legal frameworks have been established to support the design and implementation of educational and awareness programmes focusing on cli-mate change or broader sustainable develop-ment issues, and specific measures have been adopted to systematically support and monitor the implementation of innovative projects (Unit-ed Nations Framework Convention on Climate Change, 2007c). In some countries, national climate change education units and coordinat-
ing committees have been set up to ensure that relevant information is effectively integrated throughout the formal education system. Non-governmental organizations (NGOs) have also been actively involved in the development and implementation of many environmental educa-tion initiatives.
box III.3
Promoting education for sus-tainable development at the highest level
The crucial role played by climate change education in changing behav-iours, attitudes, and values is explicitly recognized at the international level. Article 6 of the United Nations Frame-work Convention on Climate Change calls on Governments to promote and facilitate the development and imple-mentation of relevant educational and public awareness programmes; public participation in efforts to address cli-mate change; public access to perti-nent information; and the training of scientific, technical, and managerial personnel. Similarly, article 10(e) of the Kyoto Protocol calls on Parties to “co-operate in and promote at the inter-national level and, where appropriate, using existing bodies, the develop-ment and implementation of education and training programmes, including the strengthening of national capac-ity building … and [to] facilitate at the national level public awareness of, and public access to information on, climate change” (United Nations Framework Convention on Climate Change, n.d.).
In recognition of the importance of education for sustainable develop-ment, the United Nations General Assembly declared 2005-2014 the United Nations Decade of Education for Sustainable Development, with the United Nations Educational, Scientific and Cultural Organization as the lead agency. Information on the goals and strategies associated with the Decade is available at www.unesco.org/en/esd/.
38
Challenges in implementing educa-tion for sustainable development
Effective basic education systems must be in place before education for sustainable devel-opment can be fully integrated. Reducing glob-al disparities in educational access and quality is essential for the widespread implementation of climate change education. At this point, per capita spending on students remains highly variable. In 2004, North America and Western Europe accounted for 10 per cent of the world population aged 5 to 25 years, but 55 per cent of global education expenditure. In contrast, sub-Saharan Africa accounted for 15 per cent of the population between the ages of 5 and 25, but only 2 per cent of worldwide spend-ing on education. (United Nations Educational, Scientific and Cultural Organization, 2008)
In developing countries, the implementation of education for sustainable development is often impeded by the lack of institutional, financial, and technical capacities and by the lack of rele-vant teaching materials and qualified instructors.
In spite of the various challenges, a number of countries have institutionalized environmental
education. Their experience constitutes a valu-able source of information and guidance for others seeking to integrate climate change ed-ucation at the systemic level. In the Seychelles, for instance, the Ministry of Education created an Environmental Education Unit that has fa-cilitated the successful integration of climate change issues into geography and science cur-ricula and has also developed and implement-ed a compulsory teacher training programme on environmental education. The Unit regularly coordinates environmental education activi-ties in schools, including extracurricular op-tions such as an eco-school programme. Every year it puts together an annual environmental education calendar that includes competitions, environmental theme days, festivals, and oth-er events geared towards increasing environ-mental awareness (United Nations Framework Convention on Climate Change, 2007b). The University of the South Pacific, a regional ter-tiary institution supported by 12 Pacific Island countries, has been providing climate change education for several years and now offers a number of degree programmes in the field (see box III.4).
39
box III.4
Tertiary climate change educa-tion in the Pacific Islands
Climate change threatens the sustain-able development of the water supply, agriculture, coastal zones, tourism, health, and many other vital sectors in the Pacific Islands. At the University of the South Pacific (USP), climate change is addressed in a range of undergradu-ate courses in geography, marine sci-ence, agriculture, physics, and eco-nomics. For more than a decade, USP has offered a postgraduate course on climate change impacts, vulnerability and adaptation. The course focuses on the specific risks climate change poses to the Pacific Islands and ex-amines strategies for managing those risks. Students are provided with a brief overview of climate science, miti-gation measures, and relevant inter-national political and legal institutions, and an adaptation policy framework is presented that can be applied at the community, regional, or national level. USP is offering a new postgraduate di-ploma in climate change beginning in 2010; the programme will include the existing course on climate change im-pacts and adaptation as well as a new course on climate science. USP also works closely with the START-Oceania secretariat (based at the University) to provide scholarship- and award-based training opportunities for young scien-tists studying environmental change.
Source: University of the South Pa-cific (2009); programme information is available from http://www.usp.ac.fj/ index.php?id=8132.
Non-formal climate change education
Formal education is only one means of creating awareness about climate change and teaching about adaptation and mitigation. Non-formal, out-of-school approaches also have a crucial role to play in sensitizing youth to the causes and consequences of climate change. By pro-viding real-life experiences and the skills need-
ed to adapt to climate change and mitigate its impact, non-formal and informal learning reinforce and supplement classroom learning. More importantly, non-formal approaches can offer many benefits and opportunities to young people who do not have access to formal edu-cation or to those who have dropped out of the formal education system.
Civic engagement and community service rep-resent an important component of non-formal education, providing youth with personal, hands-on experience and training. Young peo-ple can play a key role in the promotion of cli-mate change education through advocacy and by participating in local sustainable develop-ment initiatives. A number of youth initiatives relating to climate change are described in chapter IV of the present Report.
PRePARIng YoUng PeoPle to tAke AdVAntAge oF gReen JoB oPPoRtUnItIesRecent years have seen significant growth in green industries—and green jobs—around the world. In addition to providing much-needed employment opportunities for youth, green jobs represent a way for young people to contrib-ute directly to the fight against climate change. They enable youth to move beyond adopting green behaviours in their private lives, making it possible for them to translate their convictions into action in the workplace.
What, exactly, are green jobs? They are defined by UNEP as work in agriculture, industry, re-search and development, services, and adminis-tration that contributes to preserving or restoring the quality of the environment (United Nations Environment Programme and others, 2008).
The growing attention given to climate change and sustainable development in the midst of the financial and economic crisis that began in 2008 translates into an ideal opportunity to promote green economic growth around the world. In the United States, US$ 60 billion in fiscal stimulus money will be invested in clean energy, including the creation of green jobs (United States, White House, 2009). In China, 12 per cent of a US$ 586 billion economic
40
stimulus package will be allocated to increas-ing energy efficiency and other environmental improvements (Barbier, 2009). The global mar-ket for environmental products and services is expected to double by 2020 (United Nations Environment Programme and others, 2008).
It has been argued that the renewable energy sector may be well situated for the creation of green jobs both now and in the future (United Nations Environment Programme and others, 2008). There have been more than 2.3 million green jobs created in the renewable energy sector in recent years, including 300,000 in the wind industry, 170,000 in solar photovolta-ics, 624,000 in the solar thermal industry, and 1,174,000 in biomass production. Investment in renewable energy has increased significantly in the past decade, growing from US$ 10 billion in 1998 to US$ 66 billion in 2007. With invest-ment rising at an annual rate of 20 per cent, the number of jobs in the renewable energy sector could exceed 20 million by 2030 (United Nations Environment Programme and others, 2008).
Potential job opportunities exist for youth in many areas of the renewable energy sector, including design and planning, energy policy analysis and development, energy econom-ics and energy management, energy efficiency consulting, assessment of the social and en-vironmental impact of energy systems, and research and development (United Nations Industrial Development Organization, 2003). Some young people, such as those involved in the Kibera Community Youth Programme in Nairobi, have already begun to inject them-selves into the sector and its development (see box III.5).
box III.5
Youth harnessing the power of the sun through the production of solar photovoltaic panels
The Kibera Community Youth Pro-gramme (KCYP) is a community-based organization established and run by young people in the Kibera slum in Nairobi, Kenya. The project provides youth with work assembling small and affordable solar panels. KCYP mem-bers sell hand-constructed solar char-
gers to other members of their com-munity, enabling the buyers to access a mobile source of electricity (and thus re-ceive news via radio and communicate by cell phone) at an affordable price.
Using skills and equipment passed on to them by a British volunteer, the young people are engaged in the entire line of production, from slicing the silicon sheets to wiring the connectors and cal-culating the correct voltage. Many of the youth involved in the solar project have never had a job or seen anyone in their families work. The young craftsmen, once trained and operating, receive a small income and see a portion of the profits from the sale of the photovoltaic cell units go directly into funding other KCYP programmes, such as theatre-based HIV/AIDS training, environmental clean-ups, and peace-building soccer teams. The average wage in Kibera is US$ 1 a day, but a small solar panel, which takes just minutes to put togeth-er, can sell for around US$ 5.
Fred Ouko, the coordinator of KCYP, says that the young people are start-ing to gain confidence: “What I want to see is real empowerment, real ben-efit trickling down to individual persons. … They’re actually making something up to a full product and then selling it, and they know now they can do this for themselves.”
The programme has had an immediate local impact, benefiting the residents of Kibera and surrounding rural communi-ties. Groups in neighbouring Uganda have asked the members of KCYP to share their experience, knowledge, and training, which implies that even the simplest small-scale endeavour can po-tentially have a far-reaching impact. In 2007 KCYP won a World Clean Energy Award for its pioneering work.
Source: Kibera Community Youth Pro-gramme (2005); Alana Herro (2007), “Youth bring low-cost solar panels to Kenyan slum”; and Celeste Hicks (2004), “Kenya slum turns sun into ener-gy” (source of quote from Fred Ouko).
41
Improving energy efficiency in building and construction constitutes another area with con-siderable potential for creating green jobs for youth. There are currently 4 million jobs in Eu-rope and the United States devoted to energy resource optimization, and this number could increase significantly. Youth who are willing to complete apprenticeships in this field may find themselves well positioned to take advantage of new employment opportunities in the com-ing years.
Young people, in particular rural youth who seek continuity in their livelihoods, may want to take advantage of green jobs aimed at mini-mizing the negative impact of climate change on agriculture. Various efforts are under way to make agriculture more sustainable, both by re-ducing its effects on the environment and by safeguarding it against the consequences of environmental change. Organic farming is one area with enormous growth potential. This type of production is environmentally friendly, but it is also relatively labour-intensive, so a con-tinued shift in this direction could lead to the creation of more jobs in the agriculture sector. Organic farming is expanding rapidly; in 2006, sales in this subsector amounted to US$ 100 billion globally (United Nations Environment Programme and others, 2008).
The rural non-farm economy, which accounts for 35-50 per cent of rural income across de-veloping countries, also constitutes a poten-tial source of green jobs for youth (Haggblade, Hazell and Reardon, 2009). Rural non-farm sectors, including energy production, trade, agroprocessing, manufacturing, and commer-cial and service activities, represent a viable complement or alternative to agriculture in stimulating rural income growth. Although non-farm sectors still frequently rely on a robust and successful agricultural sector, these two seg-ments of the rural economy are increasingly decoupling as improved infrastructure opens up new opportunities that are less dependent on agriculture.
A number of different jobs for youth can be generated in environmental protection and sustainable land management. In South Africa, the Government’s Expanded Public Works Pro-gramme has created more than 800,000 jobs in infrastructure, services, and agriculture. One particular programme, Working for Wa-ter, has provided at least 6,000 young people
with short-term employment and is described in some detail later in the chapter (IRIN, 2009).
The recycling industry may offer young people entrepreneurial opportunities; however, care-ful implementation is necessary to ensure that practices undermining human development are not perpetuated. While recycling is a growth in-dustry that accounts for a substantial number of new jobs, many of these do not constitute decent work and are concentrated in the infor-mal sector, where wages tend to be relatively low and conditions precarious. Nevertheless, young people in developing countries have successfully started small-scale recycling busi-nesses, an area with great potential for expan-sion (see box III.6).
box III.6
City garbage recyclers in low-income estates
A forward-thinking entrepreneur and former truck driver, Andrew Macha-ria, won grants and awards to ad-dress the ever-increasing problem of solid waste, especially plastic bags, in the slums of Nairobi. With the sup-port of local authorities and the Gov-ernment of Kenya, the Kenya Institute of Manufacturers, the United Nations Children’s Fund, the United Nations Development Programme, and other collaborators, he helped set up 20 community groups to collect plas-tic polyethylene waste products and turn them into reusable items such as fence posts, roofing tiles, rain gutters, and washbasins. The groups, which are all part of a cooperative primarily made up of youth and women, have al-ready collected more than 100 metric tons of waste. The project has created employment for over 500 women and youth and has helped raise income for over 5,000 Nairobi slum residents. The project has also allowed coopera-tive members to save and take part in credit schemes, further improving their livelihoods. Macharia is encouraging the formation of additional recycling cooperatives and small business ven-tures that turn urban waste into prod-ucts such as charcoal briquettes,

42
nutrient-rich soil, and mattresses, all of which are ultimately sold back to the community.
Source: City Garbage Recyclers, Ke-nya (2008), “Unclogging sewers and drainage systems in Nairobi’s low-in-come estates”.
The green economy must be developed in a balanced and sustainable manner, with at-tention given to social development consid-erations. Green jobs have the potential to en-hance employment in rural areas and across the globe. However, without careful implemen-tation and proper monitoring, some green ac-tivities, including certain recycling practices and the production of biofuel crops, could ac-tually undermine human development by, for example, perpetuating substandard working conditions or threatening food security (Food and Agriculture Organization of the United Na-tions, 2009b).
With climate change expected to bring about major shifts in the labour market and with un-precedented numbers of youth entering the labour market in the years to come, Govern-ments must strive to ensure that young people are ready to take advantage of new environ-ment-oriented employment opportunities. Cur-rently, too few of the green jobs that are being created are filled by youth, primarily because most lack the necessary skills. This is also hampering growth in green sectors. Green en-ergy operators have noted that one of the pri-mary impediments to continued growth in the coming years will be insufficient access to new talent and employees. Although some progress has been made in providing young people with the knowledge and technical skills they need to take advantage of new employment opportuni-ties afforded by the shift to a greener economy, much remains to be done.
Education and training
As new entrants to the labour force, youth have an advantage over many adults in that they are less likely to suffer the negative effects of technological change. While older workers may experience job dislocation with the introduction of new technologies to combat climate change, youth are well positioned to acquire the req-
uisite skills while they are still in education or training programmes.
In response to the increased interest in green-ing the workforce, universities and other post-secondary institutions have set up specialized programmes designed to ensure that youth acquire the necessary knowledge and skills. In recent years, the number of university courses and degrees focusing on environmental issues, renewable energy, and sustainable practices has surged.
Although tertiary studies can prepare students for a professional career in the environment sector, many green jobs do not require a uni-versity degree. Adjusting educational curricula and encouraging youth to take up technolo-gy-related subjects in secondary school are important steps in facilitating the transition to green employment. Vocational training oriented towards new technologies is equally essential. This type of training can range from courses at secondary schools and workforce develop-ment centres to longer, more specialized post-secondary programmes that prepare candi-dates for positions requiring particular skills.
Along with classroom-based learning and for-mal vocational training, green internships con-stitute an important means of promoting young people’s interest in environmental employment and facilitating the development of relevant oc-cupational skills. In the United States, the pub-lic transport sector has launched several ini-tiatives that provide internship and education opportunities for young people. The Confer-ence of Minority Transportation Officials has an internship programme for students, and similar opportunities that expose youth to the work-ings of the sector are offered by municipalities and campuses around the country through the National Summer Transportation Institute (United States Department of Transportation, Federal Highway Administration, Office of Civil Rights, 2007). During the Summer Institute students learn about problems such as traffic congestion, inefficient modes of transportation, urban sprawl and appropriate land-use plan-ning, as well as sustainable transportation in-frastructure and energy efficiency in the design of transportation projects. This initiative aims at creating awareness of transportation careers among secondary school students and encour-ages them to consider transportation-related courses in their higher-education pursuits.
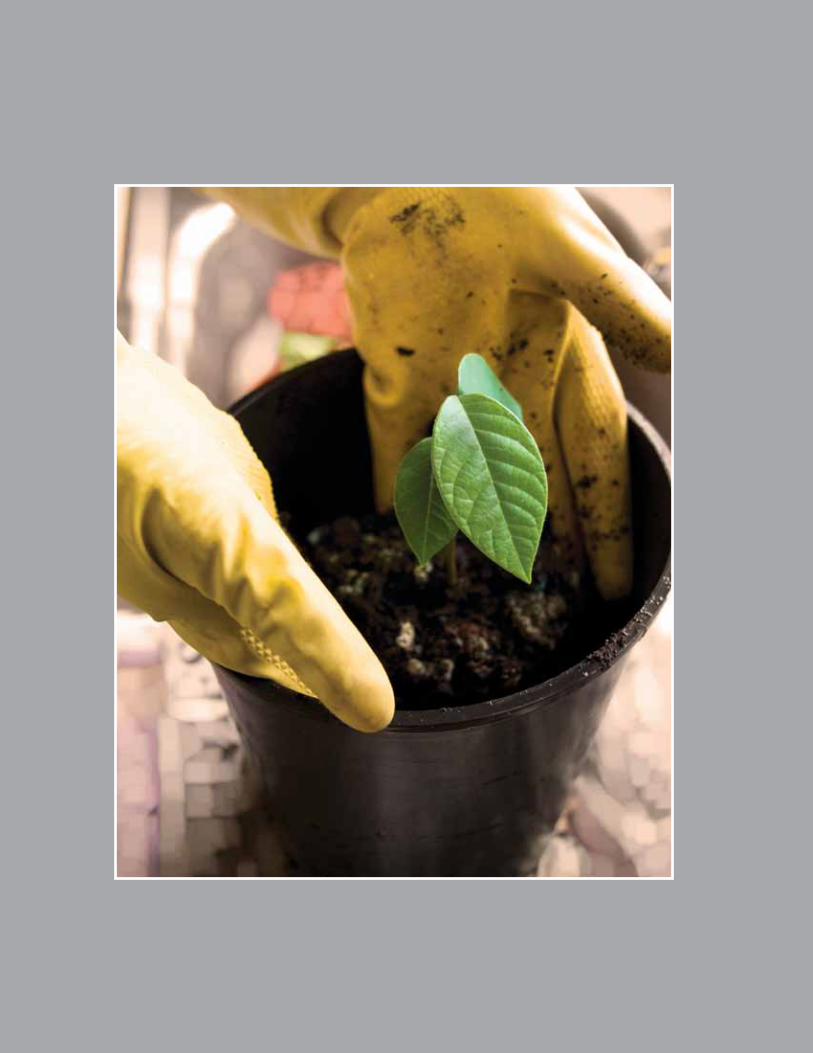
43

44
Recent experience in green job training has yielded valuable lessons. First, in order to en-sure the maintenance of high standards and job transferability, certification programmes must be developed; both Governments and industry leaders can play an important role in this regard. Second, training institutions must work closely with local employers and indus-try associations to meet emerging labour de-mand. Finally, it may still be necessary to raise awareness among some employers about the future potential of green sectors. A survey con-ducted in Australia among young tradespeople indicated that youth were willing to learn green skills; 87 per cent of the respondents were ei-ther “interested” or “very interested” in acquir-ing such skills, but three quarters of them felt they lacked the knowledge and opportunity to pursue their interest. While a significant propor-tion of those surveyed cited cost as an obsta-cle to the implementation of green skills on the job, an even larger percentage identified “lack of interest by employer” or “work attitudes” as barriers (Dusseldorp Skills Forum, 2008).
Aside from ensuring that young people are pro-vided with a quality education and appropri-ate skills training, there are two key strategies that may be adopted to help youth make the transition to green jobs: promoting green entre-preneurship and (temporarily, at least) involv-ing them in environmental public employment schemes.
Youth entrepreneurship
With increasing numbers of youth joining the labour market, entrepreneurship can be an important source of job creation and can of-fer young people the chance to effect change. Young entrepreneurs can exploit opportunities to promote environmental sustainability in a number of different sectors including agricul-ture, renewable energy, and recycling.
Young people’s entrepreneurial potential is fu-elled by their creativity and willingness to try new approaches. However, their relative inex-perience and limited resources and networks place them at a disadvantage. Starting a new business is risky, and potential entrepreneurs must be well prepared. In order to ensure the viability of green youth ventures, young people must be provided with entrepreneurship train-ing, including support in the development of business plans and access to technology and
technical know-how. Once the groundwork has been laid, seed grants and manageable financ-ing options need to be made available to youth to start their own businesses.
In some regions, notably the Middle East and North Africa, entrepreneurship is still regarded as less appealing than public sector employ-ment. In these areas, new initiatives that foster an entrepreneurial spirit among youth should be implemented, and increased emphasis on green and social entrepreneurship should be incorporated in existing initiatives.
Environmental public employment programmes
Environmental public employment programmes can provide young people with marketable skills and work opportunities while at the same time engaging them in environmental rehabilitation and conservation. Historically, public employ-ment programmes have been used to create jobs for the poor and unemployed in times of crisis. In some cases, these jobs have contrib-uted to environmental sustainability while also providing a livelihood for those in need. The Civilian Conservation Corps, established in the United States in 1933 as one of the New Deal programmes during the Great Depression, is one such example. Active until 1942, this initia-tive provided employment for 2 million people. The Corps planted between 2 billion and 3 bil-lion trees, controlled erosion on 40 million acres of farmland, facilitated mosquito control over 230,000 acres of land, established 711 State parks, and developed 3 million acres of land for park use (Lieuw-Kie-Song, 2009). Although this type of environmental public employment programme typically targets the poor, a case could be made for expanding it to include un-employed youth.
In response to the global financial and econom-ic crisis set in motion in 2008, leaders around the world have called for the implementation of the Green Economy Initiative, or Global Green New Deal, launched by UNEP. Components of this initiative could be executed through public employment programmes, with specific areas of concentration selected on the basis of local and national needs and priorities. A number of countries, including India and South Africa, have piloted public employment initiatives that provide poor unemployed or underemployed individuals with labour-intensive work, and

45
many of these could be adapted to provide green jobs for youth (Lieuw-Kie-Song, 2009). The Working for Water initiative in South Af-rica is one such example (see box III.7). Public employment schemes could also be a useful mechanism for involving youth in specific in-dustries such as public transportation, which might otherwise not seem like an obvious ca-reer choice for young people.
box III.7
Youth employment through invasive alien species eradication
Under the South African Government’s Expanded Public Works Programme, more than 800,000 jobs have been created in sectors such as infrastruc-ture, services, and agriculture. One particular programme—Working for Water—has provided at least 6,000 young people with short-term jobs and training in clearing invasive alien spe-cies and has supplied them with the in-formation and experience they need to start their own micro-enterprises in the discipline. The Programme employs out-of-work youth and poor residents to clear areas where invasive alien species of plants are causing prob-lems. Such efforts allow less-water-demanding native vegetation to flour-ish, increase stream flows and water availability, raise land productivity and hence land values, and strengthen re-silience to fires.
The Programme’s success has spurred the creation of spin-off initiatives us-ing a similar labour-intensive, cost-effective, and sustainable approach to dealing with natural resource issues. These initiatives include Working for Wetlands, Working on Fire, Working for the Coast, Working on Waste, and more recently, Working for Forests and Working for Energy. The last initia-tive listed is designed to help provide universal access to affordable energy services through the use of decentral-ized renewable energy technologies
such as solar water heaters. Because these types of technologies play such an important role in climate change mitigation and adaptation, there is substantial support for the rapid im-plementation and scaling up of this initiative, which could greatly benefit energy-poor communities and unem-ployed youth.
Sources: Maikel R. Lieuw-Kie-Song (2009), Green Jobs for the Poor: A Public Employment Approach; and IRIN (2009), “South Africa: need to cre-ate more jobs for the youth”.
In order to ensure sustained success, envi-ronmental public employment programmes must include components that facilitate young participants’ transition to more permanent employment. One option might be to estab-lish a link between these public employment programmes and existing youth training pro-grammes in order to provide young people with targeted skills and environmental awareness so that they will be able to identify entrepreneur-ship opportunities in the field of environmen-tal conservation and rehabilitation (Lieuw-Kie-Song, 2009).
Despite the divide between the environmen-tal concerns and the consumption behaviour among youth, progress is being made. Cli-mate change education is critical to bridge this gap and can teach youth to adopt a life-cycle perspective when making their consumption choices. What is important is for young peo-ple to have access to environmental education that is developed in a way that is relevant to their specific context. There is an opportuni-ty for youth from all walks of life to contribute now, whether it is in their homes, schools or their places of work. Considering the influ-ence young people have over the purchasing decisions of their friends and families, changes made now could produce not only immediate tangible benefits, but also have a far-reaching effect on the future of the economy, ecology and the societies of generations to come.

46
sUggestIons FoR FURtHeR ReAdIng
• Bentley, Matthew, John Fien and Cam-eron Neil (2004). Sustainable Consump-tion: Young Australians as Agents of Change. Canberra: National Youth Af-fairs Research Scheme.
This study explores how young people can be encouraged and empowered to make changes in their own consumption patterns as well as being catalysts for change in the wider com-munity. The focus is mainly on Australian youth, though international evidence is reported where available.
• United Nations Educational, Scientific and Cultural Organization and Unit-ed Nations Environment Programme (2001). Youth, Sustainable Consump-tion Patterns and Life Styles. Prepared within the framework of the UNESCO Management of Social Transformations Programme. SHS-2001/WS/13. Avail-able from http://unesdoc.unesco.org/images/0012/001242/124238e.pdf.
This report examines the results of the 2000 UNEP/UNESCO Survey on Youth and Con-sumption: Is the Future Yours?, which consti-tuted part of the UNESCO/UNEP joint project on Youth, Sustainable Consumption and Life Styles. An effort is made in the report to interpret some preliminary findings on young people’s attitudes towards consumption, and to iden-tify the potential role of youth in the transition towards sustainable consumption lifestyles.
• United Nations Educational, Scientific and Cultural Organization and Unit-ed Nations Environment Programme (2008). Towards Sustainable Lifestyles: youthXchange Training Kit on Respon-sible Consumption—The Guide. Avail-able from http://unesdoc.unesco.org/images/0015/001587/158700e.pdf; the online training kit is available from www.youthxchange.net.
The youthXchange guide and related website constitute a toolkit to help teachers, NGOs, and youth groups raise awareness of sustain-able consumption and empower youth to put theory into practice. By providing accessible information, concrete examples, and specific
facts and figures, UNEP and UNESCO endeav-our to show young people that it is possible to translate their aspirations for a better world into effective action.
• United Nations Environment Programme and others (2008). Green Jobs: To-wards Decent Work in a Sustainable, Low-Carbon World. Report prepared by Worldwatch Institute, with assistance from Cornell University Global Labour Institute; commissioned and funded by UNEP as part of the joint UNEP, ILO, IOE, ITUC Green Jobs Initiative. Nairobi: Sep-tember. DRC/1069/PA. Available from http://www.unep.org/labour_environ-ment/PDFs/greenjobs/uNEP-green-Jobs-Report.pdf.
The Green Jobs report explores the impact a transformation to a green economy could have on work, enterprise, and the way people earn a living. Drawing on information from around the world, this study is the first that has provided a
global overview of these issues.
• Worldwatch Institute (2004). State of the World 2004—Special Focus: The Con-sumer Society. New York: W.W. Norton/Worldwatch Institute.
This edition of State of the World examines how and why people consume and what kind of im-pact their consumption choices have on the planet and their fellow human beings. It argues that Governments, businesses, and concerned citizens can harness their purchasing power to build markets for products that do not destroy the environment and maintains that a less con-sumptive society is not only possible but es-sential.
• Worldwatch Institute (2010). State of the World 2010—Transforming Cultures: From Consumerism to Sustainability. New York: W.W. Norton/Worldwatch In-stitute. Available from http://www.worldwatch.org/node/6369.
The most recent edition of State of the World argues that consumerism has engulfed hu-man cultures and the world’s ecosystems. In the report, 60 renowned researchers and prac-titioners describe how the world’s leading in-stitutions—education, the media, business, Governments, traditions, and social move-ments—can be used to reorient cultures to-ward sustainability.
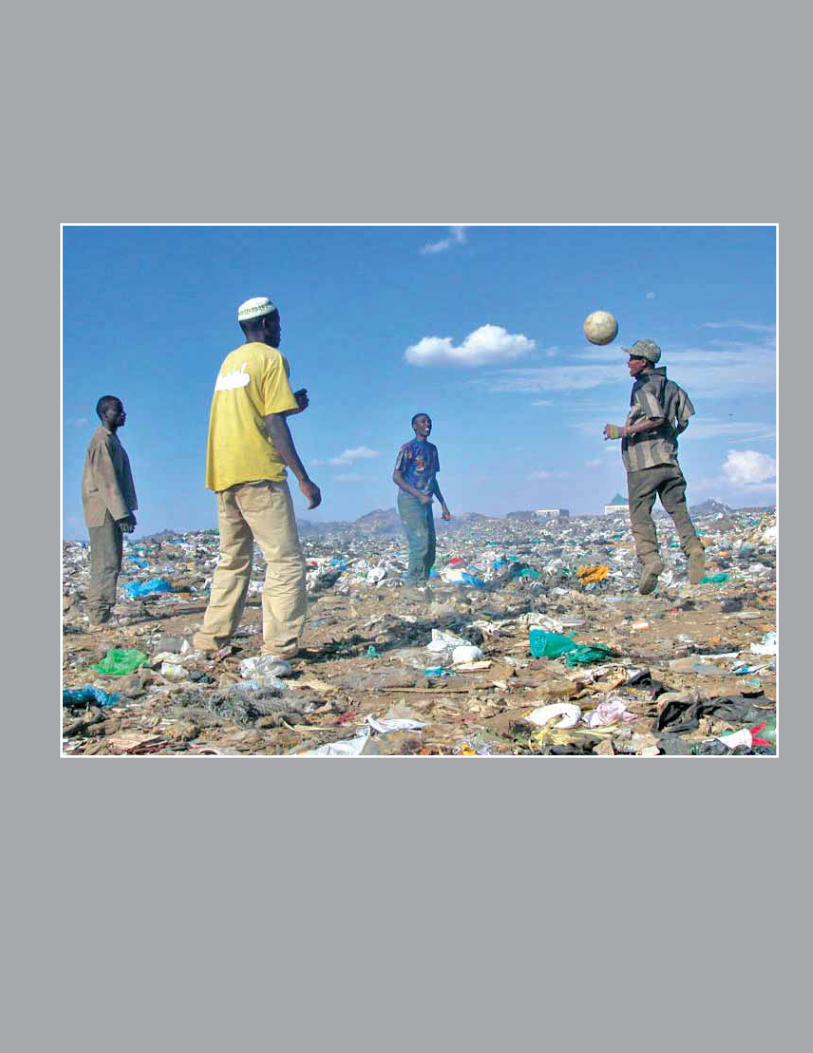
47

cH
AP
te
R IV
cHAPteR IVMoving forward: youth taking action and making a difference
The combined acumen and involvement of all individuals, from regular citizens to scientific experts, will be needed as the world moves forward in implementing climate change miti-gation and adaptation measures and promot-ing sustainable development. Young people must be prepared to play a key role within this context, as they are the ones who will live to experience the long-term impact of today’s crucial decisions.
The present chapter focuses on the partici-pation of young people in addressing climate change. It begins with a review of the various mechanisms for youth involvement in environ-mental advocacy within the United Nations system. A framework comprising progressive levels of participation is then presented, and concrete examples are provided of youth in-volvement in climate change efforts around the globe at each of these levels. The role of youth organizations and obstacles to partici-pation are also examined.
49
PRomotIng YoUtH PARtIcIPAtIon wItHIn tHe UnIted nAtIons The United Nations has long recognized the importance of youth participation in decision-making and global policy development. Envi-ronmental issues have been assigned priority in recent decades, and a number of mechanisms have been established within the system that enables youth representatives to contribute to climate change deliberations. A variety of youth advisory bodies and youth caucuses provide young people with opportunities to share their ideas. However, as shown later in the chap-ter, the existing participatory mechanisms fre-quently do not allow them to contribute mean-ingfully to the decision-making process.
The Convention on the Rights of the Child emphasizes that participation is a substantive right and is the means through which children and young people may take part in and influ-ence processes, decisions, and activities in order to achieve justice, shape outcomes, ex-pose abuses of power, and realize their rights. The intent underlying this Convention was reaf-firmed in 1995, when the United Nations Gen-eral Assembly adopted the World Programme of Action for Youth to the Year 2000 and Be-yond (United Nations, 1995), and again in 2007, in the Supplement to the World Programme of Action (United Nations, 2007a). Generally con-sidered the first global blueprint for developing effective policies for young people, the World Programme of Action for Youth2 identifies full and effective participation of youth in the life of society and in decision-making as one of fifteen priority areas requiring action by Gov-ernments, the international community, civil so-ciety, and the private sector (see box IV.1). As stated in the World Programme of Action, “the capacity for progress of our societies is based, among other elements, on their capacity to in-corporate the contribution and responsibility of youth in the building and designing of the fu-
2 In its resolution 47/1 on policies and programmes involving youth, adopted in 2009, the Commission for Social Development stated that the World Programme of Action for Youth to the Year 2000 and Beyond (United Nations, 1995) and its Supplement (United Nations, 2007a) would henceforth be referred to as the World Programme of Action for Youth (United Nations, Com-mission for Social Development, 2009).
ture. In addition to their intellectual contribution and their ability to mobilize support, they bring unique perspectives that need to be taken into account” (United Nations, 1995, para. 104).
box IV.1
The World Programme of Action for Youth on the importance of participation
The World Programme of Action for Youth recognizes that the active en-gagement of young people is central not only to their own development but to the development of society as a whole. It acknowledges that young people are part of the solution to the difficulties facing society—not another problem to be solved.
Because the economic, social, and political participation of youth is es-sentially a prerequisite for the imple-mentation of the proposals included in all the other priority areas of the Pro-gramme of Action, promoting the in-volvement of young people is critically important. Proposals for action relat-ing specifically to youth participation include the following:
(a) Improving access to information in order to enable young people to make better use of their oppor-tunities to participate in decision-making;
(b) Developing and/or strengthening opportunities for young people to learn their rights and responsibili-ties, promoting their social, politi-cal, developmental and environ-mental participation, removing obstacles that affect their full con-tribution to society and respecting, inter alia, freedom of association;
(c) Encouraging and promoting youth associations through financial, edu-cational and technical support and promotion of their activities;
(d) Taking into account the contri-bution of youth in designing,
50
implementing and evaluating na-tional policies and plans affecting their concerns;
(e) Encouraging increased national, regional and international coopera-tion and exchange between youth organizations;
(f) Inviting Governments to strengthen the involvement of young people in international forums, inter alia, by considering the inclusion of youth representatives in their national del-egations to the General Assembly.
Source: United Nations (1995), World Programme of Action for Youth to the Year 2000 and Beyond; proposals for action are reproduced verbatim from para. 107.
The environment was identified as one of the original ten priority areas in the World Pro-gramme of Action for Youth. While climate change was not considered a high priority at the time the Programme was adopted, the de-terioration of the natural environment was. In-terest in the environment intensified over the years, becoming one of the principal concerns of young people worldwide. In 2008, youth del-egates to the United Nations General Assem-bly identified climate change as one of their key priority areas for action in the lead-up to the regular Assembly sessions. During the General Assembly debate that year, youth delegates spoke about the eagerness of young people to participate in decision-making on critical is-sues such as climate change.
Another important avenue for youth participa-tion in United Nations intergovernmental pro-cesses is the Youth Caucus of the United Na-tions Commission on Sustainable Development (CSD Youth Caucus). The Youth Caucus is the interface used by the major group represent-ing the interests of children and young people around the world, as mandated by chapter 25 of Agenda 21, to communicate the perspec-tives of youth and coordinate their participation in the meetings of the Commission on Sus-tainable Development, and to increase youth visibility and involvement within this context. The Youth Caucus is an international network
of 2,000 youth leaders from more than 1,000 youth organizations, many of which are nation-al networks that bring together young people with a desire to contribute to the creation of a more sustainable world. The Youth Caucus fa-cilitates the introduction of youth perspectives to the Commission on Sustainable Develop-ment, which is the highest-level forum within the United Nations system for sustainable de-velopment issues. In addition, the Youth Cau-cus fosters communication and the sharing of information between youth organizations that share an interest in sustainability (United Na-tions, CSD Youth Caucus, 2008).
Young people have also played a prominent role within the United Nations Permanent Fo-rum on Indigenous Issues, especially at its sev-enth session (April 2008), whose special theme was “Climate change, bio-cultural diversity and livelihoods: the stewardship role of indigenous peoples and new challenges”. The Indigenous Youth Caucus brought together 145 indigenous young people from more than a dozen coun-tries. In one of its statements to the Forum at the seventh session, the Caucus highlighted the role indigenous youth could play in the fight against climate change but also expressed its concern over the limited participation of indig-enous youth in decision-making processes at the local, national, and international levels (see box IV.2).
box IV.2
Mainstreaming indigenous peoples’ issues in international development assistance pro-grammes and funds dedicated to addressing climate change
Indigenous peoples, in particular in-digenous youth, feel that they have been largely excluded from discus-sions on climate change at all levels. Indigenous youth have much to con-tribute and want the international com-munity to recognize that their people offer unique perspectives and tradi-tional knowledge that can be used in the development of mitigation and ad-aptation strategies. The involvement of indigenous youth as full and effective partners will be important to the suc-
51
cess of global climate change mitiga-tion efforts. Prioritizing programmes aimed at increasing climate change awareness among indigenous youth through education and training would greatly enhance their capacity to par-ticipate in decision-making processes. Such efforts could also include the strengthening of networks through which indigenous youth might share their perspectives and experiences with their counterparts in other areas of the world.
Paragraph 7 of the Anchorage Decla-ration, issued on 24 April 2009 at the conclusion of the Indigenous Peoples’ Global Summit on Climate Change, reads as follows: “We call for adequate and direct funding in developed and developing States ... to enable In-digenous Peoples’ full and effective participation in all climate process-es, including adaptation, mitigation, monitoring and transfer of appropri-ate technologies in order to foster our empowerment, capacity-building, and education. We strongly urge relevant United Nations bodies to facilitate and fund the participation, education, and capacity-building of Indigenous youth and women to ensure engagement in all international and national process-es related to climate change.”
Source: Anchorage Declaration (2009).
Many of the other United Nations organizations that deal with youth issues have identified cli-mate change as a key concern and have made it the focus of various initiatives. For example, the United Nations Children’s Fund (UNICEF), in partnership with UNEP, has developed Unite for Climate, a social networking tool that serves as a platform for youth exchange and mobili-zation for action on climate change. Unite for Climate also enables UNICEF and other United Nations agencies to communicate with youth. The group’s software is designed to work in ar-eas with connectivity or bandwidth limitations and to accommodate varying skill levels among users, thereby maximizing participation.
UNEP is working in countries around the world to promote youth involvement in combating climate change. In February 2003 the Pro-gramme’s Governing Council adopted the Tun-za Youth Strategy, a long-term approach to en-gaging young people in the work of UNEP and supporting their participation in environmental activities and decision-making. Through Tunza, UNEP facilitates youth participation in global and regional environmental negotiations. Initia-tives and activities, including the involvement of youth in the UNEP Governing Council ses-sions, are preceded by a Tunza youth retreat to enable youth leaders to review the issues be-ing discussed and agree on their contributions to these discussions. The Tunza International Youth Conference, held every two years, is one of the key platforms for cooperation and inter-action between UNEP and its youth partners.
YoUtH PARtIcIPAtIon And tHe UnIted nAtIons FRAmewoRk conVentIon on clImAte cHAngeAs noted in chapter I of the present Report, the annual COP sessions constitute the princi-pal forum for Governments to discuss climate change mitigation and adaptation policies as well as national commitments to reduce GHG emissions, so youth involvement in this pro-cess is especially critical. The youth presence at COP sessions has gradually gained strength and focus. What was once a relatively loose configuration of participants—generally small numbers of college students and young profes-sionals from developed countries—has evolved into more unified and coordinated youth contingents; hundreds attended COP 14 in Poznan, Poland, in 2008, and more than a thou-sand participated in COP 15 in Copenhagen.
Young people have been involved in climate change activities for some time. However, it was not until the year 2000, at COP 6 in The Hague, that a youth conference was organized and a youth declaration was prepared. Since then, each COP session has incorporated a youth event, and young people have actively sought official recognition from the Confer-ence. In 2004, at COP 10 in Buenos Aires,
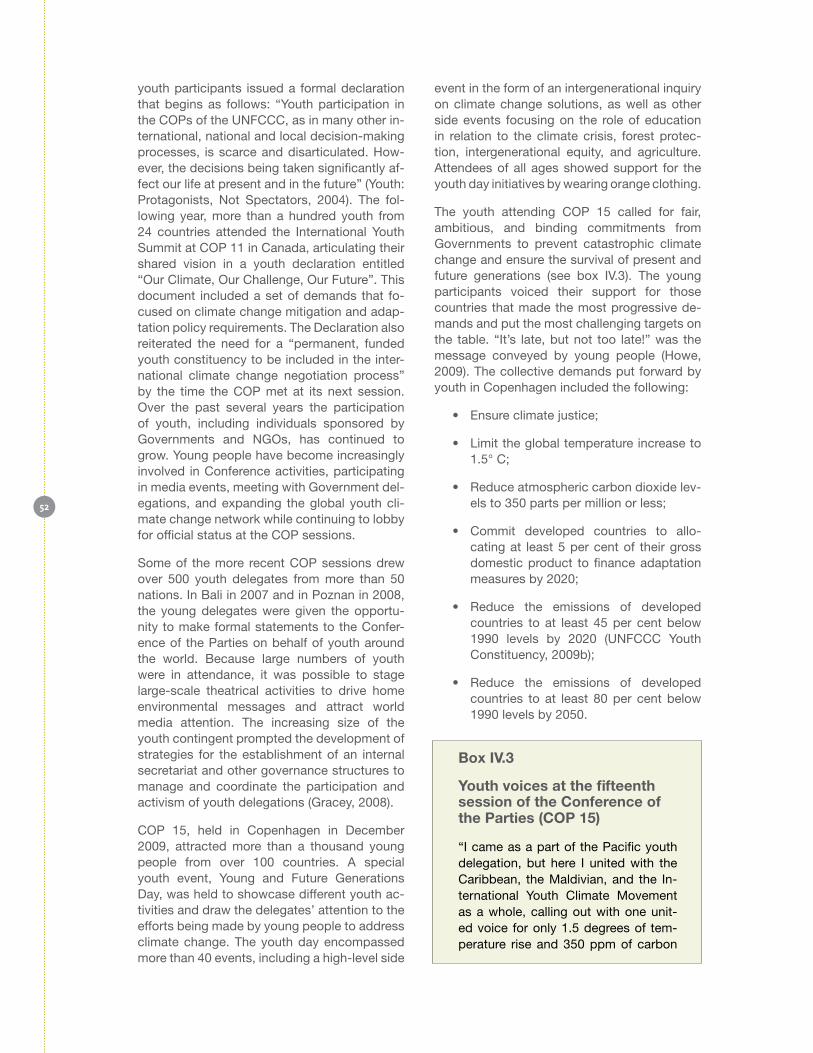
52
youth participants issued a formal declaration that begins as follows: “Youth participation in the COPs of the UNFCCC, as in many other in-ternational, national and local decision-making processes, is scarce and disarticulated. How-ever, the decisions being taken significantly af-fect our life at present and in the future” (Youth: Protagonists, Not Spectators, 2004). The fol-lowing year, more than a hundred youth from 24 countries attended the International Youth Summit at COP 11 in Canada, articulating their shared vision in a youth declaration entitled “Our Climate, Our Challenge, Our Future”. This document included a set of demands that fo-cused on climate change mitigation and adap-tation policy requirements. The Declaration also reiterated the need for a “permanent, funded youth constituency to be included in the inter-national climate change negotiation process” by the time the COP met at its next session. Over the past several years the participation of youth, including individuals sponsored by Governments and NGOs, has continued to grow. Young people have become increasingly involved in Conference activities, participating in media events, meeting with Government del-egations, and expanding the global youth cli-mate change network while continuing to lobby for official status at the COP sessions.
Some of the more recent COP sessions drew over 500 youth delegates from more than 50 nations. In Bali in 2007 and in Poznan in 2008, the young delegates were given the opportu-nity to make formal statements to the Confer-ence of the Parties on behalf of youth around the world. Because large numbers of youth were in attendance, it was possible to stage large-scale theatrical activities to drive home environmental messages and attract world media attention. The increasing size of the youth contingent prompted the development of strategies for the establishment of an internal secretariat and other governance structures to manage and coordinate the participation and activism of youth delegations (Gracey, 2008).
COP 15, held in Copenhagen in December 2009, attracted more than a thousand young people from over 100 countries. A special youth event, Young and Future Generations Day, was held to showcase different youth ac-tivities and draw the delegates’ attention to the efforts being made by young people to address climate change. The youth day encompassed more than 40 events, including a high-level side
event in the form of an intergenerational inquiry on climate change solutions, as well as other side events focusing on the role of education in relation to the climate crisis, forest protec-tion, intergenerational equity, and agriculture. Attendees of all ages showed support for the youth day initiatives by wearing orange clothing.
The youth attending COP 15 called for fair, ambitious, and binding commitments from Governments to prevent catastrophic climate change and ensure the survival of present and future generations (see box IV.3). The young participants voiced their support for those countries that made the most progressive de-mands and put the most challenging targets on the table. “It’s late, but not too late!” was the message conveyed by young people (Howe, 2009). The collective demands put forward by youth in Copenhagen included the following:
• Ensure climate justice;
• Limit the global temperature increase to 1.5° C;
• Reduce atmospheric carbon dioxide lev-els to 350 parts per million or less;
• Commit developed countries to allo-cating at least 5 per cent of their gross domestic product to finance adaptation measures by 2020;
• Reduce the emissions of developed countries to at least 45 per cent below 1990 levels by 2020 (UNFCCC Youth Constituency, 2009b);
• Reduce the emissions of developed countries to at least 80 per cent below 1990 levels by 2050.
box IV.3
Youth voices at the fifteenth session of the Conference of the Parties (CoP 15)
“I came as a part of the Pacific youth delegation, but here I united with the Caribbean, the Maldivian, and the In-ternational Youth Climate Movement as a whole, calling out with one unit-ed voice for only 1.5 degrees of tem-perature rise and 350 ppm of carbon

53
concentration in the atmosphere”, said Krishneil Narayan from Fiji. “If the youth can unite as one movement at COP 15, we expect the leaders decid-ing our future to do the same” (UN-FCCC Youth Constituency, 2009b).
Prisca Randriamampihavana, a 20-year-old youth delegate from Mad-agascar, challenged the negotiators at COP 15: “We want to ask world lead-ers, how old will you be in 2050?” (UN-
FCCC Youth Constituency, 2009a).
COP 15 marked the first time youth were of-ficially recognized as a formal constituency, though the group was assigned provisional sta-tus pending a final decision that would legiti-mize its position by COP 17 (see box IV.4). The youth constituency has already set up an inter-nal system for democratic decision-making and information sharing and is very well-organized. It keeps the United Nations Climate Change secretariat informed of its progress and con-tributes to crucial discussions and decisions relating to youth participation and representa-tion. The constituency plays an important role in capacity-building for a growing number of youth participants, with those who have been involved for some time helping newcomers un-derstand how the process works through en-gagement in various advocacy activities. The youth constituency is also active on the po-litical front, producing powerful messages for interventions at the plenary and building rela-tionships with other stakeholders, including the chairs of negotiating bodies and regional groups as well as the other constituencies. All of this has been achieved in a remarkably short time by a group that appears to enjoy an extraordi-nary degree of unity, coherence, and cohesion.
box IV.4
The status of the youth con-stituency in activities carried out under the auspices of the united Nations Framework Convention on Climate Change
The youth constituency, referred to as YOUNGO, was assigned provisional
status during the fifteenth session of the Conference of the Parties and will likely be granted permanent status at COP 17. This unprecedented coali-tion of participating youth organiza-tions acts as a single entity with a uni-fied voice during official negotiations. As a recognized constituency, young people are given a speaking slot at the high-level segment of COP ses-sions and can make statements during the plenary. They are also able to co-operate more closely with the United Nations Climate Change secretariat, helping to organize meeting logistics and coordinate fundraising to increase the participation of young people, es-pecially youth from the global south. Conference support for youth involve-ment is already in evidence; generous funding from the Government of the Netherlands enabled 50 youth from the global south to attend COP 15 in December 2009.
The recognition and support of the youth constituency is in line with the provisions of article 6 of the Frame-work Convention, which calls for an increase in education, training, and public awareness on climate change issues.
Source: UNFCCC YOUNGO Wiki Por-tal (n.d.), YOUNGO constituency FAQ.
Growing numbers of young people are partici-pating in United Nations efforts to combat cli-mate change, seeking to influence the global policy agenda through more organized environ-mental activism and lobbying to promote sus-tainable development. More youth than ever before are attending international meetings, making their voices heard as they demand that Governments and policymakers undertake the commitments necessary to tackle climate change and ensure global sustainability. Un-fortunately, while their ideas, concerns, initia-tives, and calls for action are being acknowl-edged, youth are rarely given the consideration they deserve—or the opportunity to participate meaningfully—in the formulation of climate change policy.
54
The section below takes a closer look at the various levels of youth participation, provides examples of youth involvement in climate change initiatives at each of these levels, and considers what needs to be done to ensure that youth play a more active role in decision-making.
YoUtH PARtIcIPAtIon: clImBIng tHe lAddeR towARds genUIne emPoweRmentYoung people across the globe have been at the forefront of efforts to respond to climate change. However, they have fought a pro-tracted uphill battle to ensure that their voices are not just heard, but heeded. Although youth are allowed to participate in many of the high-er-level policy processes, consultations, and activities, they often remain on the periphery, excluded from decision-making. Young people want to be involved and, given their stake in the future, should be involved in shaping climate change policies. Youth participation is critically important and needs to be given the recogni-tion it deserves, as it benefits not only young people themselves, but also society as a whole (Biffi, 2008).
Significant awareness-raising efforts have been undertaken to ensure that young people are in-formed about the causes and consequences of climate change. Such efforts are important in that they provide a solid knowledge base and in some cases facilitate the development of targeted skills, but they essentially consti-tute a one-way process that contributes only minimally to building capacities for responding to climate change through meaningful engage-ment. When young people are empowered to collaborate in setting the agenda for change and shaping policy, they become full partners in action, strengthening the community’s ca-pacity to make a difference.
The ladder of participation
Youth involvement in climate change initia-tives may be examined in terms of levels of empowerment, represented as a “ladder of participation” (International Association for Public Participation, 2007). The lowest rungs
on the ladder sometimes constitute what may be termed pseudo-participation (Hart, 1992), where young people serve as window dressing, their involvement is essentially tokenistic, or they are manipulated into arriving at predeter-mined outcomes. The middle and higher rungs, however, represent a progression towards gen-uine empowerment and include the following:
1. Informing and educating young people;
2. Gathering information from young people;
3. Consulting with young people;
4. Involving young people;
5. Establishing collaborative partnerships
with young people.
Providing young people with information and education on climate change establishes a firm foundation for environmental advocacy. On this first rung of the ladder, however, youth are offered few, if any, opportunities to influence policy decisions. Involvement at this level is usually limited to exchanging ideas and build-ing relationships. In some instances, youth are recruited to help coordinate information ses-sions or to serve as peer educators.
On the second rung of the ladder, information is collected from young people who care about the environment and want to share their per-spectives. At this level of participation youth are heard, but those in positions of authority make no commitment to acting in ways that give the youth voice any force.
The third rung is consulting with youth. This level constitutes a potential tipping point, as it is here that the balance may begin to shift towards meaningful involvement and genuine empowerment. Consultation entails the mu-tual exchange of information and allows for the possibility that the input of young people might have an impact on the direction policy takes or on the content of programmes being developed.
By the time the fourth rung is reached, the in-volvement of youth is being actively sought. Young people are given the opportunity to help set the agenda, contribute to deliberations, or otherwise influence the course of events.
At the fifth rung—the highest level—youth are engaged in collaborative partnerships. In such settings, young people are empowered to
55
share in managing the decision-making pro-cess, which includes identifying solutions and reaching agreement as to how the solutions generated will be implemented.
At each of the levels of participation represent-ed by the rungs of the ladder, actions initiated by youth improve their prospects for exerting genuine influence. Every level constitutes a necessary step to the top but is also important in itself. Participation on the lower rungs often leads to action further up the ladder and to en-hanced empowerment; however, even those young people whose involvement remains on the lower rungs may contribute to an initiative’s success.
In general, the key principles of effective and authentic participation are clarity of intent (the purpose is understood by all involved); inclu-siveness (participants are diverse and include those not often heard); participativeness (op-portunities are available for two-way exchange, mutual learning, and relationship-building); and the scope to influence (the potential exists to bring about change in some way or to some degree).
YoUtH PARtIcIPAtIon In clImAte cHAnge InItIAtIVes ARoUnd tHe woRldYouth initiatives focusing on climate change have a broad range of entry points, and there are examples from all over that show how youth have been involved in mitigation and adapta-tion efforts. The youth activities highlighted in the sections below constitute a representative sample of the types of advocacy in which young people are currently engaged. Most of the ex-amples derive from contributions submitted by youth and youth-led organizations in response to a call for inputs to the present World Youth Report. They are not linked to specific rungs on the ladder of participation but instead re-flect the gradual progression from awareness-raising to active collaboration. The examples in this chapter are illustrative and do not comprise a comprehensive catalogue of youth initiatives. The seeming predominance of developed country activities in the sections to come is a reflection of the availability of relevant informa-
tion and inputs; it is unclear at this point wheth-er youth involvement in climate change initia-tives is more prevalent in developed countries or whether youth in developed countries are simply more likely to report on their activities. It is also possible that many youth initiatives in developing countries are subsumed under another heading—such as disaster planning or relief—and are therefore not readily identifiable as relating to climate change.
InFoRmIng And edUcAtIng YoUtH
Before young people can participate effectively in mitigation and adaptation activities, they must learn about both climate change and success-ful advocacy. Increased content knowledge is essential, but young people also need to know how to interpret data and assess risks, prob-abilities, and opportunities. It might appear that participation at this level is limited to one-way, top-down communication in which “experts” tell young people what they think they should know, contributing little to their empowerment. However, there are many examples (including those highlighted below) of youth actively and successfully educating each other in formal, informal, and non-formal contexts. Qualitative evaluations of peer education in other areas have shown that young people appreciate and are positively influenced by well-designed and properly supervised peer-led instruction. Youth serving as peer educators have the opportunity to improve their own knowledge and skills and generally find the experience both challenging and rewarding. In many instances peer educa-tors have been shown to be more effective than adults in establishing norms and changing at-titudes (United Nations Children’s Fund, 2009).
International
The International Federation of Red Cross and Red Crescent Societies (2009a) include 186 member National Societies, many of which sponsor dynamic youth volunteer programmes. Initiatives focused on raising awareness about climate change include the following:
CoLoMbIA
Youth-led community-based approach-es to raising awareness about climate change have included the production of dramas and puppet shows and the devel-
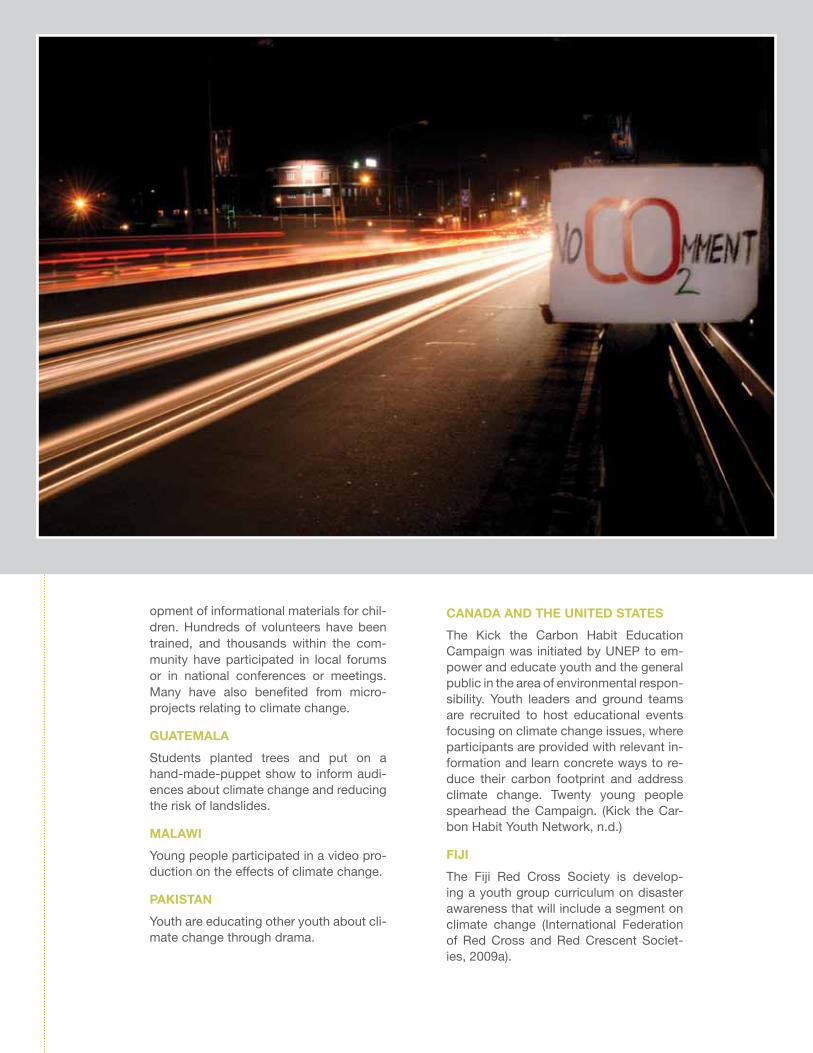
56
opment of informational materials for chil-dren. Hundreds of volunteers have been trained, and thousands within the com-munity have participated in local forums or in national conferences or meetings. Many have also benefited from micro-projects relating to climate change.
guATEMALA
Students planted trees and put on a hand-made-puppet show to inform audi-ences about climate change and reducing the risk of landslides.
MALAWI
Young people participated in a video pro-duction on the effects of climate change.
PAKISTAN
Youth are educating other youth about cli-mate change through drama.
CANADA AND THE uNITED STATES
The Kick the Carbon Habit Education Campaign was initiated by UNEP to em-power and educate youth and the general public in the area of environmental respon-sibility. Youth leaders and ground teams are recruited to host educational events focusing on climate change issues, where participants are provided with relevant in-formation and learn concrete ways to re-duce their carbon footprint and address climate change. Twenty young people spearhead the Campaign. (Kick the Car-bon Habit Youth Network, n.d.)
FIJI
The Fiji Red Cross Society is develop-ing a youth group curriculum on disaster awareness that will include a segment on climate change (International Federation of Red Cross and Red Crescent Societ-ies, 2009a).
57
NEW ZEALAND
Enviroschools is a national initiative that takes a whole-school approach to edu-cation for a sustainable future. The pro-gramme encourages creative thinking and the acknowledgement of others’ perspec-tives and seeks to bring about long-term behavioural change by helping students think critically about the long-term impact of their attitudes, values, and lifestyle choices (Enviroschools Foundation, n.d.).
SoLoMoN ISLANDS
The Honiara Youth and Climate Change Forum, held in November 2008, brought young people from the Solomon Islands together with an elder to learn about cli-mate change through discussion and fieldwork. Participants concluded the event with the development of personal and group action plans (Jionisi and Ow-ens, n.d.). The Solomon Islands Red Cross Society, one of the main organiz-ers of the Forum, began engaging youth in a climate change programme in 2007. Initiatives have included school aware-ness programmes, village assessments, radio quizzes, advocacy activities, and the building of youth networks. Young people are involved both as participants and as volunteers (International Fed-eration of Red Cross and Red Crescent Societies, 2009a).
YoUng PeoPle sHARIng InFoRmAtIon And BUIldIng cAPAcItY
Young people have come together in numerous forums around the world to share information and perspectives on climate change. In the process, they have strengthened their social capacity to respond to the challenges associ-ated with this issue. The distinction between informing/educating and information-sharing/capacity-building is not always clear, but it may be argued that the latter is situated slightly higher on the ladder of participation because it entails active learning, sharing, and developing. Capacity-building involves raising awareness, but it also encompasses building analytical skills and enhancing decision-making abilities. These outcomes can be achieved through dif-ferent approaches, including training, formal
education, seminars and workshops, and net-working. Many of the examples of youth par-ticipation that appear elsewhere in this chap-ter incorporate elements of capacity-building. However, those highlighted below are mainly awareness-raising activities. Most appear to be isolated events; it has been suggested that the effectiveness of such activities might be enhanced if they were embedded in long-term programmes that integrated a number of capacity-building approaches (United Nations Environment Programme, Division of Technol-ogy, Industry and Economics, Economics and Trade Branch, 2006).
INDIA
In August 2008, the Indian Youth Sum-mit on Climate Change brought together young people from India and abroad to share views and establish collaborative partnerships. The Summit included key-note speakers and presentations from ex-perts and organizations working with cli-mate change, youth presentations and the exchange of ideas among young people, an international youth panel on climate change, human art formation, and a film festival. One major outcome was a youth declaration that included individual com-mitments and a collective pledge to work towards a better future in India, together with a strong statement on the importance of youth engagement in policy-making on climate change at all levels (Indian Youth Summit on Climate Change, 2008).
TuVALu
Climate change adaptation and disaster risk reduction programmes led by the Red Cross Society have engaged youth in workshops on disaster risk assessment and response, including the production of a drama about flooding events that have occurred. This has prompted some young people to initiate similar activities in their own communities. The two programmes have also involved youth in planting pan-danus trees and cleaning up the shore-line. Youth unemployment is high in Tu-valu, and while such programmes do not provide any monetary compensation, they do offer youth an opportunity to engage in productive work that benefits their com-munities. Through the Red Cross Society, youth have also participated in school
58
programmes on climate change and in a national poster design competition focus-ing on this issue. (International Federation of Red Cross and Red Crescent Societies, 2009b)
uNITED KINgDoM
You, Me, and the Climate, an initiative of The National Trust, provides 16- to 19-year-old “climateers” with the organi-zational, communication, and leadership skills they need to become community advocates and get people in their area thinking about climate change and its consequences. The emphasis is not only on youth taking action, but on young peo-ple working together to give their actions force at the national and international lev-els through joint activities, coordinated media campaigns, and the use of the Web and other new media. (You, Me, and the Climate [YOMAC], n.d.).
YoUtH APPlYIng InFoRmA-tIon And commUnIcAtIon tecHnologIes
About 1.8 billion people use the Internet on a regular basis for their work, leisure activities, and general living needs (Internet World Stats, n.d.). Ever-expanding communication net-works are connecting people, organizations, and nations in ways that are unprecedented, with enormous potential for enhancing civic participation—including involvement in climate change initiatives. Global Internet usage re-mains very uneven, however. Although it has grown exponentially in developing countries, penetration rates are still relatively low—8.7 per cent in Africa, 20.1 per cent in Asia, and 28.8 per cent in the Middle East, compared with 76.2 per cent in North America (Internet World Stats, n.d.). Moreover, the global digital divide (the gap between those who have Internet ac-cess and those who lack access or the ability to use current technologies) is growing wider.
In the initiatives reviewed involving youth par-ticipation in climate change activities, espe-cially in the developed world, computers and the Internet appear to be central to bringing young people together for dialogue and ac-tion. Climate change is a global challenge, and the Internet has facilitated the development of worldwide networks, collaborative partner-
ships, and youth-led discussion forums. Where Internet access is limited, other audio-visual and telecommunications technologies have been utilized to engage young people in cre-ative new ways.
International
Make the Link, Be the Change uses a multilin-gual website and videoconferencing to develop climate change awareness among students. Participants learn about local environmental consequences, contributing factors, behaviour change, and partnerships using shared lesson plans. This is complemented by out-of-school work including essay writing, drawing, photog-raphy, and sculpture representing the impact of climate change. Some of the works created have been displayed at the World Museum Liv-erpool and at COP 15 as part of the Children in a Changing Climate display. Eighty schools in twelve countries are involved (Plan Interna-tional, 2009).
CANADA
TakingITGlobal uses information and communication technologies to provide opportunities for learning, capacity-build-ing, self-development, and cross-cultural awareness. One of the aims of the orga-nization is to increase recognition of the important role youth can play in decision-making processes. The TakingITGlobal website includes a page devoted to in-troducing youth to climate change issues and offers a downloadable version of the Climate Change Youth Guide to Action. A Web platform is made available to users interested in starting, running, and man-aging their own initiatives. (TakingITGlob-al, n.d.).
INDIA
In February 2009, the Indian Youth Cli-mate Network organized an electric car caravan that stretched from Chennai to Delhi—the longest such procession ever attempted. As the participants travelled, they reported on local innovative solu-tions to climate change, conducted nu-merous youth climate leadership training sessions, and engaged young people in brainstorming sessions. The stories they collected were written and disseminated in ways that appealed to youth, with many
59
appearing as short movies on YouTube. The aim of the project was to show the world that India was doing something about climate change. (Indian Youth Cli-mate Network, n.d.).
INDoNESIA
Children from a flood-prone informal set-tlement in Jakarta partnered in the pro-duction of a participatory video on climate change, and youth volunteers continue to use the video (International Federation of Red Cross and Red Crescent Societies, 2009a).
MALAWI
A university student intern produced a five-minute participatory video on climate change in collaboration with the Ma-lawi Red Cross Society, engaging fifteen young people in the process (International Federation of Red Cross and Red Cres-cent Societies, 2009a).
NIgERIA
The African Radio Drama Association’s climate change project is a 26-episode ra-dio production aimed at improving the ca-pacity of smallholder farmers to respond to climate change. The important role of youth and women in sustainable agricul-ture is highlighted. (African Radio Drama Association, n.d.).
NoRWAY
NUFF Global held an international youth film festival on climate change in 2007. In their productions, the enthusiastic young filmmakers share stories featuring chal-lenges that have arisen as a result of cli-mate change. Screened at the United Na-tions Climate Change conferences in Bali in 2007 and in Poznan in 2008, many of the films have garnered international at-tention. (NUFF Global, n.d.).
uNITED STATES
Fired Up Media reports from the front lines of the youth climate movement and trains climate change activists through an online organizing wiki. The network is harnessing dynamic advances in digital communications and other new media, creative social entrepreneurship, and ex-
isting youth media on and off campus to build a revolutionary media network. The aim is to empower the global youth cli-mate movement to address the challenge of climate change in the most effective way possible. Youth-produced stories and short videos are featured on the web-site. (Fired Up Media, n.d.).
YoUtH gAtHeRIng And AnAlYsIng InFoRmAtIon
The collection of local data on social indica-tors and the physical environment, the creation of databases, descriptions of initiatives, and benchmarking studies provide a deeper under-standing of the area-specific effects of climate change and also contribute to building knowl-edge and skills that can increase local adaptive capacity. Young people around the world have both led and participated in data-gathering ini-tiatives that have bolstered climate change re-search and strengthened local resilience to the consequences of climate change.
International
Our Task, an international youth network in-volved in promoting awareness of global sus-tainable development issues, works with men-tors in analysing, assessing, and summarizing relevant trends, models, and strategies to pro-duce the Youth Earth Plan, an annual publica-tion that “presents … the thinking of young adults on the large-scale changes needed if youth—and all forms of life—are to reach 2100 safely”. Forty young adults from fifteen coun-
tries are involved. (Our Task, 2008).
CHINA
The China Youth Climate Action Network comprises more than a hundred universi-ties, providing a platform for sharing solu-tions and taking action to combat climate change. The Network is especially active in research and development relating to campus sustainability. Core projects in-clude a survey on youth awareness, a green campus initiative that includes the collection of data on campus GHG emis-sions and their impact, the maintenance of a university energy consumption data-base, and the development and dissemi-nation of learning materials to increase awareness among youth. The Network
60
recently produced the China Youth Cli-mate Change Guidebook, which is being used on university campuses to promote student awareness and activism. One of the main goals of the Network is to reduce emissions by 20 per cent on 40 pilot cam-puses. (China Youth Climate Action Net-work, 2008).
MoNgoLIA
Dynamics of Biodiversity Loss and Per-mafrost Melt in Lake Hövsgöl National Park, a World Bank/Global Environment Facility project, hired 23 young graduate and post-graduate researchers to help in-vestigate the effects of localized climate variability on permafrost. Working with na-tional mentors and international academ-ics, the young researchers were offered invaluable learning opportunities in areas such as biostatistics, decomposition and ecology of local plants, meteorology, and permafrost studies. (Academy of Natural Sciences, n.d.).
NEPAL
Children in a Changing Climate is a global collaborative programme that undertakes research, advocacy, and education within an action-research framework in partner-ship with other research and development organizations. The programme has sever-al areas of focus, including gathering and assembling children’s perspectives, iden-tifying “child champions” to promote the adoption of environmentally responsible policies at the national and international levels, developing and sharing learning tools, inspiring child-led action through online forums and international networks, and sharing stories about how children are taking action on climate change. (Guatam and Oswald, 2008).
YoUtH InVolVement In cAmPAIgnIng, loBBYIng, And AdVocAcY
Youth organizations engaged in campaign-ing, lobbying, advocacy, and networking rep-resent the most prevalent and possibly the strongest form of youth involvement in the cli-mate change movement. These organizations employ a variety of strategies to achieve their
objectives. Some focus on encouraging young environmental advocates to take the first steps towards action, while others work directly with Government entities to facilitate the integration of green values at the State level. A number of youth organizations concentrate on a particular area, such as addressing legal challenges. A growing number are engaging in Internet activ-ism together with direct action in order to maxi-mize the impact of their efforts and to achieve the critical mass needed to make their voices heard.
International
Established by Greenpeace International in 2003, Solar Generation is a network of young people from 15 countries engaging in climate change advocacy and activism. (Greenpeace, n.d.).
CANADA AND THE uNITED STATES
Young people on high school and college campuses across Canada and the United States have joined the Campus Climate Challenge to demand 100 per cent clean energy policies at their institutions. More than 30 youth organizations and 600 campuses are involved. (Campus Climate Challenge, n.d.).
INDIA
The Indian Youth Climate Network is a co-alition of Indian youth and youth-oriented organizations concerned about climate change. The Network has launched, sup-ported, or participated in a wide range of initiatives, including an agents-of-change programme that prepares Indian youth delegations for participation in United Na-tions climate change negotiations; a rural clean energy project; a campus climate challenge; a climate leaders programme that provides youth with the leadership skills they need to initiate grassroots ac-tion in their own communities; and a cli-mate solutions project that includes a website, outreach activities, and an en-gagement strategy to promote existing solutions to climate change. In recent years the Network has organized a num-ber of Indian youth summits and partici-pated in various youth festivals. (Indian Youth Climate Network, n.d.).
61
uNITED STATES
In February 2009, 12,000 young people from across the United States converged on Washington, D.C., to demand bold, comprehensive, and immediate action on climate change at the national level. The aim was to persuade the new Obama Ad-ministration to reclaim the future of youth through the implementation of ambitious climate and clean energy policies. Power Shift ‘09 built on the momentum gener-ated by the Power Vote campaign, which was initiated by the Energy Action Coali-tion to mobilize 1 million young “climate voters” and make the global climate crisis a key issue in the 2008 election. (Power Shift, n.d.).
YoUtH engAgIng In consUltAtIon
The international frameworks and initiatives described previously have created numerous opportunities for young people to have their say. Similarly, several Governments and in-ternational agencies have set up youth advi-sory councils and other consultative initiatives aimed at eliciting the views of youth on climate change; some of these are highlighted below. Acknowledging the need for dialogue is a step in the right direction, but the extent to which such consultations have resulted in meaning-ful youth participation is not yet clear. Genuine engagement requires that young people be giv-en the space and opportunity to express their views and that organizations make a commit-ment to respond to their concerns.
International
A concept and issues paper entitled “Towards a strategic framework on climate change and development for the World Bank Group” was discussed at a youth consultation event to give young people an opportunity to share their in-put (World Bank, 2008b).
AFRICA AND EuRoPE
In the months leading up to the 2007 Af-rica-Europe Youth Summit, consultations were held with young people from Africa and Europe to obtain their input on global issues, including climate change. (Eu-ropAfrica.net, n.d.).
uNITED KINgDoM
The Department for International Devel-opment held a Youth Consultation event on 20 March 2009, soliciting the views of youth on climate change and the eco-nomic crisis to inform policy-making by the Department. Fifty young people between the ages of 16 and 24 were in-volved (United Kingdom, Department for International Development, 2009).
YoUtH tAkIng tHe InItIAtIVe
Young individuals and youth organizations around the world are actively initiating respons-es to climate change. Young people are taking personal and social responsibility for protecting the world they live in, engaging in stewardship and advocacy aimed at improving the resil-ience of their local environment and strength-ening the relationship between people and their natural surroundings.
gHANA
The Young Men’s Christian Association (YMCA-Ghana) is engaged in a project to curb deforestation and environmental degradation, which is adversely affecting livelihoods. The project includes a tree-planting programme focusing on women farmers, who traditionally cannot own land, and a youth-run seedling nursery. (World Alliance of YMCAs, n.d.).
INDIA
The Children International Youth Council in India secured a grant to address cli-mate change in a rural area near Kolkota. The initiative included reforestation activi-ties, efforts to discourage fossil fuel use, and a community awareness programme. Some 1,500 trees were planted by more than 1,000 teenagers and their families. (Children International, n.d.).
REPubLIC oF KoREA
Korean students from all over the country participated in the CO2 Zero Eco Campus Competitions, submitting climate-friendly initiatives they had designed. The winners were provided with funding for their proj-ects. (HyunJin, n.d.).

62

63
MADAgASCAR
Girl Guides attend camps where they are trained as community educators to help rural women respond to the challenges of climate change through improved ag-ricultural practices (World Association Girl Guides and Girl Scouts, n.d.).
MEXICo
Manos a la Tierra is a youth-led alliance that has been involved in reforestation ac-tivities since 2007. With over 6,000 volun-teers, the alliance has planted more than 70,000 trees and has raised awareness about climate change and the importance of water and biodiversity in the Mexico City metropolitan area. (Manos a la Tierra, n.d.).
SAMoA
Youth affiliated with the Samoa Red Cross Society produced a community-based drama with a climate change theme. Working together with the Ministry of Natural Resources and Environment, they were also involved in community-based vulnerability and capacity assessments and in the implementation of action plans they had designed. (International Federa-tion of Red Cross and Red Crescent So-cieties, 2009a).
uNITED KINgDoM
Student Switch Off is an energy-saving initiative in which university residence halls compete to reduce their energy us-age. Eleven universities are currently in-volved. (Student Switch Off, n.d.).
uNITED STATES
The Climate Change Action Club was ini-tiated by two students at Brookline High School in Massachusetts. They set up a “carbon café” where town residents could obtain information on climate change and pledge to take action to reduce their car-bon footprint. (Ullman, 2009).
uNITED STATES
The Clinton Global Initiative University, established in 2007, brings young people together to discuss urgent social and en-vironmental problems and to undertake Commitments to Action. Since 2008, more than 3,000 commitments have been made by students, universities, and youth organizations. For example, students from
Columbia University’s Engineers with-out Borders Uganda Programme have pledged to install a multifunctional energy platform in one farm cooperative in Ugan-da using jatropha oil as a sustainable fuel source. Several other campuses in the United States have made commitments to infuse climate change awareness and sustainability into campus culture. (Clin-ton Global Initiative, Commitments De-partment, 2009).
YoUtH PARtIcIPAtIng In PolIcY deVeloPment
Policy development constitutes an institu-tionalized form of influence that typically has a broader reach than one-time initiatives. Be-cause policies shape budgets, decisions, and actions at the local, national, and international levels, they often have a significant public im-pact. Over the past few decades young people have issued repeated demands for a greater say in climate change policy development and decision-making but have largely been ignored. There are some notable exceptions, however, where young people have been empowered to help develop climate change policies at dif-ferent levels. In some instances, young people have initiated these efforts, while in others, governing organizations have facilitated youth involvement. Both avenues have led to the same outcome: youth are finally beginning to break through the power barrier and collabo-rate in shaping the policies that will affect them in the years to come.
EuRoPE
On 15 November 2008, 470 young people participated—both virtually and in-per-son—in the first IDEAL-EU pan-European town meeting on climate change. The event, held simultaneously at three ven-ues in France, Italy, and Spain, included a full day of discussion and debate focusing on the United Nations policy agenda on climate change. Key questions posed and addressed by youth at the meeting includ-ed the following: How can Europe reduce its use of fossil fuels? Why are renewable energies currently not widespread? What measures would be effective in reducing CO2 emissions? How can we reduce the consumption of energy? What could we change in our daily habits? What’s wrong

64
with the current model of socio-economic development? The participants were able to vote electronically on innovative pro-posals emanating from this brainstorming phase. (IDEAL-EU, n.d.).
LATIN AMERICA
The International Student Initiative for Ac-tion on Climate Change provides young academics and professionals with the opportunity to contribute to the develop-ment of climate change mitigation policies aimed at protecting their region’s tropi-cal forests. The Initiative is built around a network of graduate students and young professionals in Latin America—with re-gional teams in Brazil, Colombia, and Mexico—who focus on guiding and sup-porting the development of public policy that addresses the role of tropical for-ests as carbon sources and sinks. Young people are involved in multiple aspects of policy development, including conducting background research, engaging in policy dialogue, participating in seminars, and consulting with policy-makers, forest spe-cialists, members of academia, and other students. The Initiative has had a genuine impact on policy in Brazil, Colombia, and Mexico. In Brazil, for example, the efforts of the regional team led to the develop-ment of new legislation making it more difficult for banks to finance illegal logging projects. (International Student Initiative for Action on Climate Change, n.d.).
NEPAL
The Nepalese Youth for Climate Action co-alition has opened discussions on climate change policy and has developed a draft policy document for stakeholder comment (Nepalese Youth for Climate Action, n.d.).
uNITED STATES
SustainUS is a United States-based youth-led organization engaged in grass-roots advocacy and education as well as policy advocacy and development relat-ing to sustainability. In an effort to influ-ence policy, SustainUS delegations work with Government entities, civil society groups, and other youth organizations. Since 2003, through its agents-of-change programme, SustainUS has sent youth delegations to several conferences and summits, including the COP sessions.
The organization’s website includes a wiki for the development of policy positions. (SustainUS, n.d.).
YoUtH As PARtneRs In decIsIon-mAkIng
Young people can make important contribu-tions and have a significant impact on deci-sion-making outcomes when they are given the opportunity to help frame the issues, develop alternatives, and identify solutions. Youth in-volvement at this level appears to be increasing but is still relatively rare. Even less frequently, final decisions are placed in the hands of young people and commitments are made to imple-ment these decisions. In both instances, youth engage in collaborative and empowered deci-sion-making.
EL SALVADoR
In El Salvador, Plan International is ac-tively involving children and young people in environmental resource management and disaster risk reduction. The country is highly vulnerable to disasters, and the risk is increasing with climate change. Disas-ters take a high toll on the population, and children and youth have traditionally been among those least able to defend them-selves against the attendant threats. Plan International’s work in this area has had a dual focus: raising awareness among chil-dren and youth and engaging them in the implementation of disaster risk manage-ment activities. The organization’s efforts began with the establishment of school-based children’s clubs in which students mapped disaster risks in their area and discussed what they could do in the event of a disaster. As the club participants have grown older, they have begun to take an active role in managing disaster risk in their areas and in lobbying the Government for change. In one project initiated by a youth club, for example, young people success-fully lobbied to stop the quarrying of stone from a riverbed because it was increasing the flood risk. In this instance, youth took control of climate change adaptation in their community. (Plan International, n.d.).
uNITED STATES
The New York University (NYU) Sustain-ability Initiative, launched in 2006, is a col-
65
laborative endeavour that brings together students, faculty, staff, alumni, parents, and neighbours of NYU to promote bet-ter environmental performance and a green culture on campus. The Initiative’s advisory body is the Sustainability Task Force, whose 60 members represent key university constituencies and are involved in various working groups, outreach ac-tivities, and the administration of a “green grants” fund used to support projects led by NYU students, faculty, and staff. The various stakeholders have worked togeth-er to assess current practices and have created a prioritized green action plan for NYU. Overall, there is a balanced mixture of student-led and staff-led initiatives. Young people are running and participat-ing in programmes and activities in areas as diverse as bicycle recycling, garden-ing, cooking, project management, and research. (New York University, n.d.).
YoUtH moBIlIzIng tHemselVes: YoUtH-led oRgAnIzAtIons Although there is some general concern about youth disengagement, the commitment of young people to civic engagement remains strong. Young activists are effectively combin-ing new advocacy approaches with the more traditional participatory structures of previous generations. They are increasingly developing informal, non-hierarchical ways to communi-cate and organize, using the Internet, mobile telephones, and other high-technology com-munication tools; however, membership in for-mal organizations remains critically important.
Young people are more likely to participate if their peers are involved as well. Youth-led or-ganizations can provide a framework for young people to take action. Youth-led organizations around the world are having an impact on the climate change agenda and will continue to do so. Young people are proving that they con-stitute a formidable force when they come to-gether under one banner for a specific cause—in this case, climate change.
Youth-led organizations may start out as iso-lated entities with a limited focus. Eventually they may form coalitions with similar groups,
broadening their reach. In recent years a num-ber of youth coalitions have banded together under the umbrella of regional and global youth movements. The International Youth Climate Movement, for example, is a worldwide coali-tion of youth organizations working to inspire, empower, and mobilize members of the young-er generation to take action on climate change. Regional networks that have joined the Move-ment include the Australian Youth Climate Coali-tion (see box IV.5), itself a coalition of more than two dozen youth organizations from across the country; the Canadian Youth Climate Coalition, made up of 48 youth organizations; the China Youth Climate Action Network, which includes seven youth environmental organizations; the French Youth Coalition for Climate and Social Justice, a collective of 13 youth movements; the Indian Youth Climate Network; the Japan Youth Ecology League; the Malaysian Youth Climate Justice Network; South Asia Youth for Environment Education; and the UK Youth Cli-mate Coalition. Other national, regional, and global coalitions and movements have been established that have the same goal as the In-ternational Youth Climate Movement. (Interna-tional Youth Climate Movement, n.d.).
box IV.5
Youth climate campaigning “down under”
The 50,000-member Australian Youth Climate Coalition develops, supports, and oversees a number of initiatives. Recent activities in which the Coalition has been involved include Power Shift, an Australian youth climate conference held in July 2009; an ongoing Youth Climate Leadership Skills programme; a petition for the establishment of strong emissions targets; a green jobs programme; and a school-based pro-gramme to support advocacy. The Co-alition has also sent youth delegations to the most recent sessions of the Conference of the Parties to the Unit-ed Nations Framework Convention on Climate Change. (Australian Youth Cli-mate Coalition, n.d.).
Between 14 and 21 September 2009 more than 37,000 young people

66
participated in Youth Decide, Austra-lia’s first national youth climate vote and one of the world’s largest-ever per capita mobilizations of young peo-ple on climate change. Youth Decide was organized by the Australian Youth Climate Coalition in partnership with World Vision Australia, bringing young people together to speak with a united voice to compel the Government of Australia to demonstrate the leader-ship required to secure an ambitious, fair, and binding global climate agree-ment at COP 15. A total of 330 youth-led voting events were set up to mobi-lize youth support. The overall results indicated that more than 90 per cent of voters wanted to see a commitment in Copenhagen to reduce emissions by at least 40 per cent, and an over-whelming 97.5 per cent of young peo-ple voted for emissions targets stron-ger than those currently proposed by the Government. (Youth Decide, n.d.).
International youth NGOs and regional youth platforms participating in the International Co-ordination Meeting of Youth Organisations (IC-MYO) have also been active in climate change initiatives around the globe. ICMYO is held at least once a year to strengthen regional and international cooperation among youth orga-nizations and to coordinate political inputs to global youth policy processes. Between the meetings, the participating organizations main-tain contact with one another and operate as an informal network. In order to ensure that the coalition is as representative and inclusive as possible, a special effort is made to solicit the participation of youth organizations in countries and regions that typically receive less attention. The goal is to ensure that the perspectives of all young people are integrated into global pro-cesses. (International Coordination Meeting of Youth Organisations, n.d.).
The European Youth Forum, or Youth Forum Jeunesse (YFJ), is one of the organizations participating in ICMYO. It is made up of about a hundred national youth councils and inter-national youth NGOs that are federations of youth organizations in themselves. YFJ brings together tens of millions of young people from
all over Europe and is set up to represent their common interests and concerns. The Forum recently adopted a comprehensive position paper on climate change that calls for decisive action, focusing on adaptation, mitigation, fi-nancing, and governance. The paper also em-phasizes the importance of supporting youth advocacy and of involving young people in decision-making and policy development pro-cesses. (European Youth Forum, 2008; Youth Forum Jeunesse, 2009).
The World Association of Girl Guides and Girl Scouts, another ICMYO participant, has worked with the Food and Agriculture Orga-nization of the United Nations and UNICEF in developing tools and resources for climate change education. Available materials include a guide for teachers and youth leaders on how to undertake climate change activities and ini-tiatives, an educational booklet, a challenge badge, resource packs, and information on organizing drawing competitions. In addition, the Association is a partner organization in the Unite for Climate Web portal, an entry point for global youth action on climate change (see above). (World Association of Girl Guides and Girl Scouts, n.d.).
As shown throughout this chapter, small NGOs around the world are playing a crucial role in climate change mitigation and adaptation. Unfortunately, their work is often not as well documented as that of the larger, better-fund-ed NGOs. Greater attention must be focused on the successful initiatives undertaken by all types of organizations, regardless of their size or complexity, so that good practices can be identified and replicated.
tHe Role oF YoUng PeoPle In PRomotIng And eFFectIng cHAngeYoung people can combat climate change not only as members of youth organizations, but also as individuals. Each of the world’s 1.2 billion young women and men has an impact on the environment. Through the choices they make in their everyday lives, they contribute to the preservation or degradation of their natural surroundings.
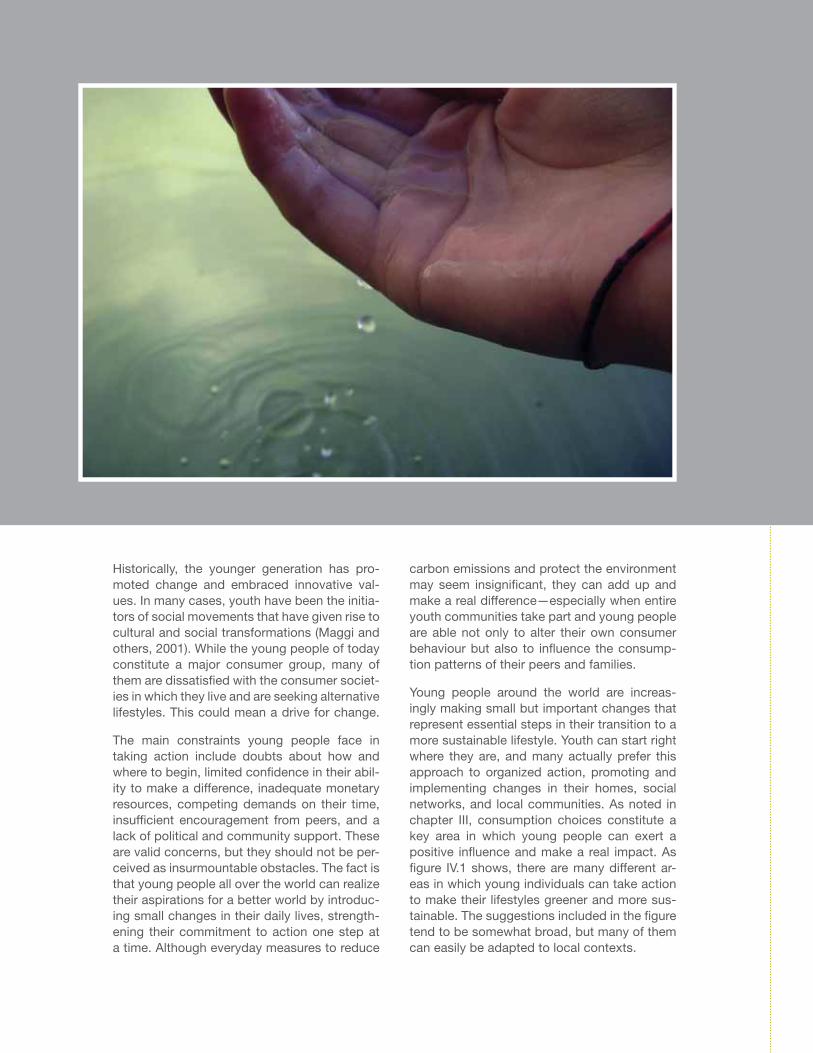
67
Historically, the younger generation has pro-moted change and embraced innovative val-ues. In many cases, youth have been the initia-tors of social movements that have given rise to cultural and social transformations (Maggi and others, 2001). While the young people of today constitute a major consumer group, many of them are dissatisfied with the consumer societ-ies in which they live and are seeking alternative lifestyles. This could mean a drive for change.
The main constraints young people face in taking action include doubts about how and where to begin, limited confidence in their abil-ity to make a difference, inadequate monetary resources, competing demands on their time, insufficient encouragement from peers, and a lack of political and community support. These are valid concerns, but they should not be per-ceived as insurmountable obstacles. The fact is that young people all over the world can realize their aspirations for a better world by introduc-ing small changes in their daily lives, strength-ening their commitment to action one step at a time. Although everyday measures to reduce
carbon emissions and protect the environment may seem insignificant, they can add up and make a real difference—especially when entire youth communities take part and young people are able not only to alter their own consumer behaviour but also to influence the consump-tion patterns of their peers and families.
Young people around the world are increas-ingly making small but important changes that represent essential steps in their transition to a more sustainable lifestyle. Youth can start right where they are, and many actually prefer this approach to organized action, promoting and implementing changes in their homes, social networks, and local communities. As noted in chapter III, consumption choices constitute a key area in which young people can exert a positive influence and make a real impact. As figure IV.1 shows, there are many different ar-eas in which young individuals can take action to make their lifestyles greener and more sus-tainable. The suggestions included in the figure tend to be somewhat broad, but many of them can easily be adapted to local contexts.
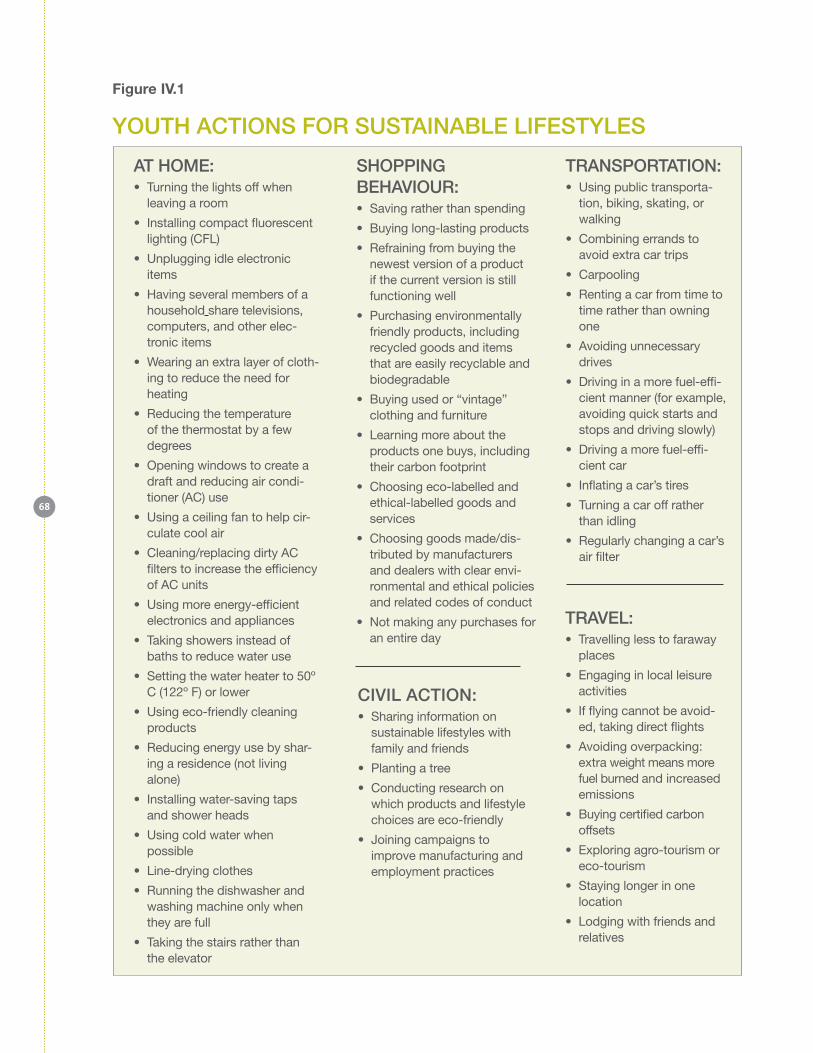
68
Figure IV.1
YoUtH ActIons FoR sUstAInABle lIFestYles
At Home: • Turning the lights off when
leaving a room
• Installing compact fluorescent lighting (CFL)
• Unplugging idle electronic items
• Having several members of a household share televisions, computers, and other elec-tronic items
• Wearing an extra layer of cloth-ing to reduce the need for heating
• Reducing the temperature of the thermostat by a few degrees
• Opening windows to create a draft and reducing air condi-tioner (AC) use
• Using a ceiling fan to help cir-culate cool air
• Cleaning/replacing dirty AC filters to increase the efficiency of AC units
• Using more energy-efficient electronics and appliances
• Taking showers instead of baths to reduce water use
• Setting the water heater to 50º C (122º F) or lower
• Using eco-friendly cleaning products
• Reducing energy use by shar-ing a residence (not living alone)
• Installing water-saving taps and shower heads
• Using cold water when possible
• Line-drying clothes
• Running the dishwasher and washing machine only when they are full
• Taking the stairs rather than the elevator
sHoPPIng BeHAVIoUR: • Saving rather than spending
• Buying long-lasting products
• Refraining from buying the newest version of a product if the current version is still functioning well
• Purchasing environmentally friendly products, including recycled goods and items that are easily recyclable and biodegradable
• Buying used or “vintage” clothing and furniture
• Learning more about the products one buys, including their carbon footprint
• Choosing eco-labelled and ethical-labelled goods and services
• Choosing goods made/dis-tributed by manufacturers and dealers with clear envi-ronmental and ethical policies and related codes of conduct
• Not making any purchases for an entire day
tRAnsPoRtAtIon: • Using public transporta-
tion, biking, skating, or walking
• Combining errands to avoid extra car trips
• Carpooling
• Renting a car from time to time rather than owning one
• Avoiding unnecessary drives
• Driving in a more fuel-effi-cient manner (for example, avoiding quick starts and stops and driving slowly)
• Driving a more fuel-effi-cient car
• Inflating a car’s tires
• Turning a car off rather than idling
• Regularly changing a car’s air filter
cIVIl ActIon: • Sharing information on
sustainable lifestyles with family and friends
• Planting a tree
• Conducting research on which products and lifestyle choices are eco-friendly
• Joining campaigns to improve manufacturing and employment practices
tRAVel: • Travelling less to faraway
places
• Engaging in local leisure activities
• If flying cannot be avoid-ed, taking direct flights
• Avoiding overpacking: extra weight means more fuel burned and increased emissions
• Buying certified carbon offsets
• Exploring agro-tourism or eco-tourism
• Staying longer in one location
• Lodging with friends and relatives
69
BARRIeRs to YoUtH engAgement And tHe wAY FoRwARdFor young people to be successful in driving change they require a strong support system that includes parents, teachers, community and religious leaders, the Government, the pri-vate sector, the media, and civil society. Vari-ous studies have also found that for behaviour change to occur, the willingness or need to ad-dress environmental problems must be com-plemented by both opportunity (the availability of means) and ability (access to means) (Tukker and others, 2008).
Existing infrastructure and social systems are not always supportive of positive change. Many countries have still not introduced poli-cies that are specifically designed to promote environmentally friendly lifestyles. Such sup-portive policies, together with forward-looking urban policies and development planning, can be effective in helping youth to take action. For example, improving access to communal ser-vices used by young people—including public transport, libraries, swimming pools, and com-munity gardens or parks—is one important means of reducing the multiplication of goods and services associated with highly individual-ized consumption patterns.
Political and other systemic barriers may also exist that effectively preclude meaningful civic engagement among youth. Although youth in-volvement is widespread and the value of youth participation is internationally acknowledged, the idea that giving young people a role in so-ciety can lead to better policy outcomes is far from being universally accepted. The rights and decision-making capacities of young people often remain unrecognized, and their poten-tial as a valuable resource is seldom realized. Even in countries that acknowledge the need to provide young people with opportunities to participate in the policy-making process, youth involvement tends to be highly circumscribed; the views of young people are sought, but they are not allowed to influence decision-making and therefore remain on the fringes of demo-cratic processes. Such restrictions can under-mine the potential of young people as agents of social change.
The gap between intent and reality in youth em-powerment is not surprising because decision-making mechanisms are rarely set up to allow ordinary adult citizens, let alone young people, to participate in decision-making processes. Institutionalized collaborative decision-making is difficult to find at any level of governance. Consequently, young people—who are typical-ly at a relative disadvantage in terms of power and influence—may find it impossible to secure a formal place at the decision-making table. In-stitutionalizing collaboration would require the establishment of a formal relationship in which mutual rights and responsibilities are legally defined and societal sanctions are imposed if such engagement fails to occur. Official rec-ognition is essential, but true institutionaliza-tion will occur only when youth participation in decision-making becomes embedded within the system and is viewed as the norm. Unfortu-nately, young people are nowhere near achiev-ing this level of empowerment.
conclUsIon The world’s 1.2 billion young people have made it abundantly clear that they want to be involved in the decisions impacting society and addressing climate change is no exception. Throughout the world, youth have developed creative ways to raise awareness, share infor-mation, build capacities, and work together on climate change mitigation and adaptation practices – often achieving impressive results through their own initiatives.
In recent years, young people are increasingly attending global gatherings on climate change to express their concerns and press Govern-ments for action. However, they are often denied participation in decision-making pro-cesses where their unique perspectives and innovative ideas could be integrated toward more effective policies.
Overall, political progress on the climate change agenda has been stagnant as signifi-cant policy adjustments towards more sustain-able patterns of production and consumption have not been agreed upon. Delaying action imposes greater sacrificing on the part of youth populations and further strains socio-economic development. Circumstances such as these reverse progress and threaten the very base from which all societies prosper.
70
By and large, traditional economic growth pat-terns are environmentally unsustainable due, in part, to their heavy reliance upon the use of natural resources. Within the international community, consensus is emerging for a de-parture from current models. Enhancing de-velopment frameworks by integrating a Green Growth focus offers a pathway toward the transition to green economies including by ad-dressing policy barriers.
In the residuum of the global financial and eco-nomic crisis arises an opportunity to bridge the gap from rhetoric to action. As policy-makers and economic managers, Governments are called upon to develop a global vision for a more equitable and greener future. Climate change poses a global threat and requires an inter-governmental response as a matter of urgency. However, commitments made at the international level should bear in mind varying national contexts. In order to provide the wid-est possible opportunity for universal imple-mentation, national leadership must be able to translate global models into national strategies.
Broad-based partnerships – including Govern-ments, the United Nations, the private sector, civil society and the scientific community – provide stakeholders with a platform to share knowledge and good practices. Partnerships can also diminish the marginalization of rel-evant points of view, including those of youth. Collective action of this nature is key to devel-oping sound policies for thriving green econo-mies.
While halting climate change and reversing its negative effects require steady political will and the implementation of a robust plan of action over the course of many decades, much can be done in the meantime to lay the groundwork for significant progress. With this knowledge and in the spirit of recognizing their positive contributions to society, young people should be encouraged and supported to take part in the universal endeavour to address climate change, including through meaningful partici-pation in decision-making processes.

71
cAllIng All YoUtHnow that you have read the World Youth Report: Youth and Climate Change, it is the hope that with this newly gained knowledge you are inspired to take on the challenges presented by climate change and do your part in achieving sustainable de-velopment goals. Here are some sug-gested steps youth can take toward mobilizing collective action for posi-tive change:
cA
llIn
g A
ll Y
oU
tH
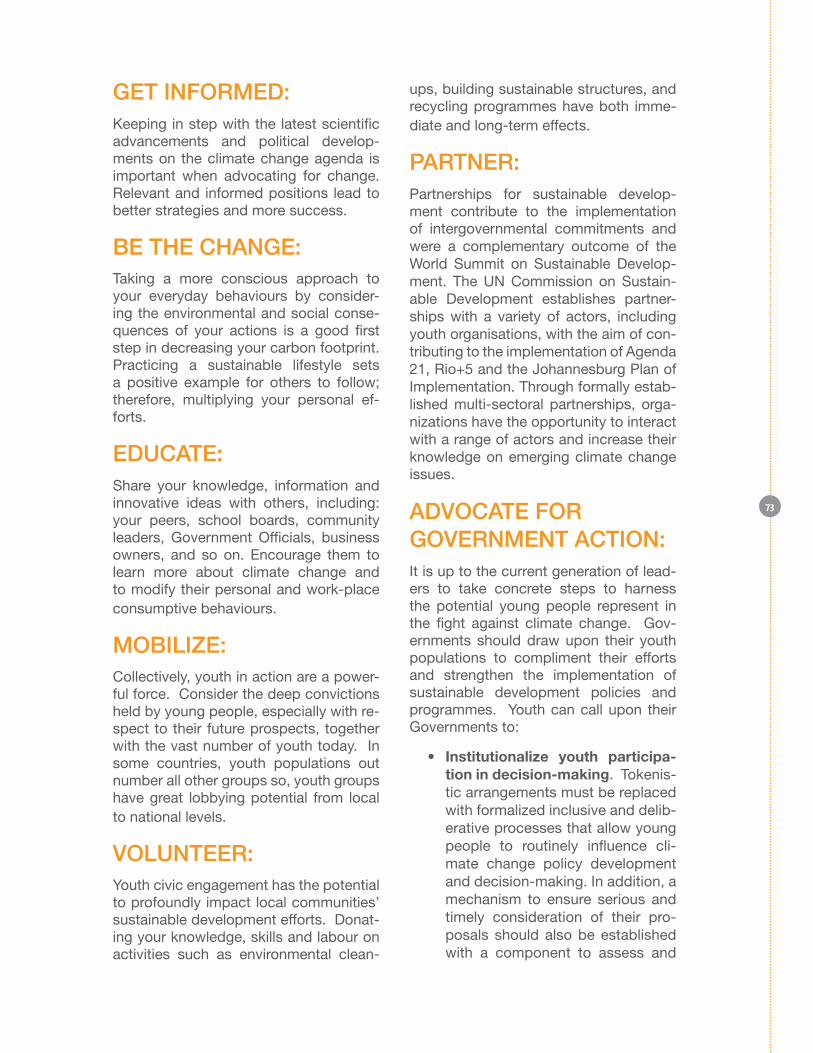
73
get InFoRmed: Keeping in step with the latest scientific advancements and political develop-ments on the climate change agenda is important when advocating for change. Relevant and informed positions lead to better strategies and more success.
Be tHe cHAnge: Taking a more conscious approach to your everyday behaviours by consider-ing the environmental and social conse-quences of your actions is a good first step in decreasing your carbon footprint. Practicing a sustainable lifestyle sets a positive example for others to follow; therefore, multiplying your personal ef-forts.
edUcAte: Share your knowledge, information and innovative ideas with others, including: your peers, school boards, community leaders, Government Officials, business owners, and so on. Encourage them to learn more about climate change and to modify their personal and work-place consumptive behaviours.
moBIlIze: Collectively, youth in action are a power-ful force. Consider the deep convictions held by young people, especially with re-spect to their future prospects, together with the vast number of youth today. In some countries, youth populations out number all other groups so, youth groups have great lobbying potential from local to national levels.
VolUnteeR: Youth civic engagement has the potential to profoundly impact local communities’ sustainable development efforts. Donat-ing your knowledge, skills and labour on activities such as environmental clean-
ups, building sustainable structures, and recycling programmes have both imme-diate and long-term effects.
PARtneR: Partnerships for sustainable develop-ment contribute to the implementation of intergovernmental commitments and were a complementary outcome of the World Summit on Sustainable Develop-ment. The UN Commission on Sustain-able Development establishes partner-ships with a variety of actors, including youth organisations, with the aim of con-tributing to the implementation of Agenda 21, Rio+5 and the Johannesburg Plan of Implementation. Through formally estab-lished multi-sectoral partnerships, orga-nizations have the opportunity to interact with a range of actors and increase their knowledge on emerging climate change issues.
AdVocAte FoR goVeRnment ActIon: It is up to the current generation of lead-ers to take concrete steps to harness the potential young people represent in the fight against climate change. Gov-ernments should draw upon their youth populations to compliment their efforts and strengthen the implementation of sustainable development policies and programmes. Youth can call upon their Governments to:
• Institutionalize youth participa-tion in decision-making. Tokenis-tic arrangements must be replaced with formalized inclusive and delib-erative processes that allow young people to routinely influence cli-mate change policy development and decision-making. In addition, a mechanism to ensure serious and timely consideration of their pro-posals should also be established with a component to assess and

74
explain the adaptation or rejec-tion of their inputs. Just as in other democratic processes, institution-alized youth participation must be characterized by consistency, transparency, and accountability at all levels of decision-making.
• Invest in youth initiatives. Strate-gies to secure funding for youth or-ganizations involved in addressing climate change are required at lo-cal, national, regional and interna-tional levels. A climate change fund could be administered by and for young people to support initiatives that promote youth engagement in climate change adaptation and mitigation activities.
• Establish a participatory role in international forums. Young people are now involved on a reg-ular basis in the activities of vari-ous international advisory bodies, including within the United Na-tions system. The effectiveness of these bodies in integrating youth perspectives and facilitating youth empowerment should be evaluated with the aim of supporting the “lad-der of participation” model outlined in chapter IV of this report. Actions such as granting permanent status to the youth constituency (YOUN-GO) at COP 17 are a step in the right direction.
75

BIBlIogRAPHY
BIB
lIo
gR
AP
HY
77
Abatzoglou, John, and others (2007). Climate-change effects: global and local views. In Climate Change: What It Means for Us, Our Children, and Our Grandchildren, Joseph F. C. DiMento and Pamela Doughman, eds. Cambridge, Massachussetts: The MIT Press.
Academy of Natural Sciences (n.d.). Asia Cent-er: Hovsgol GEF/World Bank Project ar-chive. Available from http://asia.ansp.org/hovsgol/gEF-Wb/index.php.
African Radio Drama Association (n.d.). Climate change adaptation in northern Nigeria. Avail-able from http://ardaradio.org/climate_change_project (accessed 9 May 2010).
Agenda 21 (1993). United Nations publication, Sales No. E.93.I.11. Available from http://www.un.org/esa/dsd/agenda21/res_agenda21_00.shtml.
Anchorage Declaration (2009). Adopted at the conclusion of the Indigenous Peoples’ Glo-bal Summit on Climate Change, held in An-chorage, Alaska, from 20 to 24 April 2009. Available from http://www.indigenous-summit.com/servlet/content/declaration.html.
Asian Development Bank (2008). Asian Develop-ment Outlook 2008: Workers in Asia. Manila. Available from http://www.adb.org/Docu-ments/books/ADo/2008/default.asp.
Australian Youth Climate Coalition (n.d.). Avail-able from http://www.aycc.org.au/.
Autio, Minna, and Visa Heinonen (2004). To con-sume or not to consume? Young people’s environmentalism in the affluent Finnish so-ciety. Young, vol. 12, No. 2, pp. 137-153.
Barbier, Edward B. (2009). A Global Green New Deal: final report, February 2009. Prepared for the United Nations Environ-ment Programme, Division of Technol-ogy, Industry and Economics, Economics and Trade Branch. Available from http://www.greens-efa.org/cms/default/dokbin/290/[email protected] (accessed 13 May 2010).
Bates, Bryson, and others, eds. (2008). Climate Change and Water: IPCC Technical Paper VI. Technical Paper of the Intergovernmen-
tal Panel on Climate Change. Geneva: IPCC secretariat.
Bentley, Matthew, John Fien and Cameron Neil (2004). Sustainable Consumption: Young Australians as Agents of Change. Canberra: National Youth Affairs Research Scheme.
Biffi, Selene (2008). Young people: an untapped global resource. Submission to the six-teenth session of the Commission on Sus-tainable Development (CSD-16). 2 May.
Boano, Camillo, Roger Zetter and Tim Morris (2008). Environmentally Displaced People: Understanding the Linkages between Envi-ronmental Change, Livelihoods and Forced Migration. Forced Migration Policy Briefing 1. Oxford: Refugee Studies Centre, Oxford Department of International Development, University of Oxford.
Borrows, John (2006). Indigenous Legal Tradi-tions in Canada. Ottawa: Law Commission of Canada.
Brown, Oli (2008). Migration and Climate Change. IOM Migration Research Series, No. 31. Geneva: International Organization for Migration.
Brusdal, Ragnhild, and Astrid Langeby (2001). Raving hedonists or environmentally con-cerned? Youth in Norway. In Youth, Sustain-able Consumption Patterns and Life Styles. United Nations Educational, Scientific and Cultural Organization and United Nations En-vironment Programme. SHS-2001/WS/13. Available from http://unesdoc.unesco.org/images/0012/001242/124238e.pdf.
Campus Climate Challenge (n.d.). ClimateChal-lenge.org, a project of the Energy Action Co-alition. Available from http://climatechal-lenge.org/ (accessed 15 April 2009).
Carmen, Andrea (2008). Climate change, human rights and indigenous peoples. Submission to the United Nations High Commissioner on Human Rights by the International Indian Treaty Council, a non-governmental organi-zation in Special Consultative Status to the United Nations Economic and Social Council.
Center for Hazards and Risk Research at Co-lumbia University (2005). Natural Disaster
78
Hotspots—A Global Risk Analysis. Available from http://www.ldeo.columbia.edu/chrr/research/hotspots/coredata.html. Links: Core Data Sets/Hazard Frequency and/or Distribution/Global Multihazard Frequency and Distribution (accessed 19 June 2007 and 12 December 2009).
Centers for Disease Control and Prevention, Division of Vector-Borne and Infectious Dis-eases (2008). Dengue fever (bulletin). Avail-able from http://www.cdc.gov/ncidod/dv-bid/dengue/index.htm (accessed 8 March 2009).
Children International (n.d.). Submission to the World Youth Report: Youth and Climate Change.
China Youth Climate Action Network (2008). Green Campus Program: first phase report. Submission to the World Youth Report: Youth and Climate Change.
City Garbage Recyclers, Kenya (2008). Un-clogging sewers and drainage systems in Nairobi’s low-income estates. Ashoka Changemakers. Available from http://www.changemakers.com/en-us/node/6980 (accessed 9 July 2009).
Cline, William R. (2007). Global Warming and Agriculture: Impact Estimates by Country. Washington, D.C.: Center for Global Devel-opment and Peterson Institute for Interna-tional Economics.
Clinton Global Initiative, Commitments Depart-ment (2009). Clinton Global Initiative Univer-sity—Commitments to Action: energy and climate change track, 2008 and 2009. Sub-mission to the World Youth Report: Youth and Climate Change.
Clover, Darlene E. (2001). Youth action and learning for sustainable consumption in Canada. In Youth, Sustainable Consump-tion Patterns and Life Styles. United Na-tions Educational, Scientific and Cultural Organization and United Nations Environ-ment Programme. SHS-2001/WS/13. Avail-able from http://unesdoc.unesco.org/images/0012/001242/124238e.pdf.
Cordero, Eugene C., Anne Marie Todd and Diana Abellera (2008). Climate change
education and the ecological footprint. Bulletin of the American Meteorological Society, vol. 89 (June), pp. 865-872. Avail-able from http://journals.ametsoc.org/doi/abs/10.1175/2007bAMS2432.1.
Directorate-General for Communication of the European Commission (2008). Europeans’ attitudes towards climate change: report. Special Eurobarometer 300. European Par-liament and European Commission, Sep-tember. Available from http://ec.europa.eu/public_opinion/archives/ebs/ebs_300_full_en.pdf.
Dusseldorp Skills Forum (2008). Gen Green: what young Australian tradespeople think of green skills. Sydney. Available from http://www.dev.dsf.org.au/media/fi les/re-source/181.pdf (accessed 2 July 2009).
Environment and Security Initiative (2005). En-vironment and Security: Transforming Risks into Cooperation—Central Asia: Ferghana/Osh/Khujand Area. Geneva: United Nations Environment Programme and others. Availa-ble from http://www.envsec.org/centasia/pub/ferghana-report-engb.pdf.
Enviroschools Foundation (n.d.). Enviroschools. Available from http://www.enviroschools.org.nz/ (accessed 3 April 2009).
EuropAfrica.net (n.d.). News and resources on the Joint Africa-EU Strategy: Africa-Europe Youth Summit. Available from http://eu-ropafrica.net/2007/05/23/africa-europe-youth-summit/ (accessed 15 April 2009).
European Environment Agency (2005). House-hold Consumption and the Environment. Luxembourg: Office for Official Publica-tions of the European Communities. EEA Report No. 11/2005. Available from http://www.eea.europa.eu/publications/eea_re-port_2005_11.
European Youth Forum (2008). Resolution on European youth fighting against climate change; adopted at the Council of Mem-bers/Extraordinary General Assembly, 2-3 May 2008 (Castelldefels, Catalonia–Spain). COMEM 0438-08-FINAL. Submission to the World Youth Report: Youth and Climate Change.
79
Fired Up Media (n.d.). Available from http://fire-dupmedia.com/ (accessed 15 April 2009).
Food and Agriculture Organization of the United Nations (2009a). AQUASTAT. Available from http://www.fao.org/nr/water/aquastat/main/index.stm (accessed 19 November 2009).
(2009b). Climate change and bioenergy challenges for food and agriculture. Is-sue paper prepared for the High-Level Expert Forum—How to Feed the World in 2050, Rome, 12-13 October 2009. Avail-able from http://www.fao.org/fileadmin/templates/wfs/docs/Issues_papers/HLEF2050_Climate.pdf.
(2009c). New challenges: climate change and bioenergy. Issue paper prepared for the World Summit on Food Security, Rome, 16-18 November 2009. Available from ftp://ftp.fao.org/docrep/fao/meet-ing/018/k5987e.pdf.
Ganeshan, Shamanthy, and Wayne Diamond (2009). Forecasting the numbers of people affected by natural disasters up to 2015. Oxfam papers and reports on climate change, 2009. Available from http://www.oxfam.org.uk/resources/policy/climate_change/downloads/forecasting_disas-ters_2015.pdf (accessed 10 May 2010).
Gardner, Gary, Erik Assadourian and Radhika Sarin (2004). The state of consumption to-day. In State of the World 2004—Special Focus: The Consumer Society. Washington, D.C.: Worldwatch Institute. Available from http://www.worldwatch.org/node/3816.
Gracey, Kyle (2008). Poznań: the maturing of the youth contingent. Washington, D.C.: World-watch Institute. Available from http://www.worldwatch.org/node/5961 (accessed 2 April 2009).
Grameen Shakti (2007). Available from http://www.gshakti.org/ (accessed 10 November 2008).
Greenpeace (n.d.). Solar Generation. Available from http://www.greenpeace.org/interna-tional/solar-generation/ (accessed 16 May 2010).
Guatam, Dhruba, and Katy Oswald (2008). Child Voices: Children of Nepal Speak Out on Climate Change Adaptation. Children in a Changing Climate Research Report. Avail-able from http://www.childreninachnag-ingclimate.org/docs/Child%20Voices_np.pdf (accessed 17 April 2009).
Haggblade, Steven, Peter B.R. Hazell and Tho-mas Reardon (2009). Transforming the ru-ral non-farm economy: opportunities and threats in the developing world. IFPRI Issue Brief No. 58. Washington, D.C.: International Food Policy Research Institute, February.
Harbom, Lotta, Erik Melander and Peter Wallen-steen (2008). Dyadic dimensions of armed conflict, 1946-2007. Journal of Peace Re-search, vol. 45, No. 5, pp. 697-710.
Hart, Roger A. (1992). Children’s Participation: From Tokenism to Citizenship. UNICEF Inno-centi Essays, No. 4. Florence: UNICEF Inter-national Child Development Centre.
Health Canada (2006). First Nations, Inuit and Aboriginal health: suicide prevention. Avail-able from http://www.hc-sc.gc.ca/fniah-spnia/promotion/suicide/index-eng.php (accessed 5 May 2009).
Herro, Alana (2007). Youth bring low-cost so-lar panels to Kenyan slum. Available from http://www.worldwatch.org/node/5172 (accessed 7 July 2009).
Hicks, Celeste (2004). Kenya slum turns sun into energy. BBC News, 12 November. Avail-able from http://news.bbc.co.uk/2/hi/Af-rica/4001061.stm (accessed 17 May 2010).
Howe, Joan (2009). At a glance: Denmark—Youth Day events energize debate at UN Climate Change Conference. Copenhagen, 10 December. United Nations Children’s Fund. Available from http://www.unicef.org/infobycountry/denmark_52066.html (accessed 15 January 2010).
Human Rights and Equal Opportunity Commis-sion of Australia (2003). Submission to the United Nations Committee on the Rights of the Child for their Day of General Discussion on the Rights of Indigenous Children. Available from http://www.hreoc.gov.au/social_jus-tice/croc/sub1.htm (accessed 22 April 2009).

80
HyunJin, Jeon (n.d.). Action stations. TUNZA (the UNEP magazine for youth): Your planet needs YOU!, vol. 7, No. 1, p. 17. Available from http://www.unep.org/pdf/tunza/Tun-za_7.1_English.pdf. Project overview also provided by e-mail, 1 August 2009.
IDEAL-EU (n.d.). The IDEAL-EU pan-European town meeting. Available from http://www.ideal-eu.net/frontend/index.php (accessed 15 March 2009).
Indian Youth Climate Network (n.d.). Available from http://www.iycn.in/project.htm (ac-cessed 27 March 2009).
Indian Youth Summit on Climate Change (2008). Report of the Indian Youth Summit on Cli-mate Change 2008, 7th to 10th August 2008, Infosys Campus, Gachi Bowli, Hyderabad. Submission to the World Youth Report: Youth and Climate Change.
Intergovernmental Panel on Climate Change (2007a). Climate Change 2007: Impacts, Ad-aptation and Vulnerability—Contribution of Working Group II to the Fourth Assessment Report of the Intergovernmental Panel on Climate Change, M.L. Parry and others, eds. Cambridge: Cambridge University Press.
(2007b). Climate Change 2007: Synthesis Report—Contribution of Working Groups I, II and III to the Fourth Assessment Re-port of the Intergovernmental Panel on Climate Change, R.K. Pachauri and A. Re-isinger, eds. Geneva.
(n.d.). Available from http://www.ipcc/ch (accessed 23 May 2010).
International Assessment of Agricultural Knowl-edge, Science and Technology for Develop-ment (2009). Agriculture at a Crossroads: Synthesis Report, Beverly D. McIntyre and others, eds. Washington, D.C.
International Association for Public Participa-tion (2007). IAP2 Spectrum of Public Partici-pation. Available from http://www.iap2.org/associations/4748/files/IAP2%20Spec-trum_vertical.pdf (accessed 18 April 2009).
International Coordination Meeting of Youth Organisations (n.d.). Available from http://icmyo.wordpress.com/about/.
International Federation of Red Cross and Red Crescent Societies (2009a). Annex 1. Exam-ples of activities involving Red Cross/Red Crescent youth and climate change to date: April 2009. Submission to the World Youth Report: Youth and Climate Change.
(2009b). Case study—Tuvalu: join-ing forces to tackle climate change. Geneva. Available from http://www.i f r c . o r g / D o c s / p u b s / d i s a s t e r s / resources/corner/case-studies/cs-tu-valu-en.pdf (accessed 16 April 2009).
International Labour Office (2008). Global Em-ployment Trends for Youth, October 2008. Geneva.
International Organization for Migration (2009). Migration, climate change and the environ-ment. IOM Policy Brief. Geneva, May.
International Student Initiative for Action on Climate Change (n.d.). About us. Available from http://www.isiacc.org/ (accessed 19 March 2009).
International Telecommunication Union (2009). Measuring the Information Society: The ICT Development Index 2009. Geneva.
International Youth Climate Movement (n.d.). Regional youth networks. Available from http://youthclimate.org/get-involved/regional-youth-networks/ (accessed 15 January 2010).
Internet World Stats (n.d.). World internet us-age and population statistics. Available from http://www.internetworldstats.com/stats.htm (accessed 9 July 2010).
IRIN (2009). South Africa: need to create more jobs for the youth. Johannesburg, 5 Febru-ary. Available from http://www.irinnews.org/Report.aspx?ReportId=82782 (ac-cessed 6 July 2009).
Islam, Nazrul (1996). Sustainability issues in ur-ban housing in a low-income country: Ban-gladesh. Habitat International, vol. 20, No. 3, pp. 377-388.
Jha, Preeti (2009). The first climate change conflicts: drought is testing pastoralists and
81
peace in north Kenya. The Guardian, 23 No-vember. Available from http://www.guard-ian.co.uk/journalismcompetition/profes-sional-climate-change-conflicts.
Jionisi, Mary, and Jennifer Owens (n.d.). Youth Division, Honiara City Council, Solomon Is-lands. Submission to the World Youth Re-port: Youth and Climate Change.
Kibera Community Youth Programme (2005). Available from http://www.kcyp.net/ (ac-cessed 22 May 2010).
Kick the Carbon Habit Youth Network (n.d.). In-formation on the Kick the Carbon Habit Edu-cation Campaign launched by the United Na-tions Environment Programme. Available from http://ktchyouthnetwork.wordpress.com/ about/ (accessed 25 March 2009).
Kjeldgaard, Dannie, and Søren Askegaard (2006). The glocalization of youth culture: the global youth segment as structures of common difference. Journal of Consumer Research, vol. 33 (September), pp. 231-247.
LaDuke, Winona, and Sarah Alexander (2004). Food Is Medicine: Recovering Traditional Foods to Heal the People. Ponsford, Minne-sota: Honour the Earth and White Earth Land Recovery Project.
Lieuw-Kie-Song, Maikel R. (2009). Green Jobs for the Poor: A Public Employment Ap-proach. Poverty Reduction Discussion Pa-per, PG/2009/002. New York: United Na-tions Development Programme, Bureau for Development Policy, Poverty Group, April. Available from http://www.undg-policynet.org/ext/economic_crisis/Pg-2009-002-discussion-paper-green-jobs.pdf.
Maggi, Manlio, and others (2001). Consump-tion patterns of youth: an analysis of the Italian survey. In Youth, Sustainable Con-sumption Patterns and Life Styles. United Nations Educational, Scientific and Cultural Organization and United Nations Environ-ment Programme. SHS-2001/WS/13. Avail-able from http://unesdoc.unesco.org/images/0012/001242/124238e.pdf.
Mahr, Krista (2007). Vagabond virus: dengue fever is spreading, and some think climate change is to blame. Time, 17 December, p. 38.
Manos a la Tierra (n.d.). Available from http://www.manosalatierra.org/cms/news.php.
McMichael, A.J., and others, eds. (2003). Cli-mate Change and Human Health: Risks and Responses. Geneva: World Health Organiza-tion.
Myers, Norman (2005). Environmental refu-gees: an emergent security issue. Paper presented at the 13th OSCE Economic Fo-rum, Prague, 23-27 May 2005. 22 May 2005. EF.NGO/4/05.
Nelleman, Christian, and others, eds. (2009). The Environmental Food Crisis: The Envi-ronment’s Role in Averting Future Food Cri-ses—A UNEP Rapid Response Assessment. Arendal, Norway: United Nations Environ-ment Programme/GRID-Arendal. Available from http://www.grida.no/_res/site/file/publications/FoodCrisis_lores.pdf.
Nepalese Youth for Climate Action (n.d.). Invita-tion for climate talk: discussion on climate policy. Available from http://groups.google.com/group/climateyouth/browse_thread/thread/ae750863a25b7805?pli=1 (accessed 15 April 2009).
New York University (n.d.). Sustainability at NYU. Available from http://www.nyu.edu/sustainability/ (accessed 31 March 2009).
New Zealand Department of Labour (2007). Youth labour market outcomes—July 2007. Available from http://www.dol.govt.nz/PDFs/lmr-youth-2007.pdf (accessed 26 June 2010).
NUFF Global (n.d.). Make a movie that matters. Available from http://www.nuffglobal.net/ (accessed 9 April 2009).
Nyberg, Anders, and Eivind Stø (2001). Is the future yours? In Youth, Sustainable Con-sumption Patterns and Life Styles. United Nations Educational, Scientific and Cultural Organization and United Nations Environ-ment Programme. SHS-2001/WS/13. Avail-able from http://unesdoc.unesco.org/images/0012/001242/124238e.pdf.
Ohlsson, Leif (2000). Livelihood conflicts: link-ing poverty and environment as causes of conflict. Stockholm: Swedish Interna-
82
tional Development Agency, Environmental Policy Unit.
Organization for Economic Cooperation and Development and Food and Agriculture Organization of the United Nations (2008). OECD-FAO Agricultural Outlook 2008-2017. Paris: OECD Publications.
Our Climate, Our Challenge, Our Future—Inter-national Youth Declaration, Montreal, 2005 (2005). Available from http://www.climate-imc.org/en/announcements/2005/12/06/our-climate-our-challenge-our-future-in-ternational-youth-declaration-montr-.
Our Task (2008). The Youth Earth Plan, version 0.5. Submission to the World Youth Report: Youth and Climate Change. Information available from http://www.ourtask.org/pdfs/yepexecsum.pdf.
Pan American Health Organization (2007). Health in the Americas 2007: Volume I—Re-gional. PAHO Scientific and Technical Publi-cation No. 622. Washington, D.C.
Plan International (2009). Submission to the World Youth Report: Youth and Climate Change. Programme information available from http://www.plan-ed.org/inthenews/bethechange.
(n.d.). Children and young people at the centre of disaster risk reduction. Available from http://www.plan-uk.org/pdfs/chil-drenindrr.pdf.
Power Shift (n.d.). Available from http://www/powervote.org/files/Power%20Vote% 20one%20Pager.pdf (accessed 20 May 2010).
Prüss-Üstün, Annette, and others (2008). Safer Water, Better Health: Costs, Benefits and Sustainability of Interventions to Protect and Promote Health. Geneva: World Health Or-ganization.
Raleigh, Clionadh, Lisa Jordan and Idean Sale-hyan (2008). Assessing the Impact of Climate Change on Migration and Conflict. Commis-sioned for the Social Dimensions of Climate Change program and workshop. Washing-ton, D.C.: World Bank, Social Development Department.
Regional Consultative Committee on Disas-ter Management (2007). Integrating disas-ter risk reduction into school curriculum: mainstreaming disaster risk reduction into education. RCC Guideline 6.1; consultation version 3.1. Pathumthani, Thailand: Asian Disaster Preparedness Center (RCC Secre-tariat), April. Available from http://www.pre-ventionweb.net/files/4006_ADPCEducguidelineConsultationVersion3.1.pdf.
Salick, Jan, and Anja Byj (2007). Indigenous Peoples and Climate Change. Oxford: Tyn-dall Centre for Climate Change Research, May.
Schmidt, Charles W. (2006). Unfair trade e-waste in Africa. Environmental Health Per-spectives, vol. 114, No. 4, pp. A232-A235.
Stern, Nicholas H. (2007). Stern Review: The Economics of Climate Change. Cambridge, United Kingdom: Cambridge University Press. Available from http://webarchive.nationalarchives.gov.uk/+/http:/www.hm-treasury.gov.uk/independent_re-views/stern_review_economics_climate_change/stern_review_report.cfm.
Student Switch Off (n.d.). Available from http://www.studentswitchoff.co.uk (accessed 15 April 2009).
SustainUS (n.d.). Available from http://www.sustainus.org/ (accessed 15 April 2009).
TakingITGlobal (n.d.). Available from http://www.tigweb.org/ (accessed 2 April 2009).
Thoresen, Victoria (2008). Here and Now! Edu-cation for Sustainable Consumption: Rec-ommendations and Guidelines. Prepared under the supervision of the United Nations Environment Programme, Division of Tech-nology, Industry and Economics, with the support of the Marrakech Task Force on Education for Sustainable Consumption led by the Italian Ministry for the Environment, Land and Sea.
Tukker, Arnold, and others, eds. (2008). System Innovation for Sustainability 1: Perspectives on Radical Changes to Sustainable Con-sumption and Production. Sheffield, United Kingdom: Greenleaf Publishing, March.
83
Ullman, Katie (2009). The Climate Change Ac-tion Club. Submission to the World Youth Report: Youth and Climate Change.
UNFCCC YOUNGO Wiki Portal (n.d.). YOUN-GO constituency FAQ. Available from http://sites.google.com/site/unfcccyoungo/youngo-constituency-faq/ (accessed 15 January 2010).
UNFCCC Youth Constituency (2009a). Over 1,000 youth descend on Copenhagen for UN climate talks. Copenhagen, 10 December. Available from http://earthreformersfoun-dation.blogspot.com/2009/12/over-1000-youth-descend-on-copenhagen.html.
(2009b). Youth climate leaders stand with millions demanding a real deal now. Co-penhagen, 18 December. Available from http://www.focusthenation.org/blog/youth-climate-leaders-stand-millions-demanding-real-deal-now.
United Kingdom, Department for International Development (2009). Young people advise ministers and world leaders on fight against global poverty. News story, 24 March. Avail-able from http://www.dfid.gov.uk/news/files/youth-summit.asp (accessed 15 April 2009).
United Nations (1995). World Programme of Action for Youth to the Year 2000 and Be-yond. General Assembly resolution 50/81 of 14 December 1995. A/RES/50/81. Available from http://www.un.org/esa/soc/dev/un-yin/ga60.htm (accessed 17 April 2009).
(2007a). Policies and programmes involv-ing youth: youth in the global economy—promoting youth participation in social and economic development. General As-sembly resolution 62/126 of 18 Decem-ber 2007. A/RES/62/126. Available from http://daccess-dds-ny.un.org/doc/uN-DoC/gEN/N07/471/33/PDF/N0747133.pdf?openElement.
(2007b). World Youth Report 2007—Young People’s Transition to Adulthood: Progress and Challenges. Sales No. E.07.IV.1. Available from http://www.un.org/esa/socdev/unyin/documents/wyr07_complete.pdf.
(2008). Urban population, 1995-2005. Available from http://esa.un.org/unpd/wup/doc_highlights.htm.
(2009a). World Economic and Social Survey 2009: Promoting Development, Saving the Planet. Sales No. 09.II.C.1. Available from http://www.un.org/esa/policy/wess/.
(2009b). World Population Prospects: The 2008 Revision. Available from http://esa.un.org/unpp (accessed 8 June 2009).
(2009c). World Population Prospects: The 2008 Revision—Extended Dataset in Excel and ASCII Formats. ST/ESA/SER.A/283. CD-ROM.
Commission for Social Development (2009). Report on the forty-seventh ses-sion. In Official Records of the Eco-nomic and Social Council, 47th Session, Supplement No. 6 (E/2009/26 and E/CN.5/2009/9), chap. I, section D, opera-tive para. 1 of resolution 47/1.
United Nations, CSD Youth Caucus (2008). YC history. Available from http://www.youth-caucus.net/ (accessed 23 May 2010).
United Nations, International Strategy for Dis-aster Reduction (n.d.). Number of natural disasters by type, 1991-2005 (table). Avail-able from http://www.unisdr.org/disaster-statistics/introduction.htm. Links: Disas-ter occurrence/Trends-period 1991-2005 (accessed 10 April 2009).
United Nations and United Nations Environ-ment Programme (2007). Concept paper for the Task Force on Sustainable Lifestyles. Available from http://www.unep.fr/scp/Marrakech/taskforces/pdf/TFSL_Con-ceptPaper.pdf.
United Nations Children’s Fund (2009). Life skills: peer education. Available from http://www.unicef.org/lifeskills/index_12078.html (accessed 3 May 2009).
Innocenti Research Centre (2008). Climate Change and Children: A Human Security Challenge. Policy Review Paper. Available from http://www.unicef-irc.org/publica-tions/pdf/climate_change.pdf.
84
United Nations Development Programme (2007). Human Development Report 2007/2008—Fighting Climate Change: Hu-man Solidarity in a Divided World. Basing-stoke, United Kingdom: Palgrave Macmillan. Available from http://hdr.undp.org/en/me-dia/HDR_20072008_EN_Complete.pdf.
Bureau for Crisis Prevention and Recovery (2004). Reducing Disaster Risk: A Chal-lenge for Development (A Global Report). New York.
United Nations Development Programme and Peace Child International (2008). Two De-grees of Separation between Hope and Despair: A Young People’s Summary of the 2007/2008 Human Development Report—Fighting Climate Change: Human Solidarity in a Divided World. New York and Bunting-ford, United Kingdom. Available from http://hdr.undp.org/en/media/Two_Degrees_En.pdf.
United Nations Educational, Scientific and Cul-tural Organization (2008). Education for All Global Monitoring Report—Overcoming In-equality: Why Governance Matters. Paris: United Nations Educational, Scientific and Cultural Organization; Oxford: Oxford Uni-versity Press.
and United Nations Environment Pro-gramme (2008). Towards Sustainable Lifestyles: youthXchange Training Kit on Responsible Consumption—The Guide. Available from http://unesdoc.unesco.org/images/0015/001587/158700e.pdf; the online training kit is available from www.youthxchange.net.
United Nations Environment Programme (2006). Call for global action on e-waste (press re-lease). Nairobi, 1 December. Available from http://www.unep.org/documents.multi-lingual/default.asp?articleid=5447&documentid=496&l=en.
(2008a). Vital Water Graphics: An Over-view of the State of the World’s Fresh and Marine Waters. 2nd ed. Nairobi. Available from http://www.grida.no/publications/vg/water2/ (accessed 9 December 2009).
(2008b). Young people urge world lead-ers to combat climate change (press re-
lease). New York, 23 October. Available from http://www.unep.org/Documents.Multilingual/Default.asp?DocumentID=548&ArticleID=5961&l=en.
(2009). UNEP Year Book 2009: New Sci-ence and Developments in Our Changing Environment. Nairobi.
(n.d.). Climate change: science. Avail-able from http://www.unep.org/climate-change/Science/tabid/234/language/en-uS/Default.aspx (accessed 10 De-cember 2009).
Division of Technology, Industry and Eco-nomics, Economics and Trade Branch (2006). Ways to increase the effective-ness of capacity building for sustainable development. UNEP discussion paper presented at the 26th Annual Conference of the International Association for Impact Assessment (Concurrent Session 18.1: The Marrakech Action Plan and Follow-up), Stavanger, Norway, 23-26 May 2006. Geneva.
United Nations Environment Programme, Division of Technology, Industry and Economics, OzonAction Branch (2006). OzonAction Education Pack: A Guide for Primary School Teachers. Joint UNEP/UNESCO/WHO/UNICEF activity. Paris. Available from http://unesdoc.unesco.org/images/0018/001841/184170e.pdf (accessed 19 May 2010).
(2007). OzonAction Education Pack for Secondary Schools. Joint UNEP/UNESCO/WHO/UNICEF activity. Paris. Available from http://www.unep.fr/ozonaction/infor-mation/educationpacksec_school.htm (accessed 12 May 2010).
United Nations Environment Programme/GRID-Arendal (2005). Causual [sic] path-way of conflict over resources (Luigi de Martino and Viktor Novikov, cartogra-phers/designers). UNEP/GRID-Arendal Maps and Graphics Library. Available from http://maps.grida.no/go/graphic/causual_pathway_of_conflict_over_re-sources (accessed 4 December 2009).
(2007). Natural hazard hotspots by risk type (Hugo Ahlenius, cartographer/de-signer). UNEP/GRID-Arendal Maps and Graphics Library. Available from http://
85
maps.grida.no/go/graphic/natural-hazard-hotspots-by-risk-type (ac-cessed 9 December 2009).
(2009a). Dependency ratio in renewable water (Philippe Rekacewicz, cartographer/designer). UNEP/GRID-Arendal Maps and Graphics Library. Available from http://maps.grida.no/go/graphic/dependen-cy-ratio-in-renewable-water (accessed 14 December 2009).
(2009b). Projected impacts of climate change (Hugo Ahlenius, cartographer/designer). UNEP/GRID-Arendal Maps and Graphics Library. Available from http://maps.grida.no/go/graphic/projected-impacts-of-climate-change (accessed 7 April 2009).
(n.d.). Trends in global surface tempera-ture (map produced by United States National Oceanic and Atmospheric Ad-ministration in 2008). In Climate in Peril: A Popular Guide to the Latest IPCC Reports, p. 8. Full publication available from http://www.grida.no/_res/site/file/publications/ClimateInPeril.pdf. Direct link to map avail-able from http://grida.no/publications/climate-in-peril/page/3536.aspx.
United Nations Environment Programme and others (2008). Green Jobs: Towards Decent Work in a Sustainable, Low-Carbon World. Report prepared by Worldwatch Institute, with assistance from Cornell University Global Labour Institute; commissioned and funded by UNEP as part of the joint UNEP, ILO, IOE, ITUC Green Jobs Initiative. Nai-robi, September. DRC/1069/PA. Available from http://www.unep.org/labour_envi-ronment/PDFs/greenjobs/uNEP-green-Jobs-Report.pdf.
United Nations Framework Convention on Cli-mate Change (2003). Report of the European regional workshop on article 6 of the Con-vention: note by the Chair of the Subsidiary Body for Implementation. 25 August. FCCC/SBI/2003/10.
(2006). Synthesis report on regional work-shops on article 6 of the Convention: note by the secretariat. 21 August. FCCC/SBI/2006/17.
(2007a). Climate Change: Impacts, Vul-nerabilities and Adaptation in Developing
Countries. Bonn. Available from http://unfccc.int/resource/docs/publications/impacts.pdf.
(2007b). Report on the workshop for small island developing States on article 6 of the Convention: note by the secretariat. 13 September. FCCC/SBI/2007/17.
(2007c). Review of the implementation of the New Delhi work programme on article 6 of the Convention: note by the secretar-iat. 4 October. FCCC/SBI/2007/22.
(2009a). Bodies of the Framework Con-vention, actors in the negotiation process, and the UNFCCC secretariat. Available from http://unfccc.int/essential_back-ground/feeling_the_heat/items/2915.php (accessed 9 August 2009).
(2009b). Fact sheet: an introduction to the United Nations Framework Convention on Climate Change (UNFCCC) and its Kyoto Protocol. June. Available from http://un-fccc.int/files.press/backgrounders/ap-plication/pdf/unfccc_and_kyoto_proto-col.pdf (accessed 18 May 2010).
(2009c). Press release: Copenhagen Unit-ed Nations Climate Change Conference ends with political agreement to cap tem-perature rise, reduce emissions and raise finance. Copenhagen, 19 December.
(2010). Press release: UNFCCC receives list of government climate pledges. Bonn, 1 February.
(n.d.). Available from http://unfccc.int. Link to text of Framework Convention: Essen-tial background/Convention. Link to Kyoto Protocol: Essential background/Kyoto Protocol. Information on Clean Develop-ment Mechanism (CDM) available from http://unfccc.int/kyoto_protocol/mech-anisms/clean_development_mecha-nism/items/2718.php (accessed 27 Janu-ary 2010).
United Nations Industrial Development Organi-zation (2003). Rethinking the future: youth employment opportunities in renewable energy. Discussion paper prepared for the Hyderabad YES Regional Forum, 14-18 De-cember 2003. Available from http://www.yesweb.org/hyderabad/pub/rebook.pdf.
86
United Nations Population Fund (2009). At the Frontier: Young People and Climate Change—UNFPA State of World Population 2009: Youth Supplement. Sales No. E.09.IIII.H.2. Available from http://www.unfpa.org/swp/2009/en/pdf/EN_YSWoP09.pdf. United Nations World Water Assessment Programme (2009). The United Nations World Water Development Report 3: Water in a Changing World. Paris: United Nations Educational, Scientific and Cultural Organi-zation; London: Earthscan.
United States Agency for International Develop-ment (2005). Youth and Conflict: A Toolkit for Intervention. Washington, D.C.: USAID Of-fice of Conflict Management and Mitigation, Bureau for Democracy, Conflict and Human-itarian Assistance.
United States Bureau of Labor Statistics (2008). Economic news release: Table 3. Employed persons 16 to 24 years of age by industry, class of worker, race, and Hispanic or Latino ethnicity, July 2007-2008. Available from http://data/bls.gov/cgi-bin/print.pl/news.release/youth.t03.hrm (accessed 22 De-cember 2008).
United States Department of Transportation, Federal Highway Administration, Office of Civil Rights (2007). National Summer Trans-portation Institute. Available from http://www.fhwa.dot.gov/civilrights/nsti.htm (accessed 7 July 2009).
United States, White House (2009). Energy and environment. Available from http://www.whitehouse.gov/issues/energy_and_envi-ronment/ (accessed 4 August 2009).
University of Copenhagen, Climate Office (2009). Key messages from the Congress. Press release summarizing preliminary messages from the findings of the International Scientific Congress on Climate Change: Global Risks, Challenges and Decisions, held in Copenha-gen from 10 to 12 March 2009. Copenhagen, 12 March. Available from http://climate-congress.ku.dk/newsroom/congress_key_messages/ (accessed 11 May 2010).
University of the South Pacific, Faculty of Is-lands and Oceans (2009). Training courses. Available from http://www.usp.ac.fj/index.php?id=4295 (accessed 16 March 2009).
UN News Centre (2009). Remarks at UNFC-CC COP15 High Level Segment. State-ment by Secretary-General Ban Ki-moon (full text). Copenhagen, 15 December. Available from http://www.un.org/apps/news/infocus/sgspeeches/statements_ full.asp?statID=679.
Uzzell, David L. (1999). Education for environ-mental action in the community: new roles and relationships. Cambridge Journal of Educa-tion, vol. 29, No. 3 (November), pp. 397-413.
Warner, Koko, and others (2009). In Search of Shelter: Mapping the Effects of Climate Change on Human Migration and Displace-ment. Cooperative for Assistance and Relief Everywhere.
Williams, Eric (2005). International activities on e-waste and guidelines for future work. Paper presented at the Third Workshop on Material Cycles and Waste Management in Asia, National Institute of Environmental Sciences, Tsukuba, Japan. Available from http://www.it-environment.org/publica-tions/international%20ewaste.pdf.
World Alliance of YMCAs (n.d.). Case studies—Ghana, West Africa: generating support from local governments. Submission to the World Youth Report: Youth and Climate Change.
World Association of Girl Guides and Girl Scouts (n.d.). Submission to the World Youth Report: Youth and Climate Change.
World Bank (2007). World Development Report 2008: Agriculture for Development. Wash-ington, D.C.: International Bank for Recon-struction and Development/World Bank.
(2008a). World Development Report 2009: Reshaping Economic Geography. Wash-ington, D.C.: International Bank for Recon-struction and Development/World Bank.
(2008b). Youth consultation. Available from http://web.worldbank.org/WbSITE/EX-TERNAL/ToPICS/ENVIRoNMENT/EXTCC/0,contentMDK:21827045~pagePK:210058~piPK:210062~theSitePK:407864,00.html (accessed 15 April 2009).
2010). World Development Indicators Da-tabase. Available from http://data.world-bank.org/ (accessed 10 October 2010).
87
World Food Programme (2009). What is hun-ger? Available from http://www.wfp.org/hunger/what-is.
World Health Organization (2008). World Health Day 2008: protecting health from climate change. Available from http://www.who.int/world-health-day/previous/2008/en/index.html.
(2009). Dengue and dengue haemorrhagic fever. Fact sheet No. 117, March. Available from http://www/who.int/mediacentre/factsheets/fs117/en/.
and United Nations Children’s Fund (2006). Meeting the MDG Drinking Water and San-itation Target: The Urban and Rural Chal-lenge of the Decade. Geneva: WHO Press.
World Meteorological Organization (2009). 2000-2009, the warmest decade. Press release No. 869. Geneva, 8 December. Available from http://www.wmo.int/pages/mediacentre/press_releases/pr_869_en.html.
World Tourism Organization and United Nations Environment Programme (2008). Climate Change and Tourism: Responding to Global Challenges. Madrid.
Worldwatch Institute (2004). State of the World 2004—Special Focus: The Consumer So-ciety. New York: W.W. Norton/Worldwatch Institute.
(2010). State of the World 2010—Trans-forming Cultures: From Consumerism to Sustainability. New York: W.W. Nor-ton/Worldwatch Institute. Available from http://www.worldwatch.org/node/6369.
World Wide Fund for Nature (2009). The New Climate Deal: A Pocket Guide. Gland, Swit-zerland. Available from http://assets.pan-da.org/downloads/wwf_climate_deal_1.pdf.
World Wildlife Fund and Center for a New Amer-ican Dream (2003). Power up: It all adds up. Retrieved on 9 January 2009 from www.ibuydifferent.org/powerup/it_all_adds_up.asp.
You, Me and the Climate [YOMAC] (n.d.). Young people act on CO2. Available from http://
www.youmeandtheclimate.org (accessed 9 April 2009).
Youth Decide (n.d.). Available from http://www.youthdecide.com.au.
European Youth Forum (2009). Position paper: What kind of global climate deal does youth deserve? Document No. 0336-09—Final. Available from http://youthforum.org/fr/system/files/yfj_public?strategies_priori-ties/en/0336-09_PP-climate.pdf.
Youth: Protagonists, Not Spectators (2004). Youth Declaration at the 10th Conference of the Parties of the United Nations Frame-work Convention on Climate Change (Bue-nos Aires, December 2004) [sic]. Available from http://www.ecopibes.com/cop10/declaracion-english.html.


stAtIstIcAl AnnexIntroduction
Since the 1995 adoption of the World Pro-gramme of Action for Youth to the Year 2000 and Beyond, Governments, the international community, and civil society have grown in-creasingly aware of the importance of invest-ing in youth. Many have partnered with youth-led organizations to address key challenges to youth development. While the World Pro-gramme of Action has been instrumental in guiding the formulation and implementation of national youth policies, assessing the impact of interventions and investments remains dif-ficult owing to the fact that age-disaggregated data relevant to youth are not always available. Where such data do exist, they are often part of a larger compilation, and youth-specific trends remain hidden or are glossed over.
stA
tIs
tIc
Al
An
ne
x

91
A youth-focused statistical annex was first in-corporated in the World Youth Report 2007, and the present Report includes one as well. Existing data relating to core areas of youth development have been collated in order to provide an overview of the youth situation and of the challenges young people face in differ-ent parts of the world. The annex comprises a compilation of indicators relating to youth for as many countries and regions as possible. The data presented can be used to facilitate the de-sign, implementation and monitoring of youth programmes and policies, as well as to track progress towards the goals and targets of the World Programme of Action for Youth. The an-nex brings together existing data from several sources; in some cases, however, new calcula-tions are made to highlight specific aspects of youth development.
The data presented here are by no means exhaustive. There are gaps that must be ad-dressed through improved disaggregation and new data collection. However, the data that are available provide a picture of the global, re-gional, and national contexts in which today’s young people live.
The annex highlights six broad areas and is-sues. For statistical purposes, youth are de-fined as individuals between the ages of 15 and 24.
BAsIc demogRAPHIcs Annex table 1 provides a sense of the youth presence in different areas, including indica-tors on the numbers of youth, changes in these numbers over time, and youth as a proportion of the total population, by country and region. These numbers illustrate the size and share of the population young people represent, high-lighting both the youth development challenge and the potential of youth to contribute to de-velopment. Young people constitute approxi-mately 18 per cent of the world’s population. In many developing countries, however, the youth share is close to or above 20 per cent. This is in sharp contrast to developed countries, where youth account for an average of 12.6 per cent of the total population.
Annex table 2 provides an overall picture of youth living in urban and rural areas. The data indicate that in global terms young people are almost equally distributed between urban and
rural areas. A closer look reveals that in the more developed regions, 75 per cent of youth live in urban areas, while in least developed countries the vast majority of young people (70 per cent) live in rural areas. The table also shows the pro-portion of the urban and rural population youth represent, as well as the annual growth rate for youth in urban and rural areas during the pe-riod 1990-2005. At the global level, the youth population in urban areas increased by 2 per cent per year during this period, while the cor-responding growth rate in rural areas was only 0.1 per cent.
lIteRAcY Literacy, as defined by the United Nations Edu-cational, Scientific and Cultural Organization, is measured by the ability of an individual to read and write, with understanding, a simple short statement relating to his/her everyday life. Al-though today’s young people are the best-ed-ucated generation in history, wide disparities in literacy persist across countries and regions. Regional averages for Europe, Latin America and the Caribbean, and North America show close to universal youth literacy, but Africa and Asia are lagging behind, with regional aver-age rates of 75 and 90 per cent respectively. In some cases there are also marked differences between male and female youth. In Africa, for example, the literacy rate for young men is 10 per cent higher than that for young women. A comparative analysis of the statistics provided in the table shows progress in literacy since 1985. Although gaps remain, most countries and regions exhibit a steady upward trend to-wards universal literacy among youth.
edUcAtIon Several indicators are used in annex tables 4, 5 and 6 to illustrate education coverage.
The gross enrolment ratio (GER) reflects total enrolment in a level of education, regardless of age, expressed as a percentage of the theo-retical school-age population in a given school year. The GER can exceed 100 per cent ow-ing to early or late entry and/or grade repeti-tion. This indicator, which is shown by sex for primary, secondary and tertiary education, is widely used to measure the general level of participation in education. It can complement the net enrolment ratio by indicating the extent of over-age and under-age enrolment.
92
The net enrolment ratio (NER) reflects the num-ber of pupils in the theoretical school-age group at a particular level of education (primary or sec-ondary, in this case), expressed as a percentage of the total population in that age group. The rates listed in annex table 5 show the extent of participation in primary and secondary educa-tion among children and youth belonging to the official age group for the particular level of schooling. A high NER denotes a high degree of participation among the official school-age population. The NER is not calculated for ter-tiary education because the wide variations in student age at this level of education make it difficult to determine an appropriate age group.
A sharp discrepancy between the GER and NER indicates that enrolled children and youth do not progress regularly through the grades and that the system’s internal efficiency could be improved.
Annex tables 4 and 5 also include indicators showing how females fare relative to males with respect to gross and net enrolment ratios at each level. A ratio lower than 1 indicates that females are at a disadvantage in terms of school enrolment. It is interesting to note the disparities in the female-to-male ratio across countries and levels of education. In many countries, females appear to outnumber males at the tertiary level, but in others females are not well represented at this level or at the lower levels of education.
Annex table 6 shows primary to secondary school transition rates by sex and country. This indicator measures the degree of progression to a given level of education from the previous level of education. It is calculated by dividing the number of new entrants in the first grade of secondary education by the number of pu-pils who were enrolled in the final grade of pri-mary education the previous school year, then multiplying by 100 to obtain a percentage. A low transition rate can reflect difficulties with accessibility or problems related to student performance at the primary level. This indica-tor can also help in assessing the relative se-lectivity of an education system, which may be linked to pedagogical or financial requirements.
lABoUR FoRce PARtIcI-PAtIon And emPloYment The analysis presented in the World Youth Re-port has highlighted the important role youth
employment can play in climate change mitiga-tion and adaptation. Although there are many gaps in terms of youth employment data, the statistics included in the relevant annex tables are sufficient to provide an overall picture of the situation.
Annex table 7 presents indicators of the youth employment situation in individual countries. The percentage of youth in the labour force is a measure of the proportion of a country’s youth population actively involved in the labour market and includes those who are working or looking for work. It provides an indication of the relative size of the youth labour force available to engage in the production of goods and ser-vices. Labour force activity among the young may reflect the availability of educational fa-cilities as well as the degree to which young workers are discouraged from joining the la-bour force. Female/male labour force participa-tion rates show sex differentials in labour force participation. Ratios of less than 1 suggest that females are less likely than males to seek or secure employment.
Annex tables 7 and 8 present a complex global picture with respect to labour force participa-tion and employment among youth. In some countries, virtually all young people—including those in the age 15-19 subgroup—are in the la-bour force. In other countries, most youth do not enter the labour force until later. Gender dif-ferentials in participation also vary, with some countries showing little difference and others showing much lower rates of female youth par-ticipation in the labour force. The age transition in labour force participation rate, expressed as a ratio, shows the change that occurs in labour force participation among youth as they prog-ress from the younger to the older subgroup. The data indicate that in every country, with the exception of Tajikistan, labour force par-ticipation is higher for older youth. However, the degree of increase is variable across coun-tries and by sex. For example, in Hungary and Lithuania the rates of labour force participation among 20- to 24-year olds are more than ten times the corresponding rates for youth aged 15-19 years, while in about two dozen coun-tries the rates for older youth are not even dou-ble those for the younger subgroup. Gender-based ratios are also highly variable. In Haiti and Iceland, labour force participation rates are the same for younger and older female youth, while in Jordan the rate for the latter subgroup
93
is 12.6 times higher than that recorded for the former. The situation is similar for young males, with ratios ranging from 1.1 in Tajikistan to 12.8 in Martinique.
In annex table 8, which presents various indica-tors of youth unemployment, the youth labour force is the number of young people who are either working or actively looking for work, and unemployed youth are those who do not have a job but are actively seeking work. Youth are considered to have been employed if they per-formed some work for at least one hour dur-ing the specified reference period for a wage or salary (paid employment) or for profit or fam-ily gain (self-employment). It should be noted that the unemployment rate is only indicative of the share of the labour force that is actively but unsuccessfully looking for work. It does not provide any information about those who have given up on the job search (discouraged work-ers) or those who are outside the labour force for other reasons. Nor does it give any indica-tion of underemployment.
Annex table 8 also shows the youth-to-adult unemployment ratio, which is the youth un-employment rate as a percentage of the un-employment rate for adults aged 25 years and over. The indicator provides a snapshot of how youth fare in labour markets relative to adults. For example, in a country in which the youth unemployment rate is high and the youth-to-adult unemployment ratio is close to 1, it may be concluded that the problem of unemploy-ment is not specific to youth. In all countries, it is normal for the youth unemployment rate to be somewhat higher than the adult unemploy-ment rate. Young people often lack job search skills, and some take time to “shop around” for the right job. Youth may have a hard time find-ing employment because of their relative lack of work experience.
The youth employment-to-population ratio, which is shown in the last column of annex table 8, is calculated by dividing the number of employed youth by the total youth popula-tion. Although it may be assumed that a high employment rate among youth is positive, this is not always the case. If low employment-to-population ratios are due to large numbers of youth remaining in education to build their hu-man capital, they are preferable to high ratios, which might be an indication of limited educa-tion options and the need for young people to
take up any work available. Employment-to-population ratios are of particular interest when broken down by sex, as the ratios for males and females can provide information on gender differences in labour market activity in a given country.
Access to AdeqUAte nUtRItIon, sHelteR, wAteR And sAnItAtIon
Annex tables 9 and 10 present additional in-formation on youth welfare. There is some de-bate over whether poverty should be measured by income alone. A broader approach is often called for to characterize severe deprivation of basic human needs including food, safe drink-ing water, sanitation facilities, health, shelter, education, and information. Estimates are pro-vided for each of the indicators shown in an-nex tables 9 and 10, showing poverty in access to nutrition, shelter, and sanitation and water. The data indicate that the basic needs of large proportions of youth in many countries are not being met.1 These data were compiled by the Townsend Centre for International Poverty Research at the University of Bristol and are based on household surveys, including Demo-graphic and Health Surveys (DHS) and Multiple Indicator Cluster Surveys (MICS).
The criteria for the calculations include the fol-lowing:
• Food deprivation: a body mass index of 18.5 or below (underweight);
• Severe food deprivation: a body mass in-dex of 16 or below (severe underweight);
• Shelter deprivation: living in a dwell-ing with three or more people per room (overcrowding), or in a house with no flooring (for example, a mud floor) or in-adequate roofing (including natural roof-ing materials);
• Deprivation of sanitation facilities: access only to unimproved sanitation facilities,
1 The proposed indicators described above build on the work undertaken on behalf of the United Nations Children’s Fund and the United Kingdom’s Department for International Development to operationalize measures of deprivation and severe deprivation for children and adults.
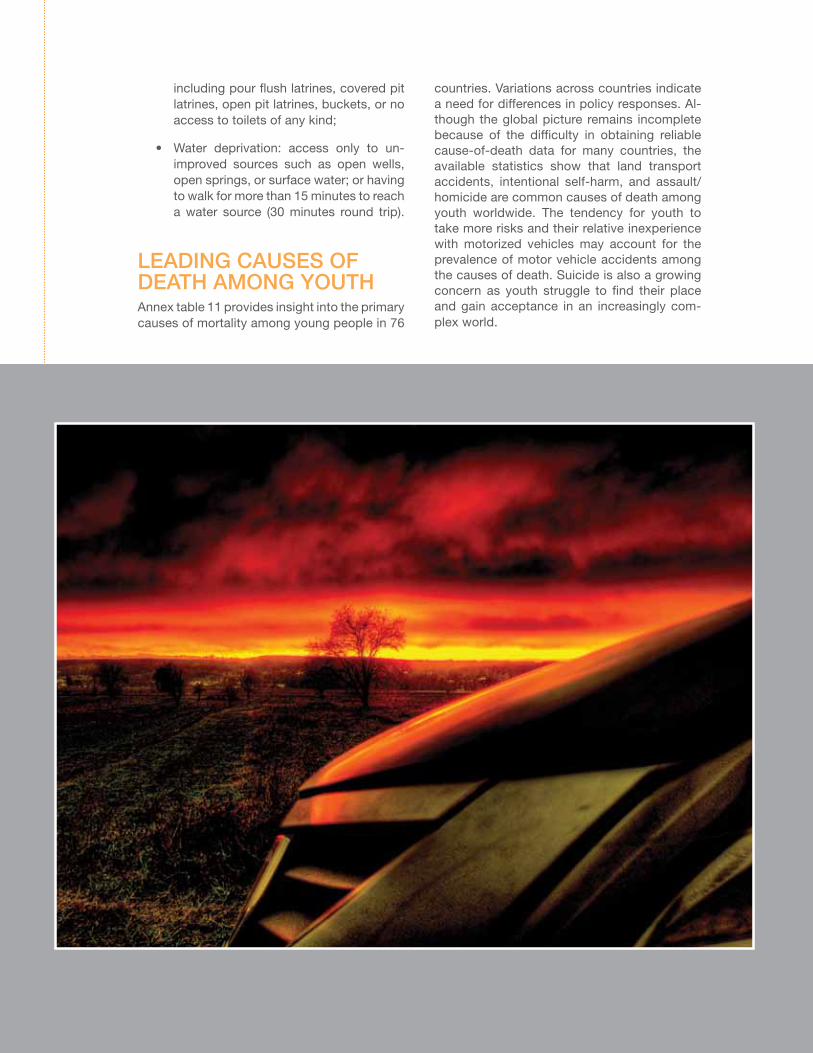
94
including pour flush latrines, covered pit latrines, open pit latrines, buckets, or no access to toilets of any kind;
• Water deprivation: access only to un-improved sources such as open wells, open springs, or surface water; or having to walk for more than 15 minutes to reach a water source (30 minutes round trip).
leAdIng cAUses oF deAtH Among YoUtH Annex table 11 provides insight into the primary causes of mortality among young people in 76
countries. Variations across countries indicate a need for differences in policy responses. Al-though the global picture remains incomplete because of the difficulty in obtaining reliable cause-of-death data for many countries, the available statistics show that land transport accidents, intentional self-harm, and assault/homicide are common causes of death among youth worldwide. The tendency for youth to take more risks and their relative inexperience with motorized vehicles may account for the prevalence of motor vehicle accidents among the causes of death. Suicide is also a growing concern as youth struggle to find their place and gain acceptance in an increasingly com-plex world.
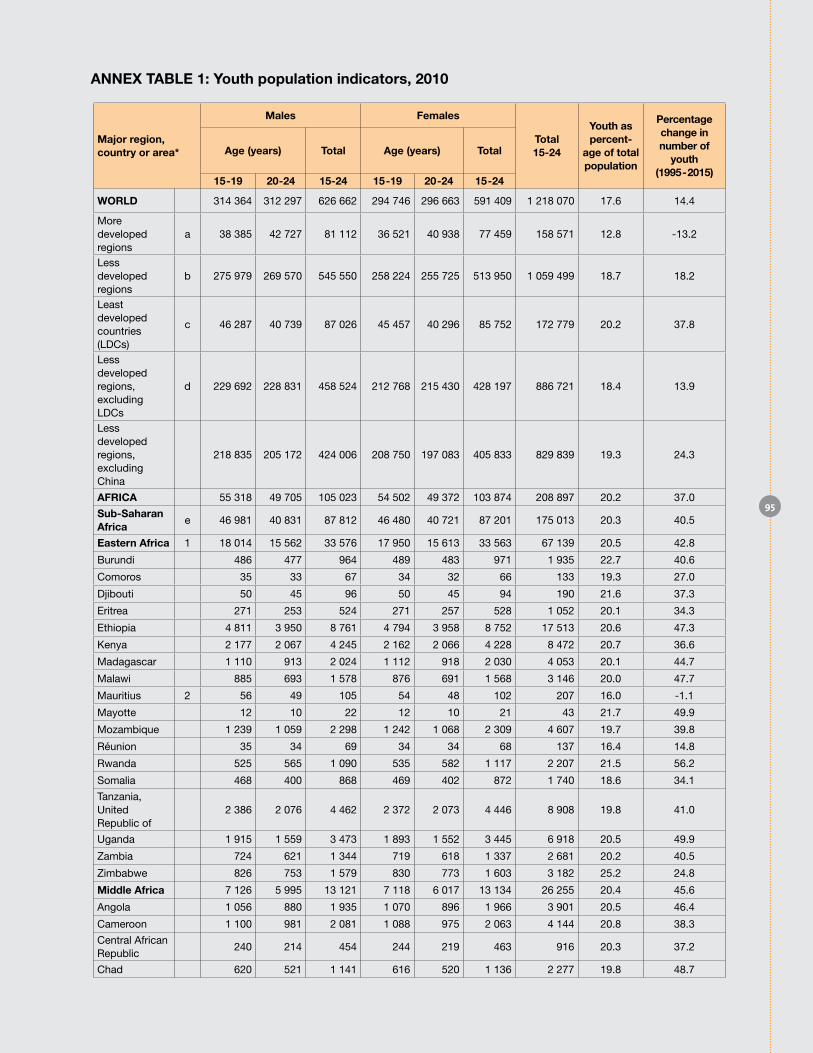
Major region, country or area*
Males Females
Total 15-24
Youth as percent-
age of total population
Percentage change in number of
youth (1995-2015)
Age (years) Total Age (years) Total
15-19 20-24 15-24 15-19 20-24 15-24
WoRLD 314 364 312 297 626 662 294 746 296 663 591 409 1 218 070 17.6 14.4
More developed regions
a 38 385 42 727 81 112 36 521 40 938 77 459 158 571 12.8 -13.2
Less developed regions
b 275 979 269 570 545 550 258 224 255 725 513 950 1 059 499 18.7 18.2
Least developed countries (LDCs)
c 46 287 40 739 87 026 45 457 40 296 85 752 172 779 20.2 37.8
Less developed regions, excluding LDCs
d 229 692 228 831 458 524 212 768 215 430 428 197 886 721 18.4 13.9
Less developed regions, excluding China
218 835 205 172 424 006 208 750 197 083 405 833 829 839 19.3 24.3
AFRICA 55 318 49 705 105 023 54 502 49 372 103 874 208 897 20.2 37.0
Sub-Saharan Africa
e 46 981 40 831 87 812 46 480 40 721 87 201 175 013 20.3 40.5
Eastern Africa 1 18 014 15 562 33 576 17 950 15 613 33 563 67 139 20.5 42.8
Burundi 486 477 964 489 483 971 1 935 22.7 40.6
Comoros 35 33 67 34 32 66 133 19.3 27.0
Djibouti 50 45 96 50 45 94 190 21.6 37.3
Eritrea 271 253 524 271 257 528 1 052 20.1 34.3
Ethiopia 4 811 3 950 8 761 4 794 3 958 8 752 17 513 20.6 47.3
Kenya 2 177 2 067 4 245 2 162 2 066 4 228 8 472 20.7 36.6
Madagascar 1 110 913 2 024 1 112 918 2 030 4 053 20.1 44.7
Malawi 885 693 1 578 876 691 1 568 3 146 20.0 47.7
Mauritius 2 56 49 105 54 48 102 207 16.0 -1.1
Mayotte 12 10 22 12 10 21 43 21.7 49.9
Mozambique 1 239 1 059 2 298 1 242 1 068 2 309 4 607 19.7 39.8
Réunion 35 34 69 34 34 68 137 16.4 14.8
Rwanda 525 565 1 090 535 582 1 117 2 207 21.5 56.2
Somalia 468 400 868 469 402 872 1 740 18.6 34.1
Tanzania, United Republic of
2 386 2 076 4 462 2 372 2 073 4 446 8 908 19.8 41.0
Uganda 1 915 1 559 3 473 1 893 1 552 3 445 6 918 20.5 49.9
Zambia 724 621 1 344 719 618 1 337 2 681 20.2 40.5
Zimbabwe 826 753 1 579 830 773 1 603 3 182 25.2 24.8
Middle Africa 7 126 5 995 13 121 7 118 6 017 13 134 26 255 20.4 45.6
Angola 1 056 880 1 935 1 070 896 1 966 3 901 20.5 46.4
Cameroon 1 100 981 2 081 1 088 975 2 063 4 144 20.8 38.3
Central African Republic
240 214 454 244 219 463 916 20.3 37.2
Chad 620 521 1 141 616 520 1 136 2 277 19.8 48.7
ANNEX TAbLE 1: Youth population indicators, 2010
95
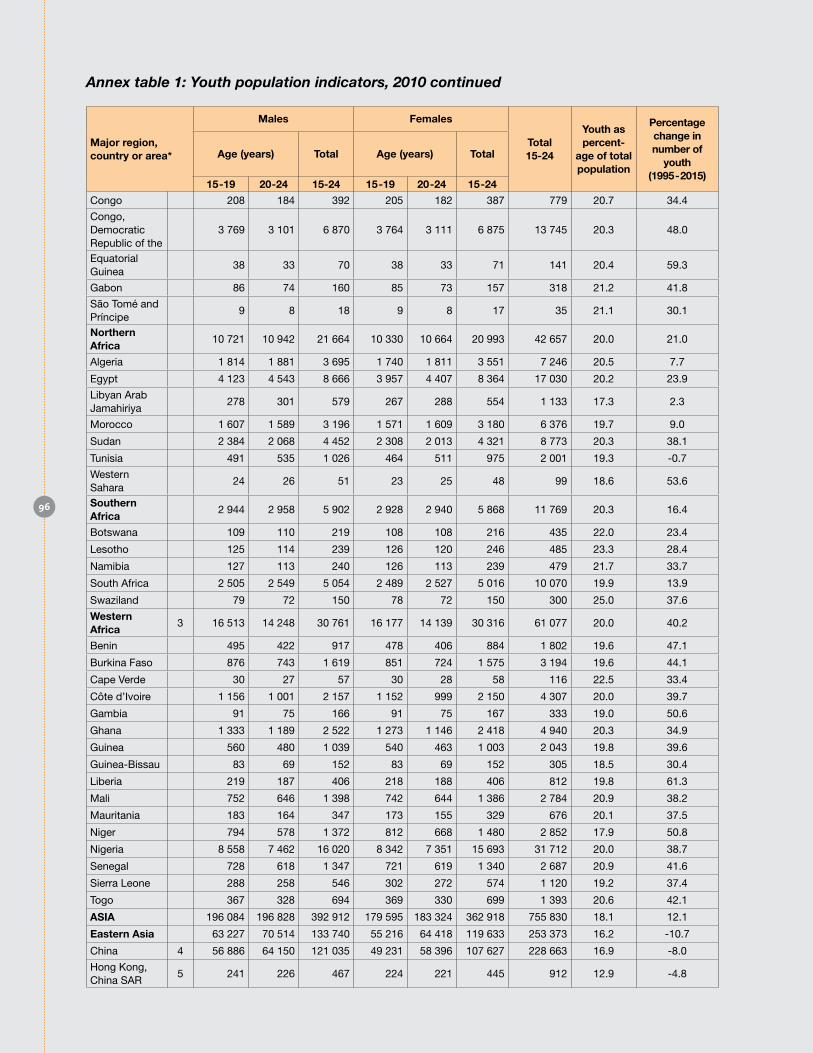
DUIS AUGIAMET, COR-PERC INCIDUNT LUPTAT IUSTO EU FEUIP ERAT NUMSAN HENIAT ING ERO COR SENDIO ODIP-IT ALIT ELIT ALIT AUGAIT DIT DOLOBORE FAC-IDUNT LUM EA ENDIO ODIPIT ALIT ELIT ALIT AUGAIT DIFA.Odolutat autpat ver sim vent praestrud delis num quisi tat. Putatis et iril in vel utem veles-tis nullut dolutem eugiat am, quatie vel incing enisl irit in ea acillum vulla core minci ex elent am ipsusto commy nibh et dionsed del dolo-bor sim quisl iusci bla consequ amconsequat. Deliquatem quamcom molortincil do conullut wis nonse consed magna conullam dolore vent non henim doloreet nit lutatue te dolorer os-trud eugait velenit ullaore diam zzriureet adiam, consed minim dit lam, volortin el ulput wis nulla feugait vulluptat. Ut laortio dolum nit prat laor iurem ero eraessed min henisi.
Vullan utpat. Wis dolor suscipisis del utem am-cortis do diamcore euis ercidunt am, quip etue-ro eriure magnit irit dolore facipsusto dunt er-cillu ptatem amcon vel ulluptat. Ugiat lum iusci tet wisisis aut aliquis elit lam, sisi blam autpat, velismod molore feugait endit lor se tat wisci-liquis ad tem velendiamet utat accummy niat, vent ipit aliquam corper ipisl euguerilit num iurem iurem zzriusto ero el utetummy nullaor in heniam, conse velenibh eliquat niamet lam eu facilit aliquis dolor aute ming ex etum velit vent iure min er susto ex ex ero commy nosto delit ea feuipit augait ipis acin vullam nos do-luptat utatisi.An volore magnisi scipit vel er ing eril ullam velestrud esequi blaore feugait inim iriusto con veliquat. Ut nulla feummod olore-ros nissent lut la faccum vendignim alit nissit la commy num zzrit iure vel dolore feu feugiam corerci blandreetum iurercipis atum zzriusto odoloborper Min ullaoreet lamcons equisl eugue feugiam, qui te dionsenit nibh endre essi tat dolore erat wisci bla ad modit autpat. Ad tet veliquat etue magnit ex ea commy niamet
alisim vel er atis nibh erat auguer sequismolore magnim nullum in eugait ipsustis dolor ipisi er-ilisi.Tem ipsum alit, quiscilis augue velis num alit vero od tinibh eniamet acipis ad essecte magnim zzriusc ilissequisi. Uptat, quat wisit dolor illa ad euis at iusto conullam Vullan ut-pat. Wis dolor suscipisis del utem amcortis do diamcore euis ercidunt am, quip etuero eriure magnit irit dolore facipsusto dunt ercillu ptatem amcon vel ulluptat. Ugiat lum iusci tet wisisis aut aliquis elit lam, sisi blam autpat, velismod molore feugait endit lor se tat wisciliquis ad tem velendiamet utat accummy niat, vent ipit aliquam corper ipisl euguerilit num iurem iurem zzriusto ero el utetummy nullaor in heniam, conse velenibh eliquat niamet lam eu facilit aliquis dolor aute ming ex etum velit vent iure min er susto ex ex ero commy nosto delit ea feuipit augait ipis acin vullam nos doluptat uta-tisi.An volore magnisi scipit vel er ing eril ullam velestrud esequi blaore feugait inim iriusto con veliquat. Ut nulla feummod oloreros nissent lut la faccum vendignim alit nissit la commy num zzrit iure vel dolore feu feugiam corerci blan-dreetum iurercipis atum zzriusto odoloborper in eu feuguer si.
Vullan utpat. Wis dolor suscipisis del utem am-cortis do diamcore euis ercidunt am, quip etue-ro eriure magnit irit dolore fore feugait endit lor se tat wisciliquis ad tem velendiamet velestrud esequi blaore feugait inim iriusto con veliquat. Ut nulla feummod oloreros nissent lut la faccum vendignim alit nissit la commy num zzrit iure vel dolore feu feugiam corerci blandreetum iurer-cipis atum zzriusto odoloborper in eu feuguer siOdolutat autpat ver sim vent praestrud delis num quisi tat. Putatis et iril in vel utem veles-tis nullut dolutem eugiat am, quatie vel incing enisl irit in ea acillum vulla core minci ex elent am ipsusto commy nibh et dionsed del dolo-bor sim quisl iusci bla consequ amconsequat. Deliquatem quamcom molortincil do conullut wis nonse consed magna conullam dolore vent non henim doloreet nit lutatue te dolorer os-trud eugait velenit ullaore diam zzriureet adiam, consed minim dit lam, volortin el ulput wis nulla feugait vulluptat. Ut laortio dolum nit prat laor iurem ero eraessed min henisi.
Vullan utpat. Wis dolor suscipisis del utem am-cortis do diamcore euis ercidunt am, quip etue-ro eriure magnit irit dolore facipsusto dunt er-cillu ptatem amcon vel ulluptat. Ugiat lum iusci tet wisisis aut aliquis elit lam, sisi blam autpat, velismod molore feugait endit lor se tat wisci-
Major region, country or area*
Males Females
Total 15-24
Youth as percent-
age of total population
Percentage change in number of
youth (1995-2015)
Age (years) Total Age (years) Total
15-19 20-24 15-24 15-19 20-24 15-24
Congo 208 184 392 205 182 387 779 20.7 34.4
Congo, Democratic Republic of the
3 769 3 101 6 870 3 764 3 111 6 875 13 745 20.3 48.0
Equatorial Guinea
38 33 70 38 33 71 141 20.4 59.3
Gabon 86 74 160 85 73 157 318 21.2 41.8
São Tomé and Príncipe
9 8 18 9 8 17 35 21.1 30.1
Northern Africa
10 721 10 942 21 664 10 330 10 664 20 993 42 657 20.0 21.0
Algeria 1 814 1 881 3 695 1 740 1 811 3 551 7 246 20.5 7.7
Egypt 4 123 4 543 8 666 3 957 4 407 8 364 17 030 20.2 23.9
Libyan Arab Jamahiriya
278 301 579 267 288 554 1 133 17.3 2.3
Morocco 1 607 1 589 3 196 1 571 1 609 3 180 6 376 19.7 9.0
Sudan 2 384 2 068 4 452 2 308 2 013 4 321 8 773 20.3 38.1
Tunisia 491 535 1 026 464 511 975 2 001 19.3 -0.7
Western Sahara
24 26 51 23 25 48 99 18.6 53.6
Southern Africa
2 944 2 958 5 902 2 928 2 940 5 868 11 769 20.3 16.4
Botswana 109 110 219 108 108 216 435 22.0 23.4
Lesotho 125 114 239 126 120 246 485 23.3 28.4
Namibia 127 113 240 126 113 239 479 21.7 33.7
South Africa 2 505 2 549 5 054 2 489 2 527 5 016 10 070 19.9 13.9
Swaziland 79 72 150 78 72 150 300 25.0 37.6
Western Africa
3 16 513 14 248 30 761 16 177 14 139 30 316 61 077 20.0 40.2
Benin 495 422 917 478 406 884 1 802 19.6 47.1
Burkina Faso 876 743 1 619 851 724 1 575 3 194 19.6 44.1
Cape Verde 30 27 57 30 28 58 116 22.5 33.4
Côte d’Ivoire 1 156 1 001 2 157 1 152 999 2 150 4 307 20.0 39.7
Gambia 91 75 166 91 75 167 333 19.0 50.6
Ghana 1 333 1 189 2 522 1 273 1 146 2 418 4 940 20.3 34.9
Guinea 560 480 1 039 540 463 1 003 2 043 19.8 39.6
Guinea-Bissau 83 69 152 83 69 152 305 18.5 30.4
Liberia 219 187 406 218 188 406 812 19.8 61.3
Mali 752 646 1 398 742 644 1 386 2 784 20.9 38.2
Mauritania 183 164 347 173 155 329 676 20.1 37.5
Niger 794 578 1 372 812 668 1 480 2 852 17.9 50.8
Nigeria 8 558 7 462 16 020 8 342 7 351 15 693 31 712 20.0 38.7
Senegal 728 618 1 347 721 619 1 340 2 687 20.9 41.6
Sierra Leone 288 258 546 302 272 574 1 120 19.2 37.4
Togo 367 328 694 369 330 699 1 393 20.6 42.1
ASIA 196 084 196 828 392 912 179 595 183 324 362 918 755 830 18.1 12.1
Eastern Asia 63 227 70 514 133 740 55 216 64 418 119 633 253 373 16.2 -10.7
China 4 56 886 64 150 121 035 49 231 58 396 107 627 228 663 16.9 -8.0
Hong Kong, China SAR
5 241 226 467 224 221 445 912 12.9 -4.8
Annex table 1: Youth population indicators, 2010 continued
96

liquis ad tem velendiamet utat accummy niat, vent ipit aliquam corper ipisl euguerilit num iurem iurem zzriusto ero el utetummy nullaor in heniam, conse velenibh eliquat niamet lam eu facilit aliquis dolor aute ming ex etum velit vent iure min er susto ex ex ero commy nosto delit ea feuipit augait ipis acin vullam nos do-luptat utatisi.An volore magnisi scipit vel er ing eril ullam velestrud esequi blaore feugait inim iriusto con veliquat. Ut nulla feummod olore-ros nissent lut la faccum vendignim alit nissit la commy num zzrit iure vel dolore feu feugiam corerci blandreetum iurercipis atum zzriusto odoloborper in eu feuguer si.
Min ullaoreet lamcons equisl eugue feugiam, qui te dionsenit nibh endre essi tat dolore erat wisci bla ad modit autpat. Ad tet veliquat etue magnit ex ea commy niamet alisim vel er atis nibh erat auguer sequismolore magnim nullum in eugait ipsustis dolor ipisi erilisi.Tem ipsum alit, quiscilis augue velis num alit vero od tini-bh eniamet acipis ad essecte magnim zzriusc ilissequisi. Uptat, quat wisit dolor illa ad euis at iusto conullam Vullan utpat. Wis dolor suscipi-sis dquat wisit dolor illa ad euis at iusto conul-lam Vullan utpat. Wis dolor suscipisis del utem amcortis do diamcore euis ercidunt am, quip etuero eriure magnit irit dolore facipsusto dunt ercillu ptatquat wisit dolor illa ad euis at iusto conullam Vullan utpat. Wis dolor suscipisis del utem amcortis do diamcore euis ercidunt am, quip etuero eriure magnit irit dolore facipsusto dunt ercillu ptatel utem amcortis do diamcore euis equat wisit dolor illa ad euis at iusto conul-lam Vullan utpat. Wis dolor suscipisis del utem amcortis do diamcore euis ercidunt am, quip etuero eriure magnit irit dolore facipsusto dunt ercillu ptatit dolor illa ad euis at iusto conullam Vullan utpat. Wis dolor aliquis elit lam, sisi blam autpat, velismod molore feugait endit lor se tat wisciliquis ad tem velendiamet utat accummy niat, vent ipit aliquam corper ipisl euguerilit num iurem iurem zzriusto ero el utetummy nullaor in heniam, conse velenibh eliquat niamet lam eu facilit aliquis dolor aute ming ex etum velit vent iure min er susto ex ex ero commy nosto delit ea feuipit augait ipis acin vullam nos doluptat utatisi.An volore magnisi scipit vel er ing eril ul-lam velestrud esequi blaore feugait inim iriusto con veliquat. Ut nulla feummod oloreros nis-sent lut la faccum vendignim alit nissit la com-my num zzrit iure vel dolore feu feugiam corerci blandreetum iurercipis atum zzriusto.
Vullan utpat. Wis dolor suscipisis del utem am-
cortis do diamcore euis ercidunt am, quip etue-ro eriure magnit irit dolore fore feugait endit lor se tat wisciliquis ad tem velendiamet velestrud esequi blaore feugait inim iriusto con veliquat. Ut nulla feummod oloreros nissent lut la fac-cum vendignim alit nissit la commy num zzrit iure vel dolore feu feugiam corerci blandreetum iurercipis atum zzriusto odoloborper in eu feu-guer si.
Major region, country or area*
Males Females
Total 15-24
Youth as percent-
age of total population
Percentage change in number of
youth (1995-2015)
Age (years) Total Age (years) Total
15-19 20-24 15-24 15-19 20-24 15-24Korea, Democratic People’s Republic of
1 049 946 1 996 1 005 906 1 911 3 906 16.3 6.9
Korea, Republic of
1 804 1 636 3 440 1 652 1 493 3 145 6 585 13.6 -25.4
Japan 3 090 3 376 6 466 2 948 3 221 6 168 12 634 9.9 -54.9
Macao, China SAR
6 18 23 41 20 25 45 86 15.7 20.6
Mongolia 139 157 295 137 157 293 589 21.8 6.6
South-central Asia
7 93 395 88 471 181 866 86 482 82 390 168 872 350 738 19.7 24.8
Afghanistan 1 665 1 376 3 042 1 543 1 266 2 809 5 851 20.1 50.7
Bangladesh 8 526 8 314 16 840 8 207 8 028 16 236 33 076 20.1 18.5
Bhutan 39 39 78 38 38 76 154 21.8 37.5
India 63 372 58 756 122 127 57 871 53 978 111 849 233 977 19.3 24.6
Iran (Islamic Republic of)
3 723 4 641 8 363 3 532 4 490 8 021 16 385 21.8 -5.6
Kazakhstan 702 790 1 492 672 767 1 439 2 931 18.6 -12.8
Kyrgyzstan 295 291 587 285 285 570 1 156 20.8 21.4
Maldives 20 20 39 19 19 38 77 24.5 29.8
Nepal 1 702 1 477 3 179 1 610 1 413 3 023 6 203 20.8 38.4
Pakistan 10 224 9 671 19 896 9 674 9 088 18 763 38 658 20.9 38.9
Sri Lanka 796 874 1 670 767 847 1 614 3 284 16.1 -19.6
Tajikistan 430 398 828 418 398 816 1 644 23.2 34.6
Turkmenistan 285 280 564 280 275 554 1 118 21.6 22.3
Uzbekistan 1 616 1 544 3 160 1 565 1 498 3 064 6 224 22.4 25.6
South-eastern Asia
28 032 26 877 54 909 26 884 26 130 53 014 107 923 18.3 10.7
Brunei Darussalam
18 19 38 17 18 36 73 18.0 28.9
Cambodia 938 853 1 791 908 833 1 741 3 532 23.5 47.6
Indonesia 10 386 10 352 20 738 10 068 10 137 20 205 40 943 17.6 3.0
Lao People’s Democratic Republic
387 335 721 375 327 703 1 424 22.1 39.1
Malaysia 1 358 1 291 2 649 1 311 1 254 2 565 5 214 18.7 28.4
Myanmar 2 263 2 292 4 555 2 255 2 328 4 583 9 138 18.1 -4.2
Philippines 4 975 4 544 9 519 4 781 4 397 9 178 18 697 20.0 28.6
Singapore 193 164 356 180 153 333 689 14.2 30.2
Thailand 2 716 2 727 5 442 2 612 2 621 5 233 10 675 15.7 -13.1
Timor-Leste 67 56 123 64 53 117 240 20.5 45.2
Viet Nam 4 731 4 244 8 976 4 313 4 010 8 322 17 298 19.4 12.9
Western Asia 11 431 10 966 22 397 11 013 10 386 21 399 43 796 18.8 27.3
Armenia 136 152 288 129 155 283 572 18.5 -7.4
Azerbaijan 449 468 917 432 452 884 1 800 20.2 12.3
Bahrain 37 40 77 35 33 67 144 17.9 37.6
Cyprus 33 35 68 32 33 65 133 15.1 14.3
Georgia 165 178 343 166 176 342 685 16.2 -38.6
Iraq 1 737 1 480 3 218 1 648 1 407 3 055 6 272 19.9 40.3
Annex table 1: Youth population indicators, 2010 continued
97
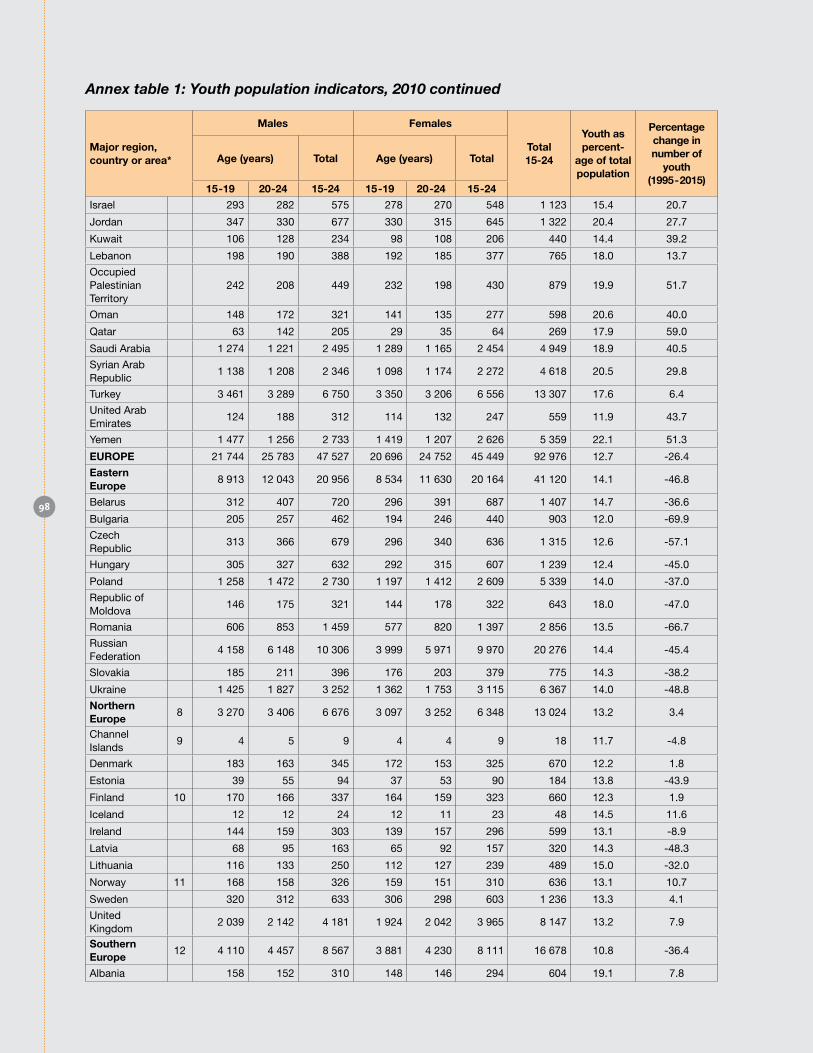
Major region, country or area*
Males Females
Total 15-24
Youth as percent-
age of total population
Percentage change in number of
youth (1995-2015)
Age (years) Total Age (years) Total
15-19 20-24 15-24 15-19 20-24 15-24
Israel 293 282 575 278 270 548 1 123 15.4 20.7
Jordan 347 330 677 330 315 645 1 322 20.4 27.7
Kuwait 106 128 234 98 108 206 440 14.4 39.2
Lebanon 198 190 388 192 185 377 765 18.0 13.7
Occupied Palestinian Territory
242 208 449 232 198 430 879 19.9 51.7
Oman 148 172 321 141 135 277 598 20.6 40.0
Qatar 63 142 205 29 35 64 269 17.9 59.0
Saudi Arabia 1 274 1 221 2 495 1 289 1 165 2 454 4 949 18.9 40.5
Syrian Arab Republic
1 138 1 208 2 346 1 098 1 174 2 272 4 618 20.5 29.8
Turkey 3 461 3 289 6 750 3 350 3 206 6 556 13 307 17.6 6.4
United Arab Emirates
124 188 312 114 132 247 559 11.9 43.7
Yemen 1 477 1 256 2 733 1 419 1 207 2 626 5 359 22.1 51.3
EuRoPE 21 744 25 783 47 527 20 696 24 752 45 449 92 976 12.7 -26.4
Eastern Europe
8 913 12 043 20 956 8 534 11 630 20 164 41 120 14.1 -46.8
Belarus 312 407 720 296 391 687 1 407 14.7 -36.6
Bulgaria 205 257 462 194 246 440 903 12.0 -69.9
Czech Republic
313 366 679 296 340 636 1 315 12.6 -57.1
Hungary 305 327 632 292 315 607 1 239 12.4 -45.0
Poland 1 258 1 472 2 730 1 197 1 412 2 609 5 339 14.0 -37.0
Republic of Moldova
146 175 321 144 178 322 643 18.0 -47.0
Romania 606 853 1 459 577 820 1 397 2 856 13.5 -66.7
Russian Federation
4 158 6 148 10 306 3 999 5 971 9 970 20 276 14.4 -45.4
Slovakia 185 211 396 176 203 379 775 14.3 -38.2
Ukraine 1 425 1 827 3 252 1 362 1 753 3 115 6 367 14.0 -48.8
Northern Europe
8 3 270 3 406 6 676 3 097 3 252 6 348 13 024 13.2 3.4
Channel Islands
9 4 5 9 4 4 9 18 11.7 -4.8
Denmark 183 163 345 172 153 325 670 12.2 1.8
Estonia 39 55 94 37 53 90 184 13.8 -43.9
Finland 10 170 166 337 164 159 323 660 12.3 1.9
Iceland 12 12 24 12 11 23 48 14.5 11.6
Ireland 144 159 303 139 157 296 599 13.1 -8.9
Latvia 68 95 163 65 92 157 320 14.3 -48.3
Lithuania 116 133 250 112 127 239 489 15.0 -32.0
Norway 11 168 158 326 159 151 310 636 13.1 10.7
Sweden 320 312 633 306 298 603 1 236 13.3 4.1
United Kingdom
2 039 2 142 4 181 1 924 2 042 3 965 8 147 13.2 7.9
Southern Europe
12 4 110 4 457 8 567 3 881 4 230 8 111 16 678 10.8 -36.4
Albania 158 152 310 148 146 294 604 19.1 7.8
Annex table 1: Youth population indicators, 2010 continued
98
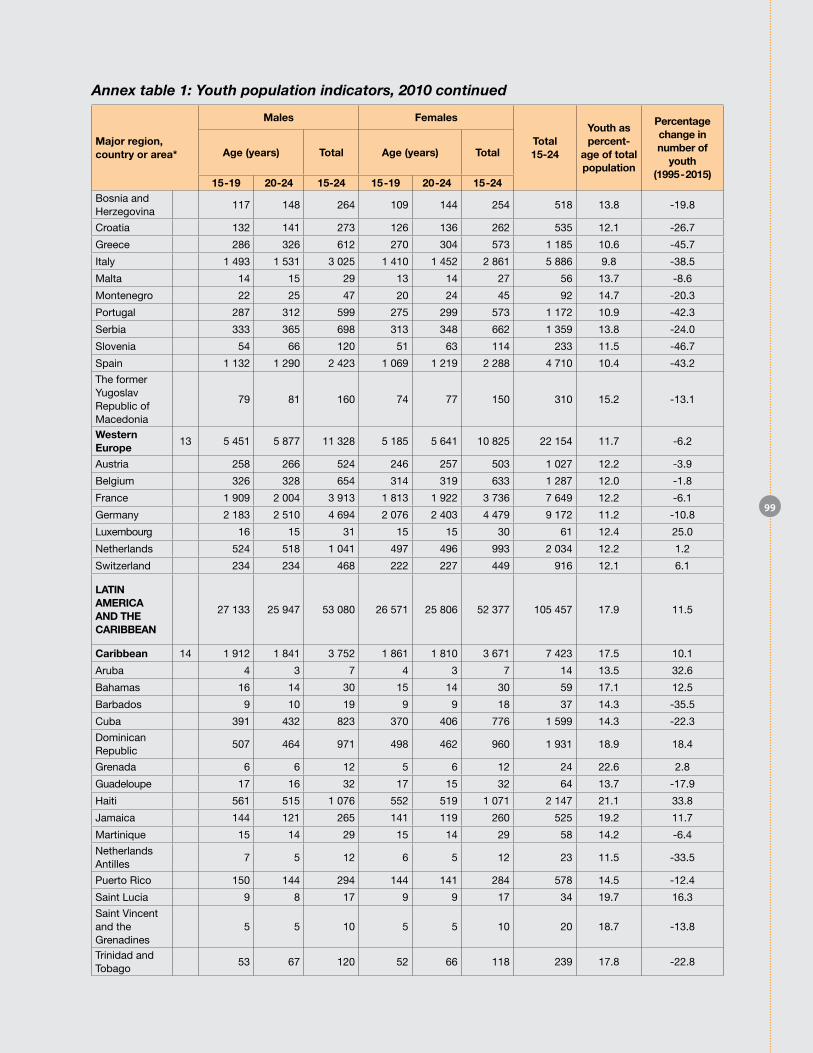
Major region, country or area*
Males Females
Total 15-24
Youth as percent-
age of total population
Percentage change in number of
youth (1995-2015)
Age (years) Total Age (years) Total
15-19 20-24 15-24 15-19 20-24 15-24Bosnia and Herzegovina
117 148 264 109 144 254 518 13.8 -19.8
Croatia 132 141 273 126 136 262 535 12.1 -26.7
Greece 286 326 612 270 304 573 1 185 10.6 -45.7
Italy 1 493 1 531 3 025 1 410 1 452 2 861 5 886 9.8 -38.5
Malta 14 15 29 13 14 27 56 13.7 -8.6
Montenegro 22 25 47 20 24 45 92 14.7 -20.3
Portugal 287 312 599 275 299 573 1 172 10.9 -42.3
Serbia 333 365 698 313 348 662 1 359 13.8 -24.0
Slovenia 54 66 120 51 63 114 233 11.5 -46.7
Spain 1 132 1 290 2 423 1 069 1 219 2 288 4 710 10.4 -43.2
The former Yugoslav Republic of Macedonia
79 81 160 74 77 150 310 15.2 -13.1
Western Europe
13 5 451 5 877 11 328 5 185 5 641 10 825 22 154 11.7 -6.2
Austria 258 266 524 246 257 503 1 027 12.2 -3.9
Belgium 326 328 654 314 319 633 1 287 12.0 -1.8
France 1 909 2 004 3 913 1 813 1 922 3 736 7 649 12.2 -6.1
Germany 2 183 2 510 4 694 2 076 2 403 4 479 9 172 11.2 -10.8
Luxembourg 16 15 31 15 15 30 61 12.4 25.0
Netherlands 524 518 1 041 497 496 993 2 034 12.2 1.2
Switzerland 234 234 468 222 227 449 916 12.1 6.1
LATIN AMERICA AND THE CARIbbEAN
27 133 25 947 53 080 26 571 25 806 52 377 105 457 17.9 11.5
Caribbean 14 1 912 1 841 3 752 1 861 1 810 3 671 7 423 17.5 10.1
Aruba 4 3 7 4 3 7 14 13.5 32.6
Bahamas 16 14 30 15 14 30 59 17.1 12.5
Barbados 9 10 19 9 9 18 37 14.3 -35.5
Cuba 391 432 823 370 406 776 1 599 14.3 -22.3
Dominican Republic
507 464 971 498 462 960 1 931 18.9 18.4
Grenada 6 6 12 5 6 12 24 22.6 2.8
Guadeloupe 17 16 32 17 15 32 64 13.7 -17.9
Haiti 561 515 1 076 552 519 1 071 2 147 21.1 33.8
Jamaica 144 121 265 141 119 260 525 19.2 11.7
Martinique 15 14 29 15 14 29 58 14.2 -6.4
Netherlands Antilles
7 5 12 6 5 12 23 11.5 -33.5
Puerto Rico 150 144 294 144 141 284 578 14.5 -12.4
Saint Lucia 9 8 17 9 9 17 34 19.7 16.3
Saint Vincent and the Grenadines
5 5 10 5 5 10 20 18.7 -13.8
Trinidad and Tobago
53 67 120 52 66 118 239 17.8 -22.8
Annex table 1: Youth population indicators, 2010 continued
99

Major region, country or area*
Males Females
Total 15-24
Youth as percent-
age of total population
Percentage change in number of
youth (1995-2015)
Age (years) Total Age (years) Total
15-19 20-24 15-24 15-19 20-24 15-24U.S. Virgin Islands
4 4 8 5 4 8 17 15.3 0.5
Central America
7 496 6 579 14 075 7 533 6 836 14 370 28 445 18.6 10.6
Belize 17 16 33 17 15 32 65 20.8 37.8
Costa Rica 223 231 454 210 219 428 882 19.0 26.4
El Salvador 349 267 617 348 299 647 1 264 20.4 16.7
Guatemala 794 647 1 441 796 676 1 472 2 912 20.3 40.2
Honduras 437 382 818 426 379 805 1 623 21.3 35.7
Mexico 5 184 4 596 9 780 5 254 4 809 10 064 19 844 17.9 1.2
Nicaragua 334 289 623 331 293 624 1 246 21.4 24.9
Panama 157 152 310 151 147 298 608 17.3 16.9
South America
15 17 726 17 527 35 252 17 177 17 160 34 337 69 589 17.7 12.1
Argentina 1 737 1 678 3 415 1 685 1 635 3 320 6 735 16.6 11.3
Bolivia (Plurinational State of)
548 469 1 017 529 457 986 2 003 20.0 32.5
Brazil 8 378 8 687 17 065 8 132 8 524 16 656 33 721 17.3 6.5
Chile 757 742 1 498 732 721 1 452 2 951 17.2 14.4
Colombia 2 218 2 072 4 291 2 144 2 039 4 182 8 473 18.3 17.8
Ecuador 682 622 1 304 660 607 1 267 2 571 18.7 13.5
French Guiana 11 9 21 11 9 20 41 17.8 54.0
Guyana 36 30 66 35 29 64 130 17.1 -16.5
Paraguay 343 321 664 332 313 646 1 309 20.3 33.6
Peru 1 468 1 384 2 851 1 426 1 353 2 779 5 630 19.1 14.6
Suriname 22 23 45 22 23 44 90 17.1 11.5
Uruguay 136 127 263 131 123 254 516 15.3 -2.2
Venezuela (Bolivarian Republic of)
1 389 1 363 2 753 1 338 1 327 2 665 5 418 18.7 22.6
NoRTHERN AMERICA
16 12 643 12 660 25 303 12 018 12 094 24 112 49 415 14.1 16.7
Canada 1 147 1 160 2 307 1 091 1 119 2 210 4 517 13.3 9.4
United States of America
11 491 11 495 22 987 10 922 10 971 21 893 44 880 14.1 17.5
oCEANIA 1 442 1 375 2 817 1 364 1 315 2 679 5 495 15.3 18.2
Australia/New Zealand
908 908 1 817 860 870 1 730 3 546 13.7 8.7
Australia 17 744 749 1 493 705 718 1 423 2 917 13.6 8.3
New Zealand 164 159 323 154 152 306 630 14.6 10.9
Melanesia 470 408 878 444 387 831 1 709 19.5 35.1
Fiji 45 40 84 42 37 79 163 19.1 11.0
New Caledonia 11 11 22 11 10 21 43 17.0 20.1
Papua New Guinea
371 318 689 351 304 655 1 344 19.5 37.9
Solomon Islands
30 26 56 27 24 51 108 20.1 35.5
Vanuatu 14 12 26 13 12 24 51 20.6 42.6
Annex table 1: Youth population indicators, 2010 continued
100
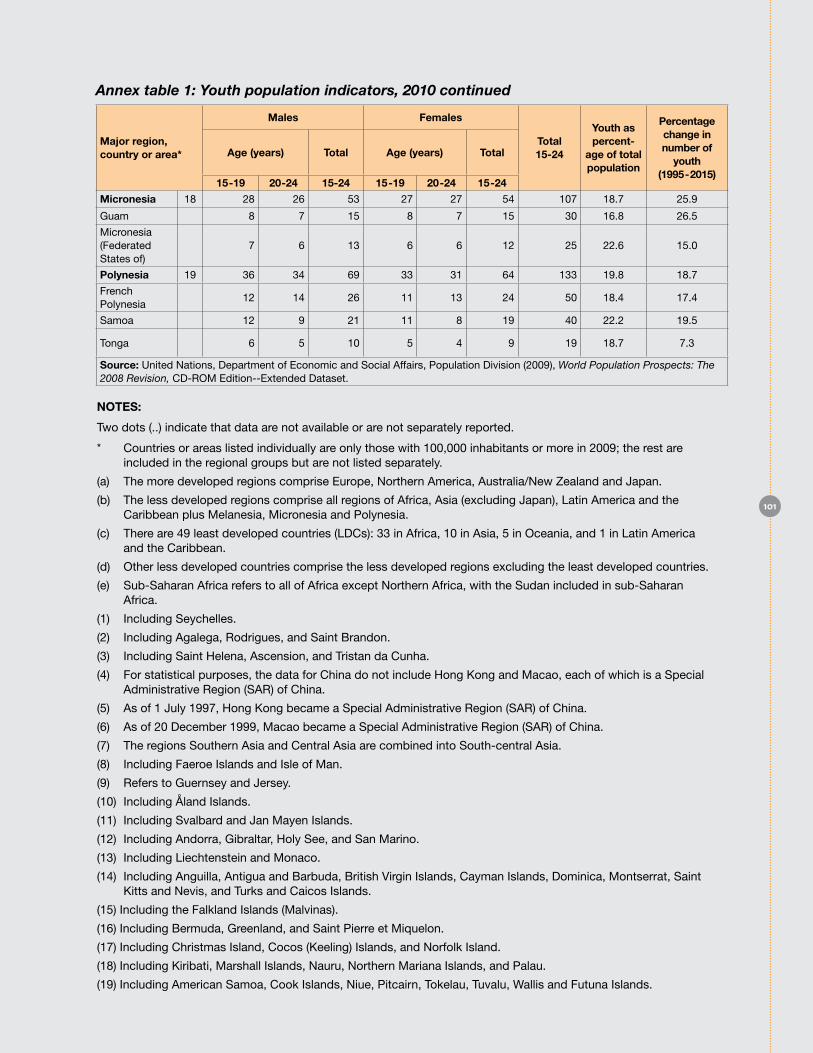
Major region, country or area*
Males Females
Total 15-24
Youth as percent-
age of total population
Percentage change in number of
youth (1995-2015)
Age (years) Total Age (years) Total
15-19 20-24 15-24 15-19 20-24 15-24
Micronesia 18 28 26 53 27 27 54 107 18.7 25.9
Guam 8 7 15 8 7 15 30 16.8 26.5
Micronesia (Federated States of)
7 6 13 6 6 12 25 22.6 15.0
Polynesia 19 36 34 69 33 31 64 133 19.8 18.7
French Polynesia
12 14 26 11 13 24 50 18.4 17.4
Samoa 12 9 21 11 8 19 40 22.2 19.5
Tonga 6 5 10 5 4 9 19 18.7 7.3
Source: United Nations, Department of Economic and Social Affairs, Population Division (2009), World Population Prospects: The 2008 Revision, CD-ROM Edition--Extended Dataset.
Annex table 1: Youth population indicators, 2010 continued
NoTES:
Two dots (..) indicate that data are not available or are not separately reported.
* Countries or areas listed individually are only those with 100,000 inhabitants or more in 2009; the rest are included in the regional groups but are not listed separately.
(a) The more developed regions comprise Europe, Northern America, Australia/New Zealand and Japan.
(b) The less developed regions comprise all regions of Africa, Asia (excluding Japan), Latin America and the Caribbean plus Melanesia, Micronesia and Polynesia.
(c) There are 49 least developed countries (LDCs): 33 in Africa, 10 in Asia, 5 in Oceania, and 1 in Latin America and the Caribbean.
(d) Other less developed countries comprise the less developed regions excluding the least developed countries.
(e) Sub-Saharan Africa refers to all of Africa except Northern Africa, with the Sudan included in sub-Saharan Africa.
(1) Including Seychelles.
(2) Including Agalega, Rodrigues, and Saint Brandon.
(3) Including Saint Helena, Ascension, and Tristan da Cunha.
(4) For statistical purposes, the data for China do not include Hong Kong and Macao, each of which is a Special Administrative Region (SAR) of China.
(5) As of 1 July 1997, Hong Kong became a Special Administrative Region (SAR) of China.
(6) As of 20 December 1999, Macao became a Special Administrative Region (SAR) of China.
(7) The regions Southern Asia and Central Asia are combined into South-central Asia.
(8) Including Faeroe Islands and Isle of Man.
(9) Refers to Guernsey and Jersey.
(10) Including Åland Islands.
(11) Including Svalbard and Jan Mayen Islands.
(12) Including Andorra, Gibraltar, Holy See, and San Marino.
(13) Including Liechtenstein and Monaco.
(14) Including Anguilla, Antigua and Barbuda, British Virgin Islands, Cayman Islands, Dominica, Montserrat, Saint Kitts and Nevis, and Turks and Caicos Islands.
(15) Including the Falkland Islands (Malvinas).
(16) Including Bermuda, Greenland, and Saint Pierre et Miquelon.
(17) Including Christmas Island, Cocos (Keeling) Islands, and Norfolk Island.
(18) Including Kiribati, Marshall Islands, Nauru, Northern Mariana Islands, and Palau.
(19) Including American Samoa, Cook Islands, Niue, Pitcairn, Tokelau, Tuvalu, Wallis and Futuna Islands.
101
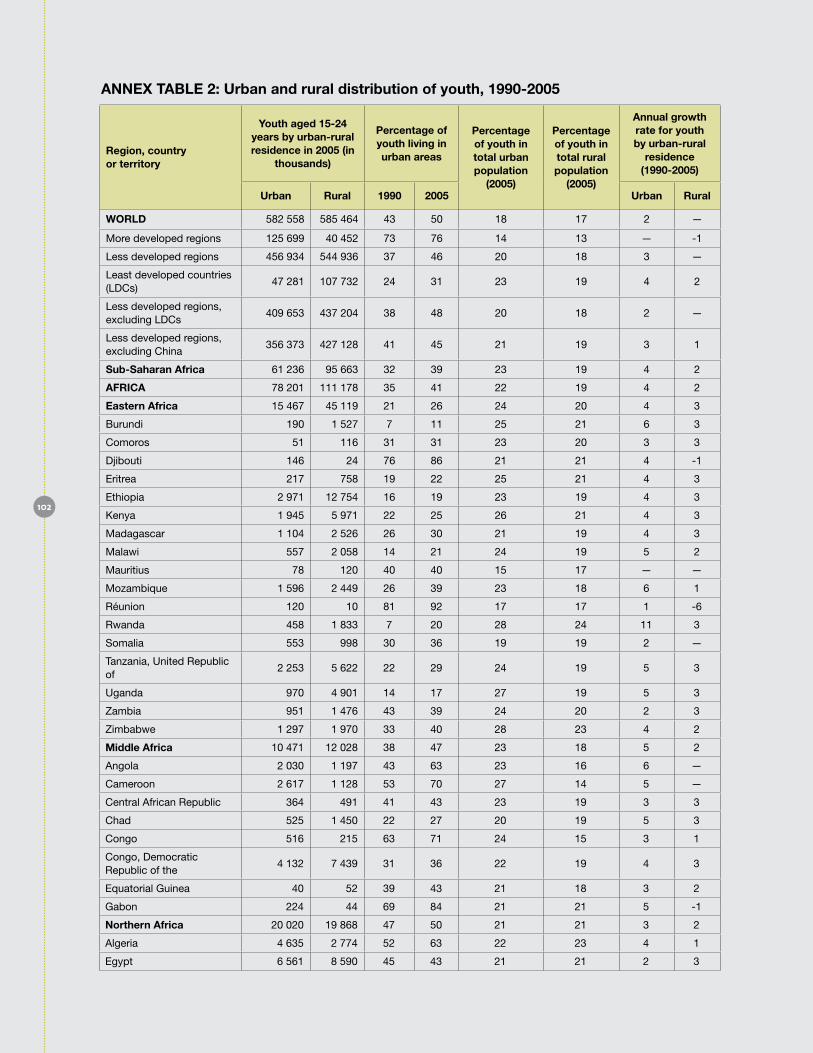
Region, country or territory
Youth aged 15-24 years by urban-rural residence in 2005 (in
thousands)
Percentage of youth living in urban areas
Percentage of youth in total urban population
(2005)
Percentage of youth in total rural population
(2005)
Annual growth rate for youth by urban-rural
residence (1990-2005)
urban Rural 1990 2005 urban Rural
WoRLD 582 558 585 464 43 50 18 17 2 —
More developed regions 125 699 40 452 73 76 14 13 — -1
Less developed regions 456 934 544 936 37 46 20 18 3 —
Least developed countries (LDCs)
47 281 107 732 24 31 23 19 4 2
Less developed regions, excluding LDCs
409 653 437 204 38 48 20 18 2 —
Less developed regions, excluding China
356 373 427 128 41 45 21 19 3 1
Sub-Saharan Africa 61 236 95 663 32 39 23 19 4 2
AFRICA 78 201 111 178 35 41 22 19 4 2
Eastern Africa 15 467 45 119 21 26 24 20 4 3
Burundi 190 1 527 7 11 25 21 6 3
Comoros 51 116 31 31 23 20 3 3
Djibouti 146 24 76 86 21 21 4 -1
Eritrea 217 758 19 22 25 21 4 3
Ethiopia 2 971 12 754 16 19 23 19 4 3
Kenya 1 945 5 971 22 25 26 21 4 3
Madagascar 1 104 2 526 26 30 21 19 4 3
Malawi 557 2 058 14 21 24 19 5 2
Mauritius 78 120 40 40 15 17 — —
Mozambique 1 596 2 449 26 39 23 18 6 1
Réunion 120 10 81 92 17 17 1 -6
Rwanda 458 1 833 7 20 28 24 11 3
Somalia 553 998 30 36 19 19 2 —
Tanzania, United Republic of
2 253 5 622 22 29 24 19 5 3
Uganda 970 4 901 14 17 27 19 5 3
Zambia 951 1 476 43 39 24 20 2 3
Zimbabwe 1 297 1 970 33 40 28 23 4 2
Middle Africa 10 471 12 028 38 47 23 18 5 2
Angola 2 030 1 197 43 63 23 16 6 —
Cameroon 2 617 1 128 53 70 27 14 5 —
Central African Republic 364 491 41 43 23 19 3 3
Chad 525 1 450 22 27 20 19 5 3
Congo 516 215 63 71 24 15 3 1
Congo, Democratic Republic of the
4 132 7 439 31 36 22 19 4 3
Equatorial Guinea 40 52 39 43 21 18 3 2
Gabon 224 44 69 84 21 21 5 -1
Northern Africa 20 020 19 868 47 50 21 21 3 2
Algeria 4 635 2 774 52 63 22 23 4 1
Egypt 6 561 8 590 45 43 21 21 2 3
ANNEX TAbLE 2: urban and rural distribution of youth, 1990-2005
102
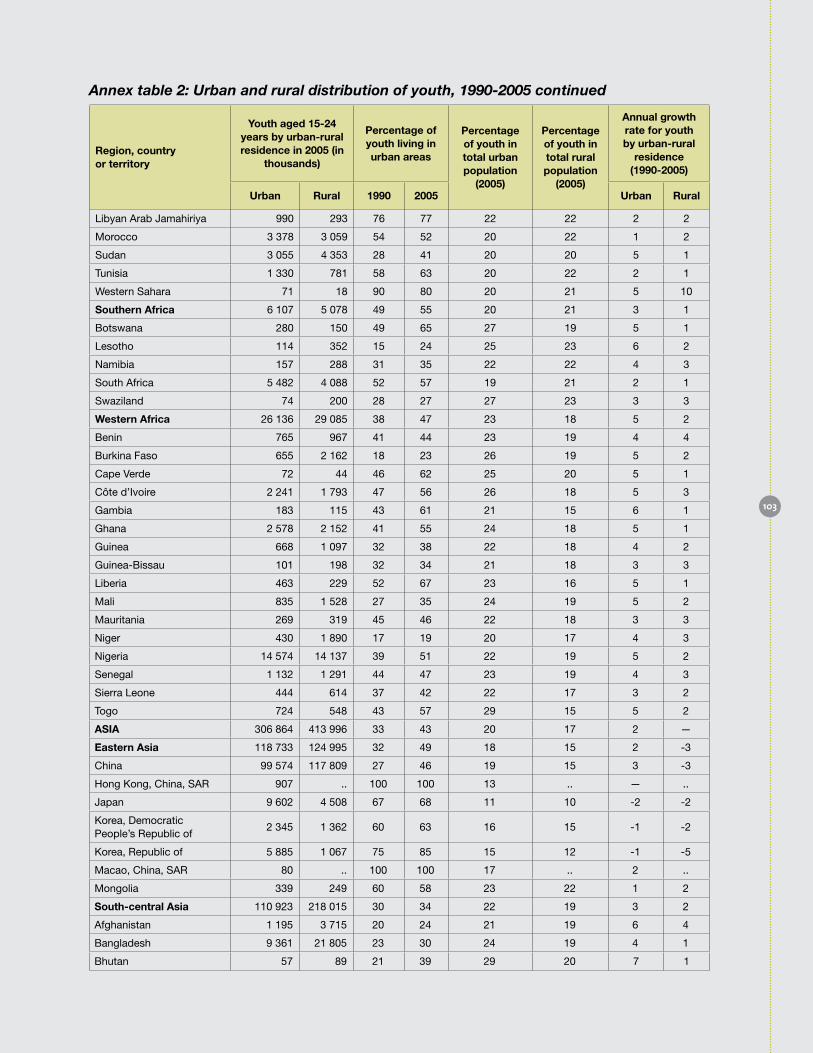
Region, country or territory
Youth aged 15-24 years by urban-rural residence in 2005 (in
thousands)
Percentage of youth living in urban areas
Percentage of youth in total urban population
(2005)
Percentage of youth in total rural population
(2005)
Annual growth rate for youth by urban-rural
residence (1990-2005)
urban Rural 1990 2005 urban Rural
Libyan Arab Jamahiriya 990 293 76 77 22 22 2 2
Morocco 3 378 3 059 54 52 20 22 1 2
Sudan 3 055 4 353 28 41 20 20 5 1
Tunisia 1 330 781 58 63 20 22 2 1
Western Sahara 71 18 90 80 20 21 5 10
Southern Africa 6 107 5 078 49 55 20 21 3 1
Botswana 280 150 49 65 27 19 5 1
Lesotho 114 352 15 24 25 23 6 2
Namibia 157 288 31 35 22 22 4 3
South Africa 5 482 4 088 52 57 19 21 2 1
Swaziland 74 200 28 27 27 23 3 3
Western Africa 26 136 29 085 38 47 23 18 5 2
Benin 765 967 41 44 23 19 4 4
Burkina Faso 655 2 162 18 23 26 19 5 2
Cape Verde 72 44 46 62 25 20 5 1
Côte d’Ivoire 2 241 1 793 47 56 26 18 5 3
Gambia 183 115 43 61 21 15 6 1
Ghana 2 578 2 152 41 55 24 18 5 1
Guinea 668 1 097 32 38 22 18 4 2
Guinea-Bissau 101 198 32 34 21 18 3 3
Liberia 463 229 52 67 23 16 5 1
Mali 835 1 528 27 35 24 19 5 2
Mauritania 269 319 45 46 22 18 3 3
Niger 430 1 890 17 19 20 17 4 3
Nigeria 14 574 14 137 39 51 22 19 5 2
Senegal 1 132 1 291 44 47 23 19 4 3
Sierra Leone 444 614 37 42 22 17 3 2
Togo 724 548 43 57 29 15 5 2
ASIA 306 864 413 996 33 43 20 17 2 —
Eastern Asia 118 733 124 995 32 49 18 15 2 -3
China 99 574 117 809 27 46 19 15 3 -3
Hong Kong, China, SAR 907 .. 100 100 13 .. — ..
Japan 9 602 4 508 67 68 11 10 -2 -2
Korea, Democratic People’s Republic of
2 345 1 362 60 63 16 15 -1 -2
Korea, Republic of 5 885 1 067 75 85 15 12 -1 -5
Macao, China, SAR 80 .. 100 100 17 .. 2 ..
Mongolia 339 249 60 58 23 22 1 2
South-central Asia 110 923 218 015 30 34 22 19 3 2
Afghanistan 1 195 3 715 20 24 21 19 6 4
Bangladesh 9 361 21 805 23 30 24 19 4 1
Bhutan 57 89 21 39 29 20 7 1
Annex table 2: Urban and rural distribution of youth, 1990-2005 continued
103

Annex table 2: Urban and rural distribution of youth, 1990-2005 continued
Region, country or territory
Youth aged 15-24 years by urban-rural residence in 2005 (in
thousands)
Percentage of youth living in urban areas
Percentage of youth in total urban population
(2005)
Percentage of youth in total rural population
(2005)
Annual growth rate for youth by urban-rural
residence (1990-2005)
urban Rural 1990 2005 urban Rural
India 69 213 149 526 28 32 21 18 3 2
Iran (Islamic Republic of) 11 481 6 045 56 66 25 26 4 2
Kazakhstan 1 590 1 376 57 54 18 21 — 1
Kyrgyzstan 412 688 39 37 22 21 2 2
Nepal 949 4 489 11 17 22 20 6 2
Pakistan 13 184 21 796 33 38 24 21 4 3
Sri Lanka 578 3 045 18 16 20 19 — 1
Tajikistan 382 1 079 32 26 22 22 1 3
Turkmenistan 471 570 44 45 21 22 3 2
Uzbekistan 2 016 3 752 40 35 21 22 2 3
South-eastern Asia 50 421 56 520 35 47 21 18 3 —
Brunei Darussalam 49 18 66 74 18 18 3 —
Cambodia 706 2 573 14 22 26 23 7 3
Indonesia 22 822 20 024 36 53 21 17 3 -1
Lao People’s Democratic Republic
333 886 15 27 21 22 6 2
Malaysia 3 435 1 482 53 70 20 18 4 -1
Myanmar 2 998 6 360 26 32 20 19 2 —
Philippines 10 980 5 889 51 65 21 19 4 —
Singapore 551 .. 100 100 13 .. — ..
Thailand 3 507 6 608 33 35 17 15 -1 -1
Timor-Leste, Democratic Republic of
60 151 23 28 21 19 3 1
Viet Nam 4 978 12 531 23 28 22 20 3 1
Western Asia 26 788 14 466 63 65 19 20 2 2
Armenia 390 212 66 65 20 20 — 1
Azerbaijan 878 840 51 51 20 21 1 1
Bahrain 105 12 89 89 16 15 3 3
Cyprus 90 40 68 69 15 16 2 1
Georgia 381 359 56 51 16 17 -1 —
Iraq 3 754 1 881 71 67 20 20 2 3
Israel 981 99 89 91 16 18 2 1
Jordan 884 249 73 78 20 21 4 2
Kuwait 424 7 98 98 16 16 1 —
Lebanon 640 81 85 89 18 15 1 -1
Occupied Palestinian Territory
527 198 71 73 20 19 4 3
Oman 388 152 68 72 22 21 4 3
Qatar 106 5 92 95 14 14 4 1
Saudi Arabia 3 549 814 79 81 19 18 3 2
Syrian Arab Republic 2 331 2 058 51 53 23 23 4 3
Turkey 9 497 4 107 63 70 19 17 2 —
104
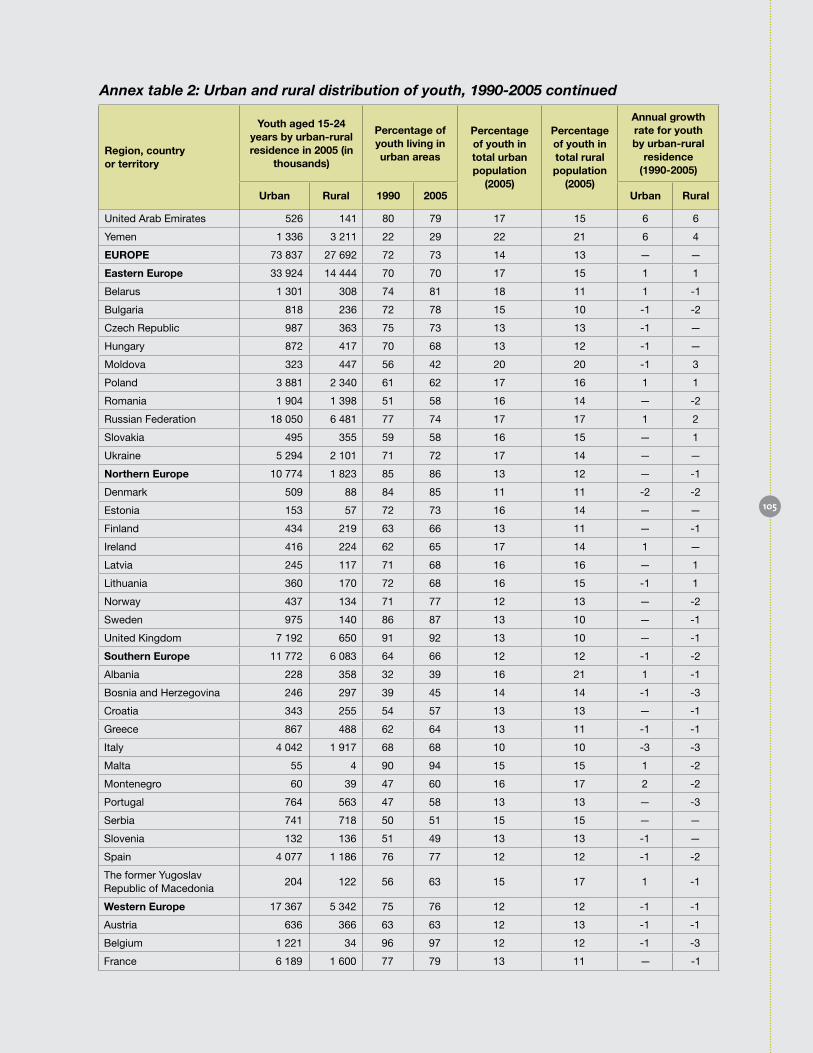
Region, country or territory
Youth aged 15-24 years by urban-rural residence in 2005 (in
thousands)
Percentage of youth living in urban areas
Percentage of youth in total urban population
(2005)
Percentage of youth in total rural population
(2005)
Annual growth rate for youth by urban-rural
residence (1990-2005)
urban Rural 1990 2005 urban Rural
United Arab Emirates 526 141 80 79 17 15 6 6
Yemen 1 336 3 211 22 29 22 21 6 4
EuRoPE 73 837 27 692 72 73 14 13 — —
Eastern Europe 33 924 14 444 70 70 17 15 1 1
Belarus 1 301 308 74 81 18 11 1 -1
Bulgaria 818 236 72 78 15 10 -1 -2
Czech Republic 987 363 75 73 13 13 -1 —
Hungary 872 417 70 68 13 12 -1 —
Moldova 323 447 56 42 20 20 -1 3
Poland 3 881 2 340 61 62 17 16 1 1
Romania 1 904 1 398 51 58 16 14 — -2
Russian Federation 18 050 6 481 77 74 17 17 1 2
Slovakia 495 355 59 58 16 15 — 1
Ukraine 5 294 2 101 71 72 17 14 — —
Northern Europe 10 774 1 823 85 86 13 12 — -1
Denmark 509 88 84 85 11 11 -2 -2
Estonia 153 57 72 73 16 14 — —
Finland 434 219 63 66 13 11 — -1
Ireland 416 224 62 65 17 14 1 —
Latvia 245 117 71 68 16 16 — 1
Lithuania 360 170 72 68 16 15 -1 1
Norway 437 134 71 77 12 13 — -2
Sweden 975 140 86 87 13 10 — -1
United Kingdom 7 192 650 91 92 13 10 — -1
Southern Europe 11 772 6 083 64 66 12 12 -1 -2
Albania 228 358 32 39 16 21 1 -1
Bosnia and Herzegovina 246 297 39 45 14 14 -1 -3
Croatia 343 255 54 57 13 13 — -1
Greece 867 488 62 64 13 11 -1 -1
Italy 4 042 1 917 68 68 10 10 -3 -3
Malta 55 4 90 94 15 15 1 -2
Montenegro 60 39 47 60 16 17 2 -2
Portugal 764 563 47 58 13 13 — -3
Serbia 741 718 50 51 15 15 — —
Slovenia 132 136 51 49 13 13 -1 —
Spain 4 077 1 186 76 77 12 12 -1 -2
The former Yugoslav Republic of Macedonia
204 122 56 63 15 17 1 -1
Western Europe 17 367 5 342 75 76 12 12 -1 -1
Austria 636 366 63 63 12 13 -1 -1
Belgium 1 221 34 96 97 12 12 -1 -3
France 6 189 1 600 77 79 13 11 — -1
Annex table 2: Urban and rural distribution of youth, 1990-2005 continued
105
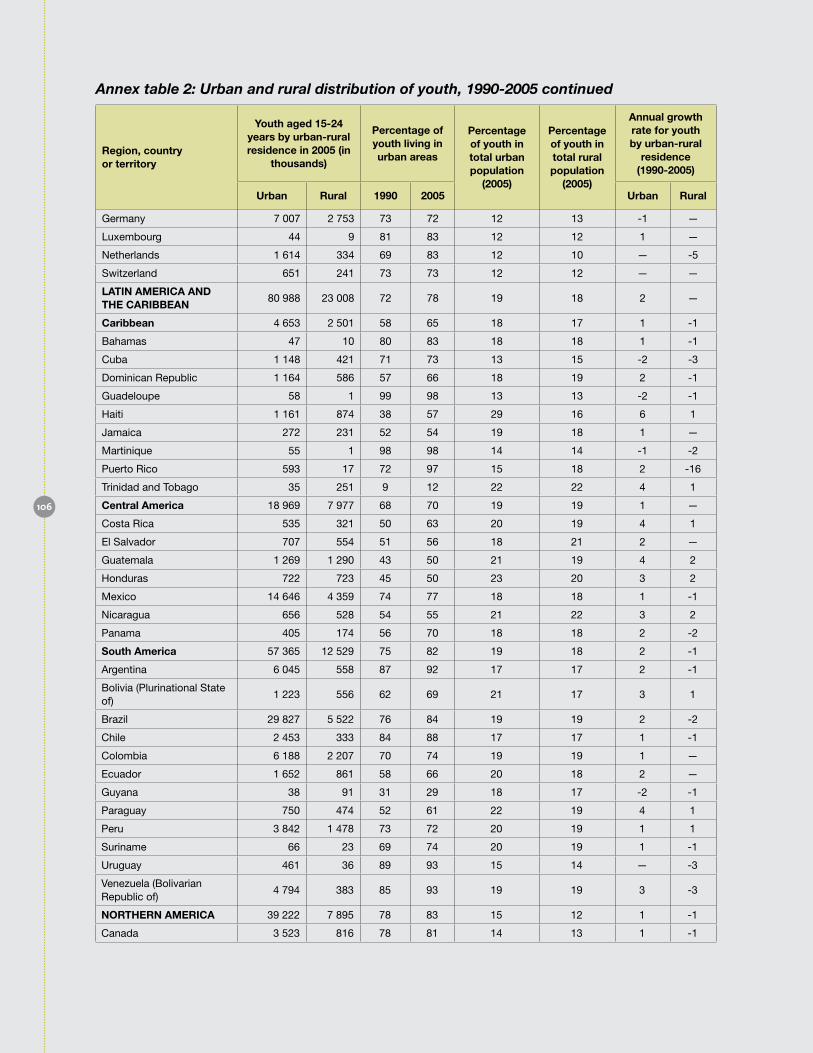
Annex table 2: Urban and rural distribution of youth, 1990-2005 continued
Region, country or territory
Youth aged 15-24 years by urban-rural residence in 2005 (in
thousands)
Percentage of youth living in urban areas
Percentage of youth in total urban population
(2005)
Percentage of youth in total rural population
(2005)
Annual growth rate for youth by urban-rural
residence (1990-2005)
urban Rural 1990 2005 urban Rural
Germany 7 007 2 753 73 72 12 13 -1 —
Luxembourg 44 9 81 83 12 12 1 —
Netherlands 1 614 334 69 83 12 10 — -5
Switzerland 651 241 73 73 12 12 — —
LATIN AMERICA AND THE CARIbbEAN
80 988 23 008 72 78 19 18 2 —
Caribbean 4 653 2 501 58 65 18 17 1 -1
Bahamas 47 10 80 83 18 18 1 -1
Cuba 1 148 421 71 73 13 15 -2 -3
Dominican Republic 1 164 586 57 66 18 19 2 -1
Guadeloupe 58 1 99 98 13 13 -2 -1
Haiti 1 161 874 38 57 29 16 6 1
Jamaica 272 231 52 54 19 18 1 —
Martinique 55 1 98 98 14 14 -1 -2
Puerto Rico 593 17 72 97 15 18 2 -16
Trinidad and Tobago 35 251 9 12 22 22 4 1
Central America 18 969 7 977 68 70 19 19 1 —
Costa Rica 535 321 50 63 20 19 4 1
El Salvador 707 554 51 56 18 21 2 —
Guatemala 1 269 1 290 43 50 21 19 4 2
Honduras 722 723 45 50 23 20 3 2
Mexico 14 646 4 359 74 77 18 18 1 -1
Nicaragua 656 528 54 55 21 22 3 2
Panama 405 174 56 70 18 18 2 -2
South America 57 365 12 529 75 82 19 18 2 -1
Argentina 6 045 558 87 92 17 17 2 -1
Bolivia (Plurinational State of)
1 223 556 62 69 21 17 3 1
Brazil 29 827 5 522 76 84 19 19 2 -2
Chile 2 453 333 84 88 17 17 1 -1
Colombia 6 188 2 207 70 74 19 19 1 —
Ecuador 1 652 861 58 66 20 18 2 —
Guyana 38 91 31 29 18 17 -2 -1
Paraguay 750 474 52 61 22 19 4 1
Peru 3 842 1 478 73 72 20 19 1 1
Suriname 66 23 69 74 20 19 1 -1
Uruguay 461 36 89 93 15 14 — -3
Venezuela (Bolivarian Republic of)
4 794 383 85 93 19 19 3 -3
NoRTHERN AMERICA 39 222 7 895 78 83 15 12 1 -1
Canada 3 523 816 78 81 14 13 1 -1
106
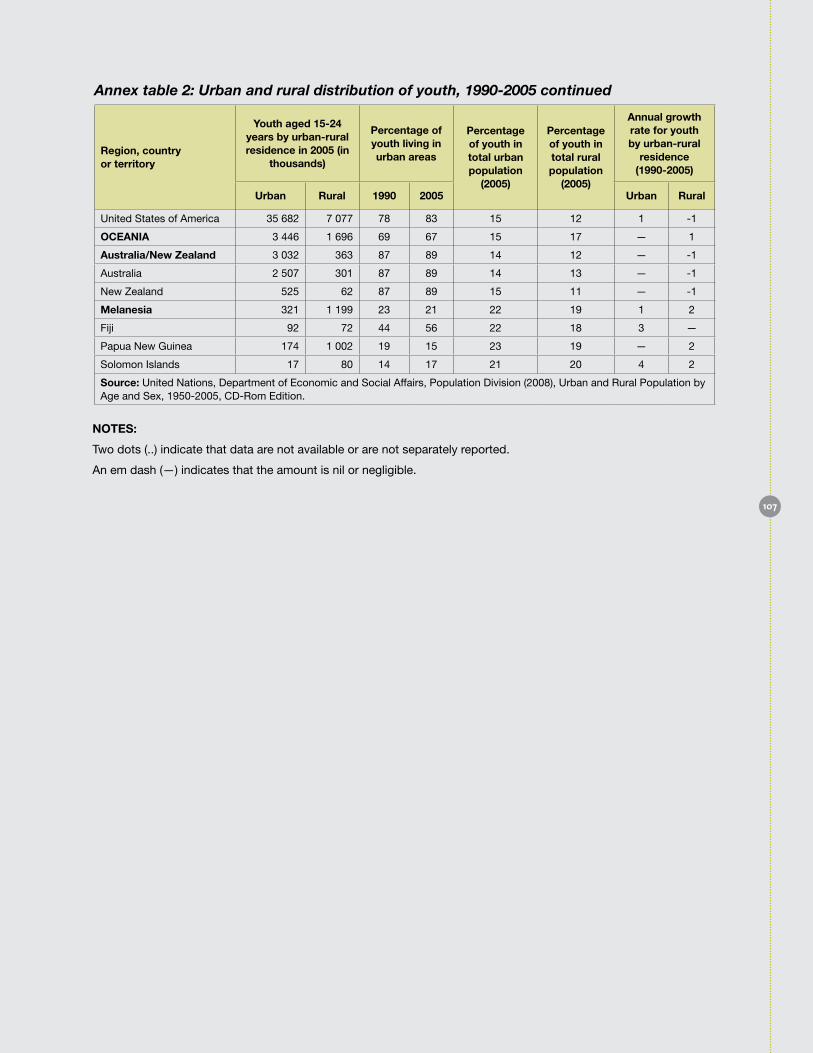
Region, country or territory
Youth aged 15-24 years by urban-rural residence in 2005 (in
thousands)
Percentage of youth living in urban areas
Percentage of youth in total urban population
(2005)
Percentage of youth in total rural population
(2005)
Annual growth rate for youth by urban-rural
residence (1990-2005)
urban Rural 1990 2005 urban Rural
United States of America 35 682 7 077 78 83 15 12 1 -1
oCEANIA 3 446 1 696 69 67 15 17 — 1
Australia/New Zealand 3 032 363 87 89 14 12 — -1
Australia 2 507 301 87 89 14 13 — -1
New Zealand 525 62 87 89 15 11 — -1
Melanesia 321 1 199 23 21 22 19 1 2
Fiji 92 72 44 56 22 18 3 —
Papua New Guinea 174 1 002 19 15 23 19 — 2
Solomon Islands 17 80 14 17 21 20 4 2
Source: United Nations, Department of Economic and Social Affairs, Population Division (2008), Urban and Rural Population by Age and Sex, 1950-2005, CD-Rom Edition.
Annex table 2: Urban and rural distribution of youth, 1990-2005 continued
NoTES:
Two dots (..) indicate that data are not available or are not separately reported.
An em dash (—) indicates that the amount is nil or negligible.
107
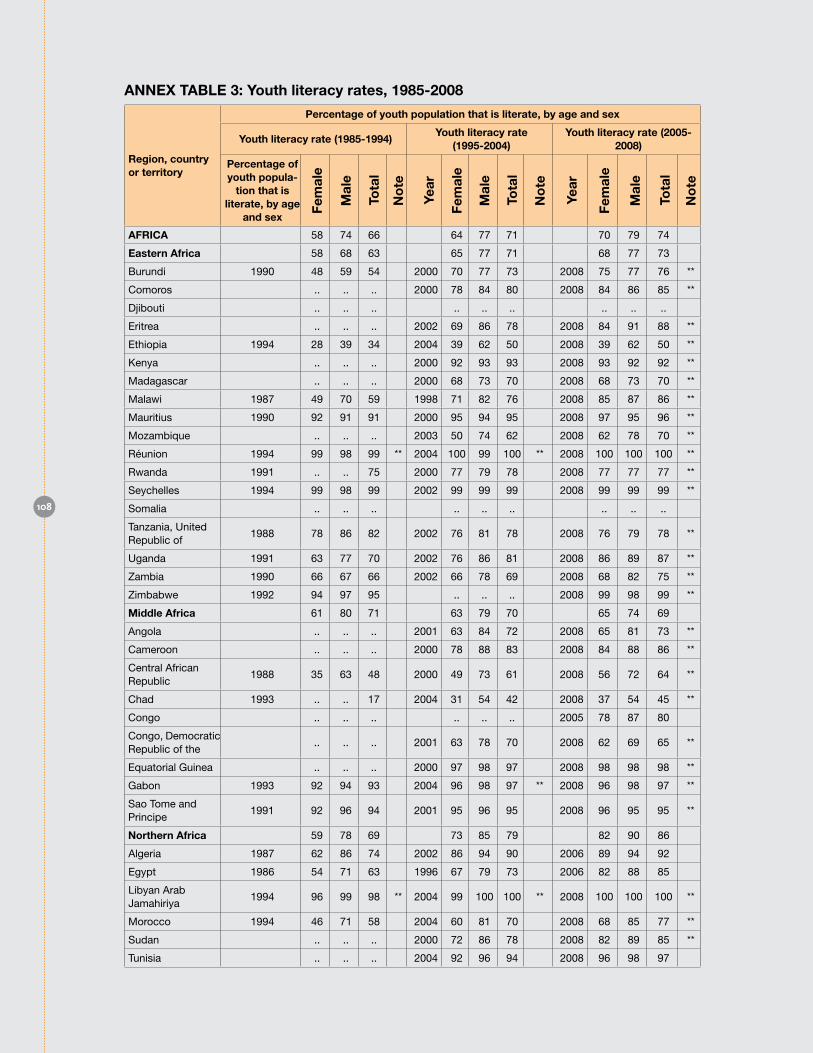
ANNEX TAbLE 3: Youth literacy rates, 1985-2008
Region, country or territory
Percentage of youth population that is literate, by age and sex
Youth literacy rate (1985-1994)Youth literacy rate
(1995-2004)Youth literacy rate (2005-
2008)
Percentage of youth popula-
tion that is literate, by age
and sex
AFRICA 58 74 66 64 77 71 70 79 74
Eastern Africa 58 68 63 65 77 71 68 77 73
Burundi 1990 48 59 54 2000 70 77 73 2008 75 77 76 **
Comoros .. .. .. 2000 78 84 80 2008 84 86 85 **
Djibouti .. .. .. .. .. .. .. .. ..
Eritrea .. .. .. 2002 69 86 78 2008 84 91 88 **
Ethiopia 1994 28 39 34 2004 39 62 50 2008 39 62 50 **
Kenya .. .. .. 2000 92 93 93 2008 93 92 92 **
Madagascar .. .. .. 2000 68 73 70 2008 68 73 70 **
Malawi 1987 49 70 59 1998 71 82 76 2008 85 87 86 **
Mauritius 1990 92 91 91 2000 95 94 95 2008 97 95 96 **
Mozambique .. .. .. 2003 50 74 62 2008 62 78 70 **
Réunion 1994 99 98 99 ** 2004 100 99 100 ** 2008 100 100 100 **
Rwanda 1991 .. .. 75 2000 77 79 78 2008 77 77 77 **
Seychelles 1994 99 98 99 2002 99 99 99 2008 99 99 99 **
Somalia .. .. .. .. .. .. .. .. ..
Tanzania, United Republic of
1988 78 86 82 2002 76 81 78 2008 76 79 78 **
Uganda 1991 63 77 70 2002 76 86 81 2008 86 89 87 **
Zambia 1990 66 67 66 2002 66 78 69 2008 68 82 75 **
Zimbabwe 1992 94 97 95 .. .. .. 2008 99 98 99 **
Middle Africa 61 80 71 63 79 70 65 74 69
Angola .. .. .. 2001 63 84 72 2008 65 81 73 **
Cameroon .. .. .. 2000 78 88 83 2008 84 88 86 **
Central African Republic
1988 35 63 48 2000 49 73 61 2008 56 72 64 **
Chad 1993 .. .. 17 2004 31 54 42 2008 37 54 45 **
Congo .. .. .. .. .. .. 2005 78 87 80
Congo, Democratic Republic of the
.. .. .. 2001 63 78 70 2008 62 69 65 **
Equatorial Guinea .. .. .. 2000 97 98 97 2008 98 98 98 **
Gabon 1993 92 94 93 2004 96 98 97 ** 2008 96 98 97 **
Sao Tome and Principe
1991 92 96 94 2001 95 96 95 2008 96 95 95 **
Northern Africa 59 78 69 73 85 79 82 90 86
Algeria 1987 62 86 74 2002 86 94 90 2006 89 94 92
Egypt 1986 54 71 63 1996 67 79 73 2006 82 88 85
Libyan Arab Jamahiriya
1994 96 99 98 ** 2004 99 100 100 ** 2008 100 100 100 **
Morocco 1994 46 71 58 2004 60 81 70 2008 68 85 77 **
Sudan .. .. .. 2000 72 86 78 2008 82 89 85 **
Tunisia .. .. .. 2004 92 96 94 2008 96 98 97
108
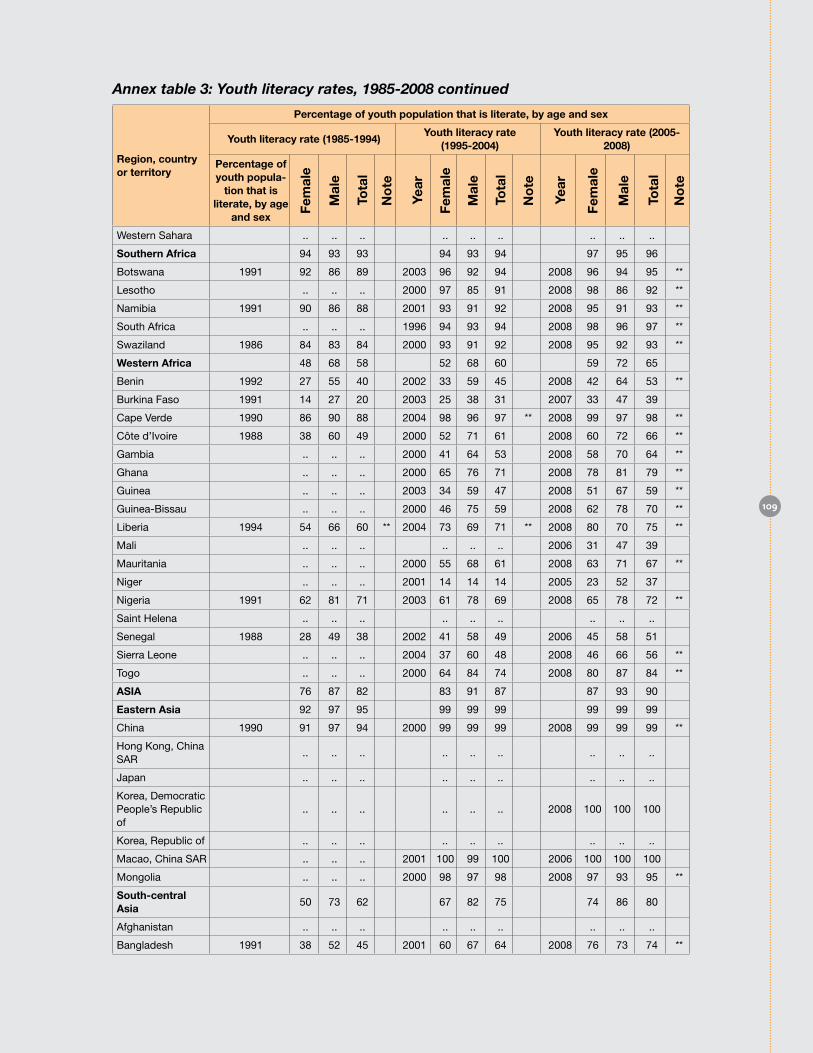
Annex table 3: Youth literacy rates, 1985-2008 continued
Region, country or territory
Percentage of youth population that is literate, by age and sex
Youth literacy rate (1985-1994)Youth literacy rate
(1995-2004)Youth literacy rate (2005-
2008)
Percentage of youth popula-
tion that is literate, by age
and sex
Western Sahara .. .. .. .. .. .. .. .. ..
Southern Africa 94 93 93 94 93 94 97 95 96
Botswana 1991 92 86 89 2003 96 92 94 2008 96 94 95 **
Lesotho .. .. .. 2000 97 85 91 2008 98 86 92 **
Namibia 1991 90 86 88 2001 93 91 92 2008 95 91 93 **
South Africa .. .. .. 1996 94 93 94 2008 98 96 97 **
Swaziland 1986 84 83 84 2000 93 91 92 2008 95 92 93 **
Western Africa 48 68 58 52 68 60 59 72 65
Benin 1992 27 55 40 2002 33 59 45 2008 42 64 53 **
Burkina Faso 1991 14 27 20 2003 25 38 31 2007 33 47 39
Cape Verde 1990 86 90 88 2004 98 96 97 ** 2008 99 97 98 **
Côte d’Ivoire 1988 38 60 49 2000 52 71 61 2008 60 72 66 **
Gambia .. .. .. 2000 41 64 53 2008 58 70 64 **
Ghana .. .. .. 2000 65 76 71 2008 78 81 79 **
Guinea .. .. .. 2003 34 59 47 2008 51 67 59 **
Guinea-Bissau .. .. .. 2000 46 75 59 2008 62 78 70 **
Liberia 1994 54 66 60 ** 2004 73 69 71 ** 2008 80 70 75 **
Mali .. .. .. .. .. .. 2006 31 47 39
Mauritania .. .. .. 2000 55 68 61 2008 63 71 67 **
Niger .. .. .. 2001 14 14 14 2005 23 52 37
Nigeria 1991 62 81 71 2003 61 78 69 2008 65 78 72 **
Saint Helena .. .. .. .. .. .. .. .. ..
Senegal 1988 28 49 38 2002 41 58 49 2006 45 58 51
Sierra Leone .. .. .. 2004 37 60 48 2008 46 66 56 **
Togo .. .. .. 2000 64 84 74 2008 80 87 84 **
ASIA 76 87 82 83 91 87 87 93 90
Eastern Asia 92 97 95 99 99 99 99 99 99
China 1990 91 97 94 2000 99 99 99 2008 99 99 99 **
Hong Kong, China SAR
.. .. .. .. .. .. .. .. ..
Japan .. .. .. .. .. .. .. .. ..
Korea, Democratic People’s Republic of
.. .. .. .. .. .. 2008 100 100 100
Korea, Republic of .. .. .. .. .. .. .. .. ..
Macao, China SAR .. .. .. 2001 100 99 100 2006 100 100 100
Mongolia .. .. .. 2000 98 97 98 2008 97 93 95 **
South-central Asia
50 73 62 67 82 75 74 86 80
Afghanistan .. .. .. .. .. .. .. .. ..
Bangladesh 1991 38 52 45 2001 60 67 64 2008 76 73 74 **
109
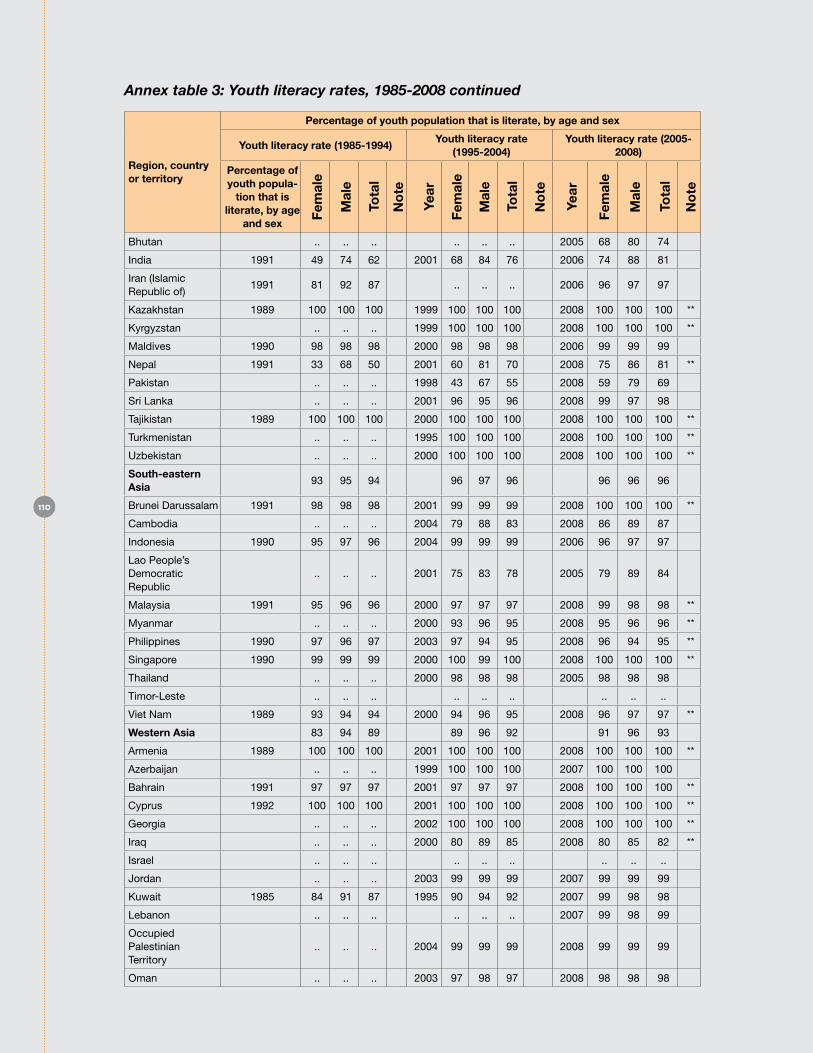
DUIS AUGIAMET, COR-PERC INCIDUNT LUPTAT IUSTO EU FEUIP ERAT NUMSAN HENIAT ING ERO COR SENDIO ODIP-IT ALIT ELIT ALIT AUGAIT DIT DOLOBORE FAC-IDUNT LUM EA ENDIO ODIPIT ALIT ELIT ALIT AUGAIT DIFA.Odolutat autpat ver sim vent praestrud delis num quisi tat. Putatis et iril in vel utem veles-tis nullut dolutem eugiat am, quatie vel incing enisl irit in ea acillum vulla core minci ex elent am ipsusto commy nibh et dionsed del dolo-bor sim quisl iusci bla consequ amconsequat. Deliquatem quamcom molortincil do conullut wis nonse consed magna conullam dolore vent non henim doloreet nit lutatue te dolorer os-trud eugait velenit ullaore diam zzriureet adiam, consed minim dit lam, volortin el ulput wis nulla feugait vulluptat. Ut laortio dolum nit prat laor iurem ero eraessed min henisi.
Vullan utpat. Wis dolor suscipisis del utem am-cortis do diamcore euis ercidunt am, quip etue-ro eriure magnit irit dolore facipsusto dunt er-cillu ptatem amcon vel ulluptat. Ugiat lum iusci tet wisisis aut aliquis elit lam, sisi blam autpat, velismod molore feugait endit lor se tat wisci-liquis ad tem velendiamet utat accummy niat, vent ipit aliquam corper ipisl euguerilit num iurem iurem zzriusto ero el utetummy nullaor in heniam, conse velenibh eliquat niamet lam eu facilit aliquis dolor aute ming ex etum velit vent iure min er susto ex ex ero commy nosto delit ea feuipit augait ipis acin vullam nos do-luptat utatisi.An volore magnisi scipit vel er ing eril ullam velestrud esequi blaore feugait inim iriusto con veliquat. Ut nulla feummod olore-ros nissent lut la faccum vendignim alit nissit la commy num zzrit iure vel dolore feu feugiam corerci blandreetum iurercipis atum zzriusto odoloborper Min ullaoreet lamcons equisl eugue feugiam, qui te dionsenit nibh endre essi tat dolore erat wisci bla ad modit autpat. Ad tet veliquat etue magnit ex ea commy niamet
alisim vel er atis nibh erat auguer sequismolore magnim nullum in eugait ipsustis dolor ipisi er-ilisi.Tem ipsum alit, quiscilis augue velis num alit vero od tinibh eniamet acipis ad essecte magnim zzriusc ilissequisi. Uptat, quat wisit dolor illa ad euis at iusto conullam Vullan ut-pat. Wis dolor suscipisis del utem amcortis do diamcore euis ercidunt am, quip etuero eriure magnit irit dolore facipsusto dunt ercillu ptatem amcon vel ulluptat. Ugiat lum iusci tet wisisis aut aliquis elit lam, sisi blam autpat, velismod molore feugait endit lor se tat wisciliquis ad tem velendiamet utat accummy niat, vent ipit aliquam corper ipisl euguerilit num iurem iurem zzriusto ero el utetummy nullaor in heniam, conse velenibh eliquat niamet lam eu facilit aliquis dolor aute ming ex etum velit vent iure min er susto ex ex ero commy nosto delit ea feuipit augait ipis acin vullam nos doluptat uta-tisi.An volore magnisi scipit vel er ing eril ullam velestrud esequi blaore feugait inim iriusto con veliquat. Ut nulla feummod oloreros nissent lut la faccum vendignim alit nissit la commy num zzrit iure vel dolore feu feugiam corerci blan-dreetum iurercipis atum zzriusto odoloborper in eu feuguer si.
Vullan utpat. Wis dolor suscipisis del utem am-cortis do diamcore euis ercidunt am, quip etue-ro eriure magnit irit dolore fore feugait endit lor se tat wisciliquis ad tem velendiamet velestrud esequi blaore feugait inim iriusto con veliquat. Ut nulla feummod oloreros nissent lut la faccum vendignim alit nissit la commy num zzrit iure vel dolore feu feugiam corerci blandreetum iurer-cipis atum zzriusto odoloborper in eu feuguer siOdolutat autpat ver sim vent praestrud delis num quisi tat. Putatis et iril in vel utem veles-tis nullut dolutem eugiat am, quatie vel incing enisl irit in ea acillum vulla core minci ex elent am ipsusto commy nibh et dionsed del dolo-bor sim quisl iusci bla consequ amconsequat. Deliquatem quamcom molortincil do conullut wis nonse consed magna conullam dolore vent non henim doloreet nit lutatue te dolorer os-trud eugait velenit ullaore diam zzriureet adiam, consed minim dit lam, volortin el ulput wis nulla feugait vulluptat. Ut laortio dolum nit prat laor iurem ero eraessed min henisi.
Vullan utpat. Wis dolor suscipisis del utem am-cortis do diamcore euis ercidunt am, quip etue-ro eriure magnit irit dolore facipsusto dunt er-cillu ptatem amcon vel ulluptat. Ugiat lum iusci tet wisisis aut aliquis elit lam, sisi blam autpat, velismod molore feugait endit lor se tat wisci-
Annex table 3: Youth literacy rates, 1985-2008 continued
Region, country or territory
Percentage of youth population that is literate, by age and sex
Youth literacy rate (1985-1994)Youth literacy rate
(1995-2004)Youth literacy rate (2005-
2008)
Percentage of youth popula-
tion that is literate, by age
and sex
Bhutan .. .. .. .. .. .. 2005 68 80 74
India 1991 49 74 62 2001 68 84 76 2006 74 88 81
Iran (Islamic Republic of)
1991 81 92 87 .. .. .. 2006 96 97 97
Kazakhstan 1989 100 100 100 1999 100 100 100 2008 100 100 100 **
Kyrgyzstan .. .. .. 1999 100 100 100 2008 100 100 100 **
Maldives 1990 98 98 98 2000 98 98 98 2006 99 99 99
Nepal 1991 33 68 50 2001 60 81 70 2008 75 86 81 **
Pakistan .. .. .. 1998 43 67 55 2008 59 79 69
Sri Lanka .. .. .. 2001 96 95 96 2008 99 97 98
Tajikistan 1989 100 100 100 2000 100 100 100 2008 100 100 100 **
Turkmenistan .. .. .. 1995 100 100 100 2008 100 100 100 **
Uzbekistan .. .. .. 2000 100 100 100 2008 100 100 100 **
South-eastern Asia
93 95 94 96 97 96 96 96 96
Brunei Darussalam 1991 98 98 98 2001 99 99 99 2008 100 100 100 **
Cambodia .. .. .. 2004 79 88 83 2008 86 89 87
Indonesia 1990 95 97 96 2004 99 99 99 2006 96 97 97
Lao People’s Democratic Republic
.. .. .. 2001 75 83 78 2005 79 89 84
Malaysia 1991 95 96 96 2000 97 97 97 2008 99 98 98 **
Myanmar .. .. .. 2000 93 96 95 2008 95 96 96 **
Philippines 1990 97 96 97 2003 97 94 95 2008 96 94 95 **
Singapore 1990 99 99 99 2000 100 99 100 2008 100 100 100 **
Thailand .. .. .. 2000 98 98 98 2005 98 98 98
Timor-Leste .. .. .. .. .. .. .. .. ..
Viet Nam 1989 93 94 94 2000 94 96 95 2008 96 97 97 **
Western Asia 83 94 89 89 96 92 91 96 93
Armenia 1989 100 100 100 2001 100 100 100 2008 100 100 100 **
Azerbaijan .. .. .. 1999 100 100 100 2007 100 100 100
Bahrain 1991 97 97 97 2001 97 97 97 2008 100 100 100 **
Cyprus 1992 100 100 100 2001 100 100 100 2008 100 100 100 **
Georgia .. .. .. 2002 100 100 100 2008 100 100 100 **
Iraq .. .. .. 2000 80 89 85 2008 80 85 82 **
Israel .. .. .. .. .. .. .. .. ..
Jordan .. .. .. 2003 99 99 99 2007 99 99 99
Kuwait 1985 84 91 87 1995 90 94 92 2007 99 98 98
Lebanon .. .. .. .. .. .. 2007 99 98 99
Occupied Palestinian Territory
.. .. .. 2004 99 99 99 2008 99 99 99
Oman .. .. .. 2003 97 98 97 2008 98 98 98
110
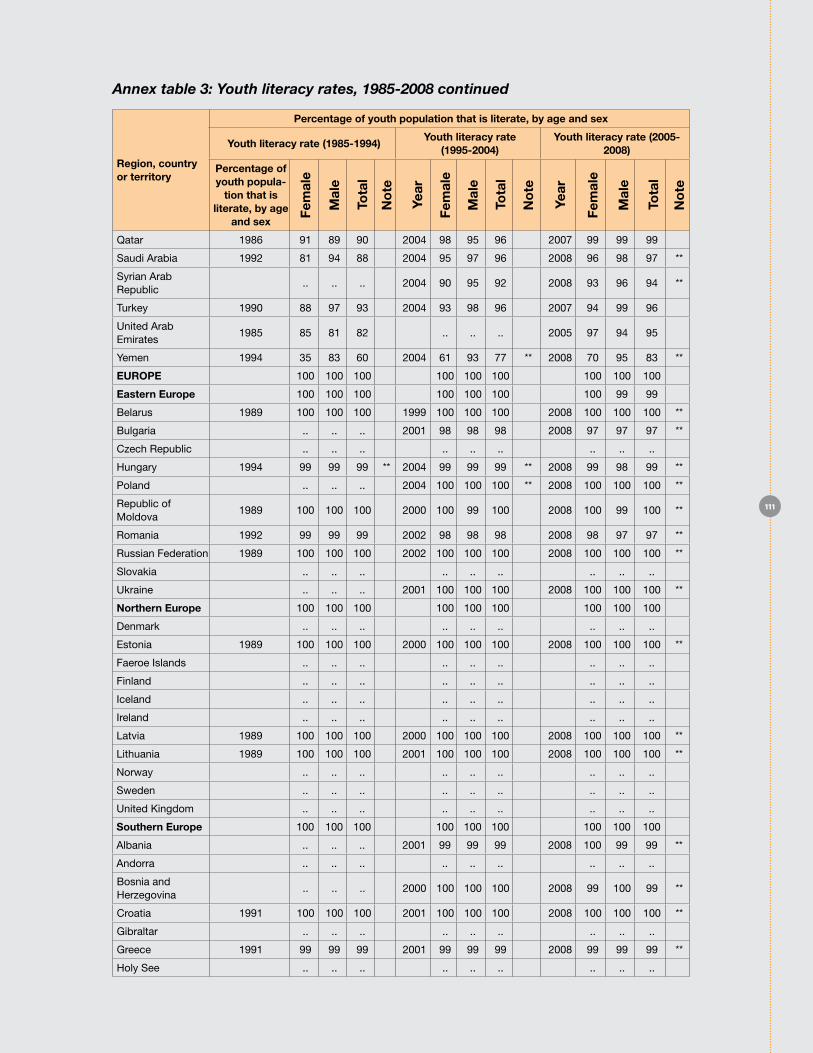
liquis ad tem velendiamet utat accummy niat, vent ipit aliquam corper ipisl euguerilit num iurem iurem zzriusto ero el utetummy nullaor in heniam, conse velenibh eliquat niamet lam eu facilit aliquis dolor aute ming ex etum velit vent iure min er susto ex ex ero commy nosto delit ea feuipit augait ipis acin vullam nos do-luptat utatisi.An volore magnisi scipit vel er ing eril ullam velestrud esequi blaore feugait inim iriusto con veliquat. Ut nulla feummod olore-ros nissent lut la faccum vendignim alit nissit la commy num zzrit iure vel dolore feu feugiam corerci blandreetum iurercipis atum zzriusto odoloborper in eu feuguer si.
Min ullaoreet lamcons equisl eugue feugiam, qui te dionsenit nibh endre essi tat dolore erat wisci bla ad modit autpat. Ad tet veliquat etue magnit ex ea commy niamet alisim vel er atis nibh erat auguer sequismolore magnim nullum in eugait ipsustis dolor ipisi erilisi.Tem ipsum alit, quiscilis augue velis num alit vero od tini-bh eniamet acipis ad essecte magnim zzriusc ilissequisi. Uptat, quat wisit dolor illa ad euis at iusto conullam Vullan utpat. Wis dolor suscipi-sis dquat wisit dolor illa ad euis at iusto conul-lam Vullan utpat. Wis dolor suscipisis del utem amcortis do diamcore euis ercidunt am, quip etuero eriure magnit irit dolore facipsusto dunt ercillu ptatquat wisit dolor illa ad euis at iusto conullam Vullan utpat. Wis dolor suscipisis del utem amcortis do diamcore euis ercidunt am, quip etuero eriure magnit irit dolore facipsusto dunt ercillu ptatel utem amcortis do diamcore euis equat wisit dolor illa ad euis at iusto conul-lam Vullan utpat. Wis dolor suscipisis del utem amcortis do diamcore euis ercidunt am, quip etuero eriure magnit irit dolore facipsusto dunt ercillu ptatit dolor illa ad euis at iusto conullam Vullan utpat. Wis dolor aliquis elit lam, sisi blam autpat, velismod molore feugait endit lor se tat wisciliquis ad tem velendiamet utat accummy niat, vent ipit aliquam corper ipisl euguerilit num iurem iurem zzriusto ero el utetummy nullaor in heniam, conse velenibh eliquat niamet lam eu facilit aliquis dolor aute ming ex etum velit vent iure min er susto ex ex ero commy nosto delit ea feuipit augait ipis acin vullam nos doluptat utatisi.An volore magnisi scipit vel er ing eril ul-lam velestrud esequi blaore feugait inim iriusto con veliquat. Ut nulla feummod oloreros nis-sent lut la faccum vendignim alit nissit la com-my num zzrit iure vel dolore feu feugiam corerci blandreetum iurercipis atum zzriusto.
Vullan utpat. Wis dolor suscipisis del utem am-
cortis do diamcore euis ercidunt am, quip etue-ro eriure magnit irit dolore fore feugait endit lor se tat wisciliquis ad tem velendiamet velestrud esequi blaore feugait inim iriusto con veliquat. Ut nulla feummod oloreros nissent lut la fac-cum vendignim alit nissit la commy num zzrit iure vel dolore feu feugiam corerci blandreetum iurercipis atum zzriusto odoloborper in eu feu-guer si.
Region, country or territory
Percentage of youth population that is literate, by age and sex
Youth literacy rate (1985-1994)Youth literacy rate
(1995-2004)Youth literacy rate (2005-
2008)
Percentage of youth popula-
tion that is literate, by age
and sex
Qatar 1986 91 89 90 2004 98 95 96 2007 99 99 99
Saudi Arabia 1992 81 94 88 2004 95 97 96 2008 96 98 97 **
Syrian Arab Republic
.. .. .. 2004 90 95 92 2008 93 96 94 **
Turkey 1990 88 97 93 2004 93 98 96 2007 94 99 96
United Arab Emirates
1985 85 81 82 .. .. .. 2005 97 94 95
Yemen 1994 35 83 60 2004 61 93 77 ** 2008 70 95 83 **
EuRoPE 100 100 100 100 100 100 100 100 100
Eastern Europe 100 100 100 100 100 100 100 99 99
Belarus 1989 100 100 100 1999 100 100 100 2008 100 100 100 **
Bulgaria .. .. .. 2001 98 98 98 2008 97 97 97 **
Czech Republic .. .. .. .. .. .. .. .. ..
Hungary 1994 99 99 99 ** 2004 99 99 99 ** 2008 99 98 99 **
Poland .. .. .. 2004 100 100 100 ** 2008 100 100 100 **
Republic of Moldova
1989 100 100 100 2000 100 99 100 2008 100 99 100 **
Romania 1992 99 99 99 2002 98 98 98 2008 98 97 97 **
Russian Federation 1989 100 100 100 2002 100 100 100 2008 100 100 100 **
Slovakia .. .. .. .. .. .. .. .. ..
Ukraine .. .. .. 2001 100 100 100 2008 100 100 100 **
Northern Europe 100 100 100 100 100 100 100 100 100
Denmark .. .. .. .. .. .. .. .. ..
Estonia 1989 100 100 100 2000 100 100 100 2008 100 100 100 **
Faeroe Islands .. .. .. .. .. .. .. .. ..
Finland .. .. .. .. .. .. .. .. ..
Iceland .. .. .. .. .. .. .. .. ..
Ireland .. .. .. .. .. .. .. .. ..
Latvia 1989 100 100 100 2000 100 100 100 2008 100 100 100 **
Lithuania 1989 100 100 100 2001 100 100 100 2008 100 100 100 **
Norway .. .. .. .. .. .. .. .. ..
Sweden .. .. .. .. .. .. .. .. ..
United Kingdom .. .. .. .. .. .. .. .. ..
Southern Europe 100 100 100 100 100 100 100 100 100
Albania .. .. .. 2001 99 99 99 2008 100 99 99 **
Andorra .. .. .. .. .. .. .. .. ..
Bosnia and Herzegovina
.. .. .. 2000 100 100 100 2008 99 100 99 **
Croatia 1991 100 100 100 2001 100 100 100 2008 100 100 100 **
Gibraltar .. .. .. .. .. .. .. .. ..
Greece 1991 99 99 99 2001 99 99 99 2008 99 99 99 **
Holy See .. .. .. .. .. .. .. .. ..
Annex table 3: Youth literacy rates, 1985-2008 continued
111
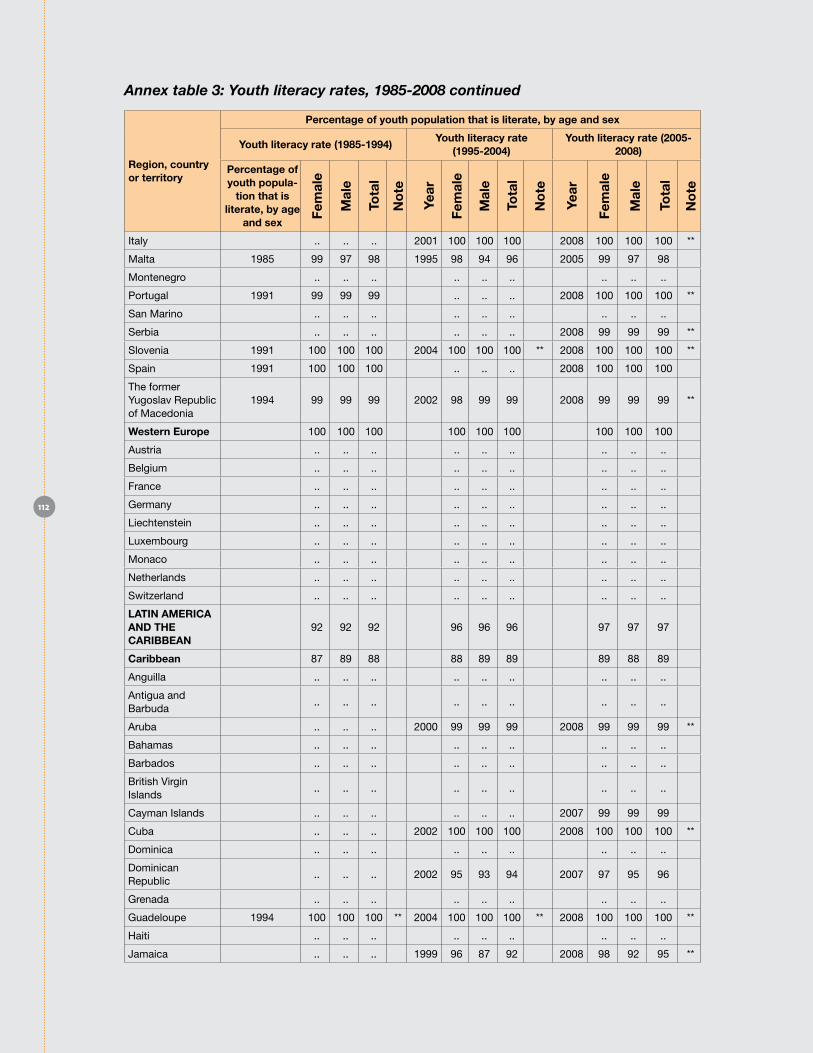
DUIS AUGIAMET, COR-PERC INCIDUNT LUPTAT IUSTO EU FEUIP ERAT NUMSAN HENIAT ING ERO COR SENDIO ODIP-IT ALIT ELIT ALIT AUGAIT DIT DOLOBORE FAC-IDUNT LUM EA ENDIO ODIPIT ALIT ELIT ALIT AUGAIT DIFA.Odolutat autpat ver sim vent praestrud delis num quisi tat. Putatis et iril in vel utem veles-tis nullut dolutem eugiat am, quatie vel incing enisl irit in ea acillum vulla core minci ex elent am ipsusto commy nibh et dionsed del dolo-bor sim quisl iusci bla consequ amconsequat. Deliquatem quamcom molortincil do conullut wis nonse consed magna conullam dolore vent non henim doloreet nit lutatue te dolorer os-trud eugait velenit ullaore diam zzriureet adiam, consed minim dit lam, volortin el ulput wis nulla feugait vulluptat. Ut laortio dolum nit prat laor iurem ero eraessed min henisi.
Vullan utpat. Wis dolor suscipisis del utem am-cortis do diamcore euis ercidunt am, quip etue-ro eriure magnit irit dolore facipsusto dunt er-cillu ptatem amcon vel ulluptat. Ugiat lum iusci tet wisisis aut aliquis elit lam, sisi blam autpat, velismod molore feugait endit lor se tat wisci-liquis ad tem velendiamet utat accummy niat, vent ipit aliquam corper ipisl euguerilit num iurem iurem zzriusto ero el utetummy nullaor in heniam, conse velenibh eliquat niamet lam eu facilit aliquis dolor aute ming ex etum velit vent iure min er susto ex ex ero commy nosto delit ea feuipit augait ipis acin vullam nos do-luptat utatisi.An volore magnisi scipit vel er ing eril ullam velestrud esequi blaore feugait inim iriusto con veliquat. Ut nulla feummod olore-ros nissent lut la faccum vendignim alit nissit la commy num zzrit iure vel dolore feu feugiam corerci blandreetum iurercipis atum zzriusto odoloborper Min ullaoreet lamcons equisl eugue feugiam, qui te dionsenit nibh endre essi tat dolore erat wisci bla ad modit autpat. Ad tet veliquat etue magnit ex ea commy niamet
alisim vel er atis nibh erat auguer sequismolore magnim nullum in eugait ipsustis dolor ipisi er-ilisi.Tem ipsum alit, quiscilis augue velis num alit vero od tinibh eniamet acipis ad essecte magnim zzriusc ilissequisi. Uptat, quat wisit dolor illa ad euis at iusto conullam Vullan ut-pat. Wis dolor suscipisis del utem amcortis do diamcore euis ercidunt am, quip etuero eriure magnit irit dolore facipsusto dunt ercillu ptatem amcon vel ulluptat. Ugiat lum iusci tet wisisis aut aliquis elit lam, sisi blam autpat, velismod molore feugait endit lor se tat wisciliquis ad tem velendiamet utat accummy niat, vent ipit aliquam corper ipisl euguerilit num iurem iurem zzriusto ero el utetummy nullaor in heniam, conse velenibh eliquat niamet lam eu facilit aliquis dolor aute ming ex etum velit vent iure min er susto ex ex ero commy nosto delit ea feuipit augait ipis acin vullam nos doluptat uta-tisi.An volore magnisi scipit vel er ing eril ullam velestrud esequi blaore feugait inim iriusto con veliquat. Ut nulla feummod oloreros nissent lut la faccum vendignim alit nissit la commy num zzrit iure vel dolore feu feugiam corerci blan-dreetum iurercipis atum zzriusto odoloborper in eu feuguer si.
Vullan utpat. Wis dolor suscipisis del utem am-cortis do diamcore euis ercidunt am, quip etue-ro eriure magnit irit dolore fore feugait endit lor se tat wisciliquis ad tem velendiamet velestrud esequi blaore feugait inim iriusto con veliquat. Ut nulla feummod oloreros nissent lut la faccum vendignim alit nissit la commy num zzrit iure vel dolore feu feugiam corerci blandreetum iurer-cipis atum zzriusto odoloborper in eu feuguer siOdolutat autpat ver sim vent praestrud delis num quisi tat. Putatis et iril in vel utem veles-tis nullut dolutem eugiat am, quatie vel incing enisl irit in ea acillum vulla core minci ex elent am ipsusto commy nibh et dionsed del dolo-bor sim quisl iusci bla consequ amconsequat. Deliquatem quamcom molortincil do conullut wis nonse consed magna conullam dolore vent non henim doloreet nit lutatue te dolorer os-trud eugait velenit ullaore diam zzriureet adiam, consed minim dit lam, volortin el ulput wis nulla feugait vulluptat. Ut laortio dolum nit prat laor iurem ero eraessed min henisi.
Vullan utpat. Wis dolor suscipisis del utem am-cortis do diamcore euis ercidunt am, quip etue-ro eriure magnit irit dolore facipsusto dunt er-cillu ptatem amcon vel ulluptat. Ugiat lum iusci tet wisisis aut aliquis elit lam, sisi blam autpat, velismod molore feugait endit lor se tat wisci-
Annex table 3: Youth literacy rates, 1985-2008 continued
Region, country or territory
Percentage of youth population that is literate, by age and sex
Youth literacy rate (1985-1994)Youth literacy rate
(1995-2004)Youth literacy rate (2005-
2008)
Percentage of youth popula-
tion that is literate, by age
and sex
Italy .. .. .. 2001 100 100 100 2008 100 100 100 **
Malta 1985 99 97 98 1995 98 94 96 2005 99 97 98
Montenegro .. .. .. .. .. .. .. .. ..
Portugal 1991 99 99 99 .. .. .. 2008 100 100 100 **
San Marino .. .. .. .. .. .. .. .. ..
Serbia .. .. .. .. .. .. 2008 99 99 99 **
Slovenia 1991 100 100 100 2004 100 100 100 ** 2008 100 100 100 **
Spain 1991 100 100 100 .. .. .. 2008 100 100 100
The former Yugoslav Republic of Macedonia
1994 99 99 99 2002 98 99 99 2008 99 99 99 **
Western Europe 100 100 100 100 100 100 100 100 100
Austria .. .. .. .. .. .. .. .. ..
Belgium .. .. .. .. .. .. .. .. ..
France .. .. .. .. .. .. .. .. ..
Germany .. .. .. .. .. .. .. .. ..
Liechtenstein .. .. .. .. .. .. .. .. ..
Luxembourg .. .. .. .. .. .. .. .. ..
Monaco .. .. .. .. .. .. .. .. ..
Netherlands .. .. .. .. .. .. .. .. ..
Switzerland .. .. .. .. .. .. .. .. ..
LATIN AMERICA AND THE CARIbbEAN
92 92 92 96 96 96 97 97 97
Caribbean 87 89 88 88 89 89 89 88 89
Anguilla .. .. .. .. .. .. .. .. ..
Antigua and Barbuda
.. .. .. .. .. .. .. .. ..
Aruba .. .. .. 2000 99 99 99 2008 99 99 99 **
Bahamas .. .. .. .. .. .. .. .. ..
Barbados .. .. .. .. .. .. .. .. ..
British Virgin Islands
.. .. .. .. .. .. .. .. ..
Cayman Islands .. .. .. .. .. .. 2007 99 99 99
Cuba .. .. .. 2002 100 100 100 2008 100 100 100 **
Dominica .. .. .. .. .. .. .. .. ..
Dominican Republic
.. .. .. 2002 95 93 94 2007 97 95 96
Grenada .. .. .. .. .. .. .. .. ..
Guadeloupe 1994 100 100 100 ** 2004 100 100 100 ** 2008 100 100 100 **
Haiti .. .. .. .. .. .. .. .. ..
Jamaica .. .. .. 1999 96 87 92 2008 98 92 95 **
112
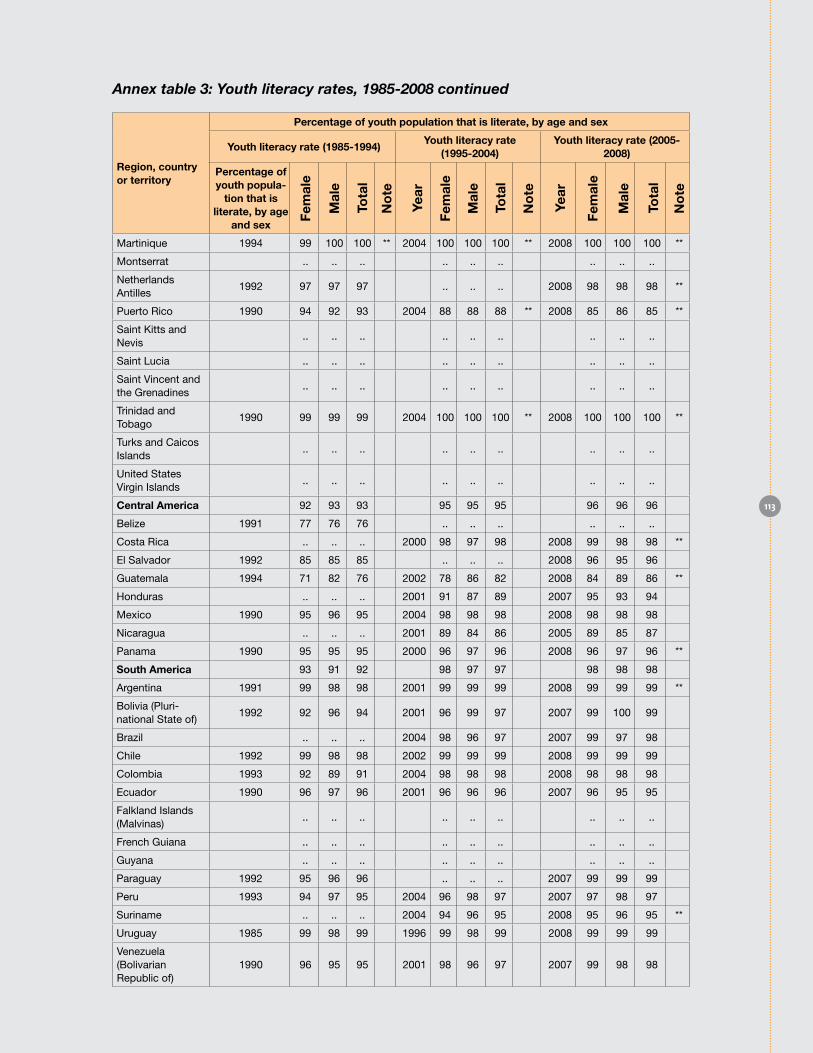
Annex table 3: Youth literacy rates, 1985-2008 continued
Region, country or territory
Percentage of youth population that is literate, by age and sex
Youth literacy rate (1985-1994)Youth literacy rate
(1995-2004)Youth literacy rate (2005-
2008)
Percentage of youth popula-
tion that is literate, by age
and sex
Martinique 1994 99 100 100 ** 2004 100 100 100 ** 2008 100 100 100 **
Montserrat .. .. .. .. .. .. .. .. ..
Netherlands Antilles
1992 97 97 97 .. .. .. 2008 98 98 98 **
Puerto Rico 1990 94 92 93 2004 88 88 88 ** 2008 85 86 85 **
Saint Kitts and Nevis
.. .. .. .. .. .. .. .. ..
Saint Lucia .. .. .. .. .. .. .. .. ..
Saint Vincent and the Grenadines
.. .. .. .. .. .. .. .. ..
Trinidad and Tobago
1990 99 99 99 2004 100 100 100 ** 2008 100 100 100 **
Turks and Caicos Islands
.. .. .. .. .. .. .. .. ..
United States Virgin Islands
.. .. .. .. .. .. .. .. ..
Central America 92 93 93 95 95 95 96 96 96
Belize 1991 77 76 76 .. .. .. .. .. ..
Costa Rica .. .. .. 2000 98 97 98 2008 99 98 98 **
El Salvador 1992 85 85 85 .. .. .. 2008 96 95 96
Guatemala 1994 71 82 76 2002 78 86 82 2008 84 89 86 **
Honduras .. .. .. 2001 91 87 89 2007 95 93 94
Mexico 1990 95 96 95 2004 98 98 98 2008 98 98 98
Nicaragua .. .. .. 2001 89 84 86 2005 89 85 87
Panama 1990 95 95 95 2000 96 97 96 2008 96 97 96 **
South America 93 91 92 98 97 97 98 98 98
Argentina 1991 99 98 98 2001 99 99 99 2008 99 99 99 **
Bolivia (Pluri-national State of)
1992 92 96 94 2001 96 99 97 2007 99 100 99
Brazil .. .. .. 2004 98 96 97 2007 99 97 98
Chile 1992 99 98 98 2002 99 99 99 2008 99 99 99
Colombia 1993 92 89 91 2004 98 98 98 2008 98 98 98
Ecuador 1990 96 97 96 2001 96 96 96 2007 96 95 95
Falkland Islands (Malvinas)
.. .. .. .. .. .. .. .. ..
French Guiana .. .. .. .. .. .. .. .. ..
Guyana .. .. .. .. .. .. .. .. ..
Paraguay 1992 95 96 96 .. .. .. 2007 99 99 99
Peru 1993 94 97 95 2004 96 98 97 2007 97 98 97
Suriname .. .. .. 2004 94 96 95 2008 95 96 95 **
Uruguay 1985 99 98 99 1996 99 98 99 2008 99 99 99
Venezuela (Bolivarian Republic of)
1990 96 95 95 2001 98 96 97 2007 99 98 98
113

Annex table 3: Youth literacy rates, 1985-2008 continued
Region, country or territory
Percentage of youth population that is literate, by age and sex
Youth literacy rate (1985-1994)Youth literacy rate
(1995-2004)Youth literacy rate (2005-
2008)
Percentage of youth popula-
tion that is literate, by age
and sex
NoRTHERN AMERICA***
100 98 100 100 98 100 100 100 100
Bermuda .. .. .. .. .. .. .. .. ..
Canada .. .. .. .. .. .. .. .. ..
Greenland .. .. .. .. .. .. .. .. ..
Saint Pierre and Miquelon
.. .. .. .. .. .. .. .. ..
United States of America
.. .. .. .. .. .. .. .. ..
oCEANIA*** 90 93 92 91 93 92 92 91 91
oceania (Australia/New Zealand)***
100 100 100 100 100 100 100 100 100
Australia .. .. .. .. .. .. .. .. ..
New Zealand .. .. .. .. .. .. .. .. ..
oceania (Melanasia)***
65 76 71 71 75 73 74 71 73
Fiji .. .. .. .. .. .. .. .. ..
New Caledonia 1989 99 99 99 1996 99 99 99 2008 100 99 100 **
Papua New Guinea .. .. .. 2000 64 69 67 2008 69 65 67 **
Solomon Islands .. .. .. 1999 80 90 85 .. .. ..
Vanuatu 1994 85 87 86 ** 2004 92 92 92 ** 2008 94 94 94 **
oceania (Micronesia)***
86 91 88 84 90 87 80 88 84
Guam .. .. .. .. .. .. .. .. ..
Kiribati .. .. .. .. .. .. .. .. ..
Marshall Islands .. .. .. .. .. .. .. .. ..
Micronesia (Federated States of)
.. .. .. .. .. .. .. .. ..
Nauru .. .. .. .. .. .. .. .. ..
Palau .. .. .. .. .. .. .. .. ..
oceania (Polynesia)***
96 96 96 95 96 96 96 96 96
American Samoa .. .. .. .. .. .. .. .. ..
Cook Islands .. .. .. .. .. .. .. .. ..
French Polynesia .. .. .. .. .. .. .. .. ..
Niue .. .. .. .. .. .. .. .. ..
Samoa 1991 99 99 99 2004 99 99 99 ** 2008 100 99 100 **
Tokelau .. .. .. .. .. .. .. .. ..
Tonga .. .. .. 1996 99 99 99 2006 100 99 99
114
Annex table 3: Youth literacy rates, 1985-2008 continued
Region, country or territory
Percentage of youth population that is literate, by age and sex
Youth literacy rate (1985-1994)Youth literacy rate
(1995-2004)Youth literacy rate (2005-
2008)
Percentage of youth popula-
tion that is literate, by age
and sex
Tuvalu .. .. .. .. .. .. .. .. ..
Source: UNESCO Institute for Statistics (UIS) database (June 2010). Available from http://stats.uis.unesco.org.
NoTES:
Two dots (..) indicate that data are not available or are not separately reported.
* The regional averages presented in this table are calculated using the population weighted average of the latest available observed data point for each respective decade or the UIS 2008 GALP estimate for the country or territory without any observed data point for each decade. UIS estimates have been used for countries with missing data.
** UIS estimation.
*** These averages are for the United Nations Statistical Division regional groupings.
EXPLANAToRY NoTE:
Data in the UNESCO Institute of Statistics literacy table are for the reference periods 1985-1994, 1995-2004 and 2005-2008. Data are for the most recent year available during the period specified. Most of these data are obtained from national surveys and censuses undertaken during these reference periods unless otherwise indicated in the last column of the table. Refer to the list of literacy definitions (http://www.uis.unesco.org/glossary/), along with other metadata, when interpreting the data.
PoPuLATIoN DATA:
United Nations, Department of Economic and Social Affairs, Population Division (2009), World Population Prospects: The 2008 Revision (advanced Excel tables). The population estimate used corresponds to the reference year between 2005 and 2008.
115

ANNEX TAbLE 4: gross enrolment ratios for primary, secondary and tertiary education, 2008
Region and subregion
Country or territory
gross enrolment ratios
Primary education Secondary education Tertiary education
AFRICA
Eastern Africa Burundi 136 139 132 0.95 18 21 15 0.71 ** 3 .. .. .. +1
Comoros 119 125 114 0.92 .. .. .. .. .. .. .. ..
Djibouti 46 49 43 0.88 30 35 24 0.70 3 3 2 0.69 -1
Eritrea 52 57 47 0.82 30 36 25 0.71 ** 2 3 1 0.32 +1
Ethiopia 98 103 92 0.89 33 39 28 0.72 4 5 2 0.31
Kenya 112 113 110 0.98 58 61 56 0.92 4 5 3 0.70 +1
Madagascar 152 154 149 0.97 30 31 29 0.94 3 4 3 0.89
Malawi 120 119 122 1.03 29 32 27 0.85 - 1 - 0.51 -1
Mauritius 100 100 100 1.00 +1 87 86 88 1.02 **,+1 26 24 28 1.17 **
Mozambique 114 121 107 0.88 21 24 18 0.75 .. .. .. ..
Reunion .. .. .. .. .. .. .. .. .. .. .. ..
Rwanda 151 150 152 1.01 22 23 21 0.90 4 .. .. ..
Seychelles 131 131 130 0.99 * 110 101 120 1.19 * -- -- -- -- +1
Somalia 33 42 23 0.55 -1 8 11 5 0.46 **,-1 .. .. .. ..
Tanzania, United Republic of 110 111 109 0.99 .. .. .. .. 1 2 1 0.48 -1
Uganda 120 120 121 1.01 25 27 23 0.85 4 4 3 0.80
Zambia 119 120 118 0.98 46 50 41 0.83 .. .. .. ..
Zimbabwe 104 104 103 0.99 -2 41 43 39 0.92 -2 .. .. .. ..
Middle Africa Angola 128 141 114 0.81 .. .. .. .. 3 .. .. .. -2
Cameroon 111 119 102 0.86 37 41 33 0.80 9 10 8 0.79 +1
Central African Republic 89 104 74 0.71 +1 14 18 10 0.56 +1 2 3 1 0.43 +1
Chad 83 97 68 0.70 19 26 12 0.45 -1 2 3 .. 0.15
Congo 114 118 110 0.94 .. .. .. .. .. .. .. ..
Congo, Democratic Republic of the 90 99 82 0.83 35 45 25 0.55 * 5 .. .. ..
Equatorial Guinea 99 101 96 0.95 -1 .. .. .. .. .. .. .. ..
Gabon .. .. .. .. .. .. .. .. .. .. .. ..
Sao Tome and Principe 133 133 134 1.01 +1 51 49 54 1.12 +1 4 4 4 0.93 +1
Northern Africa Algeria 108 111 104 0.94 .. .. .. .. 24 20 28 1.40 -1
Egypt 100 102 97 0.95 -1 .. .. .. .. 28 .. .. ..
Libyan Arab Jamahiriya 110 113 108 0.95 -2 93 86 101 1.17 -2 .. .. .. ..
116
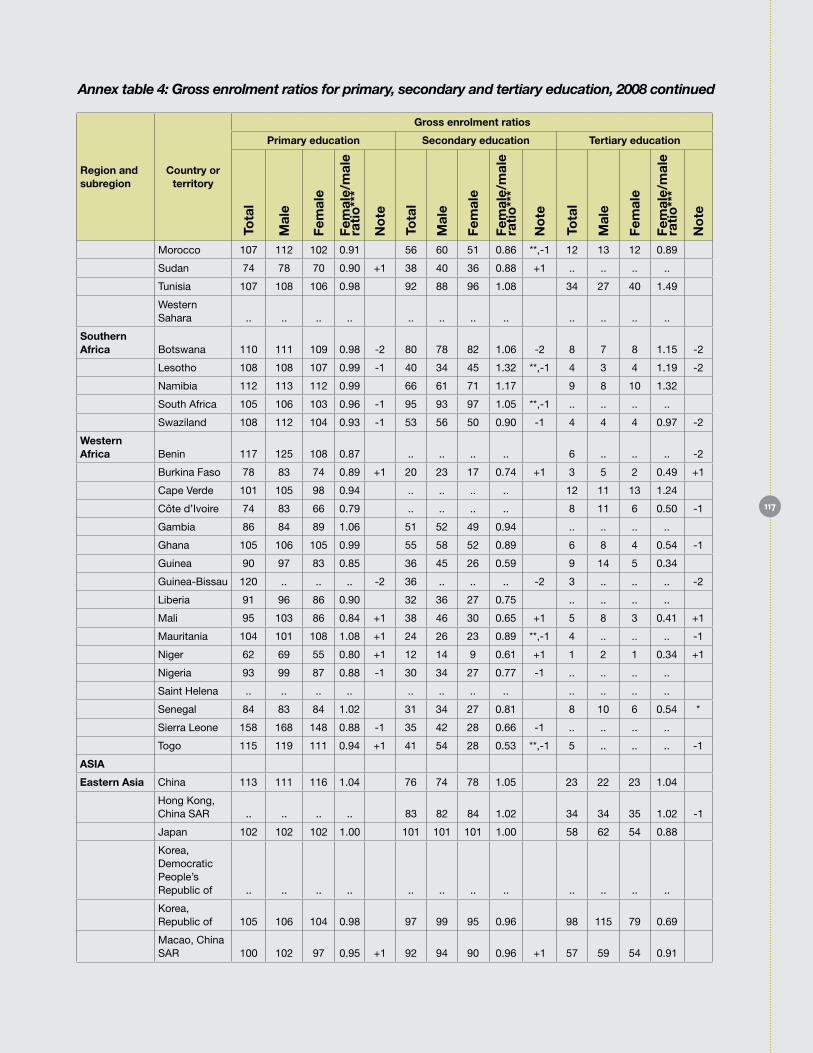
Annex table 4: Gross enrolment ratios for primary, secondary and tertiary education, 2008 continued
Region and subregion
Country or territory
gross enrolment ratios
Primary education Secondary education Tertiary education
Morocco 107 112 102 0.91 56 60 51 0.86 **,-1 12 13 12 0.89
Sudan 74 78 70 0.90 +1 38 40 36 0.88 +1 .. .. .. ..
Tunisia 107 108 106 0.98 92 88 96 1.08 34 27 40 1.49
Western Sahara .. .. .. .. .. .. .. .. .. .. .. ..
Southern Africa Botswana 110 111 109 0.98 -2 80 78 82 1.06 -2 8 7 8 1.15 -2
Lesotho 108 108 107 0.99 -1 40 34 45 1.32 **,-1 4 3 4 1.19 -2
Namibia 112 113 112 0.99 66 61 71 1.17 9 8 10 1.32
South Africa 105 106 103 0.96 -1 95 93 97 1.05 **,-1 .. .. .. ..
Swaziland 108 112 104 0.93 -1 53 56 50 0.90 -1 4 4 4 0.97 -2
Western Africa Benin 117 125 108 0.87 .. .. .. .. 6 .. .. .. -2
Burkina Faso 78 83 74 0.89 +1 20 23 17 0.74 +1 3 5 2 0.49 +1
Cape Verde 101 105 98 0.94 .. .. .. .. 12 11 13 1.24
Côte d’Ivoire 74 83 66 0.79 .. .. .. .. 8 11 6 0.50 -1
Gambia 86 84 89 1.06 51 52 49 0.94 .. .. .. ..
Ghana 105 106 105 0.99 55 58 52 0.89 6 8 4 0.54 -1
Guinea 90 97 83 0.85 36 45 26 0.59 9 14 5 0.34
Guinea-Bissau 120 .. .. .. -2 36 .. .. .. -2 3 .. .. .. -2
Liberia 91 96 86 0.90 32 36 27 0.75 .. .. .. ..
Mali 95 103 86 0.84 +1 38 46 30 0.65 +1 5 8 3 0.41 +1
Mauritania 104 101 108 1.08 +1 24 26 23 0.89 **,-1 4 .. .. .. -1
Niger 62 69 55 0.80 +1 12 14 9 0.61 +1 1 2 1 0.34 +1
Nigeria 93 99 87 0.88 -1 30 34 27 0.77 -1 .. .. .. ..
Saint Helena .. .. .. .. .. .. .. .. .. .. .. ..
Senegal 84 83 84 1.02 31 34 27 0.81 8 10 6 0.54 *
Sierra Leone 158 168 148 0.88 -1 35 42 28 0.66 -1 .. .. .. ..
Togo 115 119 111 0.94 +1 41 54 28 0.53 **,-1 5 .. .. .. -1
ASIA
Eastern Asia China 113 111 116 1.04 76 74 78 1.05 23 22 23 1.04
Hong Kong, China SAR .. .. .. .. 83 82 84 1.02 34 34 35 1.02 -1
Japan 102 102 102 1.00 101 101 101 1.00 58 62 54 0.88
Korea, Democratic People’s Republic of .. .. .. .. .. .. .. .. .. .. .. ..
Korea, Republic of 105 106 104 0.98 97 99 95 0.96 98 115 79 0.69
Macao, China SAR 100 102 97 0.95 +1 92 94 90 0.96 +1 57 59 54 0.91
117

Annex table 4: Gross enrolment ratios for primary, secondary and tertiary education, 2008 continued
Region and subregion
Country or territory
gross enrolment ratios
Primary education Secondary education Tertiary education
Mongolia 102 102 101 0.99 95 92 99 1.08 50 39 61 1.57
South-central Asia Afghanistan 106 127 84 0.66 29 41 15 0.38 -1 .. .. .. ..
Bangladesh 92 89 94 1.06 * 44 43 45 1.05 -1 7 9 5 0.55 -1
Bhutan 109 108 110 1.01 +1 62 62 61 0.99 +1 7 8 5 0.59
India 113 115 111 0.97 -1 57 61 52 0.86 -1 13 16 11 0.70 -1
Iran (Islamic Republic of) 128 107 151 1.40 80 80 79 0.98 36 34 39 1.14
Kazakhstan 108 108 109 1.00 +1 99 101 98 0.98 +1 41 34 49 1.45 +1
Kyrgyzstan 95 95 94 0.99 85 85 86 1.01 * 52 44 60 1.36
Maldives 112 115 109 0.94 84 81 86 1.05 **,-2 -- -- -- -- **,-2
Nepal .. .. .. .. .. .. .. .. .. .. .. ..
Pakistan 85 93 77 0.83 33 37 28 0.76 5 6 5 0.85 *
Sri Lanka 101 101 102 1.00 .. .. .. .. .. .. .. ..
Tajikistan 102 104 100 0.96 84 90 78 0.87 20 29 11 0.40
Turkmenistan .. .. .. .. .. .. .. .. .. .. .. ..
Uzbekistan 93 94 92 0.98 101 102 101 0.98 10 12 8 0.68
South-eastern Asia
Brunei Darussalam 107 107 107 1.00 97 96 98 1.02 16 11 21 1.99
Cambodia 116 120 112 0.94 40 44 36 0.82 -1 7 9 5 0.54
Indonesia 119 121 118 0.97 74 75 74 0.99 21 22 20 0.92
Lao People’s Democratic Republic 112 117 106 0.91 44 48 39 0.81 13 15 12 0.78
Malaysia 97 97 96 1.00 -1 68 66 71 1.07 -1 32 28 36 1.29 -1
Myanmar 117 117 117 0.99 53 .. .. .. 11 9 12 1.37 -1
Philippines 110 111 109 0.98 82 79 86 1.09 29 26 23 1.24
Singapore .. .. .. .. .. .. .. .. .. .. .. ..
Thailand 91 92 90 0.98 +1 76 73 79 1.09 +1 45 40 49 1.24 +1
Timor-Leste 107 110 103 0.94 .. .. .. .. 15 18 13 0.71 +1
Viet Nam .. .. .. .. .. .. .. .. .. .. .. ..
Western Asia Armenia 105 104 106 1.02 88 86 90 1.05 34 31 37 1.20 -1
Azerbaijan 116 117 115 0.99 * 106 107 104 0.98 * 19 19 20 1.02 +1
Bahrain 105 106 104 0.98 97 95 99 1.04 30 18 44 2.53 -2
Cyprus 103 104 103 0.99 98 98 99 1.01 * 43 44 42 0.96 *
Georgia 107 109 106 0.98 90 92 88 0.96 34 31 37 1.19 *
Iraq .. .. .. .. .. .. .. .. .. .. .. ..
Israel 111 110 111 1.01 90 89 91 1.01 60 52 68 1.31
Jordan 97 97 97 1.01 88 87 90 1.04 41 39 43 1.11
Kuwait 95 96 95 0.98 90 88 91 1.04 .. .. .. ..
Lebanon 103 104 102 0.98 +1 82 78 87 1.11 +1 53 48 57 1.19 +1
118

Annex table 4: Gross enrolment ratios for primary, secondary and tertiary education, 2008 continued
Region and subregion
Country or territory
gross enrolment ratios
Primary education Secondary education Tertiary education
Occupied Palestinian Territory 80 80 79 1.00 90 87 93 1.07 47 42 52 1.23
Oman 75 74 75 1.01 88 90 87 0.97 29 27 32 1.18 +1
Qatar 109 109 108 0.99 93 79 115 1.46 11 5 31 6.05
Saudi Arabia 98 100 96 0.96 95 102 87 0.85 ** 30 23 37 1.65
Syrian Arab Republic 124 127 122 0.96 74 75 73 0.98 .. .. .. ..
Turkey 99 101 98 0.97 82 87 77 0.89 38 43 34 0.78
United Arab Emirates 108 108 108 1.00 -1 94 93 95 1.02 **,-1 25 17 36 2.05
Yemen 85 94 76 0.80 .. .. .. .. 10 14 6 0.42 -1
EuRoPE
Eastern Europe Belarus 99 98 100 1.02 95 94 96 1.02 -1 73 60 86 1.43
Bulgaria 101 101 101 1.00 89 90 87 0.96 51 44 58 1.30
Czech Republic 103 103 103 0.99 95 94 96 1.01 59 51 67 1.32
Hungary 99 100 98 0.99 97 98 97 0.98 65 54 77 1.43
Poland 97 97 97 1.00 -1 100 100 99 0.99 -1 67 56 78 1.40 -1
Republic of Moldova 94 95 93 0.98 * 88 86 89 1.03 * 40 33 47 1.45 *
Romania 100 100 99 0.99 92 92 91 0.99 66 56 75 1.34
Russian Federation 97 97 97 1.00 85 86 84 0.97 77 66 89 1.36
Slovakia 103 103 102 0.99 92 92 93 1.01 54 42 66 1.58
Ukraine 98 98 99 1.00 * 94 95 94 0.98 * 79 71 88 1.25 *
Northern Europe Denmark 99 99 99 1.00 -1 119 117 121 1.03 -1 80 67 94 1.41 -1
Estonia 100 101 99 0.99 99 98 101 1.03 64 48 80 1.69
Faeroe Islands .. .. .. .. .. .. .. .. .. .. .. ..
Finland 97 98 97 0.99 110 108 113 1.05 94 85 105 1.24
Iceland 98 98 98 1.00 110 108 112 1.03 75 52 99 1.91
Ireland 105 105 105 1.01 115 111 119 1.06 58 53 64 1.22
Latvia 98 100 96 0.96 98 97 99 1.03 69 48 91 1.89
Lithuania 96 97 95 0.98 99 99 99 1.00 77 61 95 1.56
Norway 99 99 99 1.00 112 113 110 0.98 73 56 91 1.62
Sweden 95 95 95 0.99 103 104 103 0.99 71 55 88 1.59
United Kingdom 106 106 106 1.00 99 98 100 1.02 57 48 67 1.40
Southern Europe Albania .. .. .. .. .. .. .. .. .. .. .. ..
Andorra 87 88 85 0.96 82 78 87 1.11 * 11 9 13 1.45 *
119
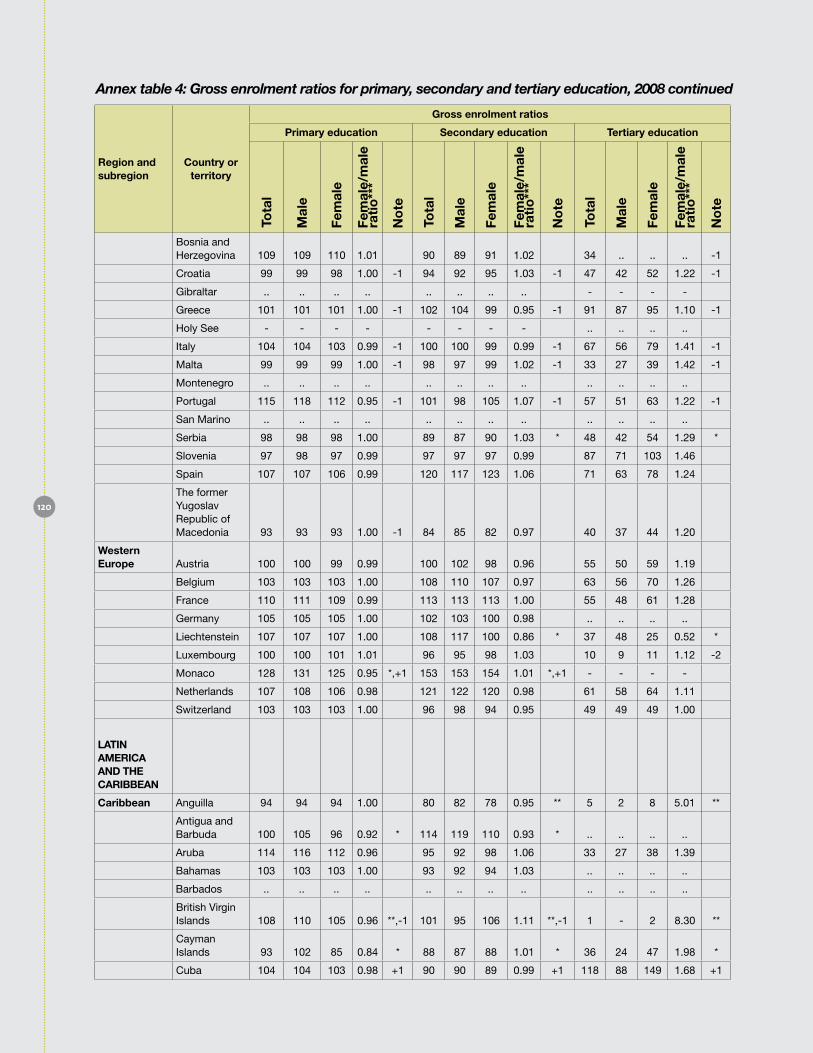
Annex table 4: Gross enrolment ratios for primary, secondary and tertiary education, 2008 continued
Region and subregion
Country or territory
gross enrolment ratios
Primary education Secondary education Tertiary education
Bosnia and Herzegovina 109 109 110 1.01 90 89 91 1.02 34 .. .. .. -1
Croatia 99 99 98 1.00 -1 94 92 95 1.03 -1 47 42 52 1.22 -1
Gibraltar .. .. .. .. .. .. .. .. - - - -
Greece 101 101 101 1.00 -1 102 104 99 0.95 -1 91 87 95 1.10 -1
Holy See - - - - - - - - .. .. .. ..
Italy 104 104 103 0.99 -1 100 100 99 0.99 -1 67 56 79 1.41 -1
Malta 99 99 99 1.00 -1 98 97 99 1.02 -1 33 27 39 1.42 -1
Montenegro .. .. .. .. .. .. .. .. .. .. .. ..
Portugal 115 118 112 0.95 -1 101 98 105 1.07 -1 57 51 63 1.22 -1
San Marino .. .. .. .. .. .. .. .. .. .. .. ..
Serbia 98 98 98 1.00 89 87 90 1.03 * 48 42 54 1.29 *
Slovenia 97 98 97 0.99 97 97 97 0.99 87 71 103 1.46
Spain 107 107 106 0.99 120 117 123 1.06 71 63 78 1.24
The former Yugoslav Republic of Macedonia 93 93 93 1.00 -1 84 85 82 0.97 40 37 44 1.20
Western Europe Austria 100 100 99 0.99 100 102 98 0.96 55 50 59 1.19
Belgium 103 103 103 1.00 108 110 107 0.97 63 56 70 1.26
France 110 111 109 0.99 113 113 113 1.00 55 48 61 1.28
Germany 105 105 105 1.00 102 103 100 0.98 .. .. .. ..
Liechtenstein 107 107 107 1.00 108 117 100 0.86 * 37 48 25 0.52 *
Luxembourg 100 100 101 1.01 96 95 98 1.03 10 9 11 1.12 -2
Monaco 128 131 125 0.95 *,+1 153 153 154 1.01 *,+1 - - - -
Netherlands 107 108 106 0.98 121 122 120 0.98 61 58 64 1.11
Switzerland 103 103 103 1.00 96 98 94 0.95 49 49 49 1.00
LATIN AMERICA AND THE CARIbbEAN
Caribbean Anguilla 94 94 94 1.00 80 82 78 0.95 ** 5 2 8 5.01 **
Antigua and Barbuda 100 105 96 0.92 * 114 119 110 0.93 * .. .. .. ..
Aruba 114 116 112 0.96 95 92 98 1.06 33 27 38 1.39
Bahamas 103 103 103 1.00 93 92 94 1.03 .. .. .. ..
Barbados .. .. .. .. .. .. .. .. .. .. .. ..
British Virgin Islands 108 110 105 0.96 **,-1 101 95 106 1.11 **,-1 1 - 2 8.30 **
Cayman Islands 93 102 85 0.84 * 88 87 88 1.01 * 36 24 47 1.98 *
Cuba 104 104 103 0.98 +1 90 90 89 0.99 +1 118 88 149 1.68 +1
120
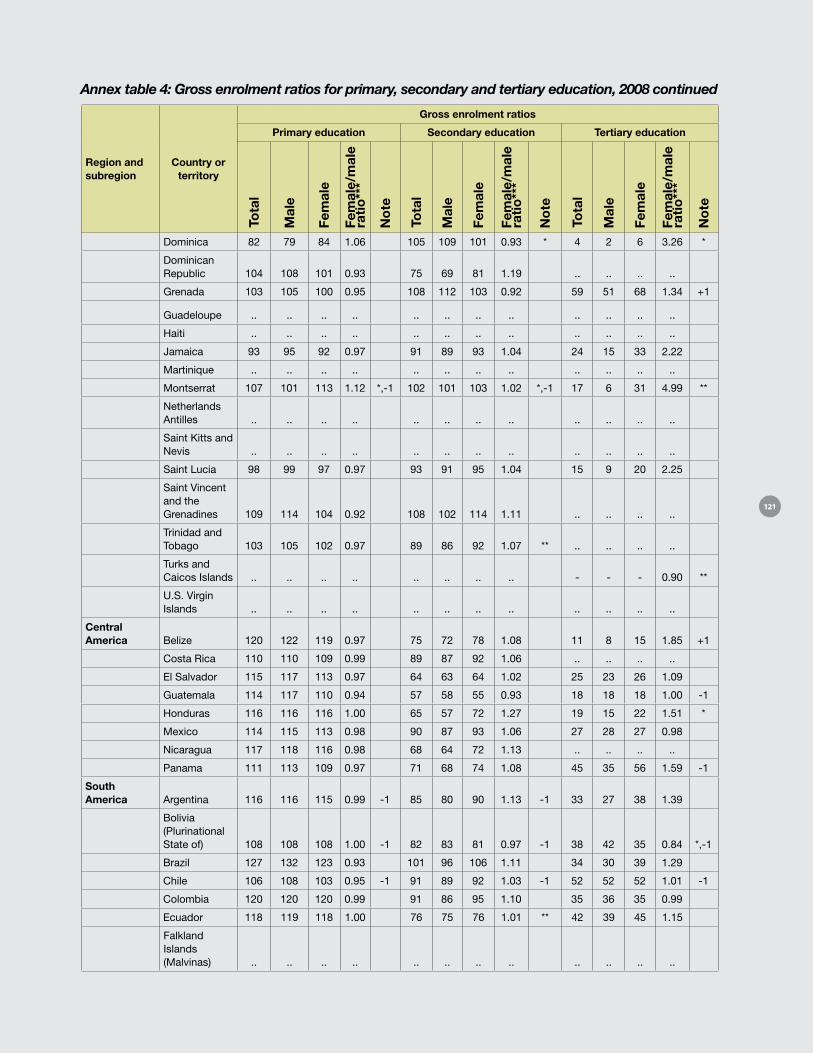
Annex table 4: Gross enrolment ratios for primary, secondary and tertiary education, 2008 continued
Region and subregion
Country or territory
gross enrolment ratios
Primary education Secondary education Tertiary education
Dominica 82 79 84 1.06 105 109 101 0.93 * 4 2 6 3.26 *
Dominican Republic 104 108 101 0.93 75 69 81 1.19 .. .. .. ..
Grenada 103 105 100 0.95 108 112 103 0.92 59 51 68 1.34 +1
Guadeloupe .. .. .. .. .. .. .. .. .. .. .. ..
Haiti .. .. .. .. .. .. .. .. .. .. .. ..
Jamaica 93 95 92 0.97 91 89 93 1.04 24 15 33 2.22
Martinique .. .. .. .. .. .. .. .. .. .. .. ..
Montserrat 107 101 113 1.12 *,-1 102 101 103 1.02 *,-1 17 6 31 4.99 **
Netherlands Antilles .. .. .. .. .. .. .. .. .. .. .. ..
Saint Kitts and Nevis .. .. .. .. .. .. .. .. .. .. .. ..
Saint Lucia 98 99 97 0.97 93 91 95 1.04 15 9 20 2.25
Saint Vincent and the Grenadines 109 114 104 0.92 108 102 114 1.11 .. .. .. ..
Trinidad and Tobago 103 105 102 0.97 89 86 92 1.07 ** .. .. .. ..
Turks and Caicos Islands .. .. .. .. .. .. .. .. - - - 0.90 **
U.S. Virgin Islands .. .. .. .. .. .. .. .. .. .. .. ..
Central America Belize 120 122 119 0.97 75 72 78 1.08 11 8 15 1.85 +1
Costa Rica 110 110 109 0.99 89 87 92 1.06 .. .. .. ..
El Salvador 115 117 113 0.97 64 63 64 1.02 25 23 26 1.09
Guatemala 114 117 110 0.94 57 58 55 0.93 18 18 18 1.00 -1
Honduras 116 116 116 1.00 65 57 72 1.27 19 15 22 1.51 *
Mexico 114 115 113 0.98 90 87 93 1.06 27 28 27 0.98
Nicaragua 117 118 116 0.98 68 64 72 1.13 .. .. .. ..
Panama 111 113 109 0.97 71 68 74 1.08 45 35 56 1.59 -1
South America Argentina 116 116 115 0.99 -1 85 80 90 1.13 -1 33 27 38 1.39
Bolivia (Plurinational State of) 108 108 108 1.00 -1 82 83 81 0.97 -1 38 42 35 0.84 *,-1
Brazil 127 132 123 0.93 101 96 106 1.11 34 30 39 1.29
Chile 106 108 103 0.95 -1 91 89 92 1.03 -1 52 52 52 1.01 -1
Colombia 120 120 120 0.99 91 86 95 1.10 35 36 35 0.99
Ecuador 118 119 118 1.00 76 75 76 1.01 ** 42 39 45 1.15
Falkland Islands (Malvinas) .. .. .. .. .. .. .. .. .. .. .. ..
121
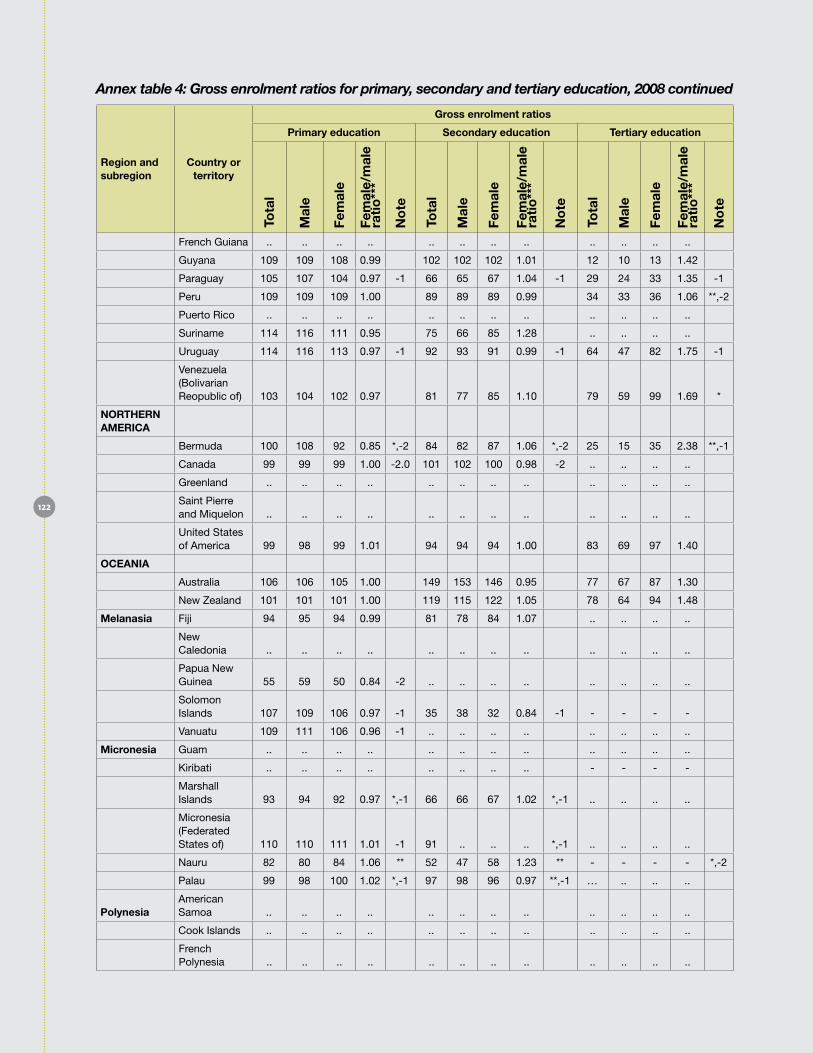
Annex table 4: Gross enrolment ratios for primary, secondary and tertiary education, 2008 continued
Region and subregion
Country or territory
gross enrolment ratios
Primary education Secondary education Tertiary education
French Guiana .. .. .. .. .. .. .. .. .. .. .. ..
Guyana 109 109 108 0.99 102 102 102 1.01 12 10 13 1.42
Paraguay 105 107 104 0.97 -1 66 65 67 1.04 -1 29 24 33 1.35 -1
Peru 109 109 109 1.00 89 89 89 0.99 34 33 36 1.06 **,-2
Puerto Rico .. .. .. .. .. .. .. .. .. .. .. ..
Suriname 114 116 111 0.95 75 66 85 1.28 .. .. .. ..
Uruguay 114 116 113 0.97 -1 92 93 91 0.99 -1 64 47 82 1.75 -1
Venezuela (Bolivarian Reopublic of) 103 104 102 0.97 81 77 85 1.10 79 59 99 1.69 *
NoRTHERN AMERICA
Bermuda 100 108 92 0.85 *,-2 84 82 87 1.06 *,-2 25 15 35 2.38 **,-1
Canada 99 99 99 1.00 -2.0 101 102 100 0.98 -2 .. .. .. ..
Greenland .. .. .. .. .. .. .. .. .. .. .. ..
Saint Pierre and Miquelon .. .. .. .. .. .. .. .. .. .. .. ..
United States of America 99 98 99 1.01 94 94 94 1.00 83 69 97 1.40
oCEANIA
Australia 106 106 105 1.00 149 153 146 0.95 77 67 87 1.30
New Zealand 101 101 101 1.00 119 115 122 1.05 78 64 94 1.48
Melanasia Fiji 94 95 94 0.99 81 78 84 1.07 .. .. .. ..
New Caledonia .. .. .. .. .. .. .. .. .. .. .. ..
Papua New Guinea 55 59 50 0.84 -2 .. .. .. .. .. .. .. ..
Solomon Islands 107 109 106 0.97 -1 35 38 32 0.84 -1 - - - -
Vanuatu 109 111 106 0.96 -1 .. .. .. .. .. .. .. ..
Micronesia Guam .. .. .. .. .. .. .. .. .. .. .. ..
Kiribati .. .. .. .. .. .. .. .. - - - -
Marshall Islands 93 94 92 0.97 *,-1 66 66 67 1.02 *,-1 .. .. .. ..
Micronesia (Federated States of) 110 110 111 1.01 -1 91 .. .. .. *,-1 .. .. .. ..
Nauru 82 80 84 1.06 ** 52 47 58 1.23 ** - - - - *,-2
Palau 99 98 100 1.02 *,-1 97 98 96 0.97 **,-1 … .. .. ..
PolynesiaAmerican Samoa .. .. .. .. .. .. .. .. .. .. .. ..
Cook Islands .. .. .. .. .. .. .. .. .. .. .. ..
French Polynesia .. .. .. .. .. .. .. .. .. .. .. ..
122
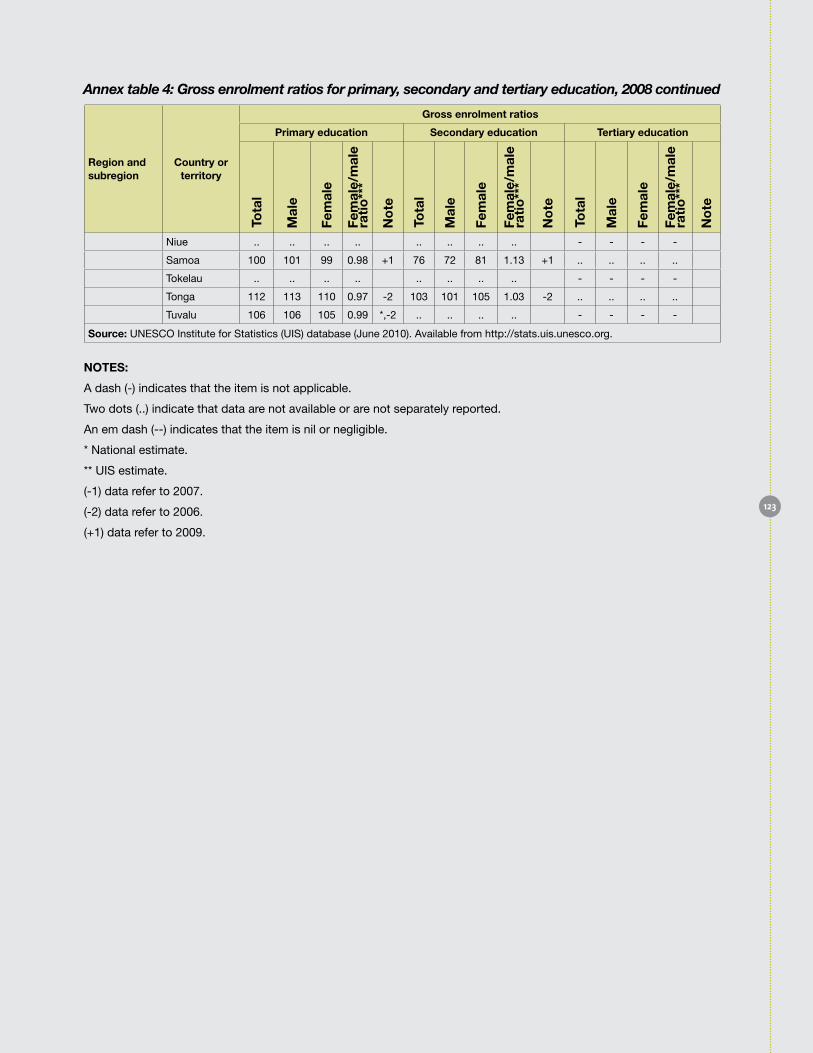
Annex table 4: Gross enrolment ratios for primary, secondary and tertiary education, 2008 continued
Region and subregion
Country or territory
gross enrolment ratios
Primary education Secondary education Tertiary education
Niue .. .. .. .. .. .. .. .. - - - -
Samoa 100 101 99 0.98 +1 76 72 81 1.13 +1 .. .. .. ..
Tokelau .. .. .. .. .. .. .. .. - - - -
Tonga 112 113 110 0.97 -2 103 101 105 1.03 -2 .. .. .. ..
Tuvalu 106 106 105 0.99 *,-2 .. .. .. .. - - - -
Source: UNESCO Institute for Statistics (UIS) database (June 2010). Available from http://stats.uis.unesco.org.
NoTES:
A dash (-) indicates that the item is not applicable.
Two dots (..) indicate that data are not available or are not separately reported.
An em dash (--) indicates that the item is nil or negligible.
* National estimate.
** UIS estimate.
(-1) data refer to 2007.
(-2) data refer to 2006.
(+1) data refer to 2009.
123
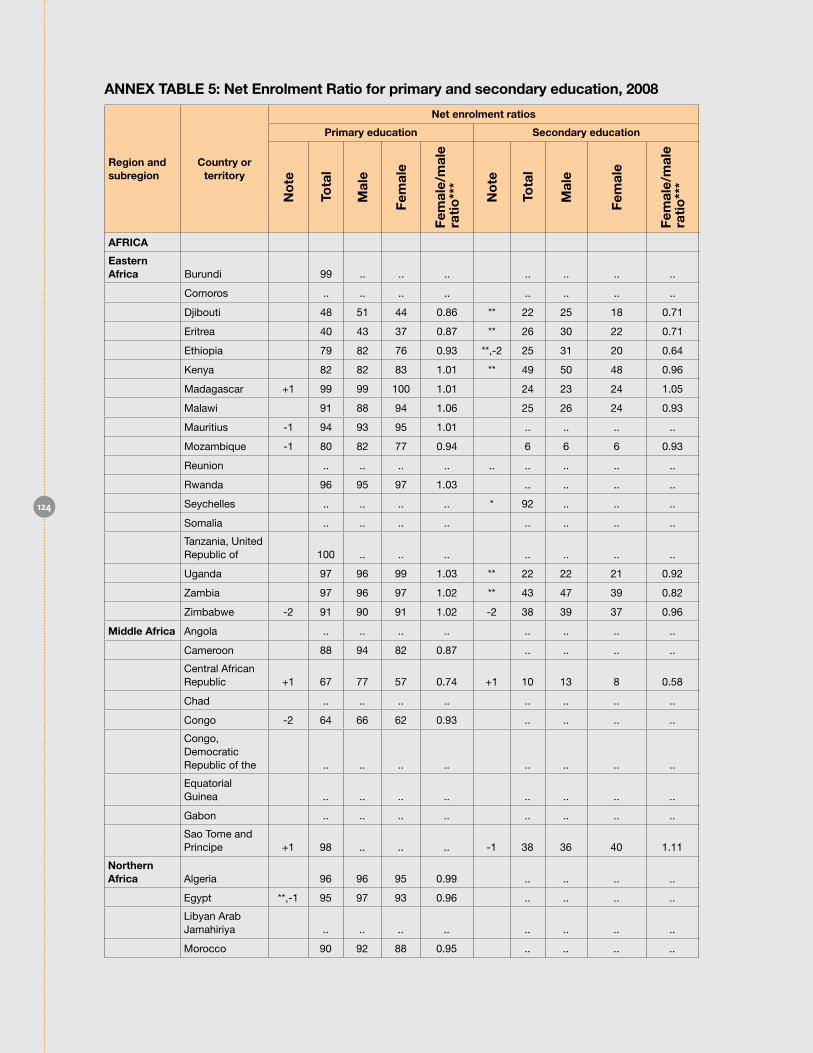
ANNEX TAbLE 5: Net Enrolment Ratio for primary and secondary education, 2008
Region and subregion
Country or territory
Net enrolment ratios
Primary education Secondary education
AFRICA
Eastern Africa Burundi 99 .. .. .. .. .. .. ..
Comoros .. .. .. .. .. .. .. ..
Djibouti 48 51 44 0.86 ** 22 25 18 0.71
Eritrea 40 43 37 0.87 ** 26 30 22 0.71
Ethiopia 79 82 76 0.93 **,-2 25 31 20 0.64
Kenya 82 82 83 1.01 ** 49 50 48 0.96
Madagascar +1 99 99 100 1.01 24 23 24 1.05
Malawi 91 88 94 1.06 25 26 24 0.93
Mauritius -1 94 93 95 1.01 .. .. .. ..
Mozambique -1 80 82 77 0.94 6 6 6 0.93
Reunion .. .. .. .. .. .. .. .. ..
Rwanda 96 95 97 1.03 .. .. .. ..
Seychelles .. .. .. .. * 92 .. .. ..
Somalia .. .. .. .. .. .. .. ..
Tanzania, United Republic of 100 .. .. .. .. .. .. ..
Uganda 97 96 99 1.03 ** 22 22 21 0.92
Zambia 97 96 97 1.02 ** 43 47 39 0.82
Zimbabwe -2 91 90 91 1.02 -2 38 39 37 0.96
Middle Africa Angola .. .. .. .. .. .. .. ..
Cameroon 88 94 82 0.87 .. .. .. ..
Central African Republic +1 67 77 57 0.74 +1 10 13 8 0.58
Chad .. .. .. .. .. .. .. ..
Congo -2 64 66 62 0.93 .. .. .. ..
Congo, Democratic Republic of the .. .. .. .. .. .. .. ..
Equatorial Guinea .. .. .. .. .. .. .. ..
Gabon .. .. .. .. .. .. .. ..
Sao Tome and Principe +1 98 .. .. .. -1 38 36 40 1.11
Northern Africa Algeria 96 96 95 0.99 .. .. .. ..
Egypt **,-1 95 97 93 0.96 .. .. .. ..
Libyan Arab Jamahiriya .. .. .. .. .. .. .. ..
Morocco 90 92 88 0.95 .. .. .. ..
124
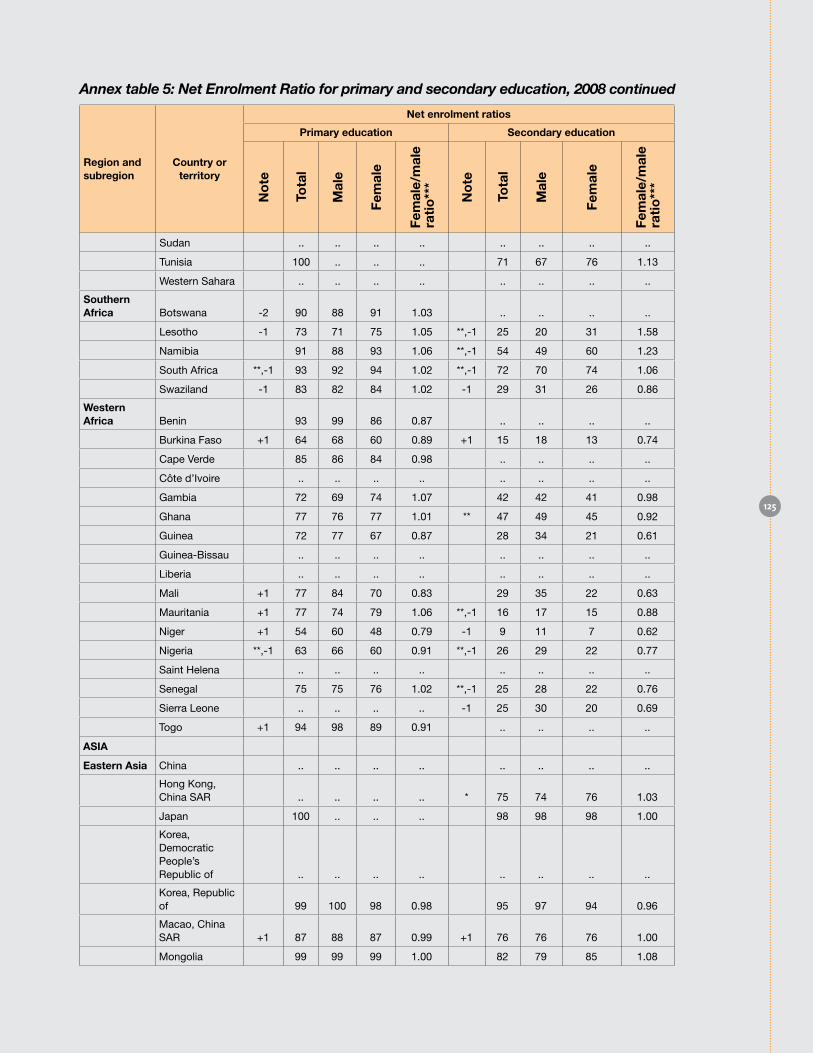
Annex table 5: Net Enrolment Ratio for primary and secondary education, 2008 continued
Region and subregion
Country or territory
Net enrolment ratios
Primary education Secondary education
Sudan .. .. .. .. .. .. .. ..
Tunisia 100 .. .. .. 71 67 76 1.13
Western Sahara .. .. .. .. .. .. .. ..
Southern Africa Botswana -2 90 88 91 1.03 .. .. .. ..
Lesotho -1 73 71 75 1.05 **,-1 25 20 31 1.58
Namibia 91 88 93 1.06 **,-1 54 49 60 1.23
South Africa **,-1 93 92 94 1.02 **,-1 72 70 74 1.06
Swaziland -1 83 82 84 1.02 -1 29 31 26 0.86
Western Africa Benin 93 99 86 0.87 .. .. .. ..
Burkina Faso +1 64 68 60 0.89 +1 15 18 13 0.74
Cape Verde 85 86 84 0.98 .. .. .. ..
Côte d’Ivoire .. .. .. .. .. .. .. ..
Gambia 72 69 74 1.07 42 42 41 0.98
Ghana 77 76 77 1.01 ** 47 49 45 0.92
Guinea 72 77 67 0.87 28 34 21 0.61
Guinea-Bissau .. .. .. .. .. .. .. ..
Liberia .. .. .. .. .. .. .. ..
Mali +1 77 84 70 0.83 29 35 22 0.63
Mauritania +1 77 74 79 1.06 **,-1 16 17 15 0.88
Niger +1 54 60 48 0.79 -1 9 11 7 0.62
Nigeria **,-1 63 66 60 0.91 **,-1 26 29 22 0.77
Saint Helena .. .. .. .. .. .. .. ..
Senegal 75 75 76 1.02 **,-1 25 28 22 0.76
Sierra Leone .. .. .. .. -1 25 30 20 0.69
Togo +1 94 98 89 0.91 .. .. .. ..
ASIA
Eastern Asia China .. .. .. .. .. .. .. ..
Hong Kong, China SAR .. .. .. .. * 75 74 76 1.03
Japan 100 .. .. .. 98 98 98 1.00
Korea, Democratic People’s Republic of .. .. .. .. .. .. .. ..
Korea, Republic of 99 100 98 0.98 95 97 94 0.96
Macao, China SAR +1 87 88 87 0.99 +1 76 76 76 1.00
Mongolia 99 99 99 1.00 82 79 85 1.08
125
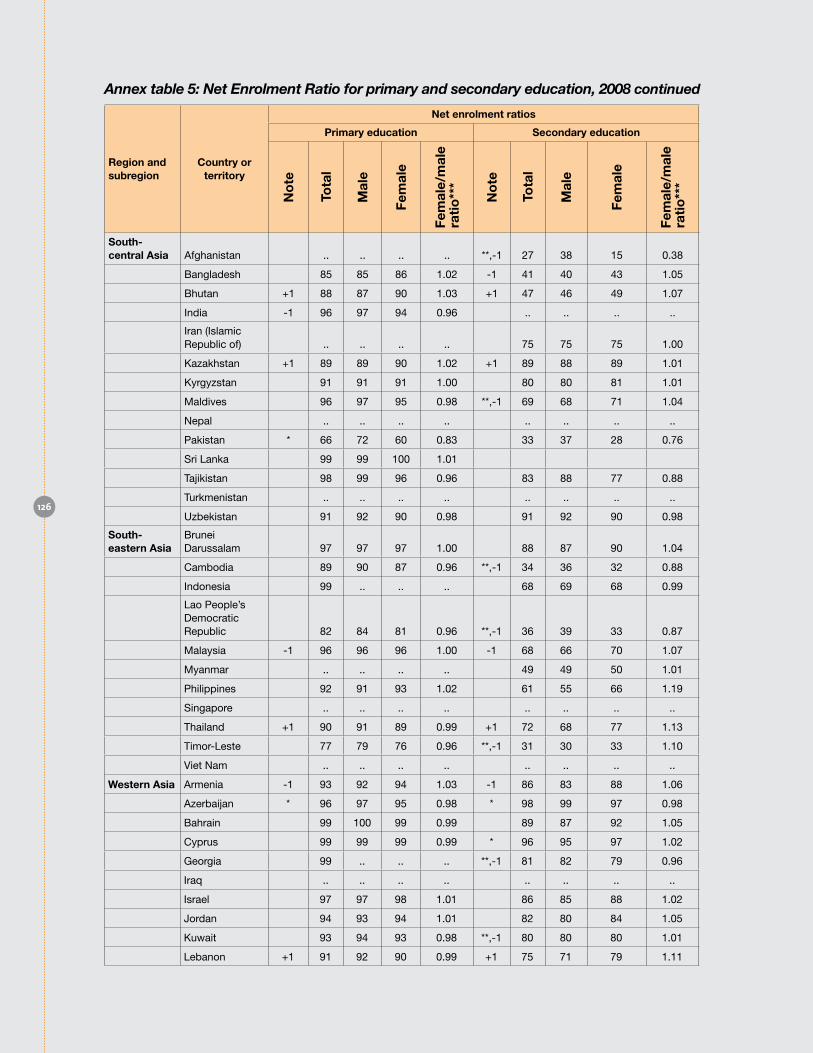
Annex table 5: Net Enrolment Ratio for primary and secondary education, 2008 continued
Region and subregion
Country or territory
Net enrolment ratios
Primary education Secondary education
South-central Asia Afghanistan .. .. .. .. **,-1 27 38 15 0.38
Bangladesh 85 85 86 1.02 -1 41 40 43 1.05
Bhutan +1 88 87 90 1.03 +1 47 46 49 1.07
India -1 96 97 94 0.96 .. .. .. ..
Iran (Islamic Republic of) .. .. .. .. 75 75 75 1.00
Kazakhstan +1 89 89 90 1.02 +1 89 88 89 1.01
Kyrgyzstan 91 91 91 1.00 80 80 81 1.01
Maldives 96 97 95 0.98 **,-1 69 68 71 1.04
Nepal .. .. .. .. .. .. .. ..
Pakistan * 66 72 60 0.83 33 37 28 0.76
Sri Lanka 99 99 100 1.01
Tajikistan 98 99 96 0.96 83 88 77 0.88
Turkmenistan .. .. .. .. .. .. .. ..
Uzbekistan 91 92 90 0.98 91 92 90 0.98
South-eastern Asia
Brunei Darussalam 97 97 97 1.00 88 87 90 1.04
Cambodia 89 90 87 0.96 **,-1 34 36 32 0.88
Indonesia 99 .. .. .. 68 69 68 0.99
Lao People’s Democratic Republic 82 84 81 0.96 **,-1 36 39 33 0.87
Malaysia -1 96 96 96 1.00 -1 68 66 70 1.07
Myanmar .. .. .. .. 49 49 50 1.01
Philippines 92 91 93 1.02 61 55 66 1.19
Singapore .. .. .. .. .. .. .. ..
Thailand +1 90 91 89 0.99 +1 72 68 77 1.13
Timor-Leste 77 79 76 0.96 **,-1 31 30 33 1.10
Viet Nam .. .. .. .. .. .. .. ..
Western Asia Armenia -1 93 92 94 1.03 -1 86 83 88 1.06
Azerbaijan * 96 97 95 0.98 * 98 99 97 0.98
Bahrain 99 100 99 0.99 89 87 92 1.05
Cyprus 99 99 99 0.99 * 96 95 97 1.02
Georgia 99 .. .. .. **,-1 81 82 79 0.96
Iraq .. .. .. .. .. .. .. ..
Israel 97 97 98 1.01 86 85 88 1.02
Jordan 94 93 94 1.01 82 80 84 1.05
Kuwait 93 94 93 0.98 **,-1 80 80 80 1.01
Lebanon +1 91 92 90 0.99 +1 75 71 79 1.11
126

Annex table 5: Net Enrolment Ratio for primary and secondary education, 2008 continued
Region and subregion
Country or territory
Net enrolment ratios
Primary education Secondary education
Occupied Palestinian Territory 77 77 78 1.00 ** 87 85 90 1.07
Oman 72 71 73 1.03 78 79 78 0.99
Qatar .. .. .. .. 79 67 98 1.47
Saudi Arabia 85 85 84 0.99 -1 73* 70** 76** 1.08**
Syrian Arab Republic .. .. .. .. 68 68 67 0.98
Turkey 95 96 94 0.98 74 77 70 0.91
United Arab Emirates -1 99 99 99 1.00 **,-1 84 83 85 1.02
Yemen 73 80 66 0.83 .. .. .. ..
EuRoPE
Eastern Europe Belarus 95 94 96 1.02 -1 87
Bulgaria 97 97 98 1.00 83 85 82 0.97
Czech Republic **,-2 90 88 91 1.03
Hungary 95 95 95 1.00 91 91 91 0.99
Poland -1 96 95 96 1.01 -1 94 93 95 1.02
Republic of Moldova * 90 91 90 0.99 * 83 82 85 1.04
Romania 97 96 97 1.00 73 74 72 0.97
Russian Federation .. .. .. .. .. .. .. ..
Slovakia .. .. .. .. .. .. .. ..
Ukraine * 89 89 90 1.00 85 84* 85* 1.01*
Northern Europe Denmark -1 96 95 97 1.02 -1 90 88 91 1.03
Estonia 97 96 97 1.00 90 88 91 1.03
Faeroe Islands .. .. .. .. .. .. .. ..
Finland 96 96 96 1.00 96 96 97 1.01
Iceland 98 97 98 1.00 90 89 91 1.02
Ireland 97 96 98 1.02 88 86 90 1.05
Latvia .. .. .. .. .. .. .. ..
Lithuania 96 96 96 0.99 92 91 92 1.02
Norway 99 99 99 1.00 96 96 96 1.00
Sweden 95 95 94 0.99 99 99 99 1.00
United Kingdom 100 100 100 1.00 93 92 95 1.03
Southern Europe Albania .. .. .. .. .. .. .. ..
Andorra 82 82 81 0.98 * 71 69 75 1.09
127
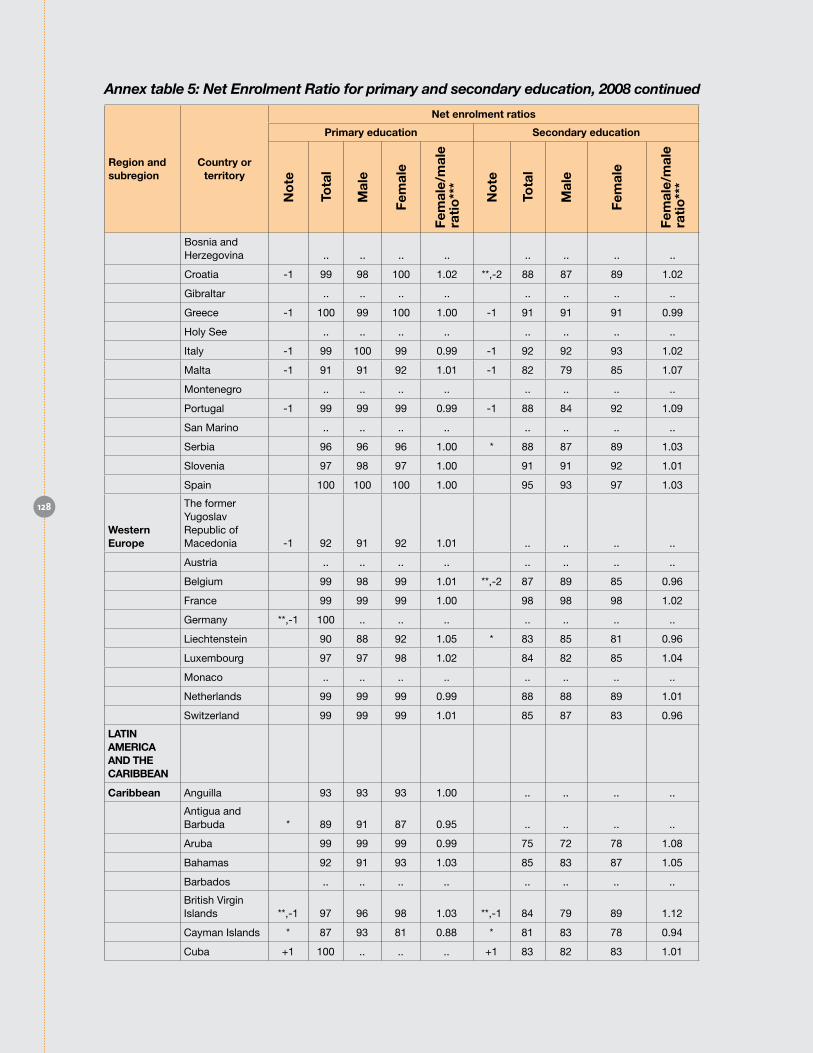
Annex table 5: Net Enrolment Ratio for primary and secondary education, 2008 continued
Region and subregion
Country or territory
Net enrolment ratios
Primary education Secondary education
Bosnia and Herzegovina .. .. .. .. .. .. .. ..
Croatia -1 99 98 100 1.02 **,-2 88 87 89 1.02
Gibraltar .. .. .. .. .. .. .. ..
Greece -1 100 99 100 1.00 -1 91 91 91 0.99
Holy See .. .. .. .. .. .. .. ..
Italy -1 99 100 99 0.99 -1 92 92 93 1.02
Malta -1 91 91 92 1.01 -1 82 79 85 1.07
Montenegro .. .. .. .. .. .. .. ..
Portugal -1 99 99 99 0.99 -1 88 84 92 1.09
San Marino .. .. .. .. .. .. .. ..
Serbia 96 96 96 1.00 * 88 87 89 1.03
Slovenia 97 98 97 1.00 91 91 92 1.01
Spain 100 100 100 1.00 95 93 97 1.03
Western Europe
The former Yugoslav Republic of Macedonia -1 92 91 92 1.01 .. .. .. ..
Austria .. .. .. .. .. .. .. ..
Belgium 99 98 99 1.01 **,-2 87 89 85 0.96
France 99 99 99 1.00 98 98 98 1.02
Germany **,-1 100 .. .. .. .. .. .. ..
Liechtenstein 90 88 92 1.05 * 83 85 81 0.96
Luxembourg 97 97 98 1.02 84 82 85 1.04
Monaco .. .. .. .. .. .. .. ..
Netherlands 99 99 99 0.99 88 88 89 1.01
Switzerland 99 99 99 1.01 85 87 83 0.96
LATIN AMERICA AND THE CARIbbEAN
Caribbean Anguilla 93 93 93 1.00 .. .. .. ..
Antigua and Barbuda * 89 91 87 0.95 .. .. .. ..
Aruba 99 99 99 0.99 75 72 78 1.08
Bahamas 92 91 93 1.03 85 83 87 1.05
Barbados .. .. .. .. .. .. .. ..
British Virgin Islands **,-1 97 96 98 1.03 **,-1 84 79 89 1.12
Cayman Islands * 87 93 81 0.88 * 81 83 78 0.94
Cuba +1 100 .. .. .. +1 83 82 83 1.01
128
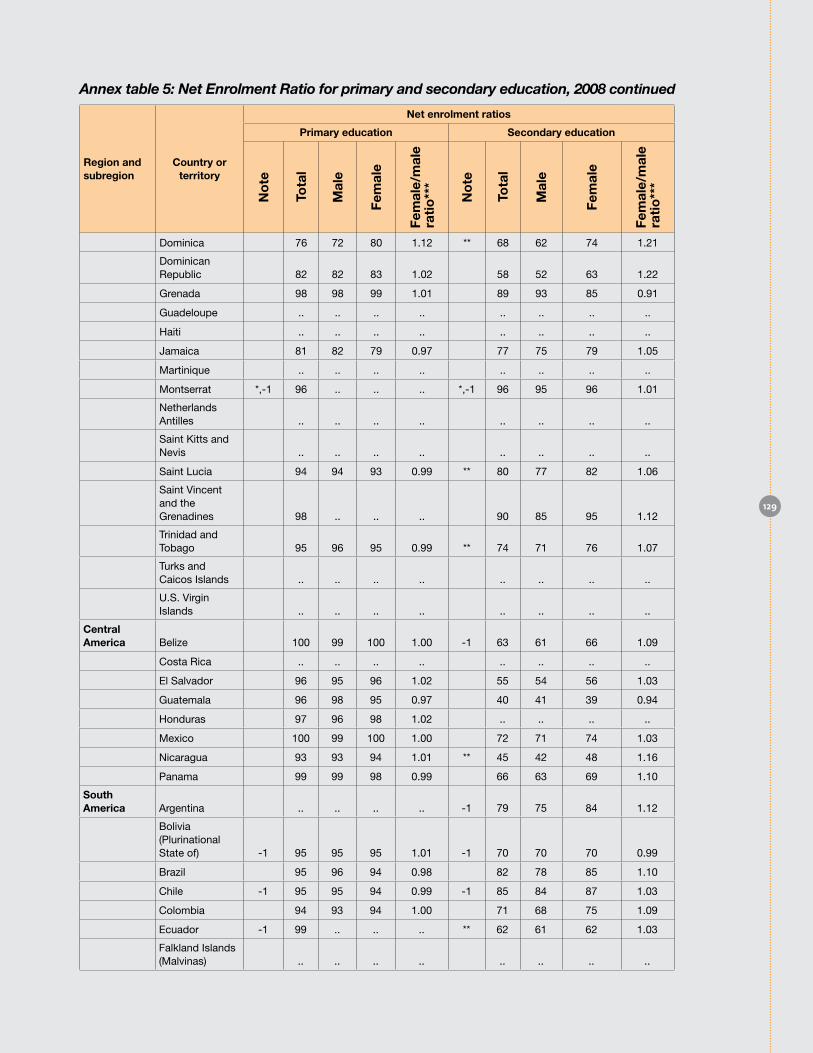
Annex table 5: Net Enrolment Ratio for primary and secondary education, 2008 continued
Region and subregion
Country or territory
Net enrolment ratios
Primary education Secondary education
Dominica 76 72 80 1.12 ** 68 62 74 1.21
Dominican Republic 82 82 83 1.02 58 52 63 1.22
Grenada 98 98 99 1.01 89 93 85 0.91
Guadeloupe .. .. .. .. .. .. .. ..
Haiti .. .. .. .. .. .. .. ..
Jamaica 81 82 79 0.97 77 75 79 1.05
Martinique .. .. .. .. .. .. .. ..
Montserrat *,-1 96 .. .. .. *,-1 96 95 96 1.01
Netherlands Antilles .. .. .. .. .. .. .. ..
Saint Kitts and Nevis .. .. .. .. .. .. .. ..
Saint Lucia 94 94 93 0.99 ** 80 77 82 1.06
Saint Vincent and the Grenadines 98 .. .. .. 90 85 95 1.12
Trinidad and Tobago 95 96 95 0.99 ** 74 71 76 1.07
Turks and Caicos Islands .. .. .. .. .. .. .. ..
U.S. Virgin Islands .. .. .. .. .. .. .. ..
Central America Belize 100 99 100 1.00 -1 63 61 66 1.09
Costa Rica .. .. .. .. .. .. .. ..
El Salvador 96 95 96 1.02 55 54 56 1.03
Guatemala 96 98 95 0.97 40 41 39 0.94
Honduras 97 96 98 1.02 .. .. .. ..
Mexico 100 99 100 1.00 72 71 74 1.03
Nicaragua 93 93 94 1.01 ** 45 42 48 1.16
Panama 99 99 98 0.99 66 63 69 1.10
South America Argentina .. .. .. .. -1 79 75 84 1.12
Bolivia (Plurinational State of) -1 95 95 95 1.01 -1 70 70 70 0.99
Brazil 95 96 94 0.98 82 78 85 1.10
Chile -1 95 95 94 0.99 -1 85 84 87 1.03
Colombia 94 93 94 1.00 71 68 75 1.09
Ecuador -1 99 .. .. .. ** 62 61 62 1.03
Falkland Islands (Malvinas) .. .. .. .. .. .. .. ..
129
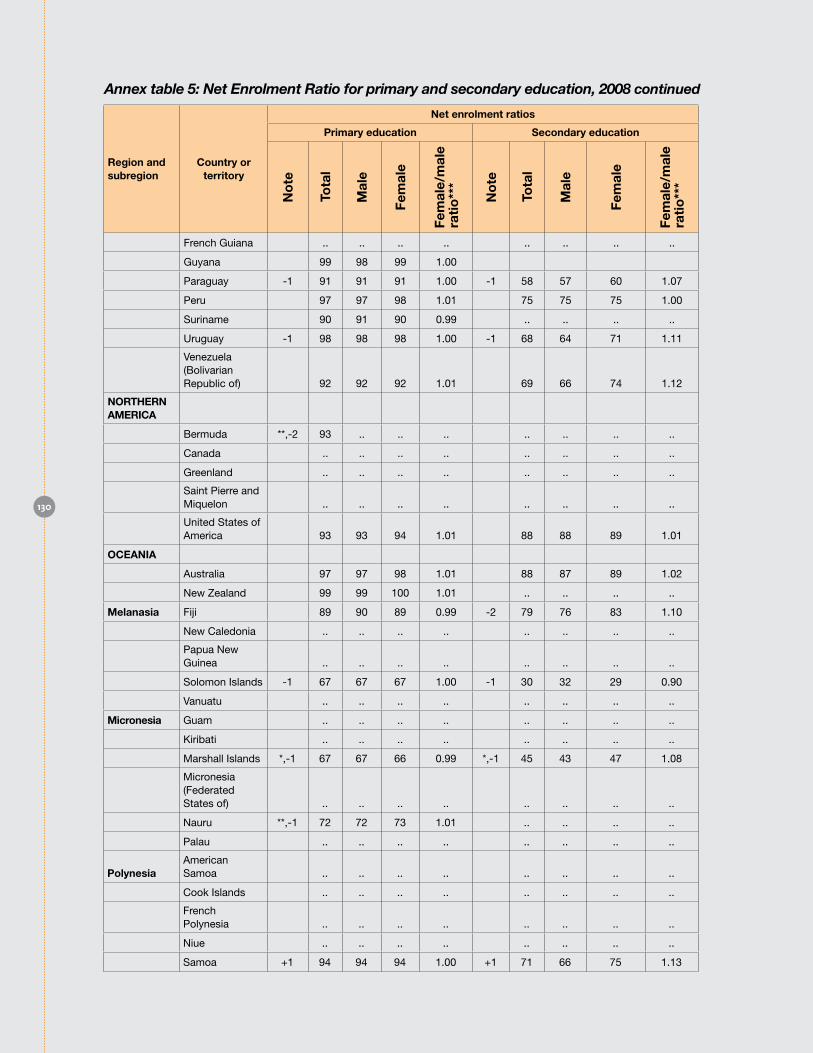
Annex table 5: Net Enrolment Ratio for primary and secondary education, 2008 continued
Region and subregion
Country or territory
Net enrolment ratios
Primary education Secondary education
French Guiana .. .. .. .. .. .. .. ..
Guyana 99 98 99 1.00
Paraguay -1 91 91 91 1.00 -1 58 57 60 1.07
Peru 97 97 98 1.01 75 75 75 1.00
Suriname 90 91 90 0.99 .. .. .. ..
Uruguay -1 98 98 98 1.00 -1 68 64 71 1.11
Venezuela (Bolivarian Republic of) 92 92 92 1.01 69 66 74 1.12
NoRTHERN AMERICA
Bermuda **,-2 93 .. .. .. .. .. .. ..
Canada .. .. .. .. .. .. .. ..
Greenland .. .. .. .. .. .. .. ..
Saint Pierre and Miquelon .. .. .. .. .. .. .. ..
United States of America 93 93 94 1.01 88 88 89 1.01
oCEANIA
Australia 97 97 98 1.01 88 87 89 1.02
New Zealand 99 99 100 1.01 .. .. .. ..
Melanasia Fiji 89 90 89 0.99 -2 79 76 83 1.10
New Caledonia .. .. .. .. .. .. .. ..
Papua New Guinea .. .. .. .. .. .. .. ..
Solomon Islands -1 67 67 67 1.00 -1 30 32 29 0.90
Vanuatu .. .. .. .. .. .. .. ..
Micronesia Guam .. .. .. .. .. .. .. ..
Kiribati .. .. .. .. .. .. .. ..
Marshall Islands *,-1 67 67 66 0.99 *,-1 45 43 47 1.08
Micronesia (Federated States of) .. .. .. .. .. .. .. ..
Nauru **,-1 72 72 73 1.01 .. .. .. ..
Palau .. .. .. .. .. .. .. ..
PolynesiaAmerican Samoa .. .. .. .. .. .. .. ..
Cook Islands .. .. .. .. .. .. .. ..
French Polynesia .. .. .. .. .. .. .. ..
Niue .. .. .. .. .. .. .. ..
Samoa +1 94 94 94 1.00 +1 71 66 75 1.13
130
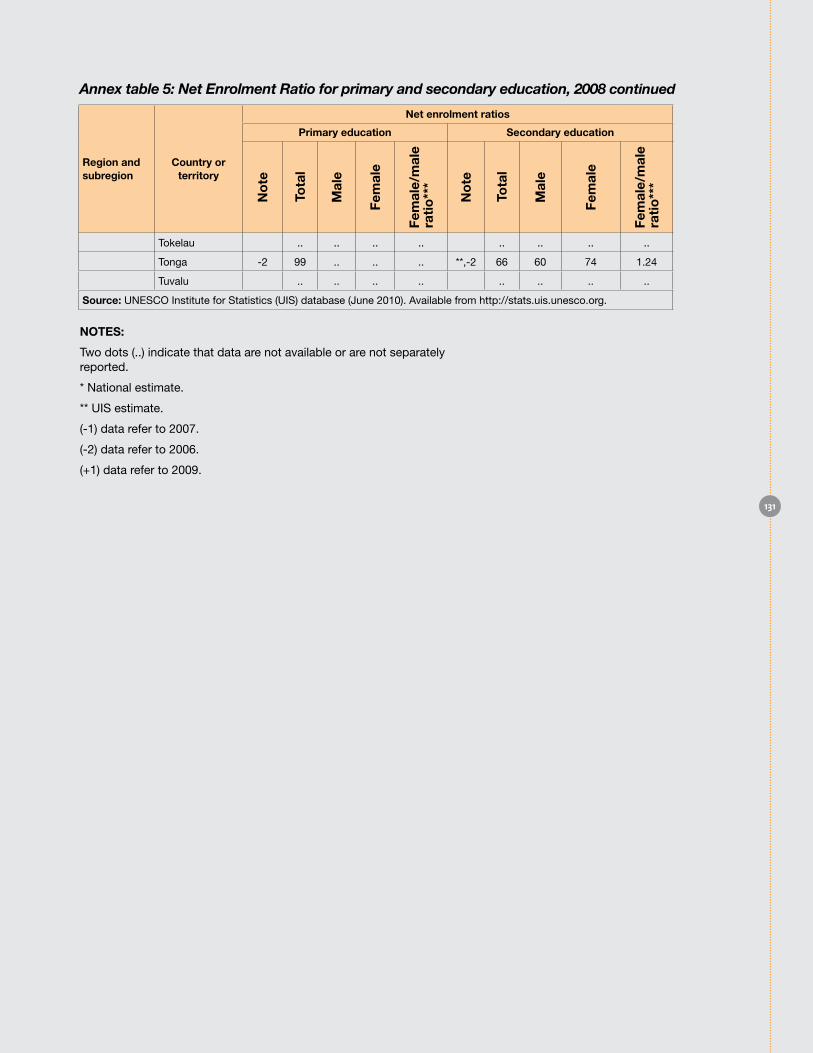
Annex table 5: Net Enrolment Ratio for primary and secondary education, 2008 continued
Region and subregion
Country or territory
Net enrolment ratios
Primary education Secondary education
Tokelau .. .. .. .. .. .. .. ..
Tonga -2 99 .. .. .. **,-2 66 60 74 1.24
Tuvalu .. .. .. .. .. .. .. ..
Source: UNESCO Institute for Statistics (UIS) database (June 2010). Available from http://stats.uis.unesco.org.
NoTES:
Two dots (..) indicate that data are not available or are not separately reported.
* National estimate.
** UIS estimate.
(-1) data refer to 2007.
(-2) data refer to 2006.
(+1) data refer to 2009.
131
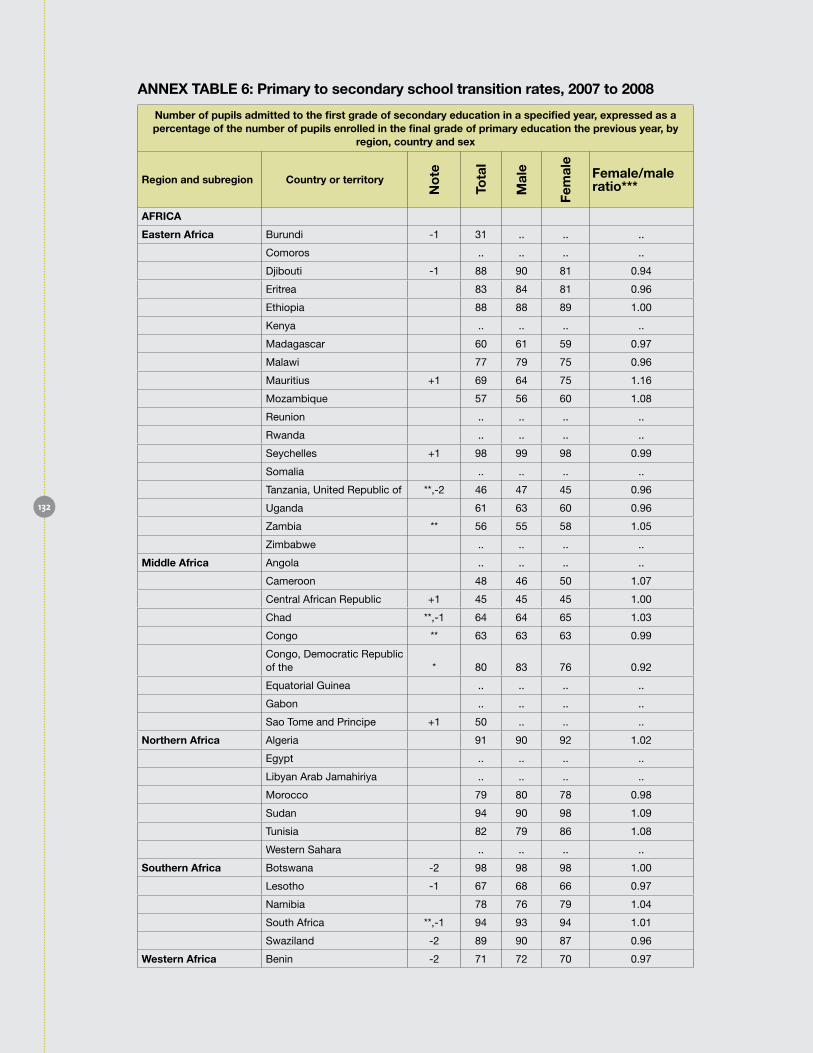
ANNEX TAbLE 6: Primary to secondary school transition rates, 2007 to 2008
Number of pupils admitted to the first grade of secondary education in a specified year, expressed as a percentage of the number of pupils enrolled in the final grade of primary education the previous year, by
region, country and sex
Region and subregion Country or territory
AFRICA
Eastern Africa Burundi -1 31 .. .. ..
Comoros .. .. .. ..
Djibouti -1 88 90 81 0.94
Eritrea 83 84 81 0.96
Ethiopia 88 88 89 1.00
Kenya .. .. .. ..
Madagascar 60 61 59 0.97
Malawi 77 79 75 0.96
Mauritius +1 69 64 75 1.16
Mozambique 57 56 60 1.08
Reunion .. .. .. ..
Rwanda .. .. .. ..
Seychelles +1 98 99 98 0.99
Somalia .. .. .. ..
Tanzania, United Republic of **,-2 46 47 45 0.96
Uganda 61 63 60 0.96
Zambia ** 56 55 58 1.05
Zimbabwe .. .. .. ..
Middle Africa Angola .. .. .. ..
Cameroon 48 46 50 1.07
Central African Republic +1 45 45 45 1.00
Chad **,-1 64 64 65 1.03
Congo ** 63 63 63 0.99
Congo, Democratic Republic of the * 80 83 76 0.92
Equatorial Guinea .. .. .. ..
Gabon .. .. .. ..
Sao Tome and Principe +1 50 .. .. ..
Northern Africa Algeria 91 90 92 1.02
Egypt .. .. .. ..
Libyan Arab Jamahiriya .. .. .. ..
Morocco 79 80 78 0.98
Sudan 94 90 98 1.09
Tunisia 82 79 86 1.08
Western Sahara .. .. .. ..
Southern Africa Botswana -2 98 98 98 1.00
Lesotho -1 67 68 66 0.97
Namibia 78 76 79 1.04
South Africa **,-1 94 93 94 1.01
Swaziland -2 89 90 87 0.96
Western Africa Benin -2 71 72 70 0.97
132

Annex table 6: Primary to secondary school transition rates, 2007 to 2008 continued
Number of pupils admitted to the first grade of secondary education in a specified year, expressed as a percentage of the number of pupils enrolled in the final grade of primary education the previous year, by
region, country and sex
Region and subregion Country or territory
Burkina Faso +1 49 52 45 0.88
Cape Verde 86 84 87 1.04
Côte d’Ivoire 47 50 43 0.85
Gambia ** 84 84 84 1.00
Ghana 98 97 98 1.01
Guinea 31 34 26 0.75
Guinea-Bissau .. .. .. ..
Liberia .. .. .. ..
Mali +1 70 72 68 0.95
Mauritania +1 34 38 31 0.81
Niger +1 47 49 44 0.90
Nigeria .. .. .. ..
Saint Helena .. .. .. ..
Senegal 62 65 58 0.89
Sierra Leone .. .. .. ..
Togo -1 53 56 49 0.87
ASIA
Eastern Asia China 95 95 96 1.01
Hong Kong, China SAR 100 100 100 1.00
Japan .. .. .. ..
Korea, Democratic People’s Republic of .. .. .. ..
Korea, Republic of 100 100 100 1.00
Macao, China SAR +1 91 89 94 1.05
Mongolia 97 96 98 1.02
South-central Asia Afghanistan .. .. .. ..
Bangladesh -2 97 95 100 1.06
Bhutan +1 98 95 100 1.05
India -1 85 86 84 0.98
Iran (Islamic Republic of) ** 79 84 74 0.88
Kazakhstan +1 100 100 100 1.00
Kyrgyzstan 100 100 100 1.00
Maldives 87 83 92 1.10
Nepal 81 81 81 1.00
Pakistan 73 73 71 0.97
Sri Lanka 98 97 99 1.01
Tajikistan 98 .. .. ..
Turkmenistan .. .. .. ..
Uzbekistan 100 100 100 1.00
South-eastern Asia Brunei Darussalam 99 100 99 1.00
Cambodia 79 80 79 0.99
Indonesia 90 86 93 1.08
133
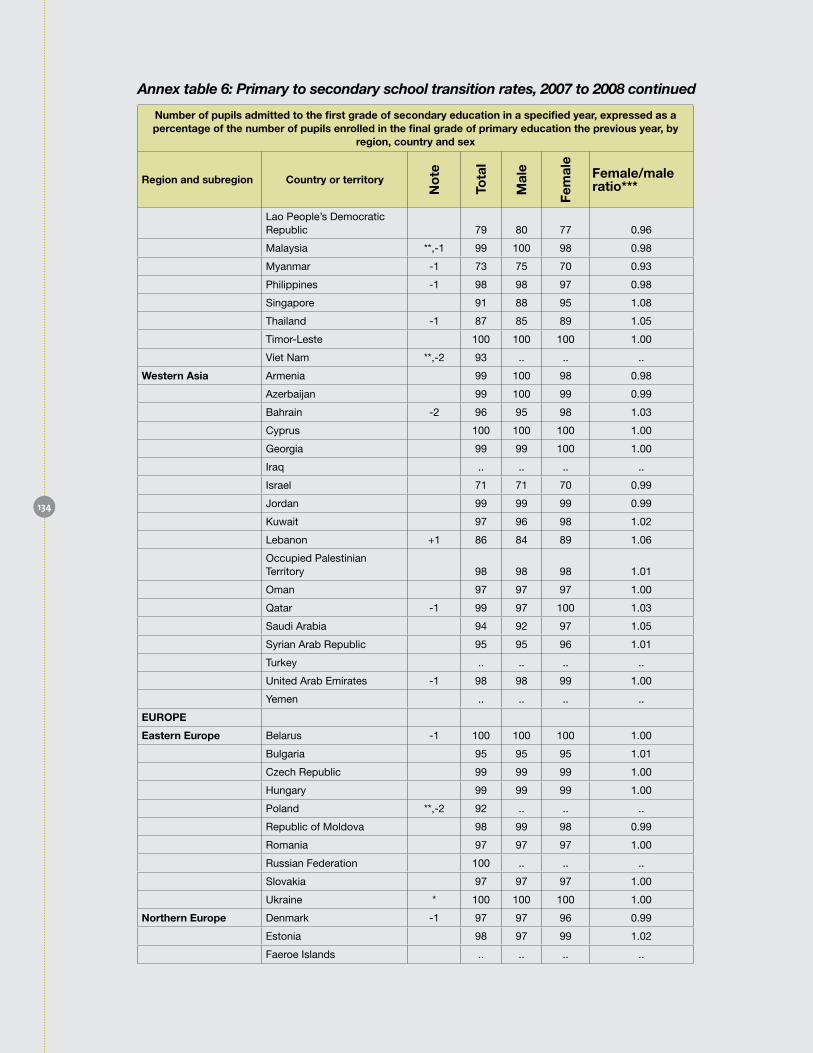
Annex table 6: Primary to secondary school transition rates, 2007 to 2008 continued
Number of pupils admitted to the first grade of secondary education in a specified year, expressed as a percentage of the number of pupils enrolled in the final grade of primary education the previous year, by
region, country and sex
Region and subregion Country or territory
Lao People’s Democratic Republic 79 80 77 0.96
Malaysia **,-1 99 100 98 0.98
Myanmar -1 73 75 70 0.93
Philippines -1 98 98 97 0.98
Singapore 91 88 95 1.08
Thailand -1 87 85 89 1.05
Timor-Leste 100 100 100 1.00
Viet Nam **,-2 93 .. .. ..
Western Asia Armenia 99 100 98 0.98
Azerbaijan 99 100 99 0.99
Bahrain -2 96 95 98 1.03
Cyprus 100 100 100 1.00
Georgia 99 99 100 1.00
Iraq .. .. .. ..
Israel 71 71 70 0.99
Jordan 99 99 99 0.99
Kuwait 97 96 98 1.02
Lebanon +1 86 84 89 1.06
Occupied Palestinian Territory 98 98 98 1.01
Oman 97 97 97 1.00
Qatar -1 99 97 100 1.03
Saudi Arabia 94 92 97 1.05
Syrian Arab Republic 95 95 96 1.01
Turkey .. .. .. ..
United Arab Emirates -1 98 98 99 1.00
Yemen .. .. .. ..
EuRoPE
Eastern Europe Belarus -1 100 100 100 1.00
Bulgaria 95 95 95 1.01
Czech Republic 99 99 99 1.00
Hungary 99 99 99 1.00
Poland **,-2 92 .. .. ..
Republic of Moldova 98 99 98 0.99
Romania 97 97 97 1.00
Russian Federation 100 .. .. ..
Slovakia 97 97 97 1.00
Ukraine * 100 100 100 1.00
Northern Europe Denmark -1 97 97 96 0.99
Estonia 98 97 99 1.02
Faeroe Islands .. .. .. ..
134

Annex table 6: Primary to secondary school transition rates, 2007 to 2008 continued
Number of pupils admitted to the first grade of secondary education in a specified year, expressed as a percentage of the number of pupils enrolled in the final grade of primary education the previous year, by
region, country and sex
Region and subregion Country or territory
Finland 100 100 100 1.00
Iceland 100 100 100 1.00
Ireland .. .. .. ..
Latvia 94 92 97 1.05
Lithuania 99 99 99 1.00
Norway 100 100 100 1.00
Sweden 100 100 100 1.00
United Kingdom .. .. .. ..
Southern Europe Albania .. .. .. ..
Andorra .. .. .. ..
Bosnia and Herzegovina .. .. .. ..
Croatia -1 100 99 100 1.01
Gibraltar .. .. .. ..
Greece -1 97 .. .. ..
Holy See .. .. .. ..
Italy -1 100 100 99 0.99
Malta .. .. .. ..
Montenegro .. .. .. ..
Portugal .. .. .. ..
San Marino .. .. .. ..
Serbia 99 99 99 1.00
Slovenia .. .. .. ..
Spain .. .. .. ..
The former Yugoslav Republic of Macedonia 99 99 100 1.01
Western Europe Austria 100 100 99 0.99
Belgium 99 100 99 0.99
France .. .. .. ..
Germany 99 99 99 1.00
Liechtenstein 99 100 97 0.97
Luxembourg .. .. .. ..
Monaco .. .. .. ..
Netherlands .. .. .. ..
Switzerland 99 .. .. ..
LATIN AMERICA AND THE CARIbbEAN
Caribbean Anguilla .. .. .. ..
Antigua and Barbuda .. .. .. ..
Aruba -1 97 95 100 1.06
Bahamas 100 100 100 1.00
Barbados * 99 .. .. ..
British Virgin Islands -1 95 100 91 0.91
135
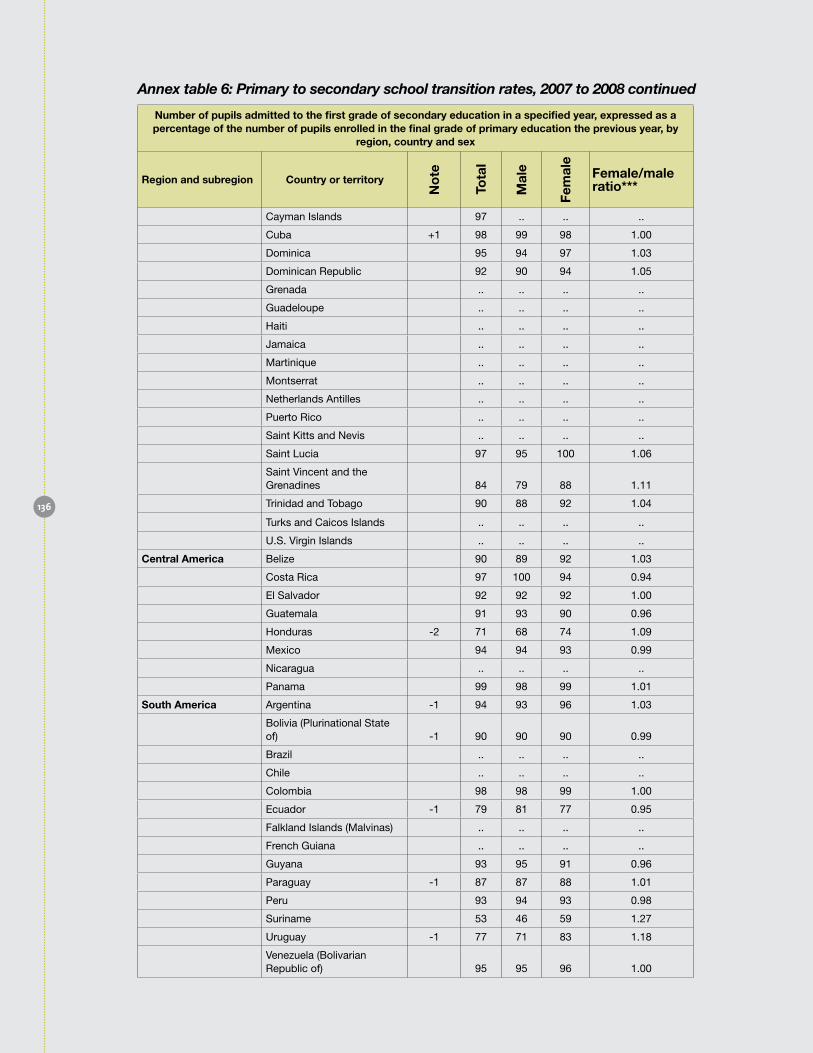
Annex table 6: Primary to secondary school transition rates, 2007 to 2008 continued
Number of pupils admitted to the first grade of secondary education in a specified year, expressed as a percentage of the number of pupils enrolled in the final grade of primary education the previous year, by
region, country and sex
Region and subregion Country or territory
Cayman Islands 97 .. .. ..
Cuba +1 98 99 98 1.00
Dominica 95 94 97 1.03
Dominican Republic 92 90 94 1.05
Grenada .. .. .. ..
Guadeloupe .. .. .. ..
Haiti .. .. .. ..
Jamaica .. .. .. ..
Martinique .. .. .. ..
Montserrat .. .. .. ..
Netherlands Antilles .. .. .. ..
Puerto Rico .. .. .. ..
Saint Kitts and Nevis .. .. .. ..
Saint Lucia 97 95 100 1.06
Saint Vincent and the Grenadines 84 79 88 1.11
Trinidad and Tobago 90 88 92 1.04
Turks and Caicos Islands .. .. .. ..
U.S. Virgin Islands .. .. .. ..
Central America Belize 90 89 92 1.03
Costa Rica 97 100 94 0.94
El Salvador 92 92 92 1.00
Guatemala 91 93 90 0.96
Honduras -2 71 68 74 1.09
Mexico 94 94 93 0.99
Nicaragua .. .. .. ..
Panama 99 98 99 1.01
South America Argentina -1 94 93 96 1.03
Bolivia (Plurinational State of) -1 90 90 90 0.99
Brazil .. .. .. ..
Chile .. .. .. ..
Colombia 98 98 99 1.00
Ecuador -1 79 81 77 0.95
Falkland Islands (Malvinas) .. .. .. ..
French Guiana .. .. .. ..
Guyana 93 95 91 0.96
Paraguay -1 87 87 88 1.01
Peru 93 94 93 0.98
Suriname 53 46 59 1.27
Uruguay -1 77 71 83 1.18
Venezuela (Bolivarian Republic of) 95 95 96 1.00
136
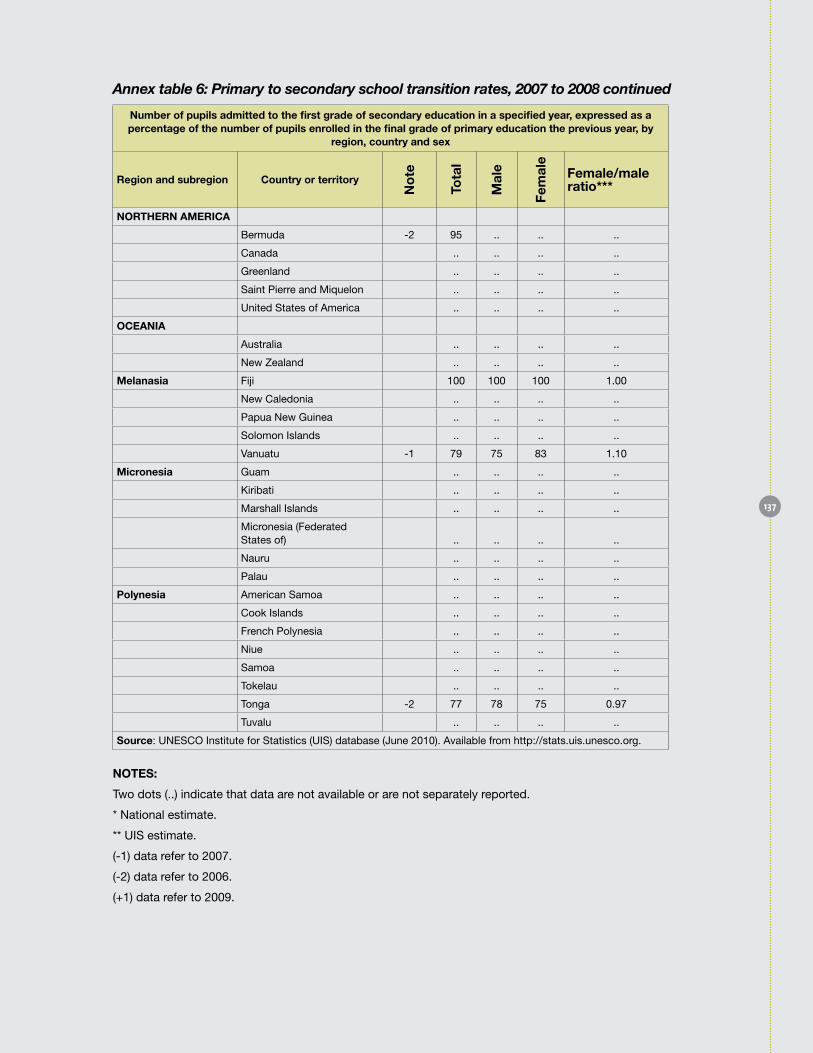
Annex table 6: Primary to secondary school transition rates, 2007 to 2008 continued
Number of pupils admitted to the first grade of secondary education in a specified year, expressed as a percentage of the number of pupils enrolled in the final grade of primary education the previous year, by
region, country and sex
Region and subregion Country or territory
NoRTHERN AMERICA
Bermuda -2 95 .. .. ..
Canada .. .. .. ..
Greenland .. .. .. ..
Saint Pierre and Miquelon .. .. .. ..
United States of America .. .. .. ..
oCEANIA
Australia .. .. .. ..
New Zealand .. .. .. ..
Melanasia Fiji 100 100 100 1.00
New Caledonia .. .. .. ..
Papua New Guinea .. .. .. ..
Solomon Islands .. .. .. ..
Vanuatu -1 79 75 83 1.10
Micronesia Guam .. .. .. ..
Kiribati .. .. .. ..
Marshall Islands .. .. .. ..
Micronesia (Federated States of) .. .. .. ..
Nauru .. .. .. ..
Palau .. .. .. ..
Polynesia American Samoa .. .. .. ..
Cook Islands .. .. .. ..
French Polynesia .. .. .. ..
Niue .. .. .. ..
Samoa .. .. .. ..
Tokelau .. .. .. ..
Tonga -2 77 78 75 0.97
Tuvalu .. .. .. ..
Source: UNESCO Institute for Statistics (UIS) database (June 2010). Available from http://stats.uis.unesco.org.
NoTES:
Two dots (..) indicate that data are not available or are not separately reported.
* National estimate.
** UIS estimate.
(-1) data refer to 2007.
(-2) data refer to 2006.
(+1) data refer to 2009.
137
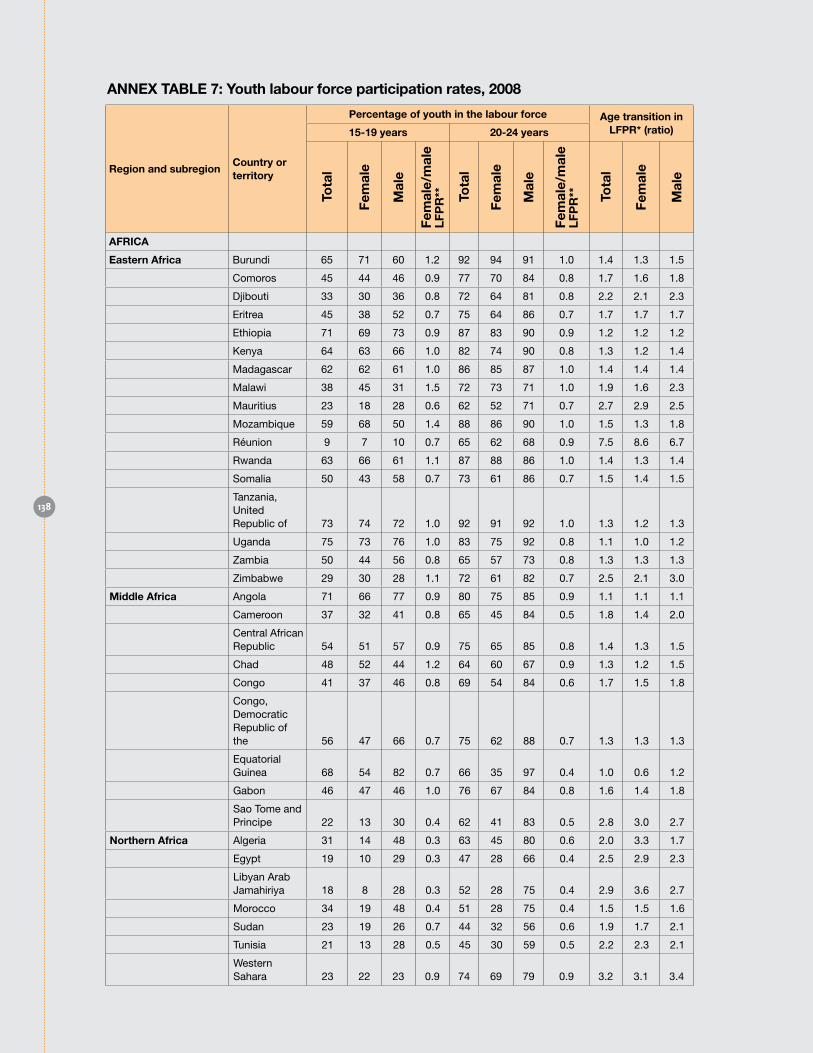
ANNEX TAbLE 7: Youth labour force participation rates, 2008
Region and subregionCountry or territory
Percentage of youth in the labour force Age transition in LFPR* (ratio)15-19 years 20-24 years
AFRICA
Eastern Africa Burundi 65 71 60 1.2 92 94 91 1.0 1.4 1.3 1.5
Comoros 45 44 46 0.9 77 70 84 0.8 1.7 1.6 1.8
Djibouti 33 30 36 0.8 72 64 81 0.8 2.2 2.1 2.3
Eritrea 45 38 52 0.7 75 64 86 0.7 1.7 1.7 1.7
Ethiopia 71 69 73 0.9 87 83 90 0.9 1.2 1.2 1.2
Kenya 64 63 66 1.0 82 74 90 0.8 1.3 1.2 1.4
Madagascar 62 62 61 1.0 86 85 87 1.0 1.4 1.4 1.4
Malawi 38 45 31 1.5 72 73 71 1.0 1.9 1.6 2.3
Mauritius 23 18 28 0.6 62 52 71 0.7 2.7 2.9 2.5
Mozambique 59 68 50 1.4 88 86 90 1.0 1.5 1.3 1.8
Réunion 9 7 10 0.7 65 62 68 0.9 7.5 8.6 6.7
Rwanda 63 66 61 1.1 87 88 86 1.0 1.4 1.3 1.4
Somalia 50 43 58 0.7 73 61 86 0.7 1.5 1.4 1.5
Tanzania, United Republic of 73 74 72 1.0 92 91 92 1.0 1.3 1.2 1.3
Uganda 75 73 76 1.0 83 75 92 0.8 1.1 1.0 1.2
Zambia 50 44 56 0.8 65 57 73 0.8 1.3 1.3 1.3
Zimbabwe 29 30 28 1.1 72 61 82 0.7 2.5 2.1 3.0
Middle Africa Angola 71 66 77 0.9 80 75 85 0.9 1.1 1.1 1.1
Cameroon 37 32 41 0.8 65 45 84 0.5 1.8 1.4 2.0
Central African Republic 54 51 57 0.9 75 65 85 0.8 1.4 1.3 1.5
Chad 48 52 44 1.2 64 60 67 0.9 1.3 1.2 1.5
Congo 41 37 46 0.8 69 54 84 0.6 1.7 1.5 1.8
Congo, Democratic Republic of the 56 47 66 0.7 75 62 88 0.7 1.3 1.3 1.3
Equatorial Guinea 68 54 82 0.7 66 35 97 0.4 1.0 0.6 1.2
Gabon 46 47 46 1.0 76 67 84 0.8 1.6 1.4 1.8
Sao Tome and Principe 22 13 30 0.4 62 41 83 0.5 2.8 3.0 2.7
Northern Africa Algeria 31 14 48 0.3 63 45 80 0.6 2.0 3.3 1.7
Egypt 19 10 29 0.3 47 28 66 0.4 2.5 2.9 2.3
Libyan Arab Jamahiriya 18 8 28 0.3 52 28 75 0.4 2.9 3.6 2.7
Morocco 34 19 48 0.4 51 28 75 0.4 1.5 1.5 1.6
Sudan 23 19 26 0.7 44 32 56 0.6 1.9 1.7 2.1
Tunisia 21 13 28 0.5 45 30 59 0.5 2.2 2.3 2.1
Western Sahara 23 22 23 0.9 74 69 79 0.9 3.2 3.1 3.4
138
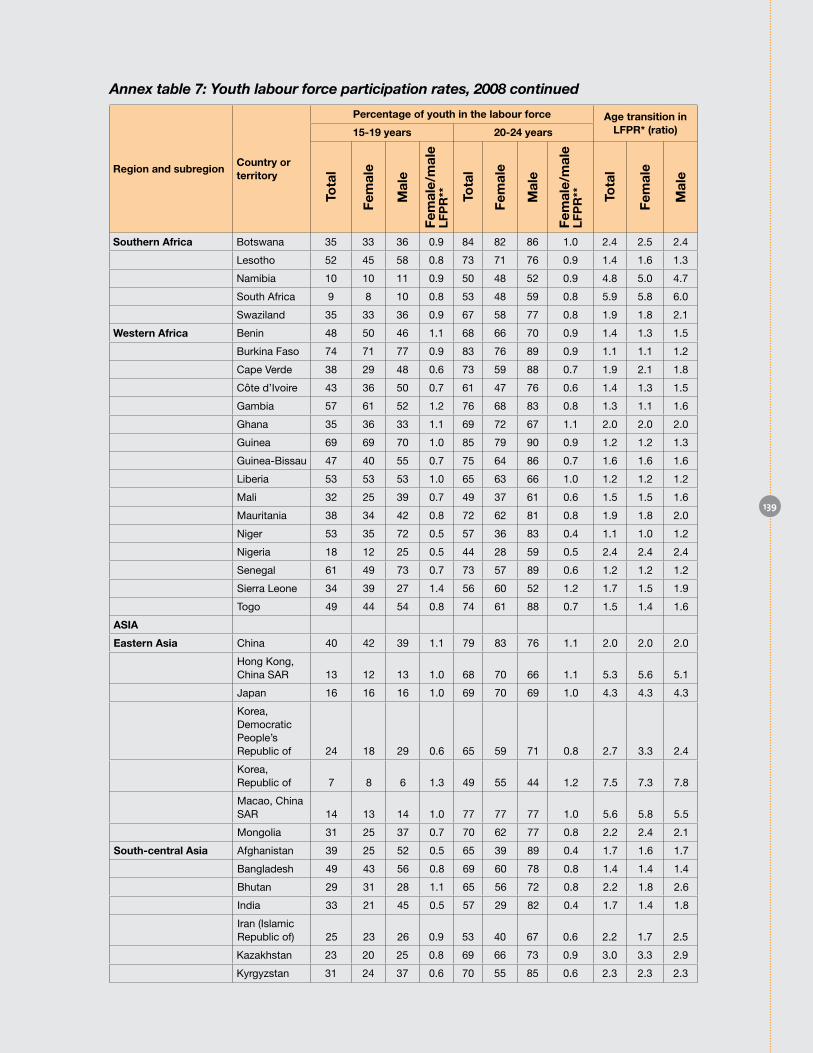
Annex table 7: Youth labour force participation rates, 2008 continued
Region and subregionCountry or territory
Percentage of youth in the labour force Age transition in LFPR* (ratio)15-19 years 20-24 years
Southern Africa Botswana 35 33 36 0.9 84 82 86 1.0 2.4 2.5 2.4
Lesotho 52 45 58 0.8 73 71 76 0.9 1.4 1.6 1.3
Namibia 10 10 11 0.9 50 48 52 0.9 4.8 5.0 4.7
South Africa 9 8 10 0.8 53 48 59 0.8 5.9 5.8 6.0
Swaziland 35 33 36 0.9 67 58 77 0.8 1.9 1.8 2.1
Western Africa Benin 48 50 46 1.1 68 66 70 0.9 1.4 1.3 1.5
Burkina Faso 74 71 77 0.9 83 76 89 0.9 1.1 1.1 1.2
Cape Verde 38 29 48 0.6 73 59 88 0.7 1.9 2.1 1.8
Côte d’Ivoire 43 36 50 0.7 61 47 76 0.6 1.4 1.3 1.5
Gambia 57 61 52 1.2 76 68 83 0.8 1.3 1.1 1.6
Ghana 35 36 33 1.1 69 72 67 1.1 2.0 2.0 2.0
Guinea 69 69 70 1.0 85 79 90 0.9 1.2 1.2 1.3
Guinea-Bissau 47 40 55 0.7 75 64 86 0.7 1.6 1.6 1.6
Liberia 53 53 53 1.0 65 63 66 1.0 1.2 1.2 1.2
Mali 32 25 39 0.7 49 37 61 0.6 1.5 1.5 1.6
Mauritania 38 34 42 0.8 72 62 81 0.8 1.9 1.8 2.0
Niger 53 35 72 0.5 57 36 83 0.4 1.1 1.0 1.2
Nigeria 18 12 25 0.5 44 28 59 0.5 2.4 2.4 2.4
Senegal 61 49 73 0.7 73 57 89 0.6 1.2 1.2 1.2
Sierra Leone 34 39 27 1.4 56 60 52 1.2 1.7 1.5 1.9
Togo 49 44 54 0.8 74 61 88 0.7 1.5 1.4 1.6
ASIA
Eastern Asia China 40 42 39 1.1 79 83 76 1.1 2.0 2.0 2.0
Hong Kong, China SAR 13 12 13 1.0 68 70 66 1.1 5.3 5.6 5.1
Japan 16 16 16 1.0 69 70 69 1.0 4.3 4.3 4.3
Korea, Democratic People’s Republic of 24 18 29 0.6 65 59 71 0.8 2.7 3.3 2.4
Korea, Republic of 7 8 6 1.3 49 55 44 1.2 7.5 7.3 7.8
Macao, China SAR 14 13 14 1.0 77 77 77 1.0 5.6 5.8 5.5
Mongolia 31 25 37 0.7 70 62 77 0.8 2.2 2.4 2.1
South-central Asia Afghanistan 39 25 52 0.5 65 39 89 0.4 1.7 1.6 1.7
Bangladesh 49 43 56 0.8 69 60 78 0.8 1.4 1.4 1.4
Bhutan 29 31 28 1.1 65 56 72 0.8 2.2 1.8 2.6
India 33 21 45 0.5 57 29 82 0.4 1.7 1.4 1.8
Iran (Islamic Republic of) 25 23 26 0.9 53 40 67 0.6 2.2 1.7 2.5
Kazakhstan 23 20 25 0.8 69 66 73 0.9 3.0 3.3 2.9
Kyrgyzstan 31 24 37 0.6 70 55 85 0.6 2.3 2.3 2.3
139

Annex table 7: Youth labour force participation rates, 2008 continued
Region and subregionCountry or territory
Percentage of youth in the labour force Age transition in LFPR* (ratio)15-19 years 20-24 years
Maldives 33 31 35 0.9 74 66 81 0.8 2.2 2.1 2.3
Nepal 49 49 48 1.0 70 65 75 0.9 1.4 1.3 1.6
Pakistan 37 16 56 0.3 55 21 87 0.2 1.5 1.3 1.5
Sri Lanka 20 13 26 0.5 62 45 79 0.6 3.1 3.4 3.0
Tajikistan 61 59 64 0.9 58 49 68 0.7 0.9 0.8 1.1
Turkmenistan 26 24 28 0.9 72 65 80 0.8 2.8 2.7 2.9
Uzbekistan 32 30 33 0.9 66 57 75 0.8 2.1 1.9 2.3
South-eastern AsiaBrunei Darussalam 18 18 19 0.9 75 69 80 0.9 4.1 4.0 4.3
Cambodia 63 63 63 1.0 81 78 84 0.9 1.3 1.2 1.3
Indonesia 35 30 41 0.7 69 54 84 0.6 1.9 1.8 2.1
Lao People’s Democratic Republic 47 57 37 1.5 84 90 79 1.1 1.8 1.6 2.1
Malaysia 22 17 27 0.6 72 62 83 0.7 3.2 3.6 3.0
Myanmar 37 29 44 0.7 66 49 83 0.6 1.8 1.7 1.9
Philippines 29 20 37 0.6 63 50 76 0.7 2.2 2.5 2.1
Singapore 13 12 14 0.8 67 67 66 1.0 5.2 5.8 4.8
Thailand 27 19 34 0.6 71 62 80 0.8 2.7 3.2 2.4
Timor-Leste 55 53 57 0.9 78 68 87 0.8 1.4 1.3 1.5
Viet Nam 35 35 35 1.0 74 73 76 1.0 2.1 2.1 2.1
Western Asia Armenia 36 29 43 0.7 78 71 85 0.8 2.1 2.4 2.0
Azerbaijan 20 22 18 1.2 52 49 55 0.9 2.6 2.2 3.1
Bahrain 12 5 18 0.3 63 38 84 0.5 5.4 7.5 4.7
Cyprus 11 9 13 0.7 70 69 71 1.0 6.3 7.5 5.4
Georgia 18 13 22 0.6 49 37 61 0.6 2.8 2.8 2.7
Iraq 21 6 35 0.2 38 10 64 0.2 1.8 1.8 1.8
Israel 8 7 9 0.8 70 71 69 1.0 8.7 10.2 7.6
Jordan 12 1 21 0.0 44 18 68 0.3 3.8 16.8 3.2
Kuwait 6 3 8 0.4 57 42 69 0.6 9.8 12.1 8.7
Lebanon 15 6 24 0.2 44 29 59 0.5 2.9 5.1 2.4
Oman 13 9 17 0.6 59 36 78 0.5 4.6 4.0 4.7
Qatar 21 5 27 0.2 86 54 94 0.6 4.2 10.7 3.4
Saudi Arabia 12 2 21 0.1 48 18 75 0.2 4.1 8.9 3.5
Syrian Arab Republic 31 14 48 0.3 52 26 77 0.3 1.7 1.9 1.6
Turkey 26 17 36 0.5 52 32 71 0.5 1.9 1.9 2.0
United Arab Emirates 10 6 14 0.4 69 48 83 0.6 6.8 8.0 5.9
Occupied Palestinian Territory 16 2 29 0.1 44 20 68 0.3 2.8 9.9 2.3
140
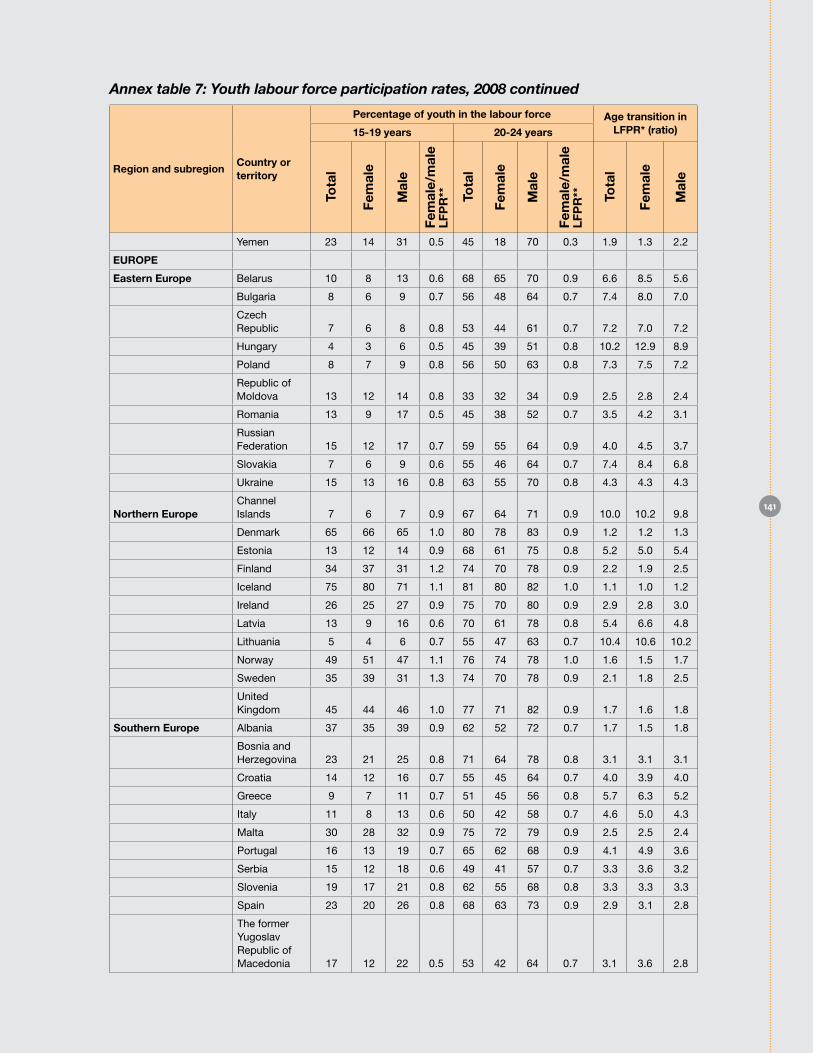
Annex table 7: Youth labour force participation rates, 2008 continued
Region and subregionCountry or territory
Percentage of youth in the labour force Age transition in LFPR* (ratio)15-19 years 20-24 years
Yemen 23 14 31 0.5 45 18 70 0.3 1.9 1.3 2.2
EuRoPE
Eastern Europe Belarus 10 8 13 0.6 68 65 70 0.9 6.6 8.5 5.6
Bulgaria 8 6 9 0.7 56 48 64 0.7 7.4 8.0 7.0
Czech Republic 7 6 8 0.8 53 44 61 0.7 7.2 7.0 7.2
Hungary 4 3 6 0.5 45 39 51 0.8 10.2 12.9 8.9
Poland 8 7 9 0.8 56 50 63 0.8 7.3 7.5 7.2
Republic of Moldova 13 12 14 0.8 33 32 34 0.9 2.5 2.8 2.4
Romania 13 9 17 0.5 45 38 52 0.7 3.5 4.2 3.1
Russian Federation 15 12 17 0.7 59 55 64 0.9 4.0 4.5 3.7
Slovakia 7 6 9 0.6 55 46 64 0.7 7.4 8.4 6.8
Ukraine 15 13 16 0.8 63 55 70 0.8 4.3 4.3 4.3
Northern EuropeChannel Islands 7 6 7 0.9 67 64 71 0.9 10.0 10.2 9.8
Denmark 65 66 65 1.0 80 78 83 0.9 1.2 1.2 1.3
Estonia 13 12 14 0.9 68 61 75 0.8 5.2 5.0 5.4
Finland 34 37 31 1.2 74 70 78 0.9 2.2 1.9 2.5
Iceland 75 80 71 1.1 81 80 82 1.0 1.1 1.0 1.2
Ireland 26 25 27 0.9 75 70 80 0.9 2.9 2.8 3.0
Latvia 13 9 16 0.6 70 61 78 0.8 5.4 6.6 4.8
Lithuania 5 4 6 0.7 55 47 63 0.7 10.4 10.6 10.2
Norway 49 51 47 1.1 76 74 78 1.0 1.6 1.5 1.7
Sweden 35 39 31 1.3 74 70 78 0.9 2.1 1.8 2.5
United Kingdom 45 44 46 1.0 77 71 82 0.9 1.7 1.6 1.8
Southern Europe Albania 37 35 39 0.9 62 52 72 0.7 1.7 1.5 1.8
Bosnia and Herzegovina 23 21 25 0.8 71 64 78 0.8 3.1 3.1 3.1
Croatia 14 12 16 0.7 55 45 64 0.7 4.0 3.9 4.0
Greece 9 7 11 0.7 51 45 56 0.8 5.7 6.3 5.2
Italy 11 8 13 0.6 50 42 58 0.7 4.6 5.0 4.3
Malta 30 28 32 0.9 75 72 79 0.9 2.5 2.5 2.4
Portugal 16 13 19 0.7 65 62 68 0.9 4.1 4.9 3.6
Serbia 15 12 18 0.6 49 41 57 0.7 3.3 3.6 3.2
Slovenia 19 17 21 0.8 62 55 68 0.8 3.3 3.3 3.3
Spain 23 20 26 0.8 68 63 73 0.9 2.9 3.1 2.8
The former Yugoslav Republic of Macedonia 17 12 22 0.5 53 42 64 0.7 3.1 3.6 2.8
141
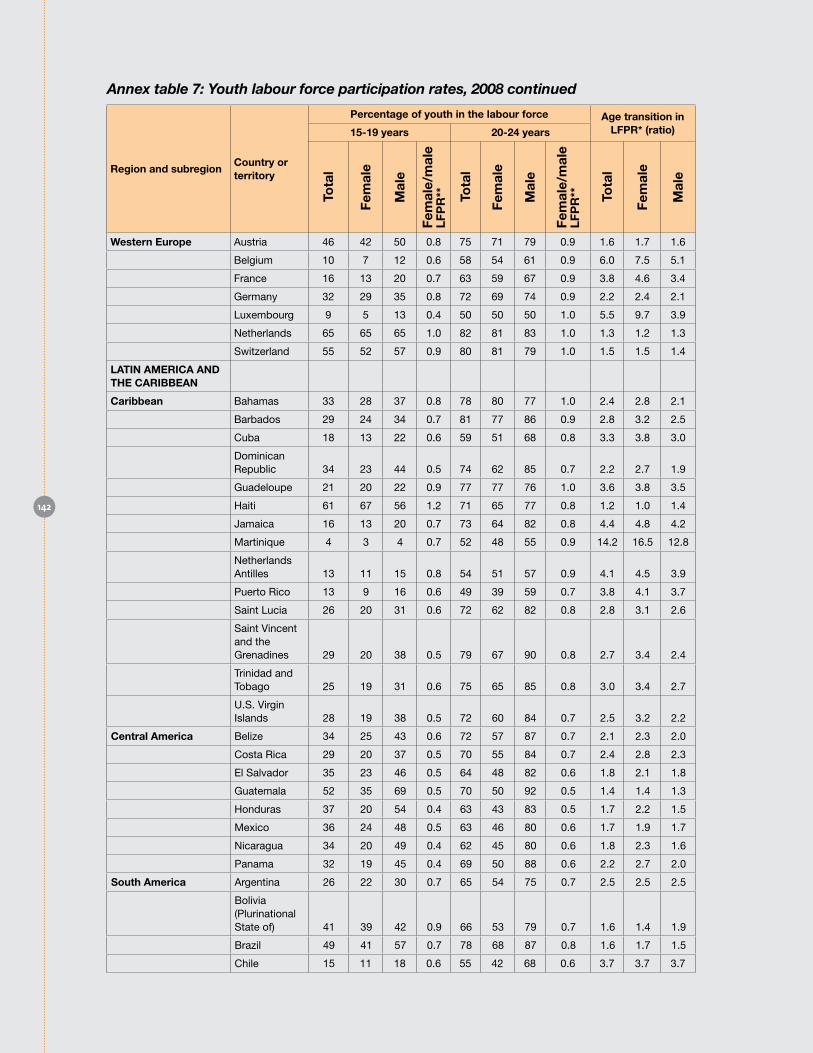
Annex table 7: Youth labour force participation rates, 2008 continued
Region and subregionCountry or territory
Percentage of youth in the labour force Age transition in LFPR* (ratio)15-19 years 20-24 years
Western Europe Austria 46 42 50 0.8 75 71 79 0.9 1.6 1.7 1.6
Belgium 10 7 12 0.6 58 54 61 0.9 6.0 7.5 5.1
France 16 13 20 0.7 63 59 67 0.9 3.8 4.6 3.4
Germany 32 29 35 0.8 72 69 74 0.9 2.2 2.4 2.1
Luxembourg 9 5 13 0.4 50 50 50 1.0 5.5 9.7 3.9
Netherlands 65 65 65 1.0 82 81 83 1.0 1.3 1.2 1.3
Switzerland 55 52 57 0.9 80 81 79 1.0 1.5 1.5 1.4
LATIN AMERICA AND THE CARIbbEAN
Caribbean Bahamas 33 28 37 0.8 78 80 77 1.0 2.4 2.8 2.1
Barbados 29 24 34 0.7 81 77 86 0.9 2.8 3.2 2.5
Cuba 18 13 22 0.6 59 51 68 0.8 3.3 3.8 3.0
Dominican Republic 34 23 44 0.5 74 62 85 0.7 2.2 2.7 1.9
Guadeloupe 21 20 22 0.9 77 77 76 1.0 3.6 3.8 3.5
Haiti 61 67 56 1.2 71 65 77 0.8 1.2 1.0 1.4
Jamaica 16 13 20 0.7 73 64 82 0.8 4.4 4.8 4.2
Martinique 4 3 4 0.7 52 48 55 0.9 14.2 16.5 12.8
Netherlands Antilles 13 11 15 0.8 54 51 57 0.9 4.1 4.5 3.9
Puerto Rico 13 9 16 0.6 49 39 59 0.7 3.8 4.1 3.7
Saint Lucia 26 20 31 0.6 72 62 82 0.8 2.8 3.1 2.6
Saint Vincent and the Grenadines 29 20 38 0.5 79 67 90 0.8 2.7 3.4 2.4
Trinidad and Tobago 25 19 31 0.6 75 65 85 0.8 3.0 3.4 2.7
U.S. Virgin Islands 28 19 38 0.5 72 60 84 0.7 2.5 3.2 2.2
Central America Belize 34 25 43 0.6 72 57 87 0.7 2.1 2.3 2.0
Costa Rica 29 20 37 0.5 70 55 84 0.7 2.4 2.8 2.3
El Salvador 35 23 46 0.5 64 48 82 0.6 1.8 2.1 1.8
Guatemala 52 35 69 0.5 70 50 92 0.5 1.4 1.4 1.3
Honduras 37 20 54 0.4 63 43 83 0.5 1.7 2.2 1.5
Mexico 36 24 48 0.5 63 46 80 0.6 1.7 1.9 1.7
Nicaragua 34 20 49 0.4 62 45 80 0.6 1.8 2.3 1.6
Panama 32 19 45 0.4 69 50 88 0.6 2.2 2.7 2.0
South America Argentina 26 22 30 0.7 65 54 75 0.7 2.5 2.5 2.5
Bolivia (Plurinational State of) 41 39 42 0.9 66 53 79 0.7 1.6 1.4 1.9
Brazil 49 41 57 0.7 78 68 87 0.8 1.6 1.7 1.5
Chile 15 11 18 0.6 55 42 68 0.6 3.7 3.7 3.7
142

Annex table 7: Youth labour force participation rates, 2008 continued
Region and subregionCountry or territory
Percentage of youth in the labour force Age transition in LFPR* (ratio)15-19 years 20-24 years
Colombia 29 20 38 0.5 60 43 76 0.6 2.0 2.1 2.0
Ecuador 28 24 32 0.8 58 43 72 0.6 2.0 1.8 2.2
French Guiana 8 9 8 1.1 55 51 59 0.9 6.6 5.7 7.5
Guyana 35 23 46 0.5 65 41 89 0.5 1.9 1.8 1.9
Paraguay 50 36 63 0.6 74 59 88 0.7 1.5 1.7 1.4
Peru 28 31 25 1.2 66 60 71 0.8 2.4 2.0 2.9
Suriname 9 6 12 0.5 45 32 58 0.5 5.1 5.7 4.8
Uruguay 31 23 39 0.6 75 66 83 0.8 2.4 2.9 2.2
Venezuela (Bolivarian Republic of) 27 17 37 0.4 64 48 79 0.6 2.4 2.9 2.1
NoRTHERN AMERICA
Canada 56 58 54 1.1 78 76 81 0.9 1.4 1.3 1.5
United States of America 40 40 40 1.0 74 70 79 0.9 1.9 1.7 2.0
oCEANIA
Australia 59 60 59 1.0 82 79 85 0.9 1.4 1.3 1.4
New Zealand 54 53 55 1.0 74 69 78 0.9 1.4 1.3 1.4
Melanasia Fiji 28 18 37 0.5 63 45 80 0.6 2.3 2.5 2.1
New Caledonia 25 20 29 0.7 76 67 85 0.8 3.1 3.3 2.9
Papua New Guinea 49 51 47 1.1 70 70 69 1.0 1.4 1.4 1.5
Solomon Islands 21 18 23 0.8 41 29 52 0.6 2.0 1.6 2.2
Vanuatu 68 67 70 1.0 85 80 90 0.9 1.2 1.2 1.3
Micronesia Guam 23 18 28 0.6 68 59 77 0.8 2.9 3.3 2.7
PolynesiaFrench Polynesia 18 12 23 0.5 66 57 75 0.8 3.7 4.6 3.3
Samoa 17 9 25 0.4 71 52 88 0.6 4.2 5.9 3.5
Tonga 20 13 25 0.5 63 55 71 0.8 3.2 4.1 2.8
Source: International Labour Organization, Economically Active Population Estimates and Projections data set for 2009.
NoTES:
Two dots (..) indicate that data are not available or are not separately reported.
* Indicates the ratio of labour force participation among older youth aged 20-24 years to that among younger youth aged 15-19 years.
** Transition ratios close to 1 suggest little change in youth labour force participation across age subgroups. A ratio of less than 1 means females are less likely than males to participate in the labour force.
LFPR = labour force participation rate
143
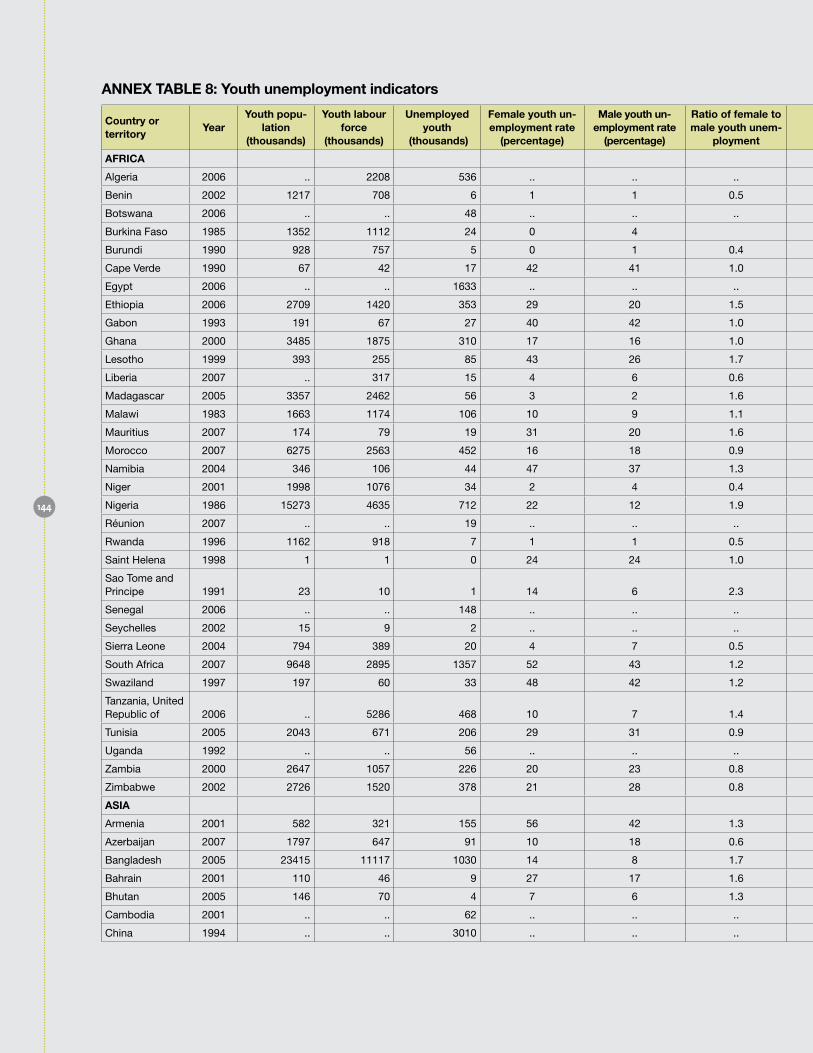
Country or territory
YearYouth popu-
lation (thousands)
Youth labour force
(thousands)
unemployed youth
(thousands)
Female youth un-employment rate
(percentage)
Male youth un-employment rate
(percentage)
Ratio of female to male youth unem-
ployment
Youth unemployment rate
(percentage)
Adult unemploy-ment rate
(percentage)
Ratio of youth unemploy-ment rate to adult unem-
ployment rate
Share of unemployed youth in total unemployed
(percentage)
Percentage of unemployed youth in youth population
AFRICA
Algeria 2006 .. 2208 536 .. .. .. 24 9 2.7 43 ..
Benin 2002 1217 708 6 1 1 0.5 1 1 1.3 33 1
Botswana 2006 .. .. 48 .. .. .. .. .. .. 42 ..
Burkina Faso 1985 1352 1112 24 0 4 2 1 2.6 56 2
Burundi 1990 928 757 5 0 1 0.4 1 0 1.7 41 1
Cape Verde 1990 67 42 17 42 41 1.0 41 12 3.4 66 26
Egypt 2006 .. .. 1633 .. .. .. .. .. .. 67 ..
Ethiopia 2006 2709 1420 353 29 20 1.5 25 13 1.9 47 13
Gabon 1993 191 67 27 40 42 1.0 41 13 3.2 41 14
Ghana 2000 3485 1875 310 17 16 1.0 17 9 1.9 36 9
Lesotho 1999 393 255 85 43 26 1.7 34 24 1.4 41 22
Liberia 2007 .. 317 15 4 6 0.6 5 6 0.8 24 ..
Madagascar 2005 3357 2462 56 3 2 1.6 2 3 0.8 24 2
Malawi 1983 1663 1174 106 10 9 1.1 9 3 2.7 60 6
Mauritius 2007 174 79 19 31 20 1.6 25 6 4.2 42 11
Morocco 2007 6275 2563 452 16 18 0.9 18 8 2.3 40 7
Namibia 2004 346 106 44 47 37 1.3 42 34 1.2 41 13
Niger 2001 1998 1076 34 2 4 0.4 3 1 4.2 64 2
Nigeria 1986 15273 4635 712 22 12 1.9 15 2 8.1 59 5
Réunion 2007 .. .. 19 .. .. .. .. .. .. 25 ..
Rwanda 1996 1162 918 7 1 1 0.5 1 1 1.5 45 1
Saint Helena 1998 1 1 0 24 24 1.0 24 17 1.4 28 17
Sao Tome and Principe 1991 23 10 1 14 6 2.3 8 2 5.1 67 4
Senegal 2006 .. .. 148 .. .. .. .. .. .. 42 ..
Seychelles 2002 15 9 2 .. .. .. 20 7 2.9 43 13
Sierra Leone 2004 794 389 20 4 7 0.5 5 3 1.7 31 3
South Africa 2007 9648 2895 1357 52 43 1.2 47 18 2.6 34 14
Swaziland 1997 197 60 33 48 42 1.2 55 15 3.7 63 17
Tanzania, United Republic of 2006 .. 5286 468 10 7 1.4 9 3 2.9 53 ..
Tunisia 2005 2043 671 206 29 31 0.9 31 10 3.0 42 10
Uganda 1992 .. .. 56 .. .. .. .. .. .. 83 ..
Zambia 2000 2647 1057 226 20 23 0.8 21 9 2.5 55 9
Zimbabwe 2002 2726 1520 378 21 28 0.8 25 4 5.7 68 14
ASIA
Armenia 2001 582 321 155 56 42 1.3 48 33 1.5 27 27
Azerbaijan 2007 1797 647 91 10 18 0.6 14 5 2.7 32 5
Bangladesh 2005 23415 11117 1030 14 8 1.7 9 3 3.3 49 4
Bahrain 2001 110 46 9 27 17 1.6 20 3 6.8 54 8
Bhutan 2005 146 70 4 7 6 1.3 6 2 3.2 54 3
Cambodia 2001 .. .. 62 .. .. .. .. .. .. 60 ..
China 1994 .. .. 3010 .. .. .. .. .. .. .. ..
ANNEX TAbLE 8: Youth unemployment indicators
144
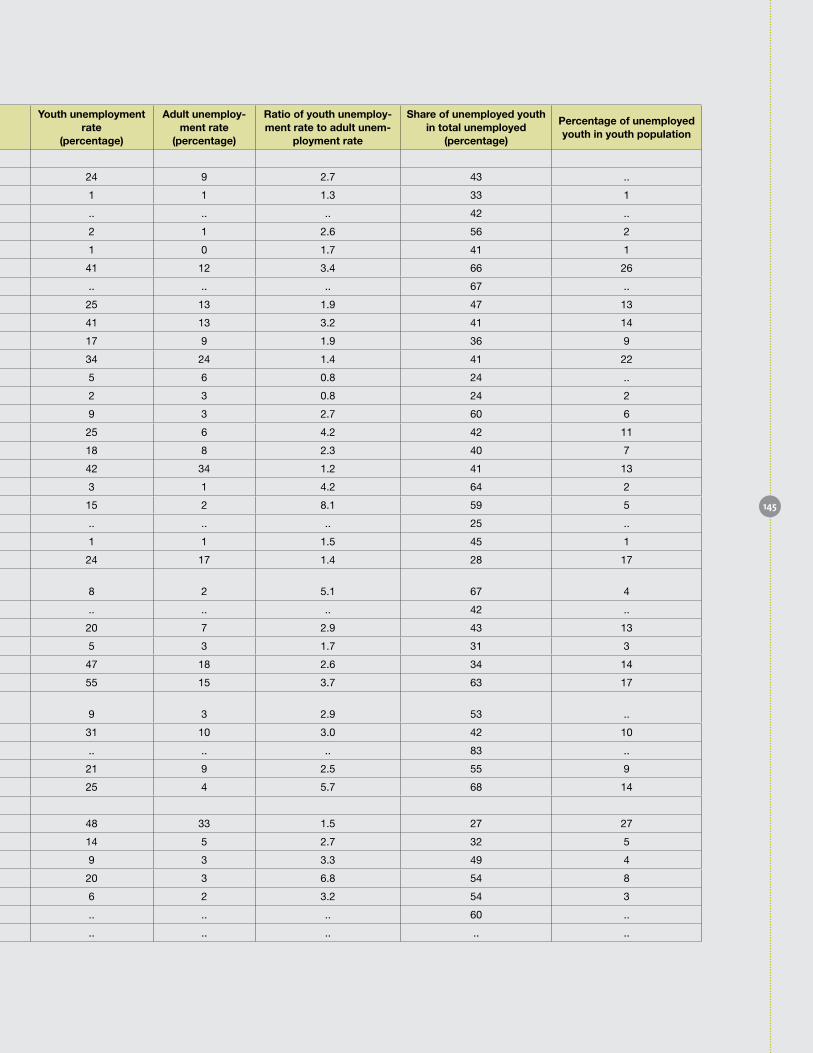
Country or territory
YearYouth popu-
lation (thousands)
Youth labour force
(thousands)
unemployed youth
(thousands)
Female youth un-employment rate
(percentage)
Male youth un-employment rate
(percentage)
Ratio of female to male youth unem-
ployment
Youth unemployment rate
(percentage)
Adult unemploy-ment rate
(percentage)
Ratio of youth unemploy-ment rate to adult unem-
ployment rate
Share of unemployed youth in total unemployed
(percentage)
Percentage of unemployed youth in youth population
AFRICA
Algeria 2006 .. 2208 536 .. .. .. 24 9 2.7 43 ..
Benin 2002 1217 708 6 1 1 0.5 1 1 1.3 33 1
Botswana 2006 .. .. 48 .. .. .. .. .. .. 42 ..
Burkina Faso 1985 1352 1112 24 0 4 2 1 2.6 56 2
Burundi 1990 928 757 5 0 1 0.4 1 0 1.7 41 1
Cape Verde 1990 67 42 17 42 41 1.0 41 12 3.4 66 26
Egypt 2006 .. .. 1633 .. .. .. .. .. .. 67 ..
Ethiopia 2006 2709 1420 353 29 20 1.5 25 13 1.9 47 13
Gabon 1993 191 67 27 40 42 1.0 41 13 3.2 41 14
Ghana 2000 3485 1875 310 17 16 1.0 17 9 1.9 36 9
Lesotho 1999 393 255 85 43 26 1.7 34 24 1.4 41 22
Liberia 2007 .. 317 15 4 6 0.6 5 6 0.8 24 ..
Madagascar 2005 3357 2462 56 3 2 1.6 2 3 0.8 24 2
Malawi 1983 1663 1174 106 10 9 1.1 9 3 2.7 60 6
Mauritius 2007 174 79 19 31 20 1.6 25 6 4.2 42 11
Morocco 2007 6275 2563 452 16 18 0.9 18 8 2.3 40 7
Namibia 2004 346 106 44 47 37 1.3 42 34 1.2 41 13
Niger 2001 1998 1076 34 2 4 0.4 3 1 4.2 64 2
Nigeria 1986 15273 4635 712 22 12 1.9 15 2 8.1 59 5
Réunion 2007 .. .. 19 .. .. .. .. .. .. 25 ..
Rwanda 1996 1162 918 7 1 1 0.5 1 1 1.5 45 1
Saint Helena 1998 1 1 0 24 24 1.0 24 17 1.4 28 17
Sao Tome and Principe 1991 23 10 1 14 6 2.3 8 2 5.1 67 4
Senegal 2006 .. .. 148 .. .. .. .. .. .. 42 ..
Seychelles 2002 15 9 2 .. .. .. 20 7 2.9 43 13
Sierra Leone 2004 794 389 20 4 7 0.5 5 3 1.7 31 3
South Africa 2007 9648 2895 1357 52 43 1.2 47 18 2.6 34 14
Swaziland 1997 197 60 33 48 42 1.2 55 15 3.7 63 17
Tanzania, United Republic of 2006 .. 5286 468 10 7 1.4 9 3 2.9 53 ..
Tunisia 2005 2043 671 206 29 31 0.9 31 10 3.0 42 10
Uganda 1992 .. .. 56 .. .. .. .. .. .. 83 ..
Zambia 2000 2647 1057 226 20 23 0.8 21 9 2.5 55 9
Zimbabwe 2002 2726 1520 378 21 28 0.8 25 4 5.7 68 14
ASIA
Armenia 2001 582 321 155 56 42 1.3 48 33 1.5 27 27
Azerbaijan 2007 1797 647 91 10 18 0.6 14 5 2.7 32 5
Bangladesh 2005 23415 11117 1030 14 8 1.7 9 3 3.3 49 4
Bahrain 2001 110 46 9 27 17 1.6 20 3 6.8 54 8
Bhutan 2005 146 70 4 7 6 1.3 6 2 3.2 54 3
Cambodia 2001 .. .. 62 .. .. .. .. .. .. 60 ..
China 1994 .. .. 3010 .. .. .. .. .. .. .. ..
145

Annex table 8: Youth unemployment indicators continued
Country or territory
YearYouth popu-
lation (thousands)
Youth labour force
(thousands)
unemployed youth
(thousands)
Female youth un-employment rate
(percentage)
Male youth un-employment rate
(percentage)
Ratio of female to male youth unem-
ployment
Youth unemployment rate
(percentage)
Adult unemploy-ment rate
(percentage)
Ratio of youth unemploy-ment rate to adult unem-
ployment rate
Share of unemployed youth in total unemployed
(percentage)
Percentage of unemployed youth in youth population
Hong Kong, China SAR 2007 899 386 35 7 11 0.7 9 3 2.6 24 4
India 2004 177270 80119 8435 11 10 1.0 11 4 3.0 46 5
Indonesia 2007 .. 22513 5660 27 24 1.1 25 5 5.1 57 ..
Iran (Islamic Republic of) 2007 16671 5264 1174 30 20 1.5 22 7 3.1 47 7
Israel 2007 1152 373 60 17 15 1.1 16 6 2.7 28 5
Japan 2007 13590 6100 470 7 8 0.9 8 4 2.2 18 4
Kazakhstan 2004 2713 1343 192 16 13 1.2 14 7 2.0 29 7
Korea, Republic of 2007 5937 1671 148 7 11 0.6 9 3 3.1 19 3
Kyrgyzstan 2006 1075 500 73 16 14 1.2 15 7 2.2 39 7
Lao People’s Democratic Republic 1995 820 608 30 4 6 0.6 5 1 5.6 57 4
Lebanon 2004 .. 216 45 .. .. .. 21 5 4.1 48 ..
Macau, China SAR 2007 99 44 3 4 9 0.4 6 3 2.4 29 3
Malaysia 2007 .. 2092 228 12 11 1.1 11 1 7.8 65 ..
Maldives 2006 75 40 9 31 16 2.0 22 11 2.0 47 12
Mongolia 2003 457 199 40 21 20 1.1 20 13 1.6 28 9
Nepal 1999 3456 2818 84 2 4 0.6 3 1 2.2 47 2
Pakistan 2007 31957 14139 1057 9 7 1.3 8 4 1.8 44 3
Occupied Palestinian Territories 2007 .. 194 68 43 34 1.3 35 18 2.0 37 ..
Papua New Guinea 2000 1029 609 32 .. .. .. 5 2 2.6 49 3
Philippines 2007 17366 7680 1145 17 14 1.2 15 4 3.8 51 7
Qatar 2004 102 43 5 30 8 3.9 11 1 22.2 70 5
Saudi Arabia 2007 .. .. 236 .. .. .. .. .. .. 51 ..
Singapore 2007 487 180 16 11 7 1.6 9 4 2.6 21 3
Sri Lanka 2007 1195 254 28 17 1.6 21 3 6.9 57 ..
Syrian Arab Republic 2003 3691 1499 292 33 16 2.1 20 6 3.1 57 8
Taiwan, Province of China 2007 .. 973 103 .. .. .. 11 3 3.3 25 ..
Thailand 2007 10540 5214 233 4 5 0.9 5 1 6.9 53 2
Turkey 2008 11239 4152 752 18 18 1.0 18 8 2.4 34 7
United Arab Emirates 2005 666 332 27 13 7 2.0 8 2 3.4 33 4
Viet Nam 2004 15524 9276 428 5 4 1.1 5 2 3.1 46 3
Yemen 1999 .. .. 227 .. .. .. .. .. .. 48 ..
EuRoPE
Albania 2001 527 315 112 27 42 0.7 36 19 1.9 37 21
Austria 2008 994 604 49 8 8 1.0 8 3 2.6 30 5
Belgium 2008 1298 434 78 19 17 1.1 18 6 3.1 23 6
146
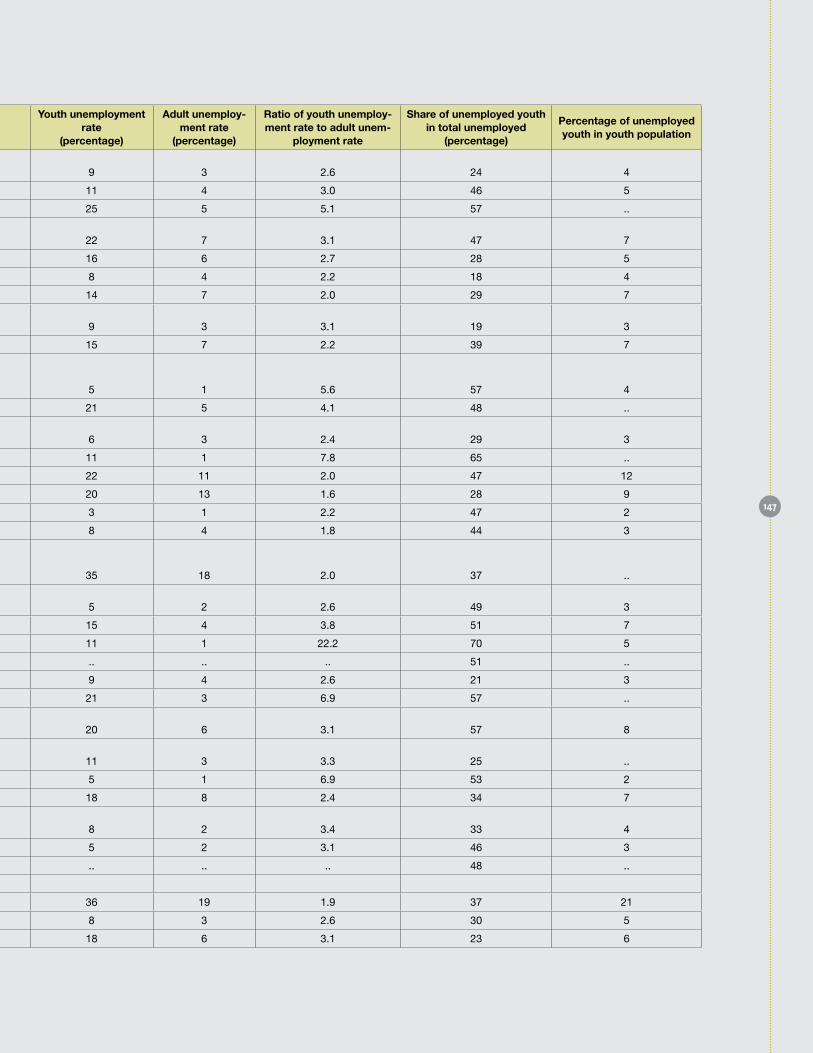
Country or territory
YearYouth popu-
lation (thousands)
Youth labour force
(thousands)
unemployed youth
(thousands)
Female youth un-employment rate
(percentage)
Male youth un-employment rate
(percentage)
Ratio of female to male youth unem-
ployment
Youth unemployment rate
(percentage)
Adult unemploy-ment rate
(percentage)
Ratio of youth unemploy-ment rate to adult unem-
ployment rate
Share of unemployed youth in total unemployed
(percentage)
Percentage of unemployed youth in youth population
Hong Kong, China SAR 2007 899 386 35 7 11 0.7 9 3 2.6 24 4
India 2004 177270 80119 8435 11 10 1.0 11 4 3.0 46 5
Indonesia 2007 .. 22513 5660 27 24 1.1 25 5 5.1 57 ..
Iran (Islamic Republic of) 2007 16671 5264 1174 30 20 1.5 22 7 3.1 47 7
Israel 2007 1152 373 60 17 15 1.1 16 6 2.7 28 5
Japan 2007 13590 6100 470 7 8 0.9 8 4 2.2 18 4
Kazakhstan 2004 2713 1343 192 16 13 1.2 14 7 2.0 29 7
Korea, Republic of 2007 5937 1671 148 7 11 0.6 9 3 3.1 19 3
Kyrgyzstan 2006 1075 500 73 16 14 1.2 15 7 2.2 39 7
Lao People’s Democratic Republic 1995 820 608 30 4 6 0.6 5 1 5.6 57 4
Lebanon 2004 .. 216 45 .. .. .. 21 5 4.1 48 ..
Macau, China SAR 2007 99 44 3 4 9 0.4 6 3 2.4 29 3
Malaysia 2007 .. 2092 228 12 11 1.1 11 1 7.8 65 ..
Maldives 2006 75 40 9 31 16 2.0 22 11 2.0 47 12
Mongolia 2003 457 199 40 21 20 1.1 20 13 1.6 28 9
Nepal 1999 3456 2818 84 2 4 0.6 3 1 2.2 47 2
Pakistan 2007 31957 14139 1057 9 7 1.3 8 4 1.8 44 3
Occupied Palestinian Territories 2007 .. 194 68 43 34 1.3 35 18 2.0 37 ..
Papua New Guinea 2000 1029 609 32 .. .. .. 5 2 2.6 49 3
Philippines 2007 17366 7680 1145 17 14 1.2 15 4 3.8 51 7
Qatar 2004 102 43 5 30 8 3.9 11 1 22.2 70 5
Saudi Arabia 2007 .. .. 236 .. .. .. .. .. .. 51 ..
Singapore 2007 487 180 16 11 7 1.6 9 4 2.6 21 3
Sri Lanka 2007 1195 254 28 17 1.6 21 3 6.9 57 ..
Syrian Arab Republic 2003 3691 1499 292 33 16 2.1 20 6 3.1 57 8
Taiwan, Province of China 2007 .. 973 103 .. .. .. 11 3 3.3 25 ..
Thailand 2007 10540 5214 233 4 5 0.9 5 1 6.9 53 2
Turkey 2008 11239 4152 752 18 18 1.0 18 8 2.4 34 7
United Arab Emirates 2005 666 332 27 13 7 2.0 8 2 3.4 33 4
Viet Nam 2004 15524 9276 428 5 4 1.1 5 2 3.1 46 3
Yemen 1999 .. .. 227 .. .. .. .. .. .. 48 ..
EuRoPE
Albania 2001 527 315 112 27 42 0.7 36 19 1.9 37 21
Austria 2008 994 604 49 8 8 1.0 8 3 2.6 30 5
Belgium 2008 1298 434 78 19 17 1.1 18 6 3.1 23 6
147
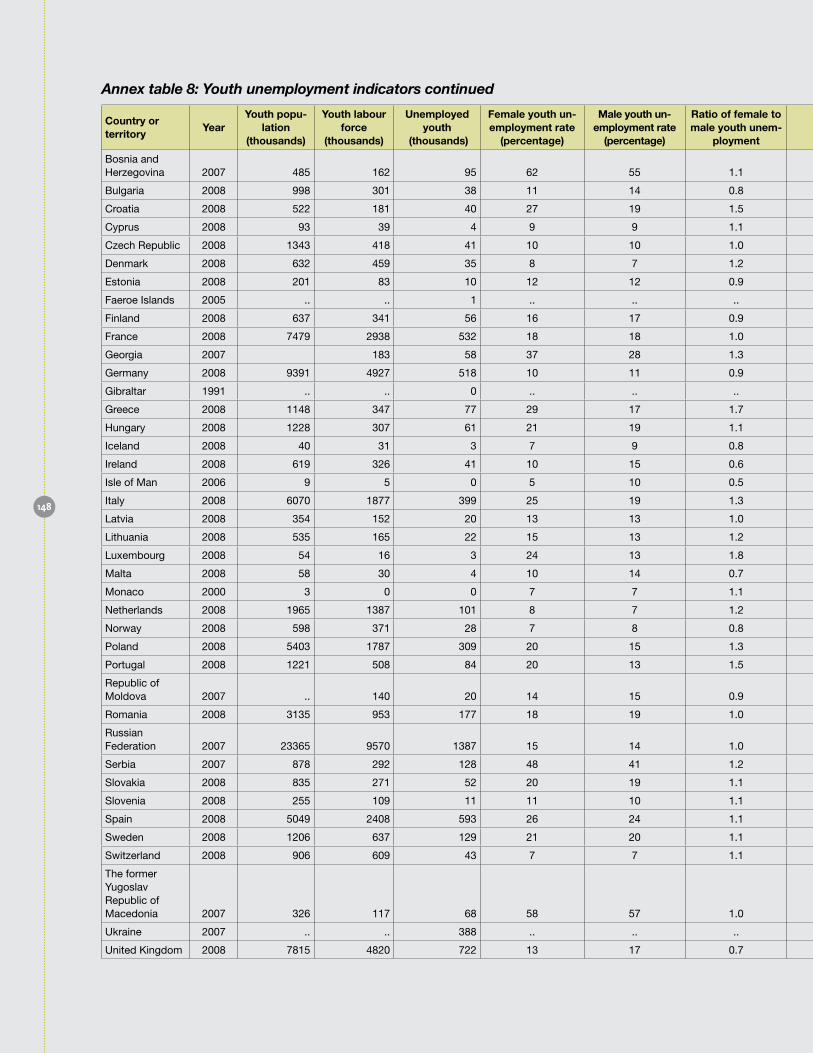
Annex table 8: Youth unemployment indicators continued
Country or territory
YearYouth popu-
lation (thousands)
Youth labour force
(thousands)
unemployed youth
(thousands)
Female youth un-employment rate
(percentage)
Male youth un-employment rate
(percentage)
Ratio of female to male youth unem-
ployment
Youth unemployment rate
(percentage)
Adult unemploy-ment rate
(percentage)
Ratio of youth unemploy-ment rate to adult unem-
ployment rate
Share of unemployed youth in total unemployed
(percentage)
Percentage of unemployed youth in youth population
Bosnia and Herzegovina 2007 485 162 95 62 55 1.1 59 25 2.3 28 20
Bulgaria 2008 998 301 38 11 14 0.8 13 5 2.6 19 4
Croatia 2008 522 181 40 27 19 1.5 22 7 3.2 27 8
Cyprus 2008 93 39 4 9 9 1.1 9 3 2.9 24 4
Czech Republic 2008 1343 418 41 10 10 1.0 10 4 2.5 18 3
Denmark 2008 632 459 35 8 7 1.2 8 3 3.0 36 6
Estonia 2008 201 83 10 12 12 0.9 12 5 2.6 26 5
Faeroe Islands 2005 .. .. 1 .. .. .. .. .. .. 50 ..
Finland 2008 637 341 56 16 17 0.9 17 5 3.3 33 9
France 2008 7479 2938 532 18 18 1.0 18 6 3.0 26 7
Georgia 2007 183 58 37 28 1.3 32 11 2.8 22 ..
Germany 2008 9391 4927 518 10 11 0.9 11 7 1.5 17 6
Gibraltar 1991 .. .. 0 .. .. .. .. .. .. 30 ..
Greece 2008 1148 347 77 29 17 1.7 22 7 3.4 20 7
Hungary 2008 1228 307 61 21 19 1.1 20 7 2.9 19 5
Iceland 2008 40 31 3 7 9 0.8 8 2 4.5 48 7
Ireland 2008 619 326 41 10 15 0.6 13 5 2.6 31 7
Isle of Man 2006 9 5 0 5 10 0.5 7 2 4.1 35 4
Italy 2008 6070 1877 399 25 19 1.3 21 6 3.8 24 7
Latvia 2008 354 152 20 13 13 1.0 13 7 2.0 22 6
Lithuania 2008 535 165 22 15 13 1.2 13 5 2.7 23 4
Luxembourg 2008 54 16 3 24 13 1.8 18 4 4.4 26 5
Malta 2008 58 30 4 10 14 0.7 12 5 2.6 36 6
Monaco 2000 3 0 0 7 7 1.1 7 4 2.0 7 1
Netherlands 2008 1965 1387 101 8 7 1.2 7 3 2.5 33 5
Norway 2008 598 371 28 7 8 0.8 8 2 4.4 42 5
Poland 2008 5403 1787 309 20 15 1.3 17 6 2.9 26 6
Portugal 2008 1221 508 84 20 13 1.5 17 7 2.5 20 7
Republic of Moldova 2007 .. 140 20 14 15 0.9 15 4 3.7 31 ..
Romania 2008 3135 953 177 18 19 1.0 19 4 4.2 31 6
Russian Federation 2007 23365 9570 1387 15 14 1.0 15 5 3.0 30 6
Serbia 2007 878 292 128 48 41 1.2 44 16 2.8 22 15
Slovakia 2008 835 271 52 20 19 1.1 19 8 2.3 20 6
Slovenia 2008 255 109 11 11 10 1.1 10 4 2.9 25 5
Spain 2008 5049 2408 593 26 24 1.1 25 10 2.5 23 12
Sweden 2008 1206 637 129 21 20 1.1 20 4 4.9 42 11
Switzerland 2008 906 609 43 7 7 1.1 7 3 2.5 29 5
The former Yugoslav Republic of Macedonia 2007 326 117 68 58 57 1.0 58 32 1.8 21 21
Ukraine 2007 .. .. 388 .. .. .. .. .. .. 27 ..
United Kingdom 2008 7815 4820 722 13 17 0.7 15 4 3.8 41 9
148
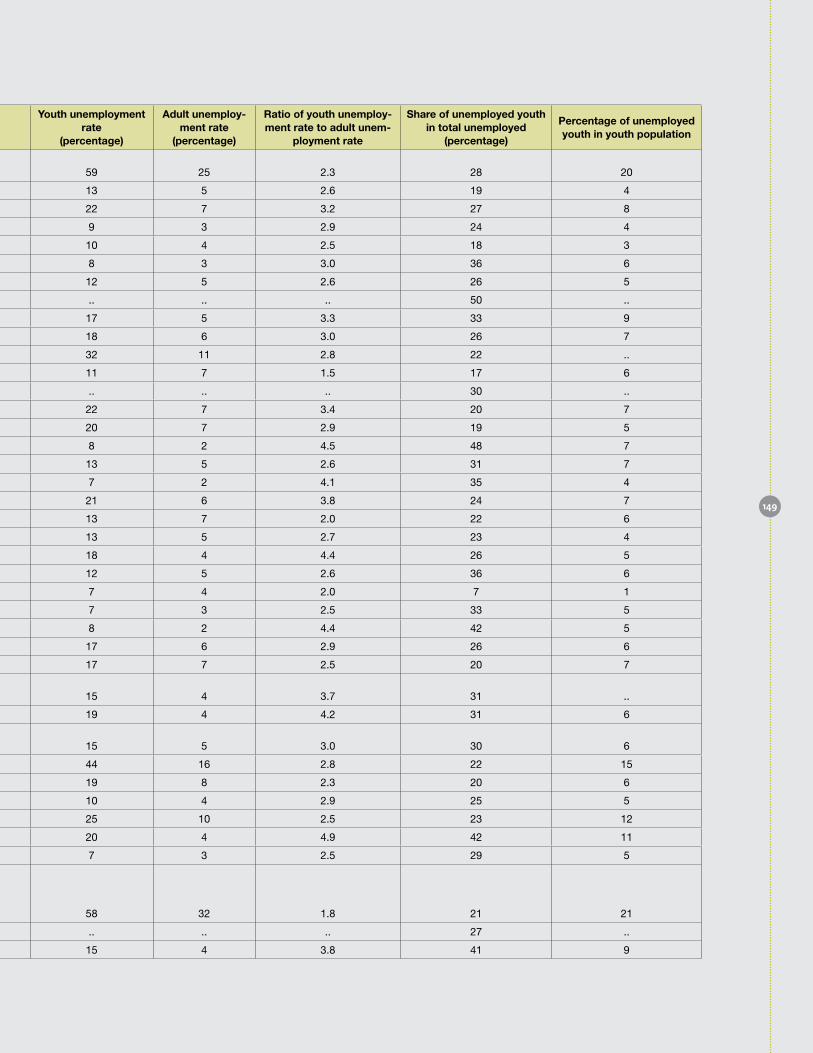
Country or territory
YearYouth popu-
lation (thousands)
Youth labour force
(thousands)
unemployed youth
(thousands)
Female youth un-employment rate
(percentage)
Male youth un-employment rate
(percentage)
Ratio of female to male youth unem-
ployment
Youth unemployment rate
(percentage)
Adult unemploy-ment rate
(percentage)
Ratio of youth unemploy-ment rate to adult unem-
ployment rate
Share of unemployed youth in total unemployed
(percentage)
Percentage of unemployed youth in youth population
Bosnia and Herzegovina 2007 485 162 95 62 55 1.1 59 25 2.3 28 20
Bulgaria 2008 998 301 38 11 14 0.8 13 5 2.6 19 4
Croatia 2008 522 181 40 27 19 1.5 22 7 3.2 27 8
Cyprus 2008 93 39 4 9 9 1.1 9 3 2.9 24 4
Czech Republic 2008 1343 418 41 10 10 1.0 10 4 2.5 18 3
Denmark 2008 632 459 35 8 7 1.2 8 3 3.0 36 6
Estonia 2008 201 83 10 12 12 0.9 12 5 2.6 26 5
Faeroe Islands 2005 .. .. 1 .. .. .. .. .. .. 50 ..
Finland 2008 637 341 56 16 17 0.9 17 5 3.3 33 9
France 2008 7479 2938 532 18 18 1.0 18 6 3.0 26 7
Georgia 2007 183 58 37 28 1.3 32 11 2.8 22 ..
Germany 2008 9391 4927 518 10 11 0.9 11 7 1.5 17 6
Gibraltar 1991 .. .. 0 .. .. .. .. .. .. 30 ..
Greece 2008 1148 347 77 29 17 1.7 22 7 3.4 20 7
Hungary 2008 1228 307 61 21 19 1.1 20 7 2.9 19 5
Iceland 2008 40 31 3 7 9 0.8 8 2 4.5 48 7
Ireland 2008 619 326 41 10 15 0.6 13 5 2.6 31 7
Isle of Man 2006 9 5 0 5 10 0.5 7 2 4.1 35 4
Italy 2008 6070 1877 399 25 19 1.3 21 6 3.8 24 7
Latvia 2008 354 152 20 13 13 1.0 13 7 2.0 22 6
Lithuania 2008 535 165 22 15 13 1.2 13 5 2.7 23 4
Luxembourg 2008 54 16 3 24 13 1.8 18 4 4.4 26 5
Malta 2008 58 30 4 10 14 0.7 12 5 2.6 36 6
Monaco 2000 3 0 0 7 7 1.1 7 4 2.0 7 1
Netherlands 2008 1965 1387 101 8 7 1.2 7 3 2.5 33 5
Norway 2008 598 371 28 7 8 0.8 8 2 4.4 42 5
Poland 2008 5403 1787 309 20 15 1.3 17 6 2.9 26 6
Portugal 2008 1221 508 84 20 13 1.5 17 7 2.5 20 7
Republic of Moldova 2007 .. 140 20 14 15 0.9 15 4 3.7 31 ..
Romania 2008 3135 953 177 18 19 1.0 19 4 4.2 31 6
Russian Federation 2007 23365 9570 1387 15 14 1.0 15 5 3.0 30 6
Serbia 2007 878 292 128 48 41 1.2 44 16 2.8 22 15
Slovakia 2008 835 271 52 20 19 1.1 19 8 2.3 20 6
Slovenia 2008 255 109 11 11 10 1.1 10 4 2.9 25 5
Spain 2008 5049 2408 593 26 24 1.1 25 10 2.5 23 12
Sweden 2008 1206 637 129 21 20 1.1 20 4 4.9 42 11
Switzerland 2008 906 609 43 7 7 1.1 7 3 2.5 29 5
The former Yugoslav Republic of Macedonia 2007 326 117 68 58 57 1.0 58 32 1.8 21 21
Ukraine 2007 .. .. 388 .. .. .. .. .. .. 27 ..
United Kingdom 2008 7815 4820 722 13 17 0.7 15 4 3.8 41 9
149
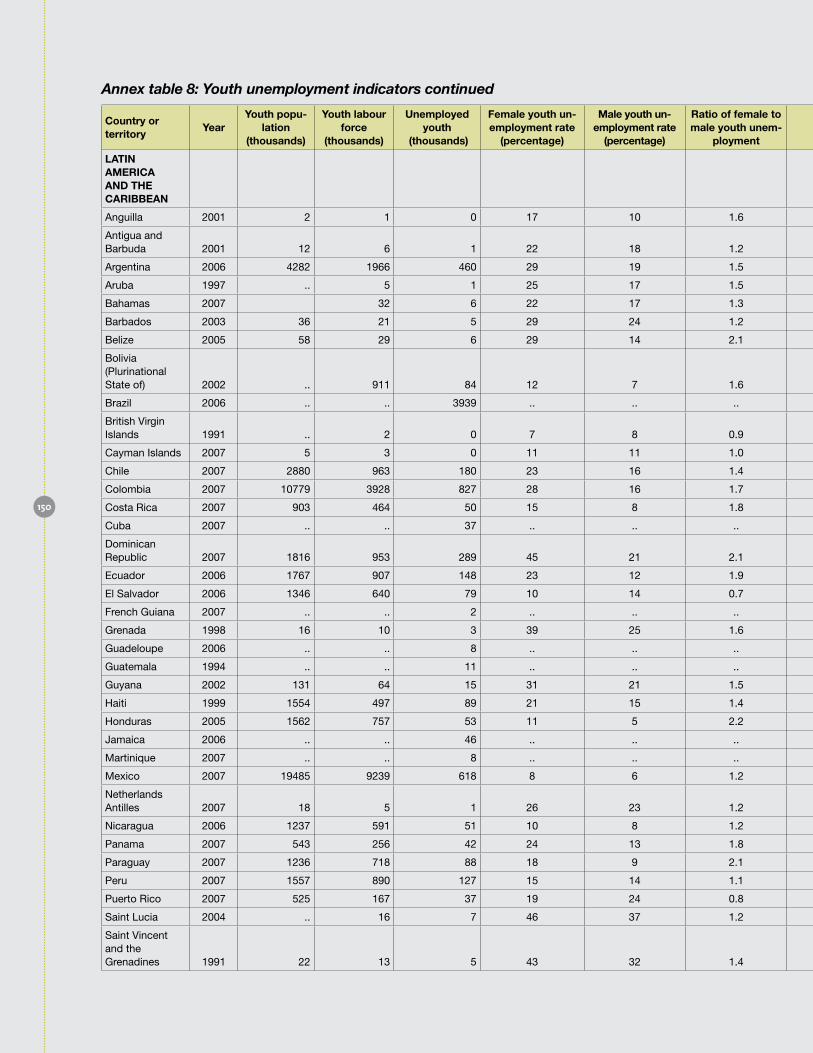
Annex table 8: Youth unemployment indicators continued
Country or territory
YearYouth popu-
lation (thousands)
Youth labour force
(thousands)
unemployed youth
(thousands)
Female youth un-employment rate
(percentage)
Male youth un-employment rate
(percentage)
Ratio of female to male youth unem-
ployment
Youth unemployment rate
(percentage)
Adult unemploy-ment rate
(percentage)
Ratio of youth unemploy-ment rate to adult unem-
ployment rate
Share of unemployed youth in total unemployed
(percentage)
Percentage of unemployed youth in youth population
LATIN AMERICA AND THE CARIbbEAN
Anguilla 2001 2 1 0 17 10 1.6 13 5 2.6 38 9
Antigua and Barbuda 2001 12 6 1 22 18 1.2 20 6 3.2 38 10
Argentina 2006 4282 1966 460 29 19 1.5 23 6 3.6 44 11
Aruba 1997 .. 5 1 25 17 1.5 20 6 3.5 31 ..
Bahamas 2007 32 6 22 17 1.3 19 6 3.4 41 ..
Barbados 2003 36 21 5 29 24 1.2 26 9 3.1 34 15
Belize 2005 58 29 6 29 14 2.1 20 8 2.4 46 10
Bolivia (Plurinational State of) 2002 .. 911 84 12 7 1.6 9 4 2.2 42 ..
Brazil 2006 .. .. 3939 .. .. .. .. .. .. 49 ..
British Virgin Islands 1991 .. 2 0 7 8 0.9 8 3 2.8 41 ..
Cayman Islands 2007 5 3 0 11 11 1.0 11 3 3.5 24 6
Chile 2007 2880 963 180 23 16 1.4 19 5 3.5 35 6
Colombia 2007 10779 3928 827 28 16 1.7 21 8 2.5 37 8
Costa Rica 2007 903 464 50 15 8 1.8 11 3 4.0 54 6
Cuba 2007 .. .. 37 .. .. .. .. .. .. 42 ..
Dominican Republic 2007 1816 953 289 45 21 2.1 30 11 2.7 44 16
Ecuador 2006 1767 907 148 23 12 1.9 16 5 3.0 45 8
El Salvador 2006 1346 640 79 10 14 0.7 12 5 2.6 44 6
French Guiana 2007 .. .. 2 .. .. .. .. .. .. 18 ..
Grenada 1998 16 10 3 39 25 1.6 32 10 3.1 49 19
Guadeloupe 2006 .. .. 8 .. .. .. .. .. .. 17 ..
Guatemala 1994 .. .. 11 .. .. .. .. .. .. 68 ..
Guyana 2002 131 64 15 31 21 1.5 24 8 3.0 49 12
Haiti 1999 1554 497 89 21 15 1.4 18 5 3.6 43 6
Honduras 2005 1562 757 53 11 5 2.2 7 3 2.4 50 3
Jamaica 2006 .. .. 46 .. .. .. .. .. .. 39 ..
Martinique 2007 .. .. 8 .. .. .. .. .. .. 20 ..
Mexico 2007 19485 9239 618 8 6 1.2 7 3 2.7 41 3
Netherlands Antilles 2007 18 5 1 26 23 1.2 24 11 2.2 17 7
Nicaragua 2006 1237 591 51 10 8 1.2 9 4 2.1 45 4
Panama 2007 543 256 42 24 13 1.8 17 5 3.6 46 8
Paraguay 2007 1236 718 88 18 9 2.1 12 3 3.7 56 7
Peru 2007 1557 890 127 15 14 1.1 14 5 3.0 43 8
Puerto Rico 2007 525 167 37 19 24 0.8 22 9 2.4 24 7
Saint Lucia 2004 .. 16 7 46 37 1.2 41 16 2.6 40 ..
Saint Vincent and the Grenadines 1991 22 13 5 43 32 1.4 37 13 2.8 55 21
150
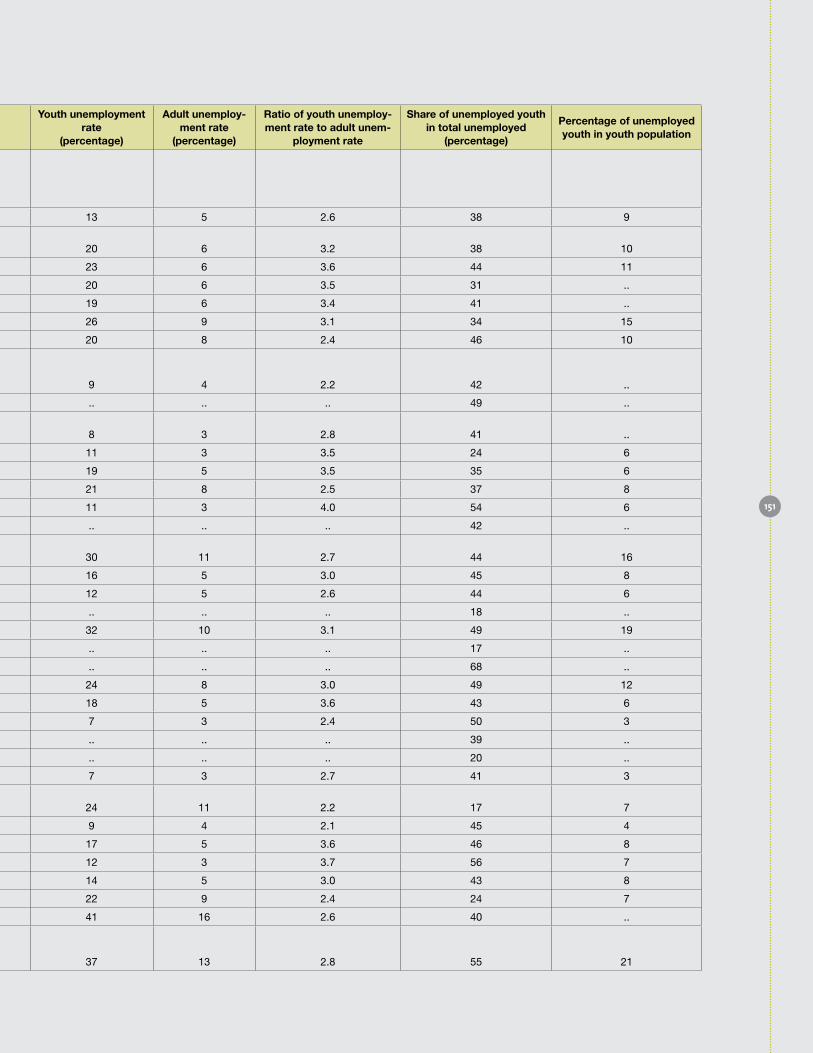
Country or territory
YearYouth popu-
lation (thousands)
Youth labour force
(thousands)
unemployed youth
(thousands)
Female youth un-employment rate
(percentage)
Male youth un-employment rate
(percentage)
Ratio of female to male youth unem-
ployment
Youth unemployment rate
(percentage)
Adult unemploy-ment rate
(percentage)
Ratio of youth unemploy-ment rate to adult unem-
ployment rate
Share of unemployed youth in total unemployed
(percentage)
Percentage of unemployed youth in youth population
LATIN AMERICA AND THE CARIbbEAN
Anguilla 2001 2 1 0 17 10 1.6 13 5 2.6 38 9
Antigua and Barbuda 2001 12 6 1 22 18 1.2 20 6 3.2 38 10
Argentina 2006 4282 1966 460 29 19 1.5 23 6 3.6 44 11
Aruba 1997 .. 5 1 25 17 1.5 20 6 3.5 31 ..
Bahamas 2007 32 6 22 17 1.3 19 6 3.4 41 ..
Barbados 2003 36 21 5 29 24 1.2 26 9 3.1 34 15
Belize 2005 58 29 6 29 14 2.1 20 8 2.4 46 10
Bolivia (Plurinational State of) 2002 .. 911 84 12 7 1.6 9 4 2.2 42 ..
Brazil 2006 .. .. 3939 .. .. .. .. .. .. 49 ..
British Virgin Islands 1991 .. 2 0 7 8 0.9 8 3 2.8 41 ..
Cayman Islands 2007 5 3 0 11 11 1.0 11 3 3.5 24 6
Chile 2007 2880 963 180 23 16 1.4 19 5 3.5 35 6
Colombia 2007 10779 3928 827 28 16 1.7 21 8 2.5 37 8
Costa Rica 2007 903 464 50 15 8 1.8 11 3 4.0 54 6
Cuba 2007 .. .. 37 .. .. .. .. .. .. 42 ..
Dominican Republic 2007 1816 953 289 45 21 2.1 30 11 2.7 44 16
Ecuador 2006 1767 907 148 23 12 1.9 16 5 3.0 45 8
El Salvador 2006 1346 640 79 10 14 0.7 12 5 2.6 44 6
French Guiana 2007 .. .. 2 .. .. .. .. .. .. 18 ..
Grenada 1998 16 10 3 39 25 1.6 32 10 3.1 49 19
Guadeloupe 2006 .. .. 8 .. .. .. .. .. .. 17 ..
Guatemala 1994 .. .. 11 .. .. .. .. .. .. 68 ..
Guyana 2002 131 64 15 31 21 1.5 24 8 3.0 49 12
Haiti 1999 1554 497 89 21 15 1.4 18 5 3.6 43 6
Honduras 2005 1562 757 53 11 5 2.2 7 3 2.4 50 3
Jamaica 2006 .. .. 46 .. .. .. .. .. .. 39 ..
Martinique 2007 .. .. 8 .. .. .. .. .. .. 20 ..
Mexico 2007 19485 9239 618 8 6 1.2 7 3 2.7 41 3
Netherlands Antilles 2007 18 5 1 26 23 1.2 24 11 2.2 17 7
Nicaragua 2006 1237 591 51 10 8 1.2 9 4 2.1 45 4
Panama 2007 543 256 42 24 13 1.8 17 5 3.6 46 8
Paraguay 2007 1236 718 88 18 9 2.1 12 3 3.7 56 7
Peru 2007 1557 890 127 15 14 1.1 14 5 3.0 43 8
Puerto Rico 2007 525 167 37 19 24 0.8 22 9 2.4 24 7
Saint Lucia 2004 .. 16 7 46 37 1.2 41 16 2.6 40 ..
Saint Vincent and the Grenadines 1991 22 13 5 43 32 1.4 37 13 2.8 55 21
151

Annex table 8: Youth unemployment indicators continued
Country or territory
YearYouth popu-
lation (thousands)
Youth labour force
(thousands)
unemployed youth
(thousands)
Female youth un-employment rate
(percentage)
Male youth un-employment rate
(percentage)
Ratio of female to male youth unem-
ployment
Youth unemployment rate
(percentage)
Adult unemploy-ment rate
(percentage)
Ratio of youth unemploy-ment rate to adult unem-
ployment rate
Share of unemployed youth in total unemployed
(percentage)
Percentage of unemployed youth in youth population
Suriname 2004 .. 29 6 .. .. .. 22 7 3.0 38 ..
Trinidad and Tobago 2005 245 132 22 22 13 1.7 17 6 2.9 44 9
Uruguay 2007 546 273 66 30 20 1.5 24 6 4.0 44 12
Venezuela (Bolivarian Republic of) 2007 5221 2363 339 17 13 1.4 14 6 2.4 37 7
NoRTHERN AMERICA
Bermuda 2000 7 3 0 8 14 0.5 11 2 5.7 37 6
Canada 2007 4353 2915 326 10 12 0.8 11 5 2.2 30 8
United States of America 2007 37410 22217 2342 9 12 0.8 11 4 2.9 33 6
oCEANIA
American Samoa 1990 9 3 0 12 12 1.0 12 4 3.4 43 4
Australia 2007 2895 2051 192 9 9 1.0 9 3 2.9 40 7
Cook Islands 1991 4 2 0 20 13 1.6 15 4 3.8 63 8
Fiji 1996 151 67 9 17 11 1.5 13 4 3.6 51 6
French Polynesia 2002 44 18 6 39 29 1.3 33 7 4.7 50 13
Guam 1987 .. .. 1 .. .. .. .. .. .. 61 ..
New Caledonia 1996 .. .. 10 .. .. .. .. .. .. 66 ..
New Zealand 2007 607 394 38 10 10 1.0 10 2 4.3 48 6
Niue 2001 0 0 0 8 10 0.7 9 1 9.1 62 5
Northern Mariana Islands 2003 10 7 0 4 11 0.4 6 4 1.4 23 4
Samoa 2001 .. 12 2 16 11 1.5 12 3 4.5 58 ..
Solomon Islands 1999 86 25 11 46 46 1.0 46 26 1.8 42 13
Tonga 2003 .. 7 1 15 10 1.5 12 4 3.3 43 ..
Source: International Labour Organization (2009), Key Indicators of the Labour Market, 6th ed. (Geneva).
NoTES:
Two dots (..) indicate that data are not available or are not separately reported.
Data repositories are mainly from LABORSTA, an International Labour Office database on labour statistics, and the Organization for Economic Cooperation and Development (OECD). Detailed information on data, including type of survey, geographic and coverage limitations, reference period, and other remarks are available from the source publication listed above.
152

Country or territory
YearYouth popu-
lation (thousands)
Youth labour force
(thousands)
unemployed youth
(thousands)
Female youth un-employment rate
(percentage)
Male youth un-employment rate
(percentage)
Ratio of female to male youth unem-
ployment
Youth unemployment rate
(percentage)
Adult unemploy-ment rate
(percentage)
Ratio of youth unemploy-ment rate to adult unem-
ployment rate
Share of unemployed youth in total unemployed
(percentage)
Percentage of unemployed youth in youth population
Suriname 2004 .. 29 6 .. .. .. 22 7 3.0 38 ..
Trinidad and Tobago 2005 245 132 22 22 13 1.7 17 6 2.9 44 9
Uruguay 2007 546 273 66 30 20 1.5 24 6 4.0 44 12
Venezuela (Bolivarian Republic of) 2007 5221 2363 339 17 13 1.4 14 6 2.4 37 7
NoRTHERN AMERICA
Bermuda 2000 7 3 0 8 14 0.5 11 2 5.7 37 6
Canada 2007 4353 2915 326 10 12 0.8 11 5 2.2 30 8
United States of America 2007 37410 22217 2342 9 12 0.8 11 4 2.9 33 6
oCEANIA
American Samoa 1990 9 3 0 12 12 1.0 12 4 3.4 43 4
Australia 2007 2895 2051 192 9 9 1.0 9 3 2.9 40 7
Cook Islands 1991 4 2 0 20 13 1.6 15 4 3.8 63 8
Fiji 1996 151 67 9 17 11 1.5 13 4 3.6 51 6
French Polynesia 2002 44 18 6 39 29 1.3 33 7 4.7 50 13
Guam 1987 .. .. 1 .. .. .. .. .. .. 61 ..
New Caledonia 1996 .. .. 10 .. .. .. .. .. .. 66 ..
New Zealand 2007 607 394 38 10 10 1.0 10 2 4.3 48 6
Niue 2001 0 0 0 8 10 0.7 9 1 9.1 62 5
Northern Mariana Islands 2003 10 7 0 4 11 0.4 6 4 1.4 23 4
Samoa 2001 .. 12 2 16 11 1.5 12 3 4.5 58 ..
Solomon Islands 1999 86 25 11 46 46 1.0 46 26 1.8 42 13
Tonga 2003 .. 7 1 15 10 1.5 12 4 3.3 43 ..
Source: International Labour Organization (2009), Key Indicators of the Labour Market, 6th ed. (Geneva).
153
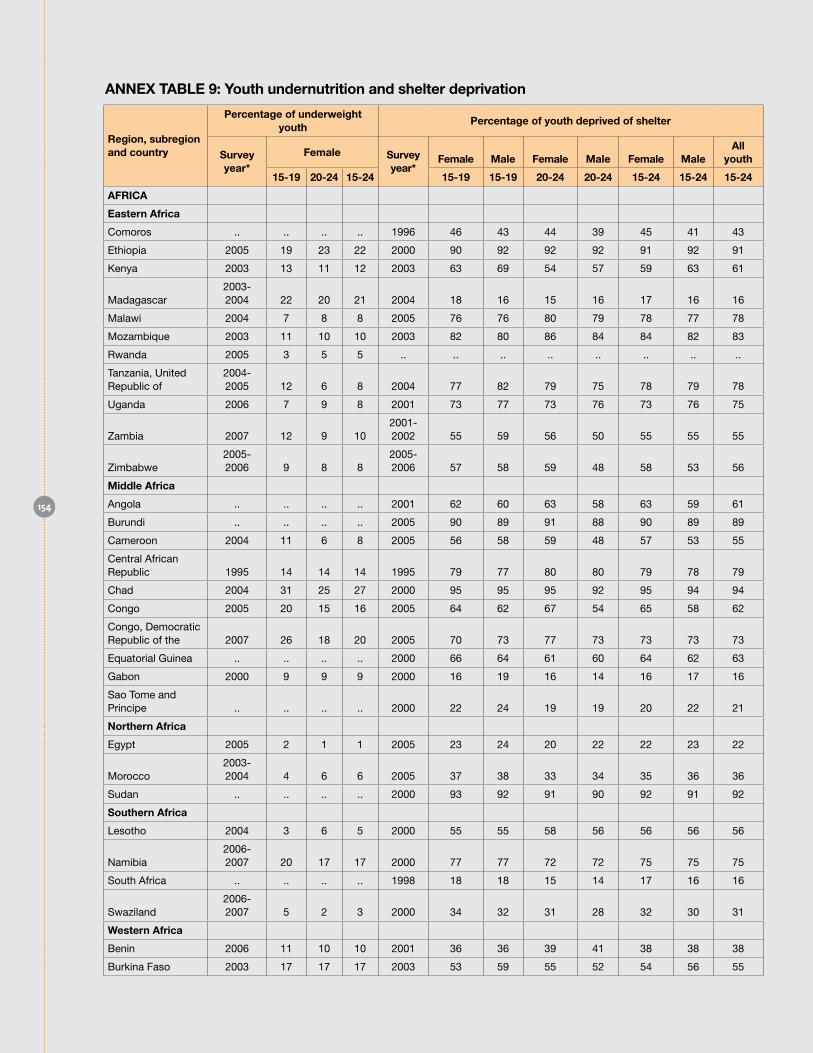
ANNEX TAbLE 9: Youth undernutrition and shelter deprivation
Region, subregion and country
Percentage of underweight youth
Percentage of youth deprived of shelter
Survey year*
Female Survey year*
Female Male Female Male Female MaleAll
youth
15-19 20-24 15-24 15-19 15-19 20-24 20-24 15-24 15-24 15-24
AFRICA
Eastern Africa
Comoros .. .. .. .. 1996 46 43 44 39 45 41 43
Ethiopia 2005 19 23 22 2000 90 92 92 92 91 92 91
Kenya 2003 13 11 12 2003 63 69 54 57 59 63 61
Madagascar2003-2004 22 20 21 2004 18 16 15 16 17 16 16
Malawi 2004 7 8 8 2005 76 76 80 79 78 77 78
Mozambique 2003 11 10 10 2003 82 80 86 84 84 82 83
Rwanda 2005 3 5 5 .. .. .. .. .. .. .. ..
Tanzania, United Republic of
2004-2005 12 6 8 2004 77 82 79 75 78 79 78
Uganda 2006 7 9 8 2001 73 77 73 76 73 76 75
Zambia 2007 12 9 102001-2002 55 59 56 50 55 55 55
Zimbabwe2005-2006 9 8 8
2005-2006 57 58 59 48 58 53 56
Middle Africa
Angola .. .. .. .. 2001 62 60 63 58 63 59 61
Burundi .. .. .. .. 2005 90 89 91 88 90 89 89
Cameroon 2004 11 6 8 2005 56 58 59 48 57 53 55
Central African Republic 1995 14 14 14 1995 79 77 80 80 79 78 79
Chad 2004 31 25 27 2000 95 95 95 92 95 94 94
Congo 2005 20 15 16 2005 64 62 67 54 65 58 62
Congo, Democratic Republic of the 2007 26 18 20 2005 70 73 77 73 73 73 73
Equatorial Guinea .. .. .. .. 2000 66 64 61 60 64 62 63
Gabon 2000 9 9 9 2000 16 19 16 14 16 17 16
Sao Tome and Principe .. .. .. .. 2000 22 24 19 19 20 22 21
Northern Africa
Egypt 2005 2 1 1 2005 23 24 20 22 22 23 22
Morocco2003-2004 4 6 6 2005 37 38 33 34 35 36 36
Sudan .. .. .. .. 2000 93 92 91 90 92 91 92
Southern Africa
Lesotho 2004 3 6 5 2000 55 55 58 56 56 56 56
Namibia2006-2007 20 17 17 2000 77 77 72 72 75 75 75
South Africa .. .. .. .. 1998 18 18 15 14 17 16 16
Swaziland2006-2007 5 2 3 2000 34 32 31 28 32 30 31
Western Africa
Benin 2006 11 10 10 2001 36 36 39 41 38 38 38
Burkina Faso 2003 17 17 17 2003 53 59 55 52 54 56 55
154
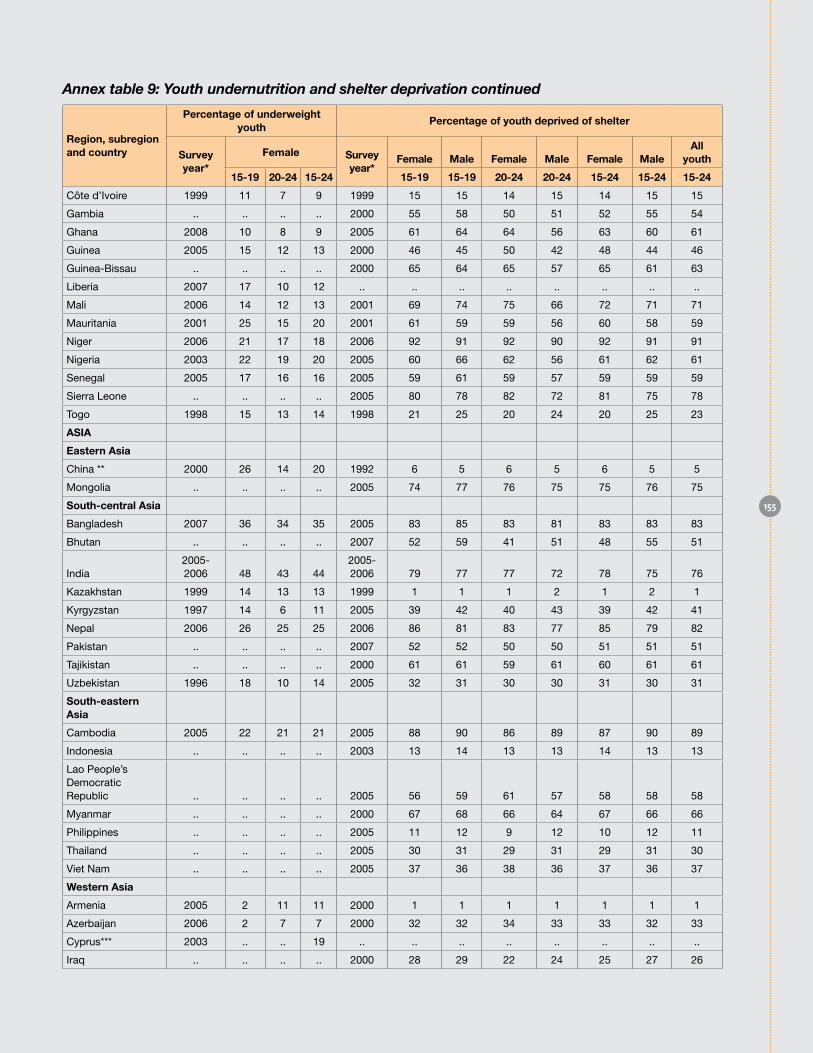
Annex table 9: Youth undernutrition and shelter deprivation continued
155
Region, subregion and country
Percentage of underweight youth
Percentage of youth deprived of shelter
Survey year*
Female Survey year*
Female Male Female Male Female MaleAll
youth
15-19 20-24 15-24 15-19 15-19 20-24 20-24 15-24 15-24 15-24
Côte d’Ivoire 1999 11 7 9 1999 15 15 14 15 14 15 15
Gambia .. .. .. .. 2000 55 58 50 51 52 55 54
Ghana 2008 10 8 9 2005 61 64 64 56 63 60 61
Guinea 2005 15 12 13 2000 46 45 50 42 48 44 46
Guinea-Bissau .. .. .. .. 2000 65 64 65 57 65 61 63
Liberia 2007 17 10 12 .. .. .. .. .. .. .. ..
Mali 2006 14 12 13 2001 69 74 75 66 72 71 71
Mauritania 2001 25 15 20 2001 61 59 59 56 60 58 59
Niger 2006 21 17 18 2006 92 91 92 90 92 91 91
Nigeria 2003 22 19 20 2005 60 66 62 56 61 62 61
Senegal 2005 17 16 16 2005 59 61 59 57 59 59 59
Sierra Leone .. .. .. .. 2005 80 78 82 72 81 75 78
Togo 1998 15 13 14 1998 21 25 20 24 20 25 23
ASIA
Eastern Asia
China ** 2000 26 14 20 1992 6 5 6 5 6 5 5
Mongolia .. .. .. .. 2005 74 77 76 75 75 76 75
South-central Asia
Bangladesh 2007 36 34 35 2005 83 85 83 81 83 83 83
Bhutan .. .. .. .. 2007 52 59 41 51 48 55 51
India2005-2006 48 43 44
2005-2006 79 77 77 72 78 75 76
Kazakhstan 1999 14 13 13 1999 1 1 1 2 1 2 1
Kyrgyzstan 1997 14 6 11 2005 39 42 40 43 39 42 41
Nepal 2006 26 25 25 2006 86 81 83 77 85 79 82
Pakistan .. .. .. .. 2007 52 52 50 50 51 51 51
Tajikistan .. .. .. .. 2000 61 61 59 61 60 61 61
Uzbekistan 1996 18 10 14 2005 32 31 30 30 31 30 31
South-eastern Asia
Cambodia 2005 22 21 21 2005 88 90 86 89 87 90 89
Indonesia .. .. .. .. 2003 13 14 13 13 14 13 13
Lao People’s Democratic Republic .. .. .. .. 2005 56 59 61 57 58 58 58
Myanmar .. .. .. .. 2000 67 68 66 64 67 66 66
Philippines .. .. .. .. 2005 11 12 9 12 10 12 11
Thailand .. .. .. .. 2005 30 31 29 31 29 31 30
Viet Nam .. .. .. .. 2005 37 36 38 36 37 36 37
Western Asia
Armenia 2005 2 11 11 2000 1 1 1 1 1 1 1
Azerbaijan 2006 2 7 7 2000 32 32 34 33 33 32 33
Cyprus*** 2003 .. .. 19 .. .. .. .. .. .. .. ..
Iraq .. .. .. .. 2000 28 29 22 24 25 27 26
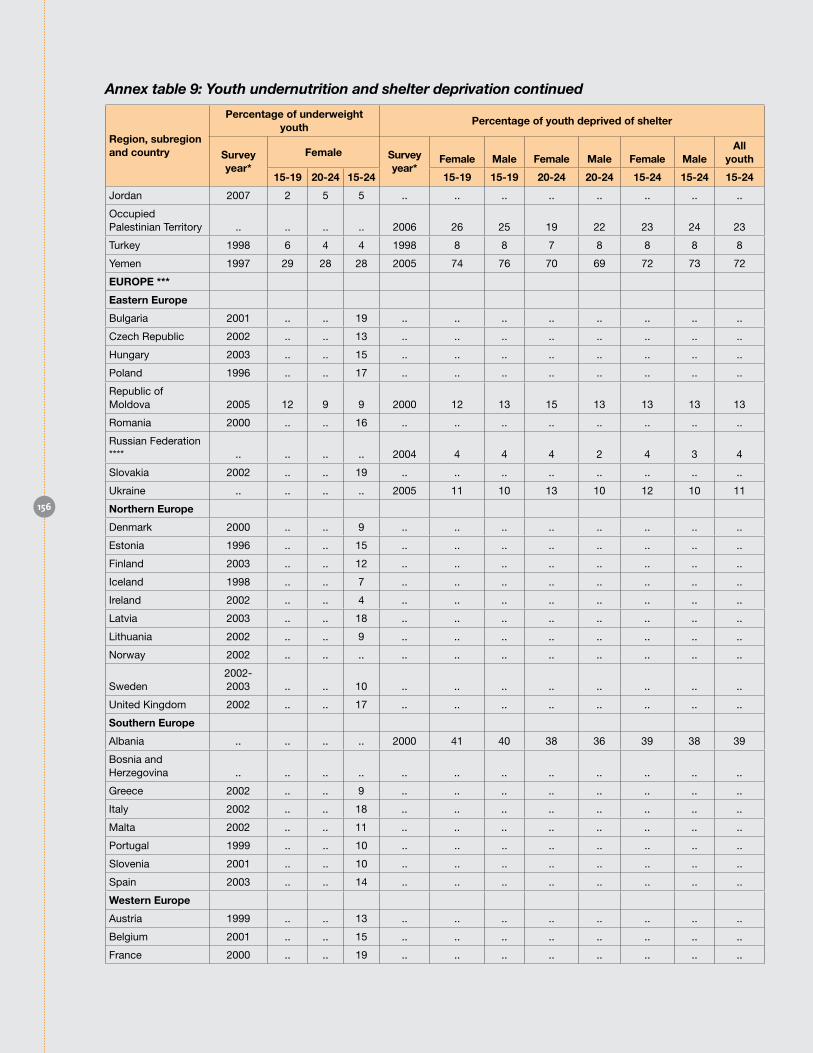
Annex table 9: Youth undernutrition and shelter deprivation continued
Region, subregion and country
Percentage of underweight youth
Percentage of youth deprived of shelter
Survey year*
Female Survey year*
Female Male Female Male Female MaleAll
youth
15-19 20-24 15-24 15-19 15-19 20-24 20-24 15-24 15-24 15-24
Jordan 2007 2 5 5 .. .. .. .. .. .. .. ..
Occupied Palestinian Territory .. .. .. .. 2006 26 25 19 22 23 24 23
Turkey 1998 6 4 4 1998 8 8 7 8 8 8 8
Yemen 1997 29 28 28 2005 74 76 70 69 72 73 72
EuRoPE ***
Eastern Europe
Bulgaria 2001 .. .. 19 .. .. .. .. .. .. .. ..
Czech Republic 2002 .. .. 13 .. .. .. .. .. .. .. ..
Hungary 2003 .. .. 15 .. .. .. .. .. .. .. ..
Poland 1996 .. .. 17 .. .. .. .. .. .. .. ..
Republic of Moldova 2005 12 9 9 2000 12 13 15 13 13 13 13
Romania 2000 .. .. 16 .. .. .. .. .. .. .. ..
Russian Federation **** .. .. .. .. 2004 4 4 4 2 4 3 4
Slovakia 2002 .. .. 19 .. .. .. .. .. .. .. ..
Ukraine .. .. .. .. 2005 11 10 13 10 12 10 11
Northern Europe
Denmark 2000 .. .. 9 .. .. .. .. .. .. .. ..
Estonia 1996 .. .. 15 .. .. .. .. .. .. .. ..
Finland 2003 .. .. 12 .. .. .. .. .. .. .. ..
Iceland 1998 .. .. 7 .. .. .. .. .. .. .. ..
Ireland 2002 .. .. 4 .. .. .. .. .. .. .. ..
Latvia 2003 .. .. 18 .. .. .. .. .. .. .. ..
Lithuania 2002 .. .. 9 .. .. .. .. .. .. .. ..
Norway 2002 .. .. .. .. .. .. .. .. .. .. ..
Sweden2002-2003 .. .. 10 .. .. .. .. .. .. .. ..
United Kingdom 2002 .. .. 17 .. .. .. .. .. .. .. ..
Southern Europe
Albania .. .. .. .. 2000 41 40 38 36 39 38 39
Bosnia and Herzegovina .. .. .. .. .. .. .. .. .. .. .. ..
Greece 2002 .. .. 9 .. .. .. .. .. .. .. ..
Italy 2002 .. .. 18 .. .. .. .. .. .. .. ..
Malta 2002 .. .. 11 .. .. .. .. .. .. .. ..
Portugal 1999 .. .. 10 .. .. .. .. .. .. .. ..
Slovenia 2001 .. .. 10 .. .. .. .. .. .. .. ..
Spain 2003 .. .. 14 .. .. .. .. .. .. .. ..
Western Europe
Austria 1999 .. .. 13 .. .. .. .. .. .. .. ..
Belgium 2001 .. .. 15 .. .. .. .. .. .. .. ..
France 2000 .. .. 19 .. .. .. .. .. .. .. ..
156

Annex table 9: Youth undernutrition and shelter deprivation continued
Region, subregion and country
Percentage of underweight youth
Percentage of youth deprived of shelter
Survey year*
Female Survey year*
Female Male Female Male Female MaleAll
youth
15-19 20-24 15-24 15-19 15-19 20-24 20-24 15-24 15-24 15-24
Germany 1998 .. .. 4 .. .. .. .. .. .. .. ..
Netherlands2001-2002 .. .. 13 .. .. .. .. .. .. .. ..
Switzerland 2002 .. .. 17 .. .. .. .. .. .. .. ..
LATIN AMERICA AND THE CARIbbEAN
Caribbean
Dominican Republic 2002 11 7 8 2002 11 13 12 14 12 13 13
Haiti2005-2006 13 16 15 2000 37 43 40 39 38 42 40
Central America
Guatemala 1999 2 2 2 1999 35 46 34 36 35 42 38
Honduras2005-2006 6 4 5 .. .. .. .. .. .. .. ..
Nicaragua 2001 7 4 6 2001 64 67 58 63 61 65 63
South America
Bolivia (Plurinational State of) 2003 3 2 2 2003 50 51 51 47 51 50 50
Brazil 1996 8 7 8 1996 8 10 7 9 7 9 8
Colombia 2005 9 7 7 2005 8 11 6 8 7 10 8
Guyana .. .. .. .. 2000 35 37 36 32 35 35 35
Peru 2003 2 1 1 2003 47 53 43 48 45 51 48
Suriname .. .. .. .. 2000 13 11 13 7 13 9 11
Venezuela (Bolivarian Republic of) .. .. .. .. 2000 47 44 47 44 47 44 46
Source: Calculated by the Townsend Centre for International Poverty Research, University of Bristol. Available from http://www.bristol.ac.uk/poverty.
NoTES:
Two dots (..) indicate that data are not available or are not separately reported.
* Unless otherwise indicated, data are taken from Demographic Health Surveys (DHS) or Multiple Indicator Cluster Surveys (MICS) for the latest available year (range: 1995-2008).
** China, excluding Hong Kong (SAR) and Macao (SAR); data sources are the China Health and Nutrition Survey (CHNS) and National Statistical Society of China (NSSC).
*** Data taken from Eurostat New Cronos and European Community Household Panel survey (ECHP).
**** Russian Federation: data taken from Russian Longitudinal Monitoring Surveys (RLMS).
157
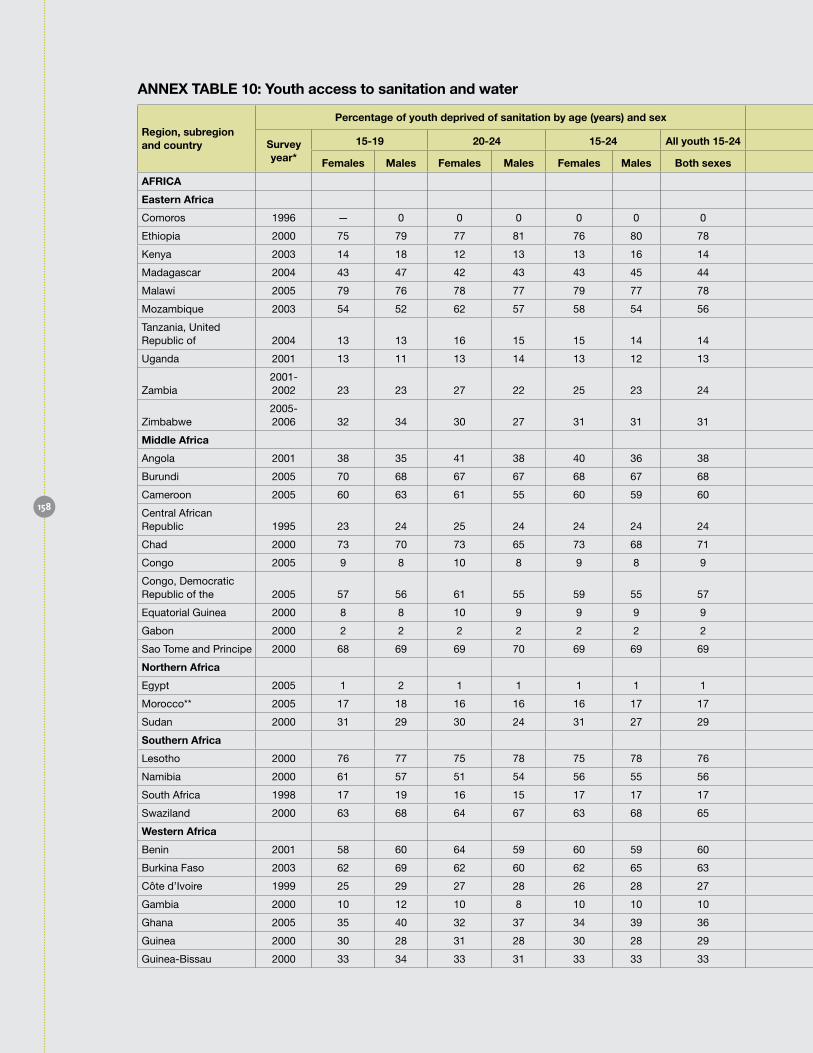
ANNEX TAbLE 10: Youth access to sanitation and water
Region, subregion and country
Percentage of youth deprived of sanitation by age (years) and sex Percentage of youth deprived of water by age (years) and sex
Survey year*
15-19 20-24 15-24 All youth 15-24 Survey year*
15-19 20-24 15-24 All youth 15-24
Females Males Females Males Females Males both sexes Females Males Females Males Females Males both sexes
AFRICA
Eastern Africa
Comoros 1996 — 0 0 0 0 0 0 1996 12 10 12 12 10 12 11
Ethiopia 2000 75 79 77 81 76 80 78 2000 85 85 86 87 86 86 86
Kenya 2003 14 18 12 13 13 16 14 2003 64 69 54 55 60 63 61
Madagascar 2004 43 47 42 43 43 45 44 2004 66 67 63 68 65 68 66
Malawi 2005 79 76 78 77 79 77 78 2005 44 47 45 45 45 46 45
Mozambique 2003 54 52 62 57 58 54 56 2003 52 47 61 49 56 48 52
Tanzania, United Republic of 2004 13 13 16 15 15 14 14 2004 59 58 55 55 57 57 57
Uganda 2001 13 11 13 14 13 12 13 2001 80 83 77 79 79 81 80
Zambia2001-2002 23 23 27 22 25 23 24
2001-2002 48 50 46 46 48 48 48
Zimbabwe2005-2006 32 34 30 27 31 31 31
2005-2006 31 36 28 25 30 31 30
Middle Africa
Angola 2001 38 35 41 38 40 36 38 2001 37 35 37 34 37 34 36
Burundi 2005 70 68 67 67 68 67 68 2005 52 53 54 55 53 54 53
Cameroon 2005 60 63 61 55 60 59 60 2005 35 37 33 32 34 34 34
Central African Republic 1995 23 24 25 24 24 24 24 1995 51 48 51 47 51 48 49
Chad 2000 73 70 73 65 73 68 71 2000 50 54 52 54 51 54 52
Congo 2005 9 8 10 8 9 8 9 2005 37 37 35 32 36 34 35
Congo, Democratic Republic of the 2005 57 56 61 55 59 55 57 2005 57 60 61 58 59 59 59
Equatorial Guinea 2000 8 8 10 9 9 9 9 2000 57 60 60 56 59 58 58
Gabon 2000 2 2 2 2 2 2 2 2000 24 27 25 22 24 25 24
Sao Tome and Principe 2000 68 69 69 70 69 69 69 2000 46 45 43 46 45 45 45
Northern Africa
Egypt 2005 1 2 1 1 1 1 1 2005 2 1 1 2 2 1 1
Morocco** 2005 17 18 16 16 16 17 17 2005 25 26 24 23 25 25 25
Sudan 2000 31 29 30 24 31 27 29 2000 24 23 23 20 23 21 22
Southern Africa
Lesotho 2000 76 77 75 78 75 78 76 2000 46 47 45 47 46 47 46
Namibia 2000 61 57 51 54 56 55 56 2000 35 34 28 27 32 30 31
South Africa 1998 17 19 16 15 17 17 17 1998 24 25 20 18 22 22 22
Swaziland 2000 63 68 64 67 63 68 65 2000 57 64 53 56 55 61 58
Western Africa
Benin 2001 58 60 64 59 60 59 60 2001 41 43 45 44 43 44 43
Burkina Faso 2003 62 69 62 60 62 65 63 2003 55 57 57 54 56 56 56
Côte d’Ivoire 1999 25 29 27 28 26 28 27 1999 18 19 18 13 18 16 17
Gambia 2000 10 12 10 8 10 10 10 2000 42 42 37 41 40 42 41
Ghana 2005 35 40 32 37 34 39 36 2005 26 30 25 25 26 28 27
Guinea 2000 30 28 31 28 30 28 29 2000 36 37 38 34 37 36 36
Guinea-Bissau 2000 33 34 33 31 33 33 33 2000 52 54 51 49 52 52 52
158
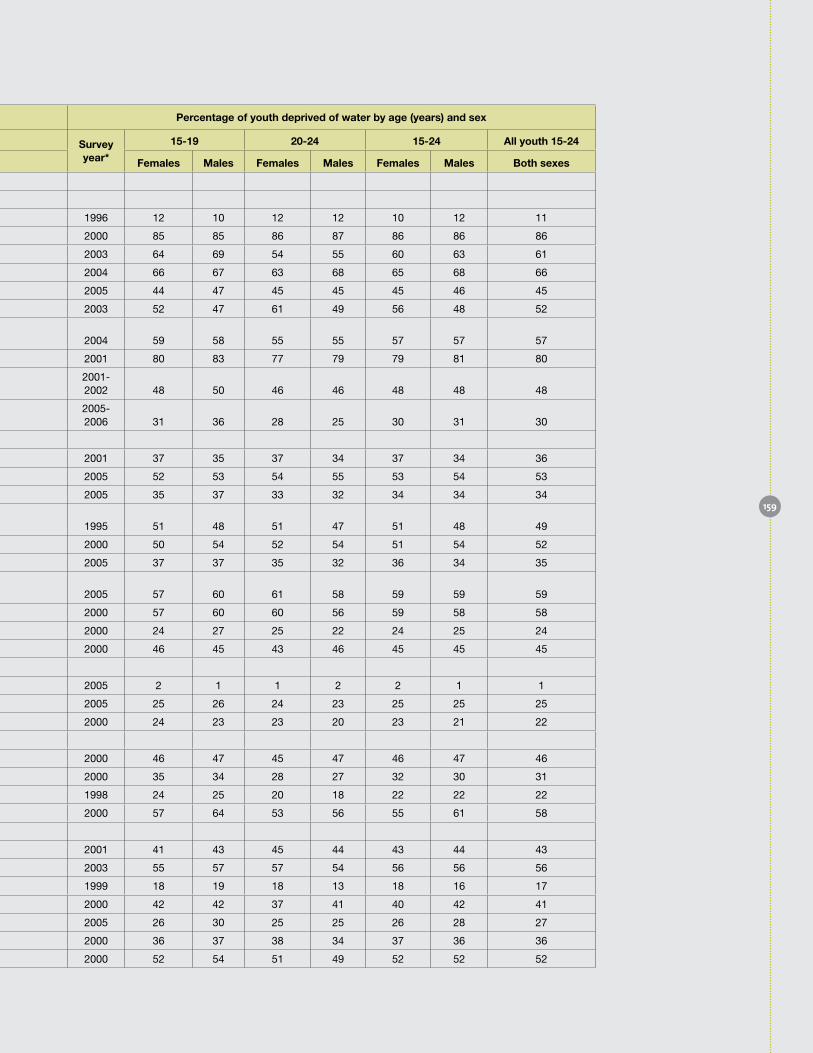
Region, subregion and country
Percentage of youth deprived of sanitation by age (years) and sex Percentage of youth deprived of water by age (years) and sex
Survey year*
15-19 20-24 15-24 All youth 15-24 Survey year*
15-19 20-24 15-24 All youth 15-24
Females Males Females Males Females Males both sexes Females Males Females Males Females Males both sexes
AFRICA
Eastern Africa
Comoros 1996 — 0 0 0 0 0 0 1996 12 10 12 12 10 12 11
Ethiopia 2000 75 79 77 81 76 80 78 2000 85 85 86 87 86 86 86
Kenya 2003 14 18 12 13 13 16 14 2003 64 69 54 55 60 63 61
Madagascar 2004 43 47 42 43 43 45 44 2004 66 67 63 68 65 68 66
Malawi 2005 79 76 78 77 79 77 78 2005 44 47 45 45 45 46 45
Mozambique 2003 54 52 62 57 58 54 56 2003 52 47 61 49 56 48 52
Tanzania, United Republic of 2004 13 13 16 15 15 14 14 2004 59 58 55 55 57 57 57
Uganda 2001 13 11 13 14 13 12 13 2001 80 83 77 79 79 81 80
Zambia2001-2002 23 23 27 22 25 23 24
2001-2002 48 50 46 46 48 48 48
Zimbabwe2005-2006 32 34 30 27 31 31 31
2005-2006 31 36 28 25 30 31 30
Middle Africa
Angola 2001 38 35 41 38 40 36 38 2001 37 35 37 34 37 34 36
Burundi 2005 70 68 67 67 68 67 68 2005 52 53 54 55 53 54 53
Cameroon 2005 60 63 61 55 60 59 60 2005 35 37 33 32 34 34 34
Central African Republic 1995 23 24 25 24 24 24 24 1995 51 48 51 47 51 48 49
Chad 2000 73 70 73 65 73 68 71 2000 50 54 52 54 51 54 52
Congo 2005 9 8 10 8 9 8 9 2005 37 37 35 32 36 34 35
Congo, Democratic Republic of the 2005 57 56 61 55 59 55 57 2005 57 60 61 58 59 59 59
Equatorial Guinea 2000 8 8 10 9 9 9 9 2000 57 60 60 56 59 58 58
Gabon 2000 2 2 2 2 2 2 2 2000 24 27 25 22 24 25 24
Sao Tome and Principe 2000 68 69 69 70 69 69 69 2000 46 45 43 46 45 45 45
Northern Africa
Egypt 2005 1 2 1 1 1 1 1 2005 2 1 1 2 2 1 1
Morocco** 2005 17 18 16 16 16 17 17 2005 25 26 24 23 25 25 25
Sudan 2000 31 29 30 24 31 27 29 2000 24 23 23 20 23 21 22
Southern Africa
Lesotho 2000 76 77 75 78 75 78 76 2000 46 47 45 47 46 47 46
Namibia 2000 61 57 51 54 56 55 56 2000 35 34 28 27 32 30 31
South Africa 1998 17 19 16 15 17 17 17 1998 24 25 20 18 22 22 22
Swaziland 2000 63 68 64 67 63 68 65 2000 57 64 53 56 55 61 58
Western Africa
Benin 2001 58 60 64 59 60 59 60 2001 41 43 45 44 43 44 43
Burkina Faso 2003 62 69 62 60 62 65 63 2003 55 57 57 54 56 56 56
Côte d’Ivoire 1999 25 29 27 28 26 28 27 1999 18 19 18 13 18 16 17
Gambia 2000 10 12 10 8 10 10 10 2000 42 42 37 41 40 42 41
Ghana 2005 35 40 32 37 34 39 36 2005 26 30 25 25 26 28 27
Guinea 2000 30 28 31 28 30 28 29 2000 36 37 38 34 37 36 36
Guinea-Bissau 2000 33 34 33 31 33 33 33 2000 52 54 51 49 52 52 52
159
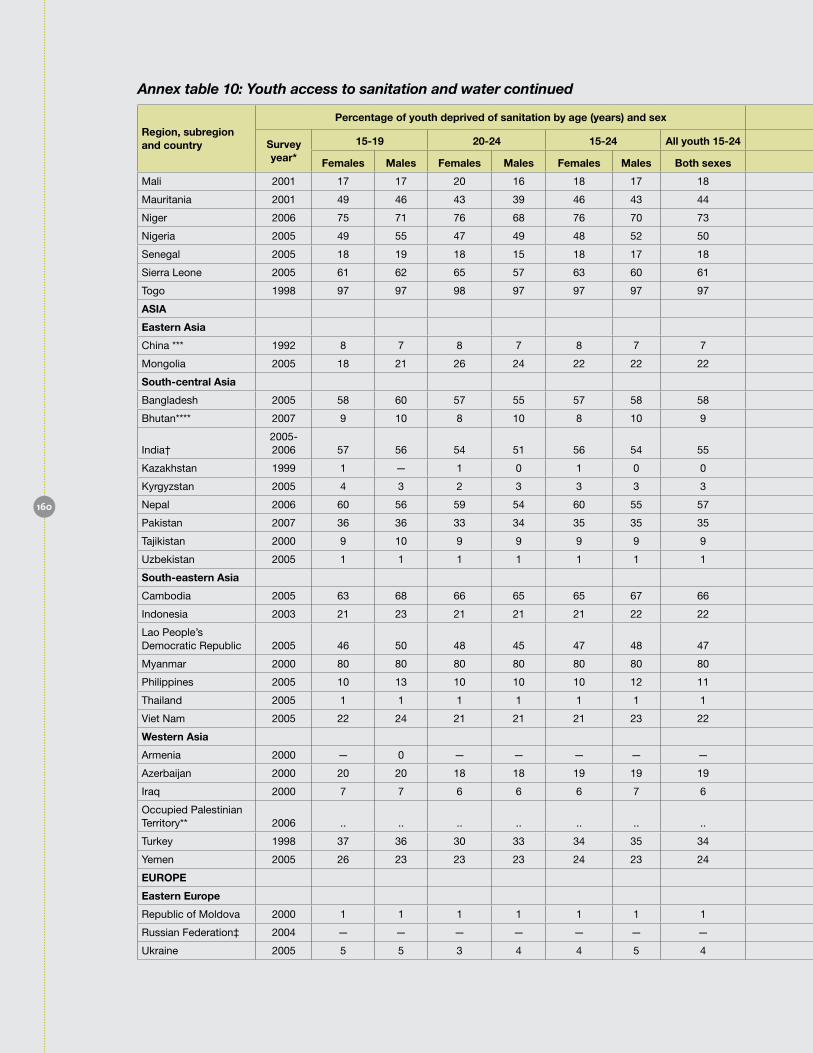
Annex table 10: Youth access to sanitation and water continued
Region, subregion and country
Percentage of youth deprived of sanitation by age (years) and sex Percentage of youth deprived of water by age (years) and sex
Survey year*
15-19 20-24 15-24 All youth 15-24 Survey year*
15-19 20-24 15-24 All youth 15-24
Females Males Females Males Females Males both sexes Females Males Females Males Females Males both sexes
Mali 2001 17 17 20 16 18 17 18 2001 56 61 61 55 58 58 58
Mauritania 2001 49 46 43 39 46 43 44 2001 54 54 52 49 53 51 52
Niger 2006 75 71 76 68 76 70 73 2006 60 57 61 53 61 55 58
Nigeria 2005 49 55 47 49 48 52 50 2005 52 55 50 50 52 53 52
Senegal 2005 18 19 18 15 18 17 18 2005 31 30 31 28 31 29 30
Sierra Leone 2005 61 62 65 57 63 60 61 2005 51 52 53 44 52 48 50
Togo 1998 97 97 98 97 97 97 97 1998 39 44 39 41 39 43 41
ASIA
Eastern Asia
China *** 1992 8 7 8 7 8 7 7 1992 34 34 32 33 33 33 33
Mongolia 2005 18 21 26 24 22 22 22 2005 33 35 38 36 35 36 35
South-central Asia
Bangladesh 2005 58 60 57 55 57 58 58 2005 3 3 3 3 3 3 3
Bhutan**** 2007 9 10 8 10 8 10 9 2007 12 13 12 11 12 12 12
India†2005-2006 57 56 54 51 56 54 55
2005-2006 15 15 15 14 15 15 15
Kazakhstan 1999 1 — 1 0 1 0 0 1999 45 49 45 44 45 46 46
Kyrgyzstan 2005 4 3 2 3 3 3 3 2005 11 16 10 12 11 14 12
Nepal 2006 60 56 59 54 60 55 57 2006 16 16 17 17 16 16 16
Pakistan 2007 36 36 33 34 35 35 35 2007 10 9 8 9 9 9 9
Tajikistan 2000 9 10 9 9 9 9 9 2000 53 58 54 55 53 56 55
Uzbekistan 2005 1 1 1 1 1 1 1 2005 9 10 11 10 10 10 10
South-eastern Asia
Cambodia 2005 63 68 66 65 65 67 66 2005 26 27 27 27 26 27 27
Indonesia 2003 21 23 21 21 21 22 22 2003 37 38 37 37 37 37 37
Lao People’s Democratic Republic 2005 46 50 48 45 47 48 47 2005 60 61 62 61 61 61 61
Myanmar 2000 80 80 80 80 80 80 80 2000 68 68 67 68 68 68 68
Philippines 2005 10 13 10 10 10 12 11 2005 17 17 17 16 17 17 17
Thailand 2005 1 1 1 1 1 1 1 2005 32 31 40 40 36 35 36
Viet Nam 2005 22 24 21 21 21 23 22 2005 11 13 11 11 11 12 12
Western Asia
Armenia 2000 — 0 — — — — — 2000 11 13 9 10 10 11 11
Azerbaijan 2000 20 20 18 18 19 19 19 2000 36 38 35 40 35 39 37
Iraq 2000 7 7 6 6 6 7 6 2000 18 18 17 16 17 17 17
Occupied Palestinian Territory** 2006 .. .. .. .. .. .. .. 2006 29 29 28 30 29 29 29
Turkey 1998 37 36 30 33 34 35 34 1998 37 32 35 35 36 33 34
Yemen 2005 26 23 23 23 24 23 24 2005 47 45 45 46 46 45 46
EuRoPE
Eastern Europe
Republic of Moldova 2000 1 1 1 1 1 1 1 2000 15 16 13 17 14 16 15
Russian Federation‡ 2004 — — — — — — — 2004 2 3 2 2 2 2 2
Ukraine 2005 5 5 3 4 4 5 4 2005 6 6 6 4 6 5 5
160
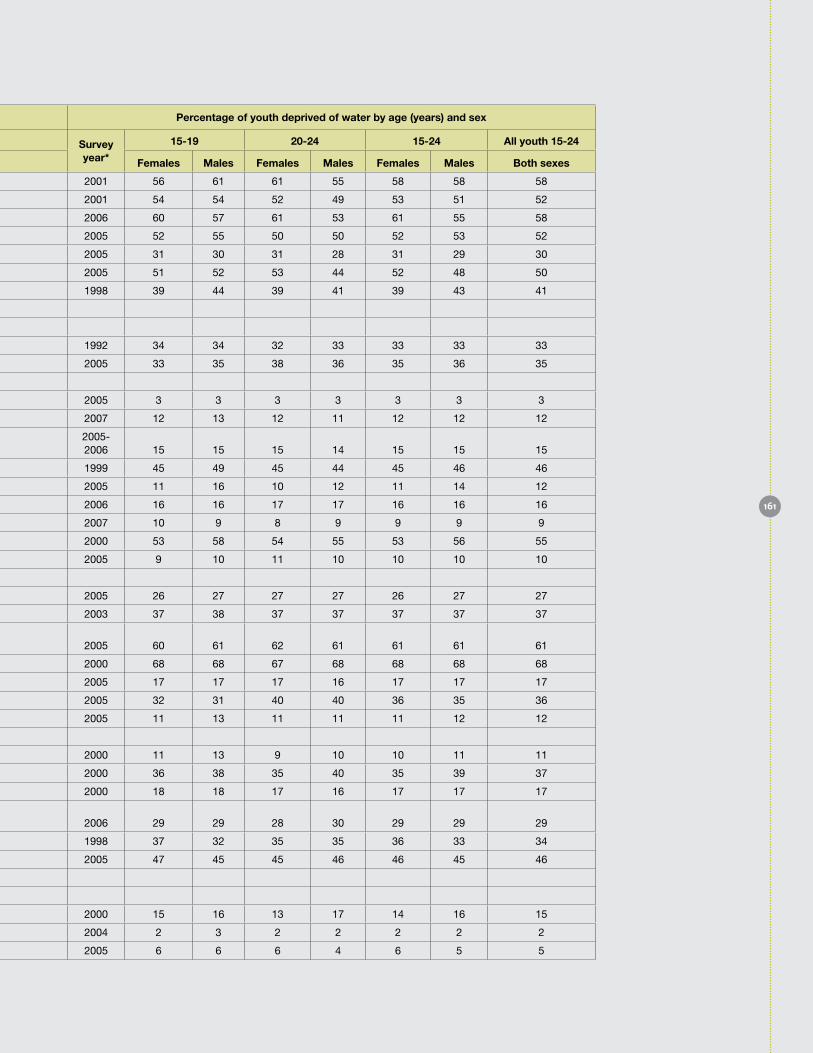
Region, subregion and country
Percentage of youth deprived of sanitation by age (years) and sex Percentage of youth deprived of water by age (years) and sex
Survey year*
15-19 20-24 15-24 All youth 15-24 Survey year*
15-19 20-24 15-24 All youth 15-24
Females Males Females Males Females Males both sexes Females Males Females Males Females Males both sexes
Mali 2001 17 17 20 16 18 17 18 2001 56 61 61 55 58 58 58
Mauritania 2001 49 46 43 39 46 43 44 2001 54 54 52 49 53 51 52
Niger 2006 75 71 76 68 76 70 73 2006 60 57 61 53 61 55 58
Nigeria 2005 49 55 47 49 48 52 50 2005 52 55 50 50 52 53 52
Senegal 2005 18 19 18 15 18 17 18 2005 31 30 31 28 31 29 30
Sierra Leone 2005 61 62 65 57 63 60 61 2005 51 52 53 44 52 48 50
Togo 1998 97 97 98 97 97 97 97 1998 39 44 39 41 39 43 41
ASIA
Eastern Asia
China *** 1992 8 7 8 7 8 7 7 1992 34 34 32 33 33 33 33
Mongolia 2005 18 21 26 24 22 22 22 2005 33 35 38 36 35 36 35
South-central Asia
Bangladesh 2005 58 60 57 55 57 58 58 2005 3 3 3 3 3 3 3
Bhutan**** 2007 9 10 8 10 8 10 9 2007 12 13 12 11 12 12 12
India†2005-2006 57 56 54 51 56 54 55
2005-2006 15 15 15 14 15 15 15
Kazakhstan 1999 1 — 1 0 1 0 0 1999 45 49 45 44 45 46 46
Kyrgyzstan 2005 4 3 2 3 3 3 3 2005 11 16 10 12 11 14 12
Nepal 2006 60 56 59 54 60 55 57 2006 16 16 17 17 16 16 16
Pakistan 2007 36 36 33 34 35 35 35 2007 10 9 8 9 9 9 9
Tajikistan 2000 9 10 9 9 9 9 9 2000 53 58 54 55 53 56 55
Uzbekistan 2005 1 1 1 1 1 1 1 2005 9 10 11 10 10 10 10
South-eastern Asia
Cambodia 2005 63 68 66 65 65 67 66 2005 26 27 27 27 26 27 27
Indonesia 2003 21 23 21 21 21 22 22 2003 37 38 37 37 37 37 37
Lao People’s Democratic Republic 2005 46 50 48 45 47 48 47 2005 60 61 62 61 61 61 61
Myanmar 2000 80 80 80 80 80 80 80 2000 68 68 67 68 68 68 68
Philippines 2005 10 13 10 10 10 12 11 2005 17 17 17 16 17 17 17
Thailand 2005 1 1 1 1 1 1 1 2005 32 31 40 40 36 35 36
Viet Nam 2005 22 24 21 21 21 23 22 2005 11 13 11 11 11 12 12
Western Asia
Armenia 2000 — 0 — — — — — 2000 11 13 9 10 10 11 11
Azerbaijan 2000 20 20 18 18 19 19 19 2000 36 38 35 40 35 39 37
Iraq 2000 7 7 6 6 6 7 6 2000 18 18 17 16 17 17 17
Occupied Palestinian Territory** 2006 .. .. .. .. .. .. .. 2006 29 29 28 30 29 29 29
Turkey 1998 37 36 30 33 34 35 34 1998 37 32 35 35 36 33 34
Yemen 2005 26 23 23 23 24 23 24 2005 47 45 45 46 46 45 46
EuRoPE
Eastern Europe
Republic of Moldova 2000 1 1 1 1 1 1 1 2000 15 16 13 17 14 16 15
Russian Federation‡ 2004 — — — — — — — 2004 2 3 2 2 2 2 2
Ukraine 2005 5 5 3 4 4 5 4 2005 6 6 6 4 6 5 5
161

Annex table 10: Youth access to sanitation and water continued
Region, subregion and country
Percentage of youth deprived of sanitation by age (years) and sex Percentage of youth deprived of water by age (years) and sex
Survey year*
15-19 20-24 15-24 All youth 15-24 Survey year*
15-19 20-24 15-24 All youth 15-24
Females Males Females Males Females Males both sexes Females Males Females Males Females Males both sexes
Southern Europe
Albania 2000 9 10 9 9 9 10 9 2000 17 15 15 14 16 15 15
Bosnia and Herzegovina 2000 5 5 5 6 5 6 5 2000 5 5 5 5 5 5 5
LATIN AMERICA AND THE CARIbbEAN
Caribbean
Dominican Republic 2002 4 4 5 6 4 5 5 2002 62 57 67 59 64 58 61
Haiti 2000 45 55 49 50 47 53 50 2000 36 46 35 38 36 42 39
Jamaica 2005 2 2 2 1 2 2 2 2005 8 8 6 7 7 8 7
Central America
Guatemala 1999 11 14 13 12 12 13 12 1999 25 23 26 25 26 24 25
Nicaragua 2001 12 14 15 15 14 15 14 2001 9 10 8 9 8 10 9
South America
Bolivia (Plurinational State of) 2003 28 31 25 26 27 28 28 2003 8 10 8 9 8 10 9
Brazil 1996 11 13 9 12 10 12 11 1996 3 2 3 2 3 2 3
Colombia 2005 7 9 6 7 7 8 7 2005 11 14 10 12 11 13 12
Guyana 2000 2 2 1 1 1 2 1 2000 15 19 22 19 18 19 19
Peru 2003 13 15 10 13 11 14 13 2003 19 21 17 20 18 20 19
Suriname 2000 13 6 14 4 13 5 9 2000 14 8 15 5 14 7 11
Venezuela (Bolivarian Republic of) 2000 6 7 7 5 6 6 6 2000 9 10 12 13 11 11 11
Source: Calculated by the Townsend Centre for International Poverty Research, University of Bristol. Available from http://www.bristol.ac.uk/poverty.
NoTES:
Two dots (..) indicate that data are not available or are not separately reported.
An em dash (—) indicates that the amount is nil or negligible.
* Unless otherwise indicated, data are taken from Demographic Health Surveys (DHS) or Multiple Indicator Cluster Surveys (MICS) for the latest available year (range: 1992-2004).
** Morocco and Occupied Palestinian Territory: data are from the Pan Arab Project for Family Health (PAPFAM).
*** China, excluding Hong Kong and Macao (male data in parentheses): data sources are the China Health and Nutrition Survey (CHNS) and National Statistical Society of China (NSSC).
**** Russian Federation: data taken from Russian Longitudinal Monitoring Surveys (RLMS).
† India: data are from the National Family Health Survey (NFHS3).
‡ Russian Federation: data are from Russian Longitudinal Monitoring Surveys (RLMS).
162
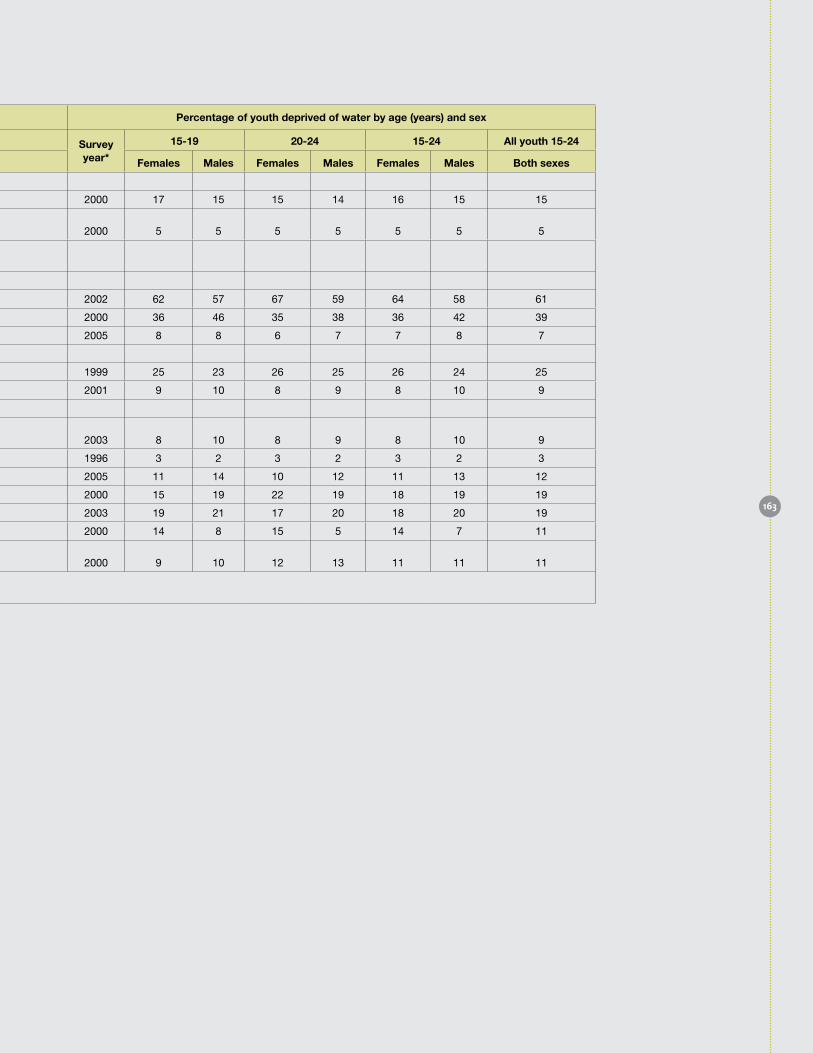
Region, subregion and country
Percentage of youth deprived of sanitation by age (years) and sex Percentage of youth deprived of water by age (years) and sex
Survey year*
15-19 20-24 15-24 All youth 15-24 Survey year*
15-19 20-24 15-24 All youth 15-24
Females Males Females Males Females Males both sexes Females Males Females Males Females Males both sexes
Southern Europe
Albania 2000 9 10 9 9 9 10 9 2000 17 15 15 14 16 15 15
Bosnia and Herzegovina 2000 5 5 5 6 5 6 5 2000 5 5 5 5 5 5 5
LATIN AMERICA AND THE CARIbbEAN
Caribbean
Dominican Republic 2002 4 4 5 6 4 5 5 2002 62 57 67 59 64 58 61
Haiti 2000 45 55 49 50 47 53 50 2000 36 46 35 38 36 42 39
Jamaica 2005 2 2 2 1 2 2 2 2005 8 8 6 7 7 8 7
Central America
Guatemala 1999 11 14 13 12 12 13 12 1999 25 23 26 25 26 24 25
Nicaragua 2001 12 14 15 15 14 15 14 2001 9 10 8 9 8 10 9
South America
Bolivia (Plurinational State of) 2003 28 31 25 26 27 28 28 2003 8 10 8 9 8 10 9
Brazil 1996 11 13 9 12 10 12 11 1996 3 2 3 2 3 2 3
Colombia 2005 7 9 6 7 7 8 7 2005 11 14 10 12 11 13 12
Guyana 2000 2 2 1 1 1 2 1 2000 15 19 22 19 18 19 19
Peru 2003 13 15 10 13 11 14 13 2003 19 21 17 20 18 20 19
Suriname 2000 13 6 14 4 13 5 9 2000 14 8 15 5 14 7 11
Venezuela (Bolivarian Republic of) 2000 6 7 7 5 6 6 6 2000 9 10 12 13 11 11 11
Source: Calculated by the Townsend Centre for International Poverty Research, University of Bristol. Available from http://www.bristol.ac.uk/poverty.
163
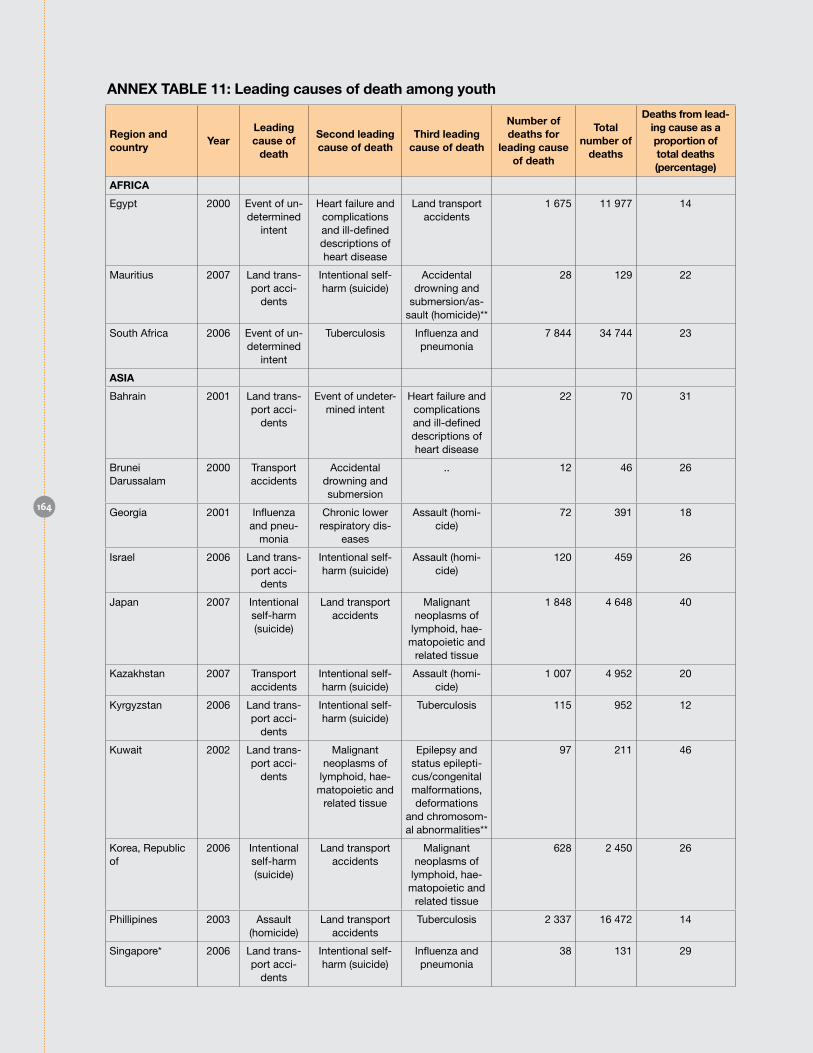
ANNEX TAbLE 11: Leading causes of death among youth
Region and country
YearLeading cause of
death
Second leading cause of death
Third leading cause of death
Number of deaths for
leading cause of death
Total number of
deaths
Deaths from lead-ing cause as a proportion of total deaths (percentage)
AFRICA
Egypt 2000 Event of un-determined
intent
Heart failure and complications and ill-defined descriptions of heart disease
Land transport accidents
1 675 11 977 14
Mauritius 2007 Land trans-port acci-
dents
Intentional self-harm (suicide)
Accidental drowning and
submersion/as-sault (homicide)**
28 129 22
South Africa 2006 Event of un-determined
intent
Tuberculosis Influenza and pneumonia
7 844 34 744 23
ASIA
Bahrain 2001 Land trans-port acci-
dents
Event of undeter-mined intent
Heart failure and complications and ill-defined descriptions of heart disease
22 70 31
Brunei Darussalam
2000 Transport accidents
Accidental drowning and submersion
.. 12 46 26
Georgia 2001 Influenza and pneu-
monia
Chronic lower respiratory dis-
eases
Assault (homi-cide)
72 391 18
Israel 2006 Land trans-port acci-
dents
Intentional self-harm (suicide)
Assault (homi-cide)
120 459 26
Japan 2007 Intentional self-harm (suicide)
Land transport accidents
Malignant neoplasms of
lymphoid, hae-matopoietic and
related tissue
1 848 4 648 40
Kazakhstan 2007 Transport accidents
Intentional self-harm (suicide)
Assault (homi-cide)
1 007 4 952 20
Kyrgyzstan 2006 Land trans-port acci-
dents
Intentional self-harm (suicide)
Tuberculosis 115 952 12
Kuwait 2002 Land trans-port acci-
dents
Malignant neoplasms of
lymphoid, hae-matopoietic and
related tissue
Epilepsy and status epilepti-cus/congenital malformations, deformations
and chromosom-al abnormalities**
97 211 46
Korea, Republic of
2006 Intentional self-harm (suicide)
Land transport accidents
Malignant neoplasms of
lymphoid, hae-matopoietic and
related tissue
628 2 450 26
Phillipines 2003 Assault (homicide)
Land transport accidents
Tuberculosis 2 337 16 472 14
Singapore* 2006 Land trans-port acci-
dents
Intentional self-harm (suicide)
Influenza and pneumonia
38 131 29
164
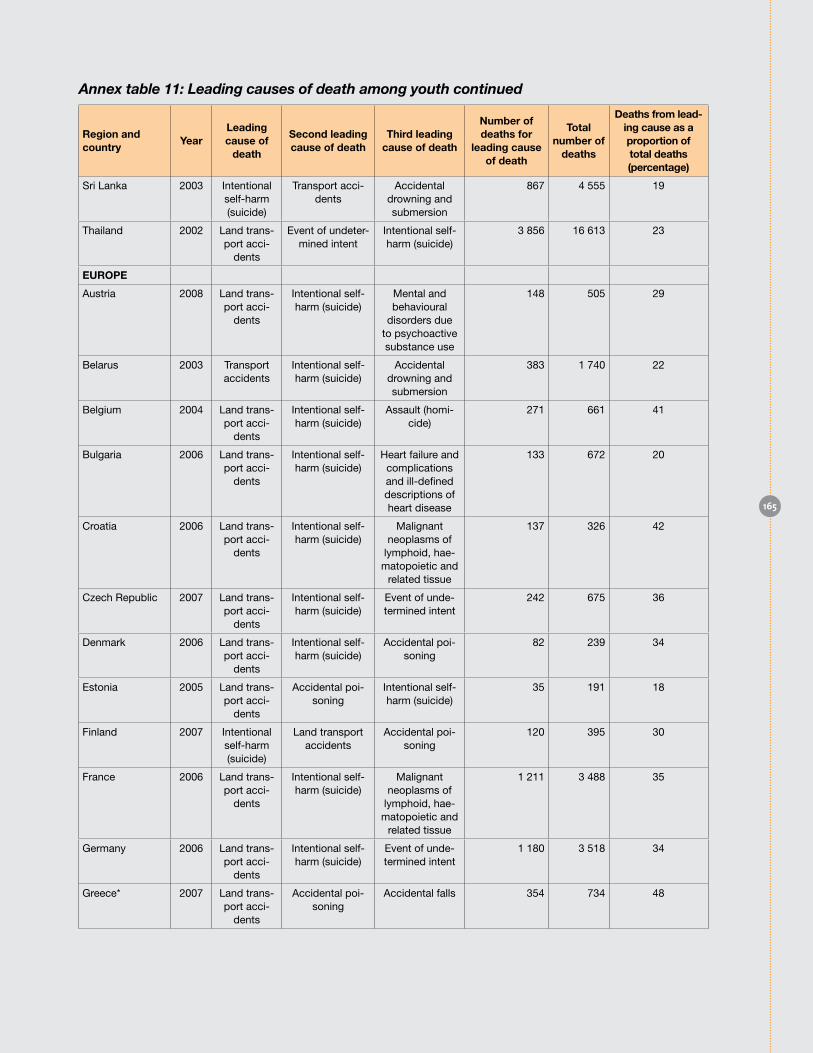
Annex table 11: Leading causes of death among youth continued
Region and country
YearLeading cause of
death
Second leading cause of death
Third leading cause of death
Number of deaths for
leading cause of death
Total number of
deaths
Deaths from lead-ing cause as a proportion of total deaths (percentage)
Sri Lanka 2003 Intentional self-harm (suicide)
Transport acci-dents
Accidental drowning and submersion
867 4 555 19
Thailand 2002 Land trans-port acci-
dents
Event of undeter-mined intent
Intentional self-harm (suicide)
3 856 16 613 23
EuRoPE
Austria 2008 Land trans-port acci-
dents
Intentional self-harm (suicide)
Mental and behavioural
disorders due to psychoactive substance use
148 505 29
Belarus 2003 Transport accidents
Intentional self-harm (suicide)
Accidental drowning and submersion
383 1 740 22
Belgium 2004 Land trans-port acci-
dents
Intentional self-harm (suicide)
Assault (homi-cide)
271 661 41
Bulgaria 2006 Land trans-port acci-
dents
Intentional self-harm (suicide)
Heart failure and complications and ill-defined descriptions of heart disease
133 672 20
Croatia 2006 Land trans-port acci-
dents
Intentional self-harm (suicide)
Malignant neoplasms of
lymphoid, hae-matopoietic and
related tissue
137 326 42
Czech Republic 2007 Land trans-port acci-
dents
Intentional self-harm (suicide)
Event of unde-termined intent
242 675 36
Denmark 2006 Land trans-port acci-
dents
Intentional self-harm (suicide)
Accidental poi-soning
82 239 34
Estonia 2005 Land trans-port acci-
dents
Accidental poi-soning
Intentional self-harm (suicide)
35 191 18
Finland 2007 Intentional self-harm (suicide)
Land transport accidents
Accidental poi-soning
120 395 30
France 2006 Land trans-port acci-
dents
Intentional self-harm (suicide)
Malignant neoplasms of
lymphoid, hae-matopoietic and
related tissue
1 211 3 488 35
Germany 2006 Land trans-port acci-
dents
Intentional self-harm (suicide)
Event of unde-termined intent
1 180 3 518 34
Greece* 2007 Land trans-port acci-
dents
Accidental poi-soning
Accidental falls 354 734 48
165

Annex table 11: Leading causes of death among youth continued
Region and country
YearLeading cause of
death
Second leading cause of death
Third leading cause of death
Number of deaths for
leading cause of death
Total number of
deaths
Deaths from lead-ing cause as a proportion of total deaths (percentage)
Hungary 2005 Land trans-port acci-
dents
Intentional self-harm (suicide)
Congenital mal-formations, de-formations and chromosomal abnormalities
203 625 32
Iceland 2006 Land trans-port acci-
dents
Intentional self-harm (suicide)
Congenital mal-formations, de-formations and chromosomal abnormalities
11 26 42
Ireland 2007 Intentional self-harm (suicide)
Land transport accidents
Accidental poi-soning
85 353 24
Italy 2006 Land trans-port acci-
dents
Intentional self-harm (suicide)
Malignant neoplasms of
lymphoid, hae-matopoietic and
related tissue
1 082 2 492 43
Latvia 2007 Land trans-port acci-
dents
Intentional self-harm (suicide)
Accidental drowning and submersion
77 276 28
Lithuania 2007 Land trans-port acci-
dents
Intentional self-harm (suicide)
Accidental drowning and submersion
176 556 32
Luxembourg 2006 Land trans-port acci-
dents
Accidental poi-soning
Intentional self-harm (suicide)
9 27 33
Malta 2007 Land trans-port acci-
dents
Accidental poi-soning
.. 4 25 16
Netherlands 2007 Land trans-port acci-
dents
Intentional self-harm (suicide)
Malignant neoplasms of
lymphoid, hae-matopoietic and
related tissue
170 612 28
Norway 2006 Intentional self-harm (suicide)
Land transport accidents
Accidental poi-soning
86 276 31
Poland 2007 Land trans-port acci-
dents
Intentional self-harm (suicide)
Event of unde-termined intent
1 175 3 581 33
Portugal 2003 Land trans-port acci-
dents
Intentional self-harm (suicide)
Malignant neoplasms of
lymphoid, hae-matopoietic and
related tissue
349 870 40
Republic of Moldova
2007 Land trans-port acci-
dents
Intentional self-harm (suicide)
Accidental drowning and submersion
155 570 27
Romania 2008 Land trans-port acci-
dents
Intentional self-harm (suicide)
Accidental drowning and submersion
546 2 050 27
166
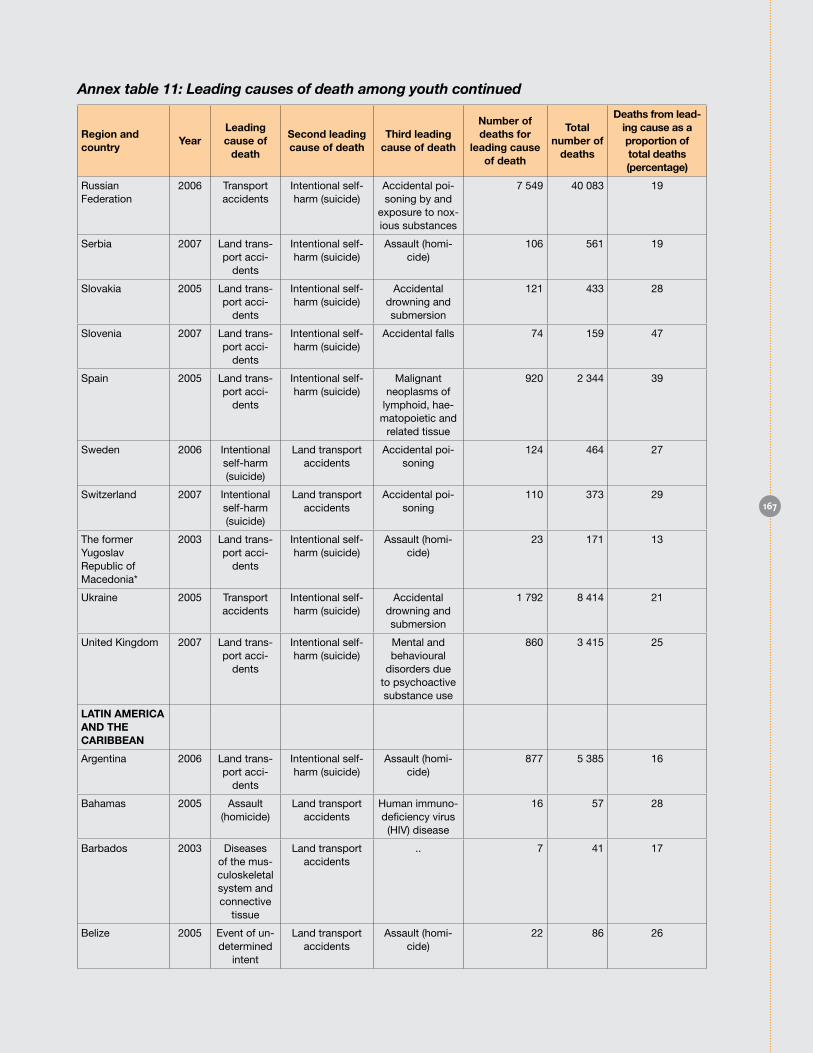
Annex table 11: Leading causes of death among youth continued
Region and country
YearLeading cause of
death
Second leading cause of death
Third leading cause of death
Number of deaths for
leading cause of death
Total number of
deaths
Deaths from lead-ing cause as a proportion of total deaths (percentage)
Russian Federation
2006 Transport accidents
Intentional self-harm (suicide)
Accidental poi-soning by and
exposure to nox-ious substances
7 549 40 083 19
Serbia 2007 Land trans-port acci-
dents
Intentional self-harm (suicide)
Assault (homi-cide)
106 561 19
Slovakia 2005 Land trans-port acci-
dents
Intentional self-harm (suicide)
Accidental drowning and submersion
121 433 28
Slovenia 2007 Land trans-port acci-
dents
Intentional self-harm (suicide)
Accidental falls 74 159 47
Spain 2005 Land trans-port acci-
dents
Intentional self-harm (suicide)
Malignant neoplasms of
lymphoid, hae-matopoietic and
related tissue
920 2 344 39
Sweden 2006 Intentional self-harm (suicide)
Land transport accidents
Accidental poi-soning
124 464 27
Switzerland 2007 Intentional self-harm (suicide)
Land transport accidents
Accidental poi-soning
110 373 29
The former Yugoslav Republic of Macedonia*
2003 Land trans-port acci-
dents
Intentional self-harm (suicide)
Assault (homi-cide)
23 171 13
Ukraine 2005 Transport accidents
Intentional self-harm (suicide)
Accidental drowning and submersion
1 792 8 414 21
United Kingdom 2007 Land trans-port acci-
dents
Intentional self-harm (suicide)
Mental and behavioural
disorders due to psychoactive substance use
860 3 415 25
LATIN AMERICA AND THE CARIbbEAN
Argentina 2006 Land trans-port acci-
dents
Intentional self-harm (suicide)
Assault (homi-cide)
877 5 385 16
Bahamas 2005 Assault (homicide)
Land transport accidents
Human immuno-deficiency virus (HIV) disease
16 57 28
Barbados 2003 Diseases of the mus-culoskeletal system and connective
tissue
Land transport accidents
.. 7 41 17
Belize 2005 Event of un-determined
intent
Land transport accidents
Assault (homi-cide)
22 86 26
167
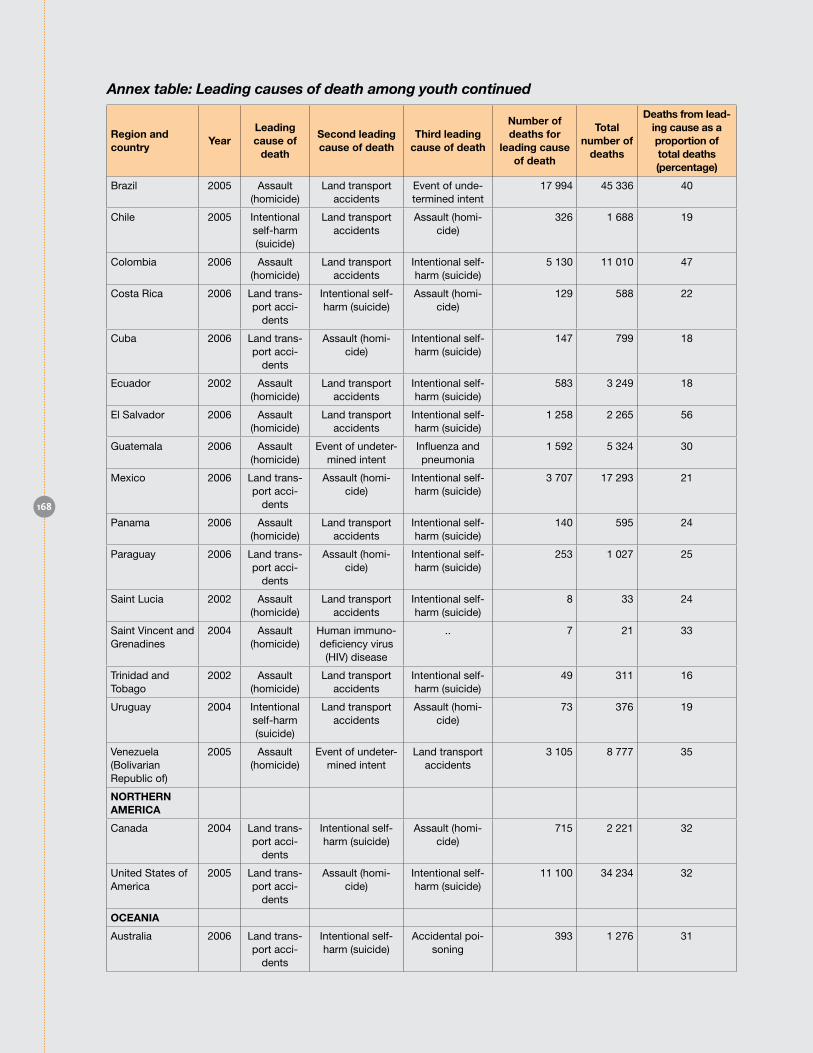
Annex table: Leading causes of death among youth continued
Region and country
YearLeading cause of
death
Second leading cause of death
Third leading cause of death
Number of deaths for
leading cause of death
Total number of
deaths
Deaths from lead-ing cause as a proportion of total deaths (percentage)
Brazil 2005 Assault (homicide)
Land transport accidents
Event of unde-termined intent
17 994 45 336 40
Chile 2005 Intentional self-harm (suicide)
Land transport accidents
Assault (homi-cide)
326 1 688 19
Colombia 2006 Assault (homicide)
Land transport accidents
Intentional self-harm (suicide)
5 130 11 010 47
Costa Rica 2006 Land trans-port acci-
dents
Intentional self-harm (suicide)
Assault (homi-cide)
129 588 22
Cuba 2006 Land trans-port acci-
dents
Assault (homi-cide)
Intentional self-harm (suicide)
147 799 18
Ecuador 2002 Assault (homicide)
Land transport accidents
Intentional self-harm (suicide)
583 3 249 18
El Salvador 2006 Assault (homicide)
Land transport accidents
Intentional self-harm (suicide)
1 258 2 265 56
Guatemala 2006 Assault (homicide)
Event of undeter-mined intent
Influenza and pneumonia
1 592 5 324 30
Mexico 2006 Land trans-port acci-
dents
Assault (homi-cide)
Intentional self-harm (suicide)
3 707 17 293 21
Panama 2006 Assault (homicide)
Land transport accidents
Intentional self-harm (suicide)
140 595 24
Paraguay 2006 Land trans-port acci-
dents
Assault (homi-cide)
Intentional self-harm (suicide)
253 1 027 25
Saint Lucia 2002 Assault (homicide)
Land transport accidents
Intentional self-harm (suicide)
8 33 24
Saint Vincent and Grenadines
2004 Assault (homicide)
Human immuno-deficiency virus (HIV) disease
.. 7 21 33
Trinidad and Tobago
2002 Assault (homicide)
Land transport accidents
Intentional self-harm (suicide)
49 311 16
Uruguay 2004 Intentional self-harm (suicide)
Land transport accidents
Assault (homi-cide)
73 376 19
Venezuela (Bolivarian Republic of)
2005 Assault (homicide)
Event of undeter-mined intent
Land transport accidents
3 105 8 777 35
NoRTHERN AMERICA
Canada 2004 Land trans-port acci-
dents
Intentional self-harm (suicide)
Assault (homi-cide)
715 2 221 32
United States of America
2005 Land trans-port acci-
dents
Assault (homi-cide)
Intentional self-harm (suicide)
11 100 34 234 32
oCEANIA
Australia 2006 Land trans-port acci-
dents
Intentional self-harm (suicide)
Accidental poi-soning
393 1 276 31
168
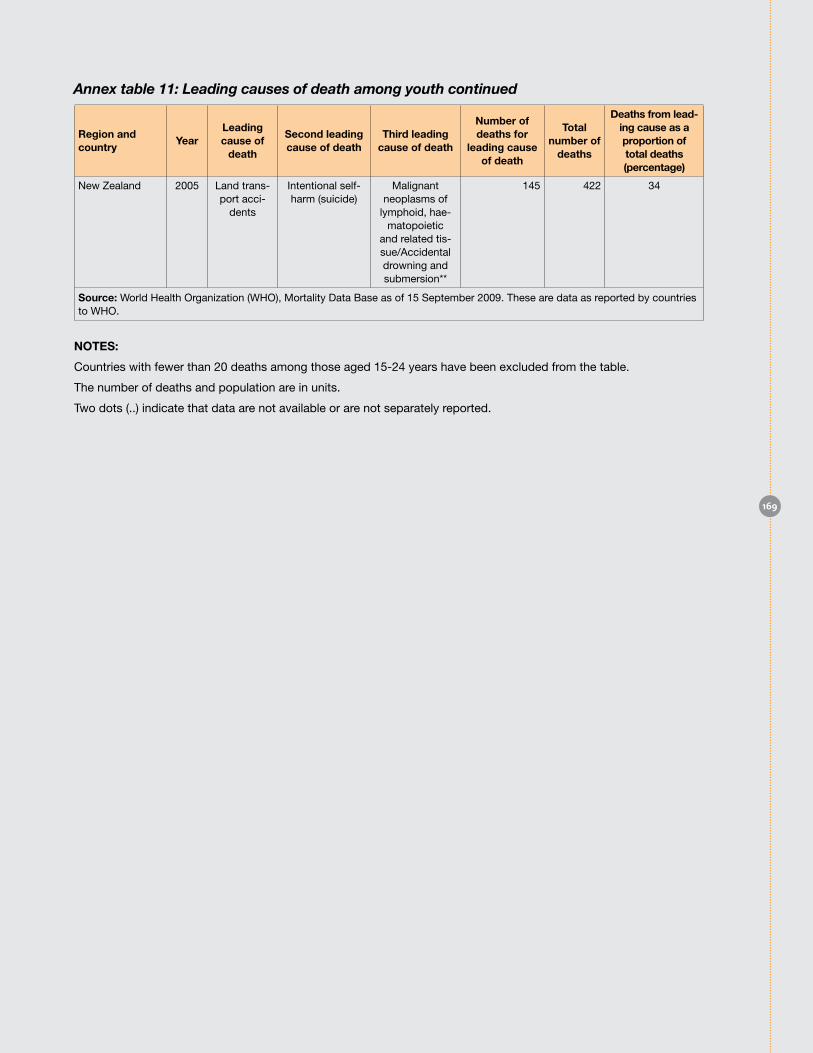
Annex table 11: Leading causes of death among youth continued
Region and country
YearLeading cause of
death
Second leading cause of death
Third leading cause of death
Number of deaths for
leading cause of death
Total number of
deaths
Deaths from lead-ing cause as a proportion of total deaths (percentage)
New Zealand 2005 Land trans-port acci-
dents
Intentional self-harm (suicide)
Malignant neoplasms of
lymphoid, hae-matopoietic
and related tis-sue/Accidental drowning and submersion**
145 422 34
Source: World Health Organization (WHO), Mortality Data Base as of 15 September 2009. These are data as reported by countries to WHO.
NoTES:
Countries with fewer than 20 deaths among those aged 15-24 years have been excluded from the table.
The number of deaths and population are in units.
Two dots (..) indicate that data are not available or are not separately reported.
169
PR
oF
Ile
oF
Yo
Ut
H
BRIeF demogRAPHIc And deVeloPment PRoFIle oF YoUtHFor statistical purposes, the United Nations defines youth as individuals between the ages of 15 and 24. Young people currently number 1.2 billion, accounting for approximately 18 per cent of the global population (United Na-tions, 2009b). Youth do not constitute a ho-mogeneous group; their socio-economic, de-mographic, and geographical situations vary widely both within and between regions. Not-withstanding these differences, regional-level analysis provides a general understanding of their development profile. The vast majority of the world’s youth—some 87 per cent—live in developing countries and face challenges deriving from limited access to resources, education, training, employment, and broader economic development opportunities.
171
At present, 62 per cent of the world’s youth live in Asia and 17 per cent (the next largest propor-tion) live in Africa; the population of young men and women in the two regions totals about 960 million. By the middle of the twenty-first cen-tury, the proportion of youth living in Asia is ex-pected to decline to 53 per cent, while in Africa the proportion will likely rise significantly, to 29 per cent (United Nations, 2009b).
Although there are no disaggregated data on youth living below the poverty line, it is evident that a substantial number of young people re-side in areas in which poverty constitutes a major challenge. Approximately 64 per cent of youth in Africa and 84 per cent in Asia live in countries where at least one third of the pop-ulation subsists on less than US$ 2 per day (United Nations, 2009b; World Bank, 2007). Youth are also concentrated in areas with lim-ited access to basic social services.
Employment is an integral part of the transi-tion to adulthood and plays a central role in the social integration of young people. It provides youth with economic security and facilitates their participation in society at multiple levels. Youth access to employment essentially trans-lates into income and resource access, both of which are pivotal to shaping adaptive capacity (United Nations, 2007b). However, young peo-ple continue to be overrepresented among the world’s unemployed; in 2007, youth comprised only 25 per cent of the working-age popula-tion but accounted for more than 40 per cent of those who were jobless (International Labour Office, 2008). The global youth unemployment rate for 2007 stood at 12 per cent, or three times the adult rate. In South-East Asia and the Pacific, youth unemployment rates as high as six times those of adults have been recorded (International Labour Office, 2008).
For the vast majority of youth living in develop-ing countries, unemployment rates tell only part of the story. For young people in these areas, informal, non-secure, and low-wage employ-ment is the norm, with labour activity among youth concentrated in agriculture and related industries and in the informal sector. More than 79 per cent of the world’s youth live in Africa, Asia, and Oceania, where employment in agri-culture comprises at least 35 per cent of total employment (World Bank, 2008a; United Na-tions, 2009b). In sub-Saharan Africa, for ex-ample, agriculture accounts for 65 per cent of
employment (World Bank, 2008a). In several Asian countries youth employment has shifted towards manufacturing or services, but agricul-ture remains a significant employer of young workers, especially the younger segment of the youth cohort (Asian Development Bank, 2008).
Education is another essential element in the transition to adulthood. However, a substantial number of young people in developing coun-tries continue to face challenges relating to educational access and quality. Although the global youth literacy rate increased from 84 per cent during the period 1985-1994 to 89 per cent during the period 2000-2006, progress has been uneven, with youth literacy rates be-low 80 per cent recorded in sub-Saharan Africa and in Southern and Western Asia (United Na-tions Educational, Scientific and Cultural Orga-nization, 2008). Secondary enrolment levels are as low as 25 per cent in some Pacific countries and 16 per cent in parts of Asia, but the lowest rates are found among youth in Africa (United Nations Educational, Scientific and Cultural Organization, 2008). Large disparities in edu-cational quality and access also exist within countries owing to factors such as income, lo-cation, gender, and ethnicity.


Considerable attention has been given in recent years to the challenge of climate change and its potential impact
on development. While much of the discussion has focused on the ecological impact of increasing greenhouse
gases on the earth’s atmosphere, there is also growing attention to the human development impact and the
social dimensions of this trend. The human development dimension of climatechange is the subject of the
Human Development Report 2007/2008, which argues forcefully that although the size of the challenge posed by
climate change may be daunting, the world’s poor and future generations cannot afford to be pessimistic. “Cli-
mate change”, the report notes, “is the defining human development issue of our generation. It notes that “how
the world deals with climate change today will have a direct bearing on the human development prospects of a
large section of humanity.” “Our generation”, the report notes, “may not live to see the consequences; but our
children and grand children will have no alternative but to live with them”. Although a strong case has been made
for placing environmental and ecological considerations at the heart of
development as a way to protect the younger generations, much
less attention has been given to how young people
themselves can influence the achievement of
goals outlines in the Kyoto protocol. For
instance, the Human Development
Report 2007/2008 addresses the
larger macroeconomic considerations
for fostering human development in
the context of climate change with a
focus on actions that should be taken by
governments and the interna- tional community. A vital
but missing link in the Human Development Report is how the
younger generation -those the report views as being most vulnerable to the conse-
quences of inaction today - - can, and should be engaged in addressing climate change. ns, much less attention has
been given to how young people themselves cans, much less attention has been given to how young people them-
selves caConsiderable attention has been given in recent years to the challenge of climate change and its potential
impact on development. While much of the discussion has focused on the ecological impact of increasing green-
house gases on the earth’s atmosphere, there is also growing attention to the human development impact and the
social dimensions of this trend. The human development dimension of climatechange is the subject of the Human
Development Report 2007/2008, which argues forcefully that although the size of the challenge posed by climate
change may be daunting, the world’s poor and future generations cannot afford to be pessimistic. “Climate change”,
the report notes, “is the defining human development issue of our generation. It notes that “how the world deals
YOUTH &
Youth
United Nations Publication Printed in the United States of America 10-62128—December 2010—1,000
USD 65 ISBN 978-92-1-130303-2
BACK COVER
![Tools for climate action - UNICEF · 2020. 12. 2. · America], Rafael Cortés (Red de Juventudes y Cambio Climático) [Youth and Climate Change Network], Raquel Sagot (Youth and](https://img.pdfslide.net/doc/110x75/60fdfe0d47c96b1d30564ee0/tools-for-climate-action-unicef-2020-12-2-america-rafael-corts-red-de.jpg)