Embed Size (px)
Citation preview
Engineering Structures 27 (2005) 951–962
www.elsevier.com/locate/engstruct
edg
hepperconstant
nd high),served
anf
Seismic behaviors of columns in ordinary and intermediate momentresisting concrete frames
Sang Whan Han∗, N.Y. Jee
Department of Architectural Engineering, Hanyang University, Seoul 133-791, Republic of Korea
Received 30 March 2004; received in revised form 31 January 2005; accepted 31 January 2005Available online 10 March 2005
Abstract
Theobjective of this study was to investigate the seismic behaviors of columns in Ordinary Moment Resisting Concrete Frames (OMRCF)and Intermediate Moment Resisting Concrete Frames (IMRCF). For this purpose, two three-story OMRCF and IMRCF were designaccording to the minimum design andreinforcement detailing requirements specified in ACI 318-02. This study assumed that the buildinwas located in seismic zone 1, as classified by UBC. According to ACI318-02 the reinforcement detailing requirements for OMRCF areless stringent than those for either IMRCF or SMRCF (Special Moment Resisting Concrete Frames). Tests were carried out to evaluate tseismic behaviors of OMRCF and IMRCF columns using 2/3 scale model columns. Each column was considered as consisting of an upart and lower part divided at the point of inflection. Quasi-static reversed cyclic loading was applied to the specimens with eitheror varying axial forces. The test variables of this experimental study were the type of axial force (constant and varying, and low athe existence of lap splices (with or without lap splice) and type of moment resisting concrete frame (OMRCF or IMRCF). It was obthat all OMRCF and IMRCF column specimens had strength larger than that required by ACI 318, and they had drift capacities greater th3.0% and 4.5%, respectively. However, the drift capacity of specimensvaried with respect to the existence oflap splices and the spacing olateral reinforcement at column ends.© 2005 Elsevier Ltd. All rights reserved.
Keywords: Seismic behavior; Columns; Reinforcement details; Seismic design
in
ish
vio
enaktegnw
P
toe
e
fhenden
1. Introduction
Moment frames have been widely used for seismresisting systems due to their superior deformation aenergy dissipation capacities. A moment frame consof beams and columns, which are rigidly connected. Tcomponents of a moment frame should resist both graand lateral load. Lateral forces are distributed according tthe flexural rigidity of each component. ACI 318-02 [1]states the design and reinforcement detailing requiremfor each type of moment frame and each earthqurisk level. The type of moment frame should be selecaccording to levels of seismic risk or seismic desicategory. Seismic risk levels can be classified into lo
∗ Corresponding author. Tel.: +82 2 2290 1715; fax: +82 2 2291 1716.E-mail address: [email protected] (S.W. Han).
0141-0296/$ - see front matter © 2005 Elsevier Ltd. All rights reserved.doi:10.1016/j.engstruct.2005.01.012
avenase
cdtsety
tsed
,
moderate and high according to seismic zones specified inUBC [2]. Seismic design category is specified in NHER[3] and IBC [8].
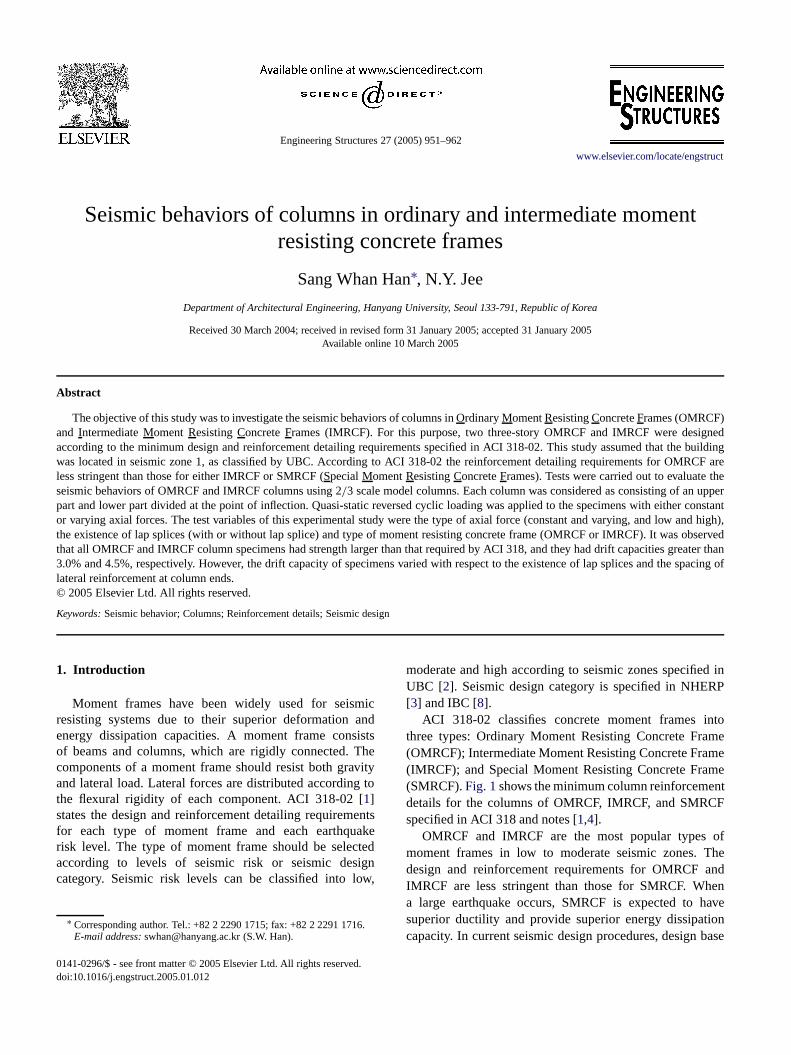
ACI 318-02 classifies concrete moment frames inthree types: Ordinary Moment Resisting Concrete Fram(OMRCF); Intermediate Moment Resisting Concrete Frame(IMRCF); and Special Moment Resisting Concrete Fram(SMRCF).Fig. 1shows the minimum column reinforcementdetails for the columns of OMRCF, IMRCF, and SMRCFspecified in ACI 318 and notes [1,4].
OMRCF and IMRCF are the most popular types omoment frames in low to moderate seismic zones. Tdesign and reinforcement requirements for OMRCF aIMRCF are less stringent than those for SMRCF. Wha large earthquake occurs, SMRCF is expected to hsuperior ductility and provide superior energy dissipatiocapacity. In current seismic design procedures, design b
952 S.W. Han, N.Y. Jee / Engineering Structures 27 (2005) 951–962
Fig. 1. Minimum reinforcement details for columns.
n
aeo
i
nsygtea
ed
ndeeasalFseseded
celapt
althever,
the
e-
aed
Notation
Ag gross area of columnf ′c specified compressivestrength of concrete
fy specified yield strength of nonprestressedreinforcement
Mmax maximum moment resistance of the specimenMACI moment capacity calculated using ACI 318-99
proceduresVACI nominal shear strength according to ACI 318-
99∆max maximum displacementθmax maximum drift angle
shear force shall be calculated by elastic strength demadivided by R factor (≥1). R factor accounts forductility,overstrength, redundancy, and damping inherent instructural system. Current design provisions assigned thhighest R factor to SMRCF, and the lowest R factor tOMRCF because of its less stringent design requirement. Itshould be noted that design base shear becomes larger wdecreasing R factor.
This study focused on the behaviors of first story columin moment resistingframes. For this purpose, three-storOMRCF and IMRCF buildings were designed accordinto ACI 318-02. Experimental test of columns in the firsstory of those buildings was carried out to investigate thseismic behavior of the columns. This study considered th
d
th
t
a column consisted of an upper part and lower part dividat the point of inflection.
Eight 2/3 scale column specimens(2 × 2 × 2 = 8)
representing the lower and upper part (2) of the exterior ainterior columns (2) in the OMRCF and IMRCF (2) wermade. Lower column specimens had lap splices wherupper column specimens had continuous longitudinreinforcement. The most significant difference in OMRCand IMRCF columns is the spacing of the transverreinforcement at the end of the column. Quasi-static revercyclic loading was applied to the specimens with either fixor varying axial forces.
The test variables in this study were type of axial for(constant and varying, and low and high), existence ofsplices (with or without lap splice) and type of momenresisting concrete frames (OMRCF or IMRCF).
2. Previous studies
Han et al. [6,7] have evaluated the seismic performanceof a three-story OMRCF. In their studies maximum laterforce was measured during the test and compared withdesign base shear force specified in current codes. Moreothis study carried out seismic performance evaluation ofthree-story OMRCF using a capacity spectrum method.
Lee and Woo [9] investigated the seismic performancof low-rise reinforced concrete (RC) frames with nonseismic detailing. They considered a bare frame andmasonry infilled frame. An experiment was conduct
S.W. Han, N.Y. Jee / Engineering Structures 27 (2005) 951–962 953
eeainouas
den
inll
tw
eharere
d.by
ndelPe
ic
thCFthse
te
ofaer
eio
rengedofad
9
edete
aed.2edg
using 1/5 scaled specimens having two bays and thrstories. They found that RC moment frames had a certseismic resistance even though they were designed withconsidering seismic loads. Furthermore, masonry infill wbeneficial to the seismic performance of the frame.
Aycardi et al. [10] investigated the behavior of gravityload-designed reinforced concrete column members unsimulated seismic loading. They tested four columspecimens governed by flexure under reversed cyclic loadat increasing drift amplitudes. It was observed that acolumn specimens were capable of sustaining at leastcycles of loading at a 4% drift angle.
Lynn et al. [11] tested eight reinforced concrete columnspecimens having typical details of those built before thmid-1970s. This study observed that column specimens twere governed by shear experienced gravity load failusoon after loss of lateral force resistance. When flexuwas dominant in specimens, gravity load capacity wasmaintained to large displacement.
3. Experimental program
3.1. Design of building frames
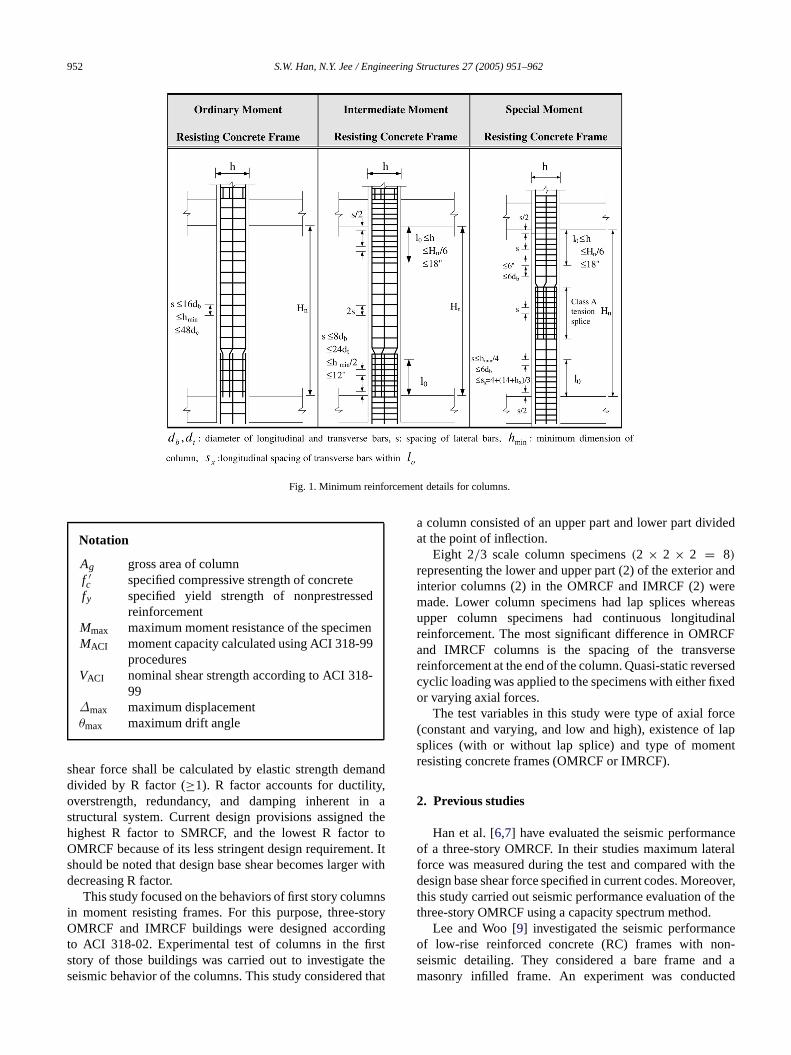
Typical three-story office buildings were designeSeismic resistance for these buildings was providedOMRCF and IMRCF. The dimension anddesign loads wereadopted from Han [6]. Fig. 2 shows thedimensions of thebuilding.
Specified compressive strength( f ′c) of concrete was
assumed to be 23.5 MPa. Longitudinal reinforcement areinforcement for hoop and stirrup were assumed to havyield strength( fy) of 392.3 MPa. Design loads for a typicaoffice building were used (5.2 kPa for dead load and 2.4 kfor live load). The section of all columns and beams in thmodel frames were assumed to be 330 mm× 330 mm and250 mm× 500 mm, respectively.
The buildings were assumed to be located in seismzone 1 as classified in UBC [2]. Member forces wereobtained using SAP 2000 (2000). Gravity loads governedmember design. Since the seismic load was small, OMRand IMRCF had the same member sizes as well assame amount of reinforcement except for the transverreinforcement in columns and beams (seeFig. 3). Thisdesign was desirable for this study since this study attempto investigate the effect of different reinforcement detailsof OMRCF and IMRCF columns on seismic behaviorsthose columns without interference of other factors suchamount of longitudinal reinforcement and different membsizes.
3.2. Column specimens
As shown inFig. 2, only the columns in the first storywere evaluated since these columns should resist the largaxial and lateral forces during an earthquake. The exter
t
r
g
o
t
a
a
e
e
d
s
str
(a) Plan view.
(b) Elevation.
Fig. 2. Building layouts.
columns in the first story of the two model frames wedesigned for an axial force of 644.3 kN and a bendimoment of 37 kN m, and the interior columns were designfor an axial load of 1234.7 kN and a bending moment47.1 kN m. It is noted that those design forces contain lofactors.
All columns had a section of 330 mm× 330 mmand contained four longitudinal reinforcements (D1(19.1 mm diameter), fy = 392.3 MPa). Columnlongitudinal reinforcement ratio(ρ) was 1.01%, whichslightly exceeded a minimum longitudinal reinforcing steelof 1.0% (Section 10.9.1 in ACI 318-02).
Maximum shear force in the first story columns inducby factored gravity loads was 31.4 kN. According to thformula in Section 11.3.1.2 of the ACI 318-02, the concreshear strength of the firststory columns(Vc) wascalculatedas 73.5 kN. Minimum tie reinforcement (D10 withdiameter of 9.53 mm) with spacing of 300 mm was placthroughout the column in the OMRCF (Section 7.10.5in ACI 318-02) and the first tie reinforcement was plac150 mm from the slab or footing surface accordin
954 S.W. Han, N.Y. Jee / Engineering Structures 27 (2005) 951–962
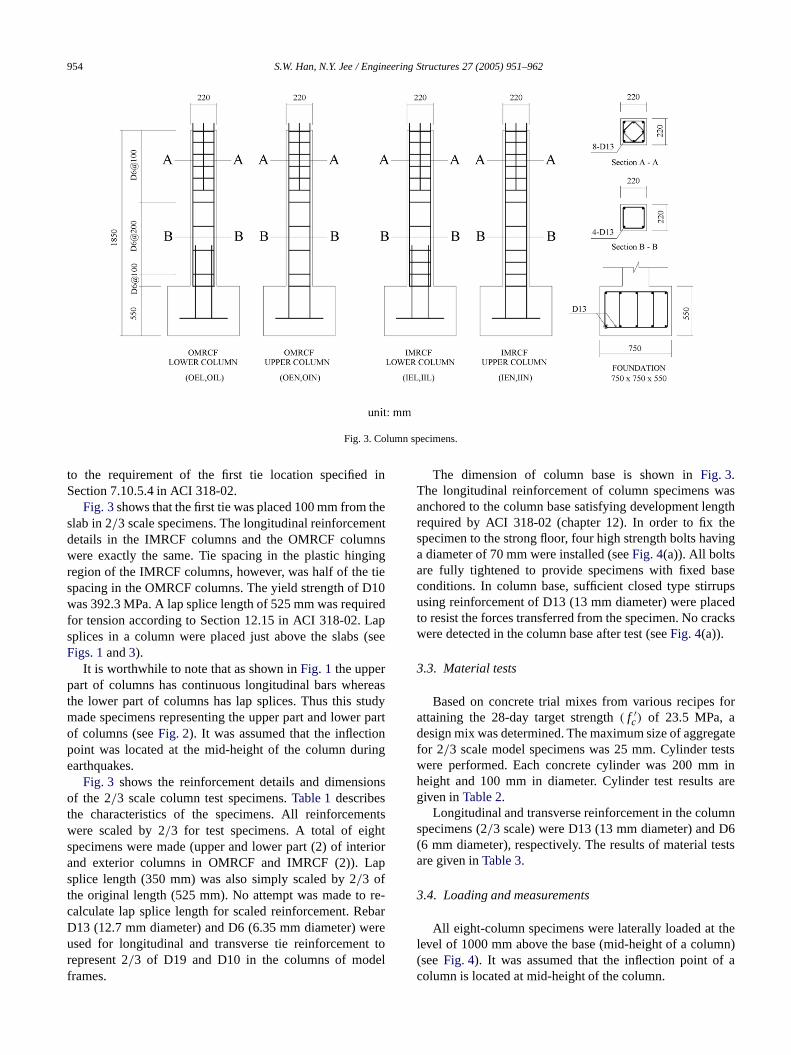
Fig. 3. Column specimens.
in
ensingie10edp
se
adpa
ng
iop
e-rreto
as
e
sepsedcks
atests
re
n6sts
hen)a
to the requirement of the first tie location specifiedSection 7.10.5.4 in ACI 318-02.
Fig. 3shows that the first tie was placed 100 mm from thslab in 2/3 scale specimens. The longitudinal reinforcemedetails in the IMRCF columns and the OMRCF columnwere exactly the same. Tie spacing in the plastic hingregion of the IMRCF columns, however, was half of the tspacing in the OMRCF columns. The yield strength of Dwas392.3 MPa. A lap splice length of 525 mm was requirfor tension according to Section 12.15 in ACI 318-02. Lasplices in a column were placed just above the slabs (Figs. 1and3).
It is worthwhile to note that as shown inFig. 1 the upperpart of columns has continuous longitudinal bars wherethe lower part of columns has lap splices. Thus this stumade specimens representing the upper part and lowerof columns (seeFig. 2). It was assumed that the inflectionpoint was located at the mid-height of the column duriearthquakes.
Fig. 3 shows the reinforcement details and dimensionsof the 2/3 scale column test specimens.Table 1describesthe characteristics of the specimens. All reinforcementswere scaled by 2/3 for test specimens. A total of eightspecimens were made (upper and lower part (2) of interand exterior columns in OMRCF and IMRCF (2)). Lasplice length (350 mm) was also simply scaled by 2/3 ofthe original length (525 mm). No attempt was made to rcalculate lap splice length forscaled reinforcement. RebaD13 (12.7 mm diameter) and D6 (6.35 mm diameter) weused for longitudinal and transverse tie reinforcementrepresent 2/3 of D19 and D10 in the columns of modelframes.
t
e
syrt
r
The dimension of column base is shown inFig. 3.The longitudinal reinforcement of column specimens wanchored to the column base satisfying development lengthrequired by ACI 318-02 (chapter 12). In order to fix thspecimen to the strong floor, four high strength bolts havinga diameter of 70 mm were installed (seeFig. 4(a)). All boltsare fully tightened to provide specimens with fixed baconditions. In column base, sufficient closed type stirruusing reinforcement of D13 (13 mm diameter) were placto resist the forces transferred from the specimen. No crawere detected in the column base after test (seeFig. 4(a)).
3.3. Material tests
Based on concrete trial mixes from various recipes forattaining the 28-day target strength( f ′
c) of 23.5 MPa, adesign mix was determined. The maximum size of aggregfor 2/3 scale model specimens was 25 mm. Cylinder tewere performed. Each concrete cylinder was 200 mm inheight and 100 mm in diameter. Cylinder test results agiven inTable 2.
Longitudinal and transverse reinforcement in the columspecimens (2/3 scale) were D13 (13 mm diameter) and D(6 mm diameter), respectively. The results of material teare given inTable 3.
3.4. Loading and measurements
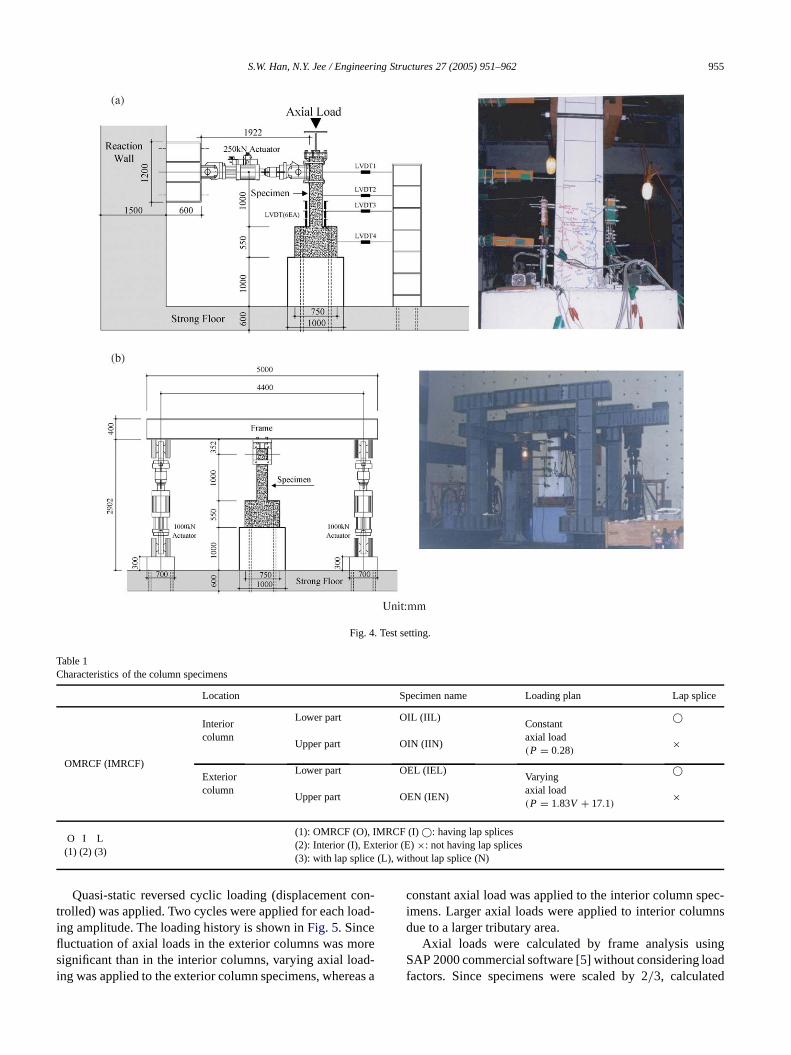
All eight-column specimens were laterally loaded at tlevel of 1000 mm above the base (mid-height of a colum(seeFig. 4). It was assumed that the inflection point ofcolumn is located at mid-height of the column.
S.W. Han, N.Y. Jee / Engineering Structures 27 (2005) 951–962 955
Fig. 4. Test setting.
Table 1Characteristics of the column specimens
Location Specimen name Loading plan Lap splice
OMRCF (IMRCF)
InteriorLower part OIL (IIL)
Constant©
column axial loadUpper part OIN (IIN)
(P = 0.28)×
ExteriorLower part OEL (IEL)
Varying©
column axial loadUpper part OEN (IEN)
(P = 1.83V + 17.1)×
O I L(1): OMRCF (O), IMRCF (I)©: having lap splices
(1) (2) (3)(2): Interior (I), Exterior (E)×: not having lap splices(3): with lap splice (L), without lap splice (N)
d-
-s
ec-
ng
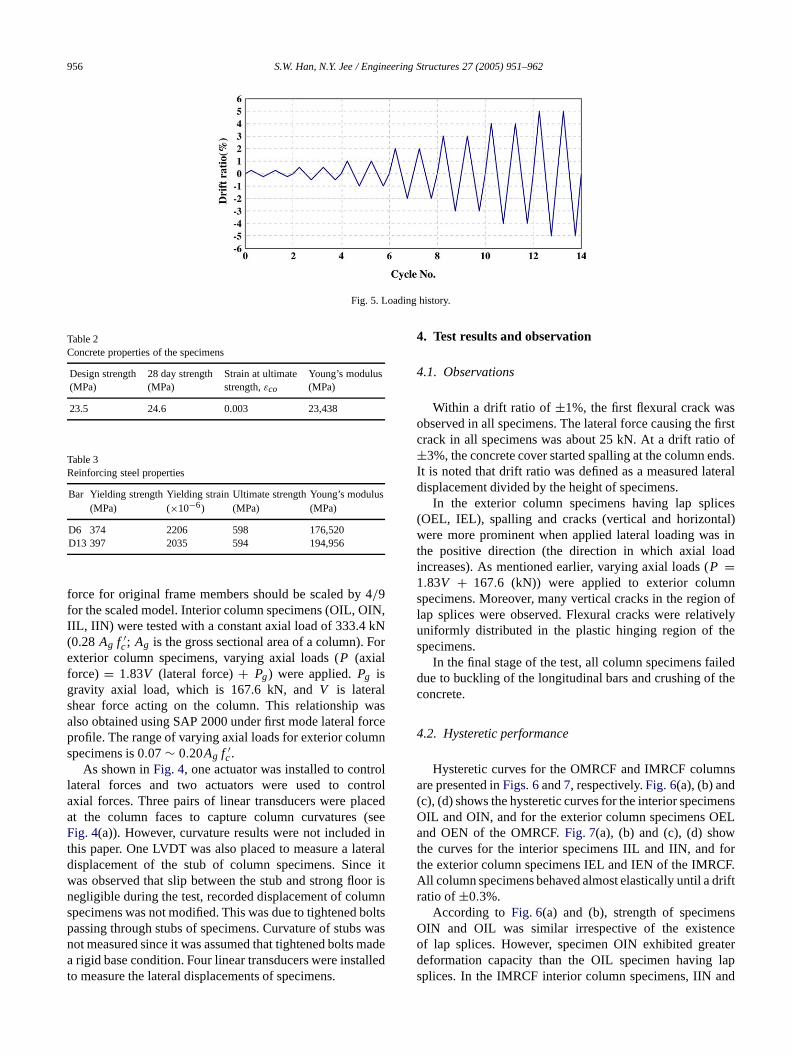
Quasi-static reversed cyclic loading (displacement con-trolled) was applied. Two cycles were applied for each loaing amplitude. The loading history is shown inFig. 5. Sincefluctuation of axial loads in the exterior columns was moresignificant than in the interior columns, varying axial loading was applied to the exterior column specimens, wherea
aconstant axial load was applied to the interior column spimens. Larger axial loads wereapplied to interior columnsdue to a larger tributary area.
Axial loads were calculated by frame analysis usiSAP2000 commercial software [5] without considering loadfactors. Since specimens were scaled by 2/3, calculated
956 S.W. Han, N.Y. Jee / Engineering Structures 27 (2005) 951–962
Fig. 5. Loading history.
us
s
N,Nor
asrcn
ltrod
inera
ir i
oltwaa
ed
rstofds.al
esl)
d
ofelye
edhe
ns
r.rift
seter
Table 2Concrete properties of the specimens
Design strength 28 day strength Strain at ultimate Young’s modul(MPa) (MPa) strength,εco (MPa)
23.5 24.6 0.003 23,438
Table 3Reinforcing steel properties
Bar Yielding strength Yielding strain Ultimate strength Young’s modulu(MPa) (×10−6) (MPa) (MPa)
D6 374 2206 598 176,520D13 397 2035 594 194,956
force for original frame members should be scaled by 4/9for the scaled model. Interior column specimens (OIL, OIIIL, IIN) were tested with a constant axial load of 333.4 k(0.28 Ag f ′
c ; Ag is the gross sectional area of a column). Fexterior column specimens, varying axial loads (P (axialforce) = 1.83V (lateral force)+ Pg) were applied. Pg isgravity axial load, which is 167.6 kN, andV is lateralshear force acting on the column. This relationship walso obtained using SAP 2000 under first mode lateral foprofile. The range of varying axial loads for exterior columspecimens is 0.07 ∼ 0.20Ag f ′
c .As shown inFig. 4, one actuator was installed to contro
lateral forces and two actuators were used to conaxial forces. Three pairs oflinear transducers were placeat the column faces to capturecolumn curvatures (seeFig. 4(a)). However, curvature results were not includedthis paper. One LVDT was also placed to measure a latdisplacement of the stub of column specimens. Sincewasobserved that slip between the stub and strong floonegligible during the test, recorded displacement of columnspecimens was not modified. This was due to tightened bpassing through stubs of specimens. Curvature of stubsnot measured since it was assumed that tightened bolts ma rigid base condition. Four linear transducers were installto measure the lateral displacements of specimens.
e
l
lts
ss
de
4. Test results and observation
4.1. Observations
Within a drift ratio of ±1%, the first flexural crack wasobserved in all specimens. The lateral force causing the ficrack in all specimens was about 25 kN. At a drift ratio±3%, theconcrete cover started spalling at the column enIt is noted that drift ratio was defined as a measured laterdisplacement divided by the height of specimens.
In the exterior column specimens having lap splic(OEL, IEL), spalling and cracks (vertical and horizontawere more prominent when applied lateral loading was inthe positive direction (the direction in which axial loaincreases). As mentioned earlier, varying axial loads (P =1.83V + 167.6 (kN)) were applied to exterior columnspecimens. Moreover, many vertical cracks in the regionlap splices were observed. Flexural cracks were relativuniformly distributed in the plastic hinging region of thspecimens.
In the final stage of the test, all column specimens faildue to buckling of the longitudinal bars and crushing of tconcrete.
4.2. Hysteretic performance
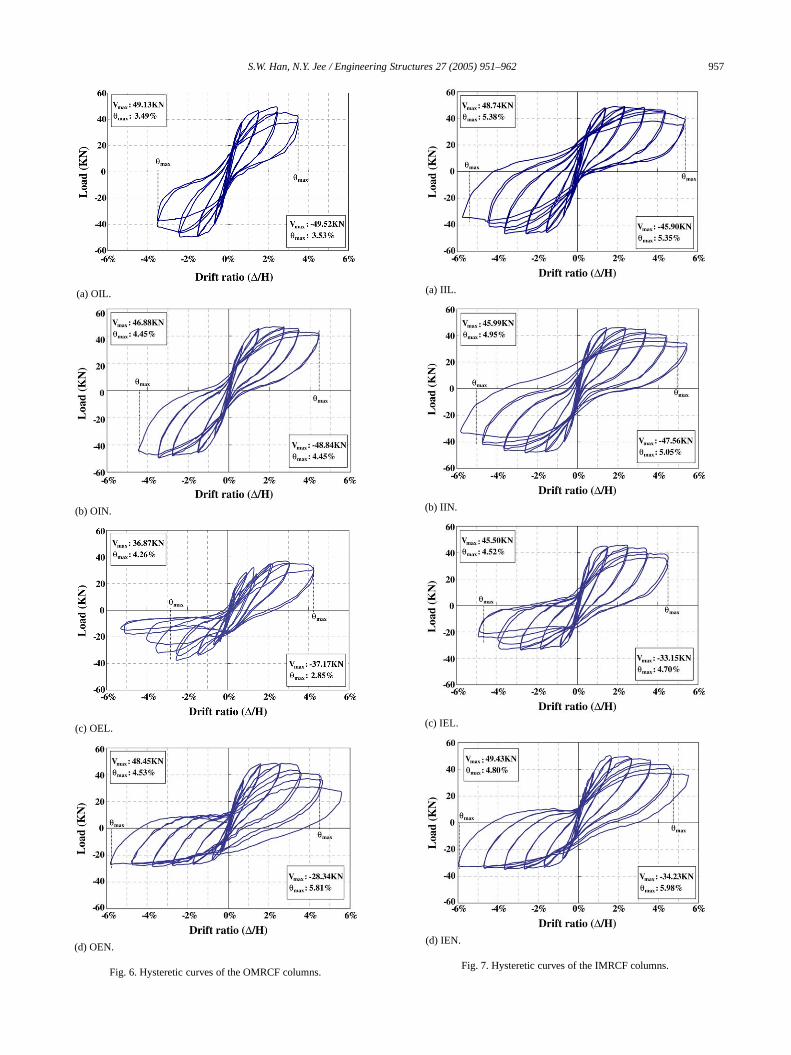
Hysteretic curves for theOMRCF and IMRCF columnsare presented inFigs. 6and7, respectively.Fig. 6(a), (b) and(c), (d) shows the hysteretic curves for the interior specimeOIL and OIN, and for the exterior column specimens OELand OEN of the OMRCF. Fig. 7(a), (b) and (c), (d) showthe curves for the interior specimens IIL and IIN, and fothe exterior column specimens IEL and IEN of the IMRCFAll column specimens behaved almost elastically until a dratio of ±0.3%.
According to Fig. 6(a) and (b), strength of specimenOIN and OIL was similar irrespective of the existencof lap splices. However, specimen OIN exhibited greadeformation capacity than the OIL specimen having lapsplices. In the IMRCF interiorcolumn specimens, IIN and
S.W. Han, N.Y. Jee / Engineering Structures 27 (2005) 951–962 957
(a) OIL.
(b) OIN.
(c) OEL.
(d) OEN.
Fig. 6. Hysteretic curves of the OMRCF columns.
(a) IIL.
(b) IIN.
(c) IEL.
(d) IEN.
Fig. 7. Hysteretic curves of the IMRCF columns.
958 S.W. Han, N.Y. Jee / Engineering Structures 27 (2005) 951–962
e
n,
e
lee
ti
m
iF.
res
F
n
rF
.eene
ds
es
nel
sn
gth
n
l
han
instthe
as
t
ingw
stail
hisseens
s.gthgth.
ely.thethen.aF
sticofhane
IIL, ( Fig. 7(a) and (b)), no discernible difference could bfound in either strength or deformation capacity.
The strength of all the OMRCF and IMRCF interiorcolumn specimens (OIN, OIL, IIN, IIL) was similar,whereas OMRCF interior columns had inferior deformatiocapacities to the IMRCF interior columns. Moreoverpinching was detected more prominently in OMRCFspecimens. Strength drops in the second cycle werhowever, similar betweenthe OMRCF interior columnspecimens and their corresponding IMRCF specimens.
In interior column specimens, IMRCF has a more staband fuller hysteretic curve than OMRCF. In particular, thimprovement was more prominent when columns had lapsplices (compareFigs. 6(a) and7(a)). The better hystereticbehavior in interior columns of IMRCF was attributed tonarrower spacing of transverse reinforcement in the plashinging region of the column.
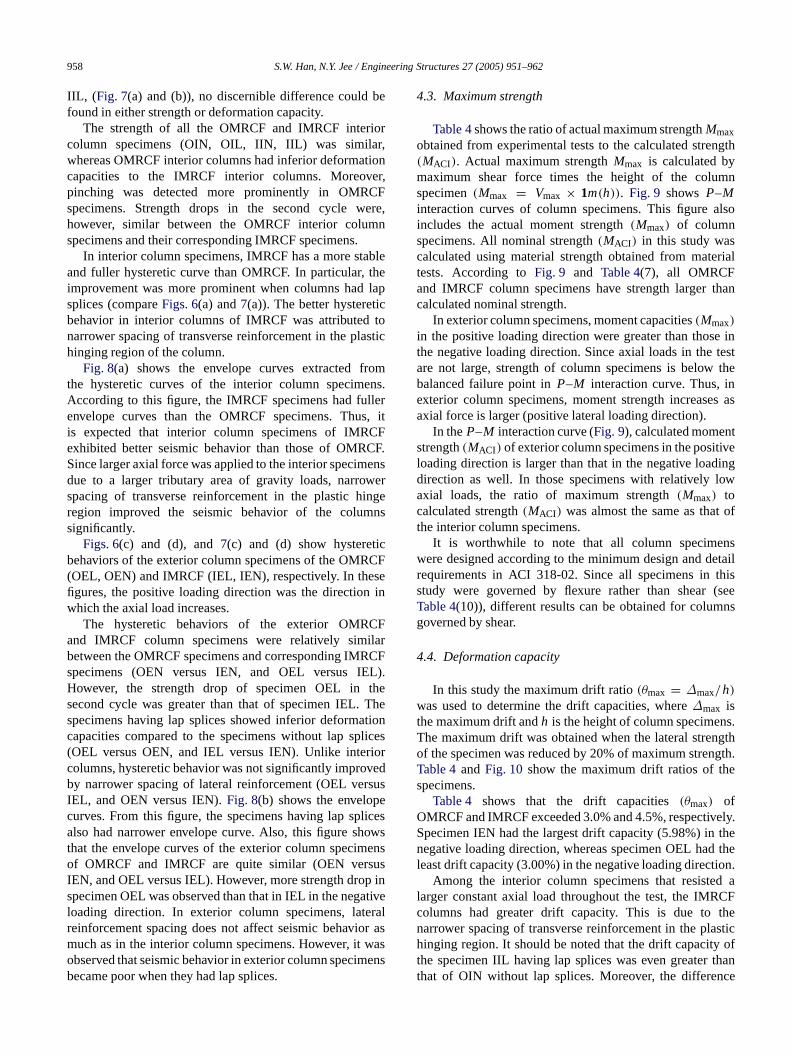
Fig. 8(a) shows the envelope curves extracted frothe hysteretic curves of the interior column specimens.According to this figure, the IMRCF specimens had fullerenvelope curves than the OMRCF specimens. Thus,is expected that interior column specimens of IMRCexhibited better seismic behavior than those of OMRCFSince larger axial force was applied to the interior specimensdue to a larger tributary area of gravity loads, narrowespacing of transverse reinforcement in the plastic hingregion improved the seismic behavior of the columnsignificantly.
Figs. 6(c) and (d), and7(c) and (d) show hystereticbehaviors of the exterior column specimens of the OMRC(OEL, OEN) and IMRCF (IEL, IEN), respectively. In thesefigures, the positive loading direction was the direction iwhich the axial load increases.
The hysteretic behaviors of the exterior OMRCFand IMRCF column specimens were relatively similabetween the OMRCF specimens and corresponding IMRCspecimens (OEN versus IEN, and OEL versus IEL)However, the strength drop of specimen OEL in thsecond cycle was greater than that of specimen IEL. Thspecimens having lap splices showed inferior deformatiocapacities compared to the specimens without lap splic(OEL versus OEN, and IEL versus IEN). Unlike interiorcolumns, hysteretic behavior was not significantly improveby narrower spacing of lateral reinforcement (OEL versuIEL, and OEN versus IEN).Fig. 8(b) shows the envelopecurves. From this figure, the specimens having lap splicalso had narrower envelope curve. Also, this figure showthat the envelope curves of the exterior column specimensof OMRCF and IMRCF are quite similar (OEN versusIEN, and OEL versus IEL). However, more strength drop ispecimen OEL was observed than that in IEL in the negativloading direction. In exterior column specimens, laterareinforcement spacing does notaffect seismic behavior asmuch as in the interior column specimens. However, it waobserved that seismic behavior in exterior column specimebecame poor when they had lap splices.
,
c
t
s
s
s
4.3. Maximum strength
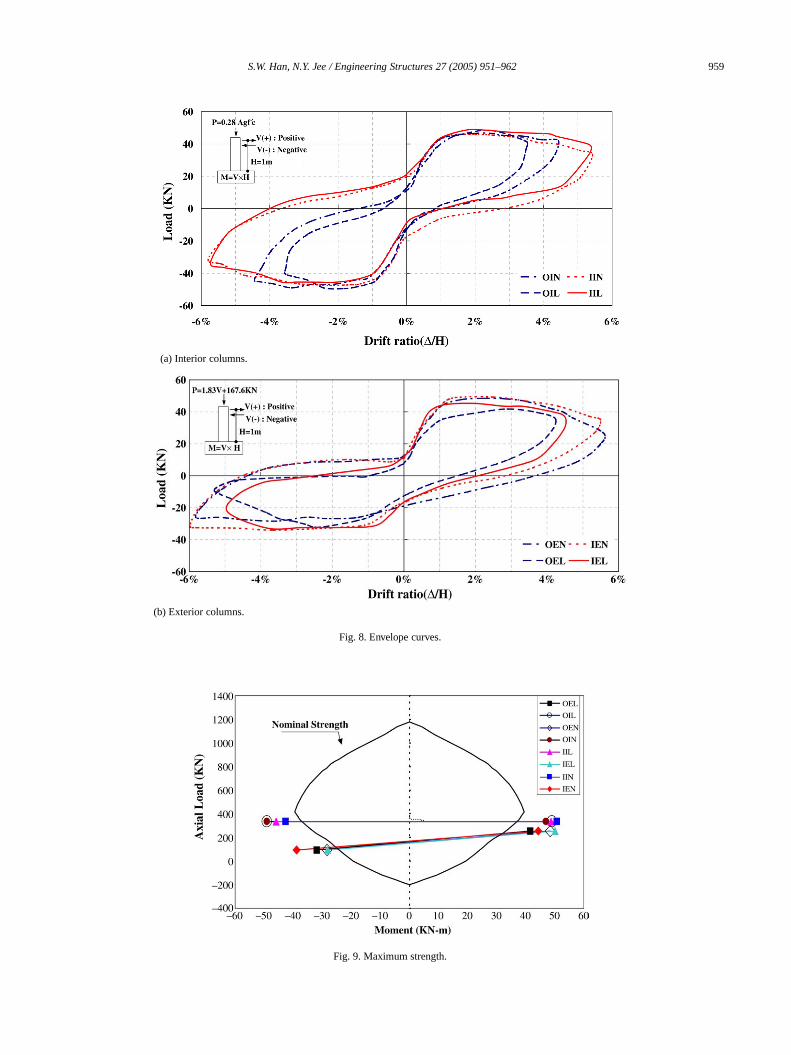
Table 4shows the ratioof actual maximum strengthMmaxobtained from experimental tests to the calculated stren(MACI ). Actual maximum strengthMmax is calculated bymaximum shear force times the height of the columspecimen(Mmax = Vmax × 1m(h)). Fig. 9 shows P–Minteraction curves of column specimens. This figure alsoincludes the actual moment strength(Mmax) of columnspecimens. All nominal strength(MACI) in this study wascalculated using material strength obtained from materiatests. According toFig. 9 and Table 4(7), all OMRCFand IMRCF column specimens have strength larger tcalculated nominal strength.
In exterior column specimens, moment capacities(Mmax)
in the positive loading direction were greater than thosethe negative loading direction. Since axial loads in the teare not large, strength of column specimens is belowbalanced failure point inP–M interaction curve. Thus, inexterior column specimens, moment strength increasesaxial force is larger (positive lateral loading direction).
In theP–M interaction curve (Fig. 9), calculated momenstrength(MACI ) of exterior column specimens in the positiveloading direction is larger than that in the negative loaddirection as well. In those specimens with relatively loaxial loads, the ratio of maximum strength(Mmax) tocalculated strength(MACI) was almost the sameas that ofthe interior column specimens.
It is worthwhile to note that all column specimenwere designed according to the minimum design and derequirements in ACI 318-02. Since all specimens in tstudy were governed by flexure rather than shear (Table 4(10)), different results can be obtained for columgoverned by shear.
4.4. Deformation capacity
In this study the maximum drift ratio(θmax = ∆max/h)
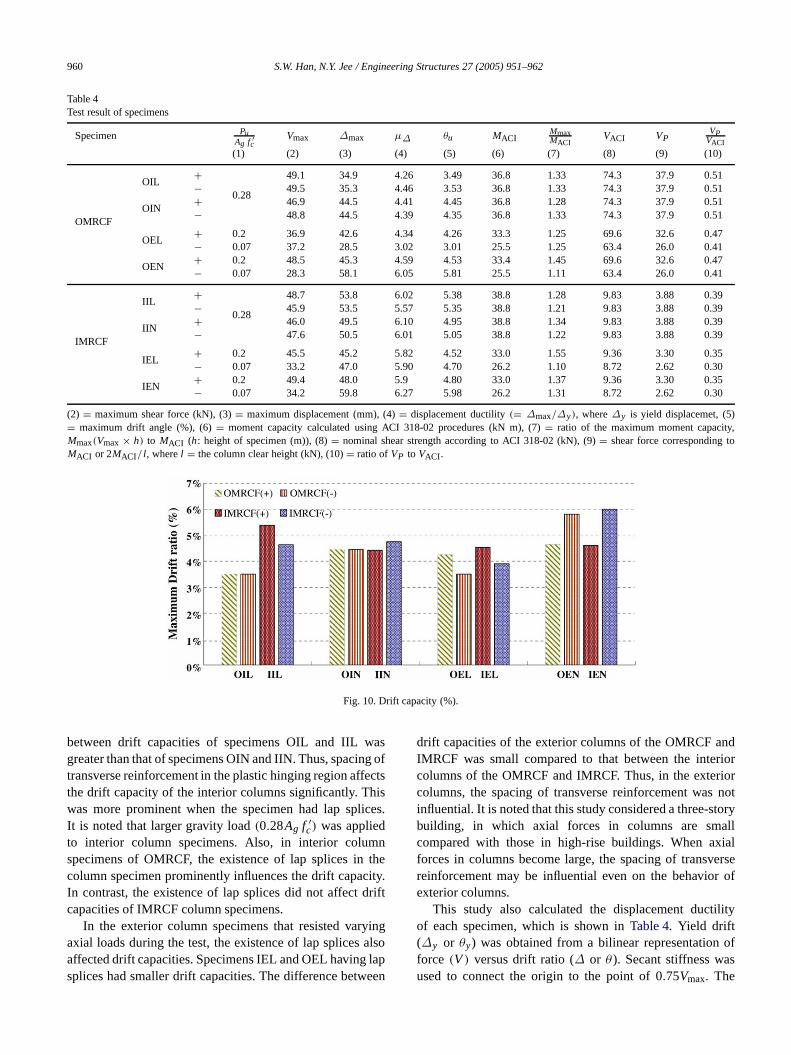
was used to determine the drift capacities, where∆max isthe maximum drift andh is the height of column specimenThe maximum drift was obtained when the lateral strenof the specimen was reduced by 20% of maximum strenTable 4and Fig. 10 show the maximum drift ratios of thespecimens.
Table 4 shows that the drift capacities(θmax) ofOMRCF and IMRCF exceeded 3.0% and 4.5%, respectivSpecimen IEN had the largest drift capacity (5.98%) innegative loading direction, whereas specimen OEL hadleast drift capacity (3.00%) in the negative loading directio
Among the interior column specimens that resistedlarger constant axial load throughout the test, the IMRCcolumns had greater driftcapacity. This is due to thenarrower spacing of transverse reinforcement in the plahinging region. It should be noted that the drift capacitythe specimen IIL having lap splices was even greater tthat of OIN without lap splices. Moreover, the differenc
S.W. Han, N.Y. Jee / Engineering Structures 27 (2005) 951–962 959
(a) Interior columns.
(b) Exterior columns.
Fig. 8. Envelope curves.
Fig. 9. Maximum strength.
960 S.W. Han, N.Y. Jee / Engineering Structures 27 (2005) 951–962
Table 4Test result of specimens
Specimen PuAg f ′
cVmax ∆max µ∆ θu MACI
MmaxMACI
VACI VPVP
VACI
(1) (2) (3) (4) (5) (6) (7) (8) (9) (10)
OMRCF
OIL+
0.28
49.1 34.9 4.26 3.49 36.8 1.33 74.3 37.9 0.51− 49.5 35.3 4.46 3.53 36.8 1.33 74.3 37.9 0.51
OIN+ 46.9 44.5 4.41 4.45 36.8 1.28 74.3 37.9 0.51− 48.8 44.5 4.39 4.35 36.8 1.33 74.3 37.9 0.51
OEL+ 0.2 36.9 42.6 4.34 4.26 33.3 1.25 69.6 32.6 0.47− 0.07 37.2 28.5 3.02 3.01 25.5 1.25 63.4 26.0 0.41
OEN+ 0.2 48.5 45.3 4.59 4.53 33.4 1.45 69.6 32.6 0.47− 0.07 28.3 58.1 6.05 5.81 25.5 1.11 63.4 26.0 0.41
IMRCF
IIL+
0.28
48.7 53.8 6.02 5.38 38.8 1.28 9.83 3.88 0.39− 45.9 53.5 5.57 5.35 38.8 1.21 9.83 3.88 0.39
IIN+ 46.0 49.5 6.10 4.95 38.8 1.34 9.83 3.88 0.39− 47.6 50.5 6.01 5.05 38.8 1.22 9.83 3.88 0.39
IEL+ 0.2 45.5 45.2 5.82 4.52 33.0 1.55 9.36 3.30 0.35− 0.07 33.2 47.0 5.90 4.70 26.2 1.10 8.72 2.62 0.30
IEN+ 0.2 49.4 48.0 5.9 4.80 33.0 1.37 9.36 3.30 0.35− 0.07 34.2 59.8 6.27 5.98 26.2 1.31 8.72 2.62 0.30
(2) = maximum shear force (kN), (3)= maximum displacement (mm), (4)= displacement ductility(= ∆max/∆y), where∆y is yield displacemet, (5)= maximum drift angle (%), (6)= moment capacity calculated using ACI 318-02 procedures (kN m), (7)= ratio of the maximum moment capacity,Mmax(Vmax × h) to MACI (h: height of specimen (m)), (8)= nominal shear strength according to ACI 318-02 (kN), (9)= shear force corresponding toMACI or 2MACI/ l, wherel = the column clear height (kN), (10)= ratio of VP to VACI.
Fig. 10. Drift capacity (%).
so
s.
nhe
ift
nglsape
y
l
f
f
between drift capacities of specimens OIL and IIL wagreater than that of specimens OIN and IIN. Thus, spacingtransverse reinforcement in theplastic hinging region affectsthe drift capacity of the interior columns significantly. Thiswas more prominent when the specimen had lap spliceIt is notedthat larger gravity load(0.28Ag f ′
c) was appliedto interior column specimens. Also, in interior columspecimens of OMRCF, the existence of lap splices in tcolumn specimen prominentlyinfluences the drift capacity.In contrast, the existence of lap splices did not affect drcapacities of IMRCF column specimens.
In the exterior column specimens that resisted varyiaxial loads during the test, the existence of lap splices aaffected drift capacities. Specimens IEL and OEL having lsplices had smaller drift capacities. The difference betwe
f
o
n
drift capacities of the exterior columns of the OMRCF andIMRCF was small compared tothat between the interiorcolumns of the OMRCF and IMRCF. Thus, in the exteriorcolumns, the spacing of transverse reinforcement was notinfluential. It is noted that this study considered a three-storbuilding, in which axial forces in columns are smallcompared with those in high-rise buildings. When axiaforces in columns become large, the spacing of transversereinforcement may be influential even on the behavior oexteriorcolumns.
This study also calculated the displacement ductilityof each specimen, which is shown inTable 4. Yield drift(∆y or θy) was obtained from a bilinear representation oforce (V ) versusdrift ratio (∆ or θ ). Secant stiffness wasused to connect the origin to the point of 0.75Vmax. The
S.W. Han, N.Y. Jee / Engineering Structures 27 (2005) 951–962 961
Fig. 11. Energy dissipation.
o
s
ntye
h
a
snn3e
ers
he
ns
er
sthe
thedverse
orniftctsetic
led
heticap
eanf
e
ndn
tic
ot
maximum drift(∆max, θmax) was approximated as the driftratio corresponding to the strength deteriorated by 20%Vmax (0.8 timesVmax). As shown inTable 4, all specimenshaveaductility capacity exceeding 3.0. The IMRCF exteriorcolumn specimen without lap splices (IEN) has the largeductility capacity (6.27) in the negative loading directionwhich has the least axial loading condition( Pu
Ag f ′c
= 0.07).In contrast, the OMRCF exterior column specimen with lapsplices (OEL) has the smallest ductility capacity (3.02) ithe negative loading direction. Specimen IEL has a ductilicapacity of 5.90 in the negative loading direction. Thus theffect of lateral reinforcement spacing on displacement andductility capacity becomes important to all interior columnspecimens, and exterior specimens having lap splices.
4.5. Energy dissipation
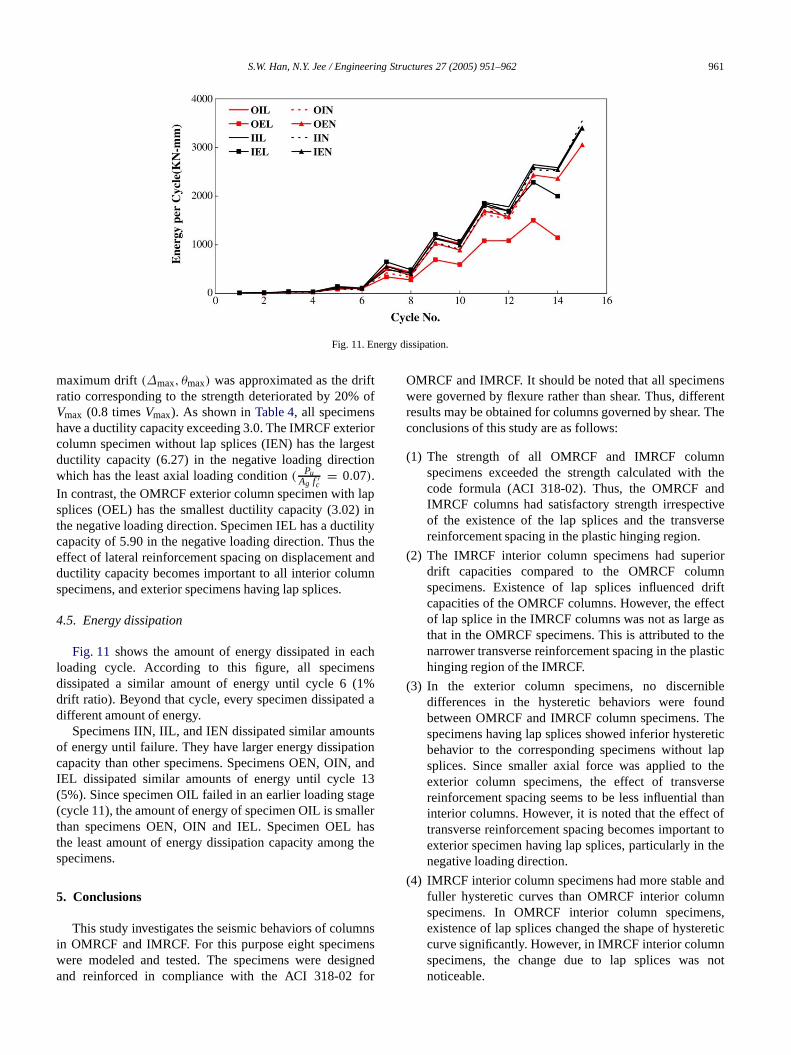
Fig. 11 shows the amount of energy dissipated in eacloading cycle. According to this figure, all specimensdissipated a similar amount of energy until cycle 6 (1%drift ratio). Beyond that cycle, every specimen dissipateddifferent amount of energy.
Specimens IIN, IIL, and IEN dissipated similar amountof energy until failure. They have larger energy dissipatiocapacity than other specimens. Specimens OEN, OIN, aIEL dissipated similar amounts of energy until cycle 1(5%). Since specimen OIL failed in an earlier loading stag(cycle 11), the amount of energy of specimen OIL is smallthan specimens OEN, OIN and IEL. Specimen OEL hathe least amount of energy dissipation capacity among tspecimens.
5. Conclusions
This study investigates the seismic behaviors of columin OMRCF and IMRCF. For this purpose eight specimenswere modeled and tested. The specimens were designand reinforced in compliance with the ACI 318-02 fo
f
t
d
d
OMRCFand IMRCF. It should be noted that all specimenwere governed by flexure rather than shear. Thus, differenresults may be obtained for columns governed by shear. Tconclusions of this study are as follows:
(1) The strength of allOMRCF and IMRCF columnspecimens exceeded the strength calculated withcode formula (ACI 318-02). Thus, the OMRCF anIMRCF columns had satisfactory strength irrespectiof the existence of the lap splices and the transvereinforcement spacing in the plastic hinging region.
(2) The IMRCF interior column specimens had superidrift capacities compared to the OMRCF columspecimens. Existence of lap splices influenced drcapacities of the OMRCF columns. However, the effeof lap splice in the IMRCF columns was not as large athat in the OMRCF specimens. This is attributed to thnarrower transverse reinforcement spacing in the plashinging region of the IMRCF.
(3) In the exterior column specimens, no discernibdifferences in the hysteretic behaviors were founbetween OMRCF and IMRCF column specimens. Tspecimens having lap splices showed inferior hysterebehavior to the corresponding specimens without lsplices. Since smaller axial force was applied to theexterior column specimens, the effect of transversreinforcement spacing seems to be less influential thinterior columns. However, it is noted that the effect otransverse reinforcement spacing becomes important toexterior specimen having lap splices, particularly in thnegative loading direction.
(4) IMRCF interior column specimens had more stable afuller hysteretic curves than OMRCF interior columspecimens. In OMRCF interior column specimens,existence of lap splices changed the shape of hysterecurve significantly. However, in IMRCF interior columnspecimens, the change due to lap splices was nnoticeable.
962 S.W. Han, N.Y. Jee / Engineering Structures 27 (2005) 951–962
p
n
,
de
eo.
e
04.
e02.
f
):
s
(5) In exterior column specimens of OMRCF and IMRCF,hysteretic curves became narrower when they had lasplices. However, the hysteretic curves of OMRCFexterior columns are similar to those of correspondingIMRCF exterior columns.
(6) According to the test results, the OMRCF and IMRCFcolumn specimens had drift capacities greater tha3.0%and 4.5%, respectively. Ductility capacity of thosespecimens exceeded 3.01 and 4.53, respectively.
Acknowledgement
The support of Hanyang University is greatly acknowl-edged.
References
[1] American Concrete Institute. Building code requirements forreinforced concrete, ACI 318-95,99, 02, Detroit, Michigan, 1995,1999, 2002.
[2] Uniform Building Code (UBC). International conference on buildingofficials. 1997.
[3] Building Seismic Safety Council. NEHRP recommended provisionsfor the development of seismic regulation for new buildings, Part 1and 2, provisions and commentary, Washington, DC: FEMA; 19941997.
[4] Portland Cement Association. Notes on ACI 318-99, 02 building corequirements for structural concrete, Skokie, Illinois, 1999, 2002.
[5] Computers and Structures Inc. SAP2000, 1997.[6] Han SW, Kwon OS, Lee L-H, Foutch DA. Seismic performanc
evaluation of ordinary moment resisting concrete frames. SRS N633, Urbana, Illinois; 2002 November.
[7] Han SW, Kwon OS, Lee L-H. Evaluation of the seismic performancof a three-story ordinary moment resisting concrete frame. Earthquakeengineering and structural dynamics, vol. 33. Wiely and Sons; 20p. 669–85.
[8] BOCA, ICBO, SBCCI. International Building Code. 2000.[9] Lee H-S, Woo S-W. Effect of masonry infills on seismic performance
of a 3-storey RC frame with non-seismic detailing. Earthquakengineering and structural dynamics, vol. 31. Wiely and Sons; 20p. 353–78.
[10] Aycardi LE, Mander JB, Reinhorn AM. Seismic resistance oreinforced concrete frame structures designed only for gravity loads:experimental performance of subassemblages. Structural JournalAmerican Concrete Institute 1994;91:552–63.
[11] Lynn A, Moehle J, Mahin SA, Holmes WT. Seismic evaluationof existing RC building columns. Earthquake Spectra 1996;12(4715–39.
Sang Whan Han. Associate Professor, Dept. of Architectural Eng.,Hanyang Univ., Seoul 133-791, Korea. Ph.D. (1994), University of Illinoiat Urbana-Champaign, Professional Engineer (US, Korea).
N.Y. Jee. Professor, Dept. of Architectural Eng., Hanyang Univ., Seoul 133-791, Korea. Ph.D. (1992), Tokyo National University.