Embed Size (px)
Citation preview

Brian [email protected] 6325.501 – Remote Sensing FundamentalsFinal Project Fall 2016Dr. Anthony Cummings
A Comparison of LiDAR and Field Survey Data

Project Location• Located in southwest Dallas
• I-20 splits around a large hill in the median
• Image of Texas on the west side of hill
• One of the most topographically diverse areas in DFW

Project Location
I chose this area because…….
• To test the capabilities of LiDAR in heavy canopy and rough terrain.
• Area difficult to survey using current methods
• Little change since LiDAR data created
• Easy access, not worried about trespassing on private land

Project Objectives
Project Purpose
• Compare accuracy of airborne LiDAR with survey grade data collected in situ
• Determine it’s usefulness for land surveying/civil engineering applications
• To learn more about LiDAR data in order to further my research into the subject

Project Objectives
Initial Hypothesis
LiDAR data isn’t as accurate as data collected in situ, but it will be close enough to be useful in many applications, particularly in areas with dense canopy and rough terrain.
Despite these limitations it will be a useful tool to use to fill in holes in survey data, and estimate project costs before field work is undertaken.

Project Objectives
Why My Project is Important
Surveyors and engineers have already started using LiDAR, so my work won’t be revolutionary in that regard. However, if the data proves to be useful, it would be an opportunity to convince my current employer to start utilizing the technology. Good data is worth more than a stack of articles or papers in my industry.

Workflow

LiDAR Dataset
Original Dataset: tnris_2009_1m_329617_3_b.lasDate of Acquisition: 03/29/2009 – 04/14/2009Format: LiDAR Point Cloud LAS 1.2 formatProjection: UTM Zone 14 NorthHorizontal Datum: NAD83Vertical Datum: NAVD88Provider: Sanborn Map Company
| LiDAR Dataset warning! Large file (553 MB)| Metadata |

LiDAR Data Prep
| Clipped LiDAR Dataset (Size 72 MB)|

LiDAR Data Prep
Clipping LiDAR Data in ERDAS Imagine
�
Use drawing tools to create new AOI Layer. Save it when finished.(right click, Save Layer As) Hint: You can load a shapefile first to trace.
�
On the Point Cloud Tab, Left click on Split On the Tools Menu. A new dialog box will Appear.
� Input path to original LiDAR dataset.
� Input path to new clipped data set.Choose Split by Definition file, Input path to AOI layer created in step 1.
� Click OK.
LiDAR Data Prep
| Filtered LiDAR Dataset (Size 38 MB)|

LiDAR Data Prep
Filtering LiDAR Data in ERDAS Imagine
�
On the Point Cloud Tab, Left click on Filter above Tools Menu. A new dialog box will Appear.
�
Select General tab.� Input path to original LiDAR dataset, and to
new filtered data set.
� Select Classification Tab.
Click under Select column to select class (or classes).
� Click OK.

LiDAR Data Prep
| DTM |
| Shaded Relief |

LiDAR Data Prep
Create DTM from LiDAR in ERDAS Imagine

Data Collection 1
Data Points

Data Collection 1
Data Points (Data Dictionary)

DTM Elevation Extraction
Extract Raster Elevation Values in ArcGIS with Spatial Analyst

Data Analysis
Data Analysis
1. Calculate Elevation Difference – ( SurvElevM – RASTERVALU)
2. Convert Meters to US Survey feet (1 m = 3.2808333333465 US
Sft.)3. Convert elevation difference values to absolute values
( -2 cm = same amount of error as +2 cm)
4. Classify into three groups (Green-Yellow-Red)

Data Analysis

Data Analysis
Feet
Meters

Data Analysis
Feet
Meters

Data Analysis
Data Analysis Topo Points
1. Open terrain, hoping for better results
2. Standard deviation 6.7 cm, still acceptable results
3. Poor temporal resolution likely cause of error, drainage culvert
has shifted since it was build and feature elevations have likely
changed
since LiDAR data acquired.

Data Analysis
1. Open terrain, used natural ground
elevations instead of man-made
features.
2. Took multiple GNSS readings over
several days.
3. Used ½ inch iron rods driven flush with
ground.
Data Analysis Control Points

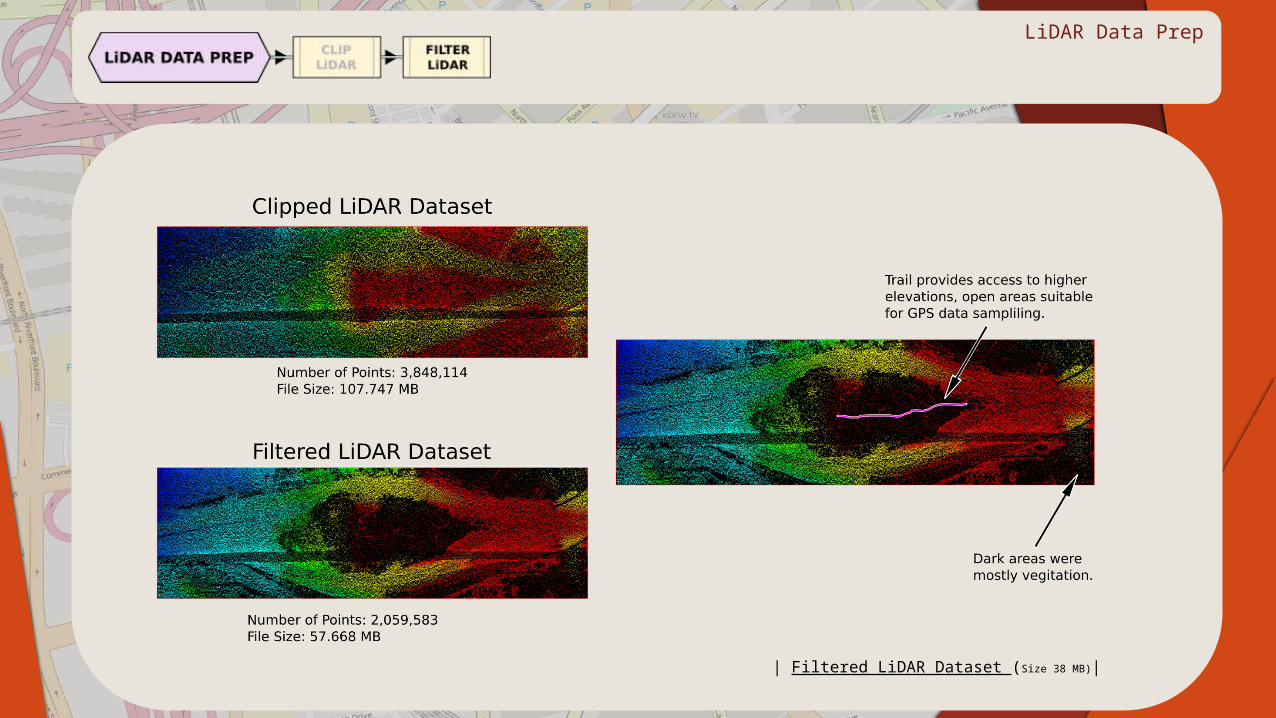
Data Analysis
Data Analysis
Meters
Feet
Data Analysis
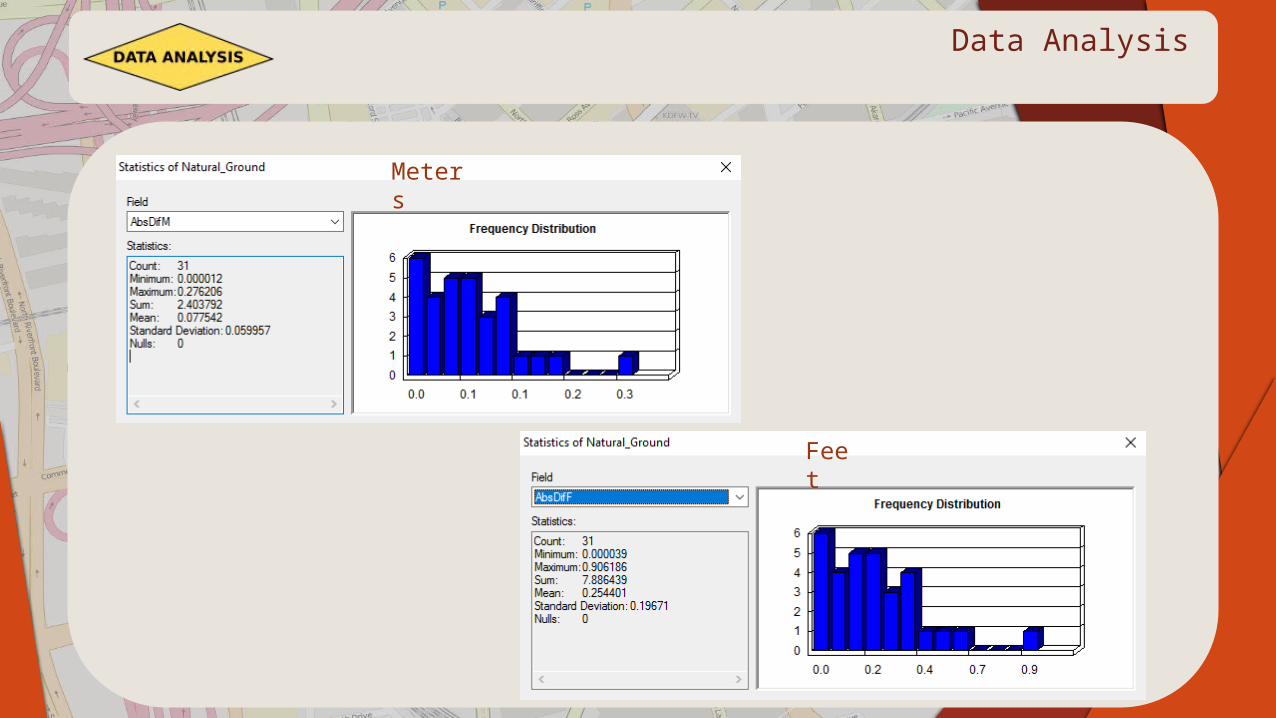
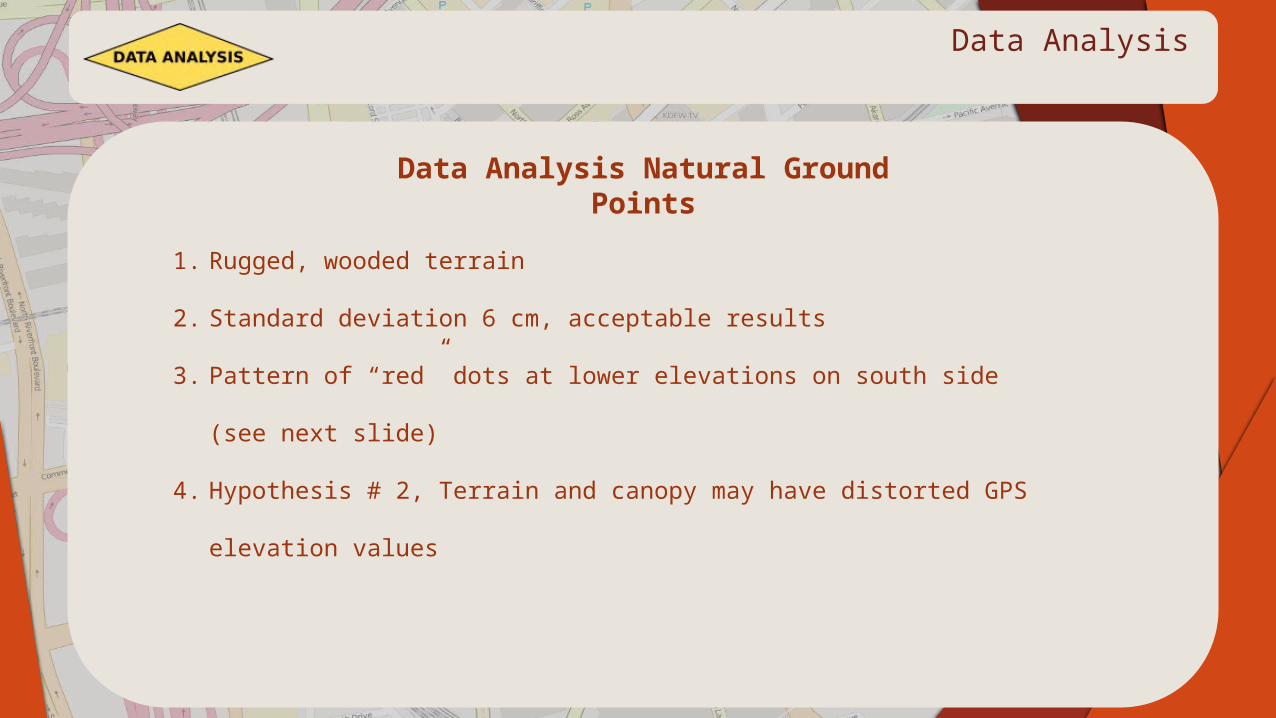
Data Analysis Natural Ground Points
1. Rugged, wooded terrain
2. Standard deviation 6 cm, acceptable results
3. Pattern of “red” dots at lower elevations on south side (see next
slide)
4. Hypothesis # 2, Terrain and canopy may have distorted GPS
elevation values

Data Analysis

Final Fieldwork
Final Fieldwork Total Station
1. Re-measured points 700 and 701
2. Significantly adjusted both points, now reclassified
as yellow ( 0.201-0.403 ft., 0.062-0.123 m.)

Final Fieldwork
Final Fieldwork GNSS (GPS)

Final Fieldwork
Final Fieldwork GPS (GNSS)
1. Re-measured point 703
2. Slight adjustment in elevation values, closer to LiDAR value
3. Points 11 and 706 excluded because they are located on steep slope.
Because of horizontal accuracy limitations of LiDAR a few
centimeters of error results in errors in elevation difference
calculations.
4. These points wouldn’t have been measured normally in a field
survey. Generally only measure top and toe of a consistent slope.

Final Fieldwork

Final Analysis
Meters
Feet

Final Analysis
Final Analysis
1. Overall elevation results are “survey” in most cases.
2. Even though field survey methods generally produce more accurate
data, the volume of LiDAR points possible can create a more
accurate terrain model.
3. LiDAR can’t replace field survey methods completely, but it can
supplement field survey data and reduce time and cost for survey
production.
4. The cost of acquiring airborne LiDAR is cost prohibitive for most
survey budgets, but the ability of UAVs to carry LiDAR sensors is a
game changer.

Review of Literature
Review of the Literature
1. Reviewed several recent publications of POB, LiDAR Magazine,
American Surveyor, and xyHt .
2. Most articles focus on terrestrial LiDAR.
3. 3 articles of interest focus on airborne LiDAR.
4. Many advertisements for LiDAR capable UAVs.
5. My company should be purchasing one early next year.

Review of Literature
“Airport Mapping” LiDAR Magazine June 2016
1. Many (100’s) of airports using remote sensing for facility
management and operations.
2. FAA requires “a full spectrum” of information on airport operations,
the bigger the airport the more information required.
3. Licensed surveyors supervise the data collection, especially ground
control
4. LiDAR data collected for these projects yield a horizontal and vertical
accuracy less than/equal to 5 cm.Paton, AL “Airports.” LiDAR Magazine June 1016: 12-17

Review of Literature
“A Bigger Picture” POB May 2016
1. Next generation of LiDAR sensors produce denser data sets .
2. Instead of a single pulse, thousands of pulses are emitted
3. Minimum 500 pulses must be returned to the sensor to be measured
4. Airplanes can now fly higher than before, creating a bigger footprint,
collecting more data faster
King, Valerie “A Bigger Picture.” POB May 2016: 16-19

Review of Literature
“Single Photon LiDAR” xyHt December 2016
1. Single Photon LIDAR (SPL)
2. Uses less power, collects more data, uses green lasers to see
through semi-porous objects (i.e. clouds, fog, vegetation, water up to
40’ depth)
3. Can be mounted on small aircraft
4. Wavelength 532 nm
5. Can map up to 300 square miles in 1 hourLidtka, Kevin “Single-Photon LIDAR.” xyHt December 2016:
16-21

Closing Thoughts
I enjoyed working on the project because…..
A. I was able to apply my existing knowledge.
B. I was able to apply what I learned in the labs this semester. C. It gave me the opportunity to learn new skills on my own to complete the
project.