Embed Size (px)
Citation preview
FLUID MECHANICS ASSIGNMENT
1 | P a g e
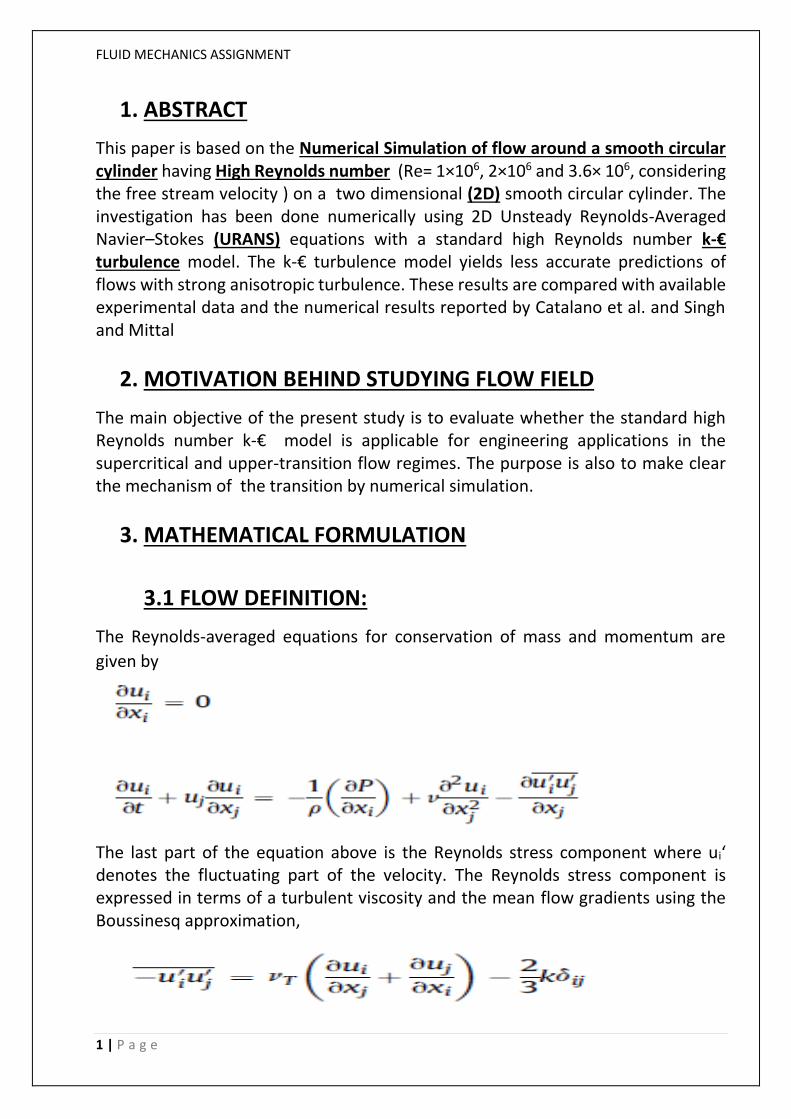
1. ABSTRACT
This paper is based on the Numerical Simulation of flow around a smooth circular cylinder having High Reynolds number (Re= 1×10⁶, 2×10⁶ and 3.6× 10⁶, considering the free stream velocity ) on a two dimensional (2D) smooth circular cylinder. The investigation has been done numerically using 2D Unsteady Reynolds-Averaged Navier–Stokes (URANS) equations with a standard high Reynolds number k-€ turbulence model. The k-€ turbulence model yields less accurate predictions of flows with strong anisotropic turbulence. These results are compared with available experimental data and the numerical results reported by Catalano et al. and Singh and Mittal
2. MOTIVATION BEHIND STUDYING FLOW FIELD
The main objective of the present study is to evaluate whether the standard high Reynolds number k-€ model is applicable for engineering applications in the supercritical and upper-transition flow regimes. The purpose is also to make clear the mechanism of the transition by numerical simulation.
3. MATHEMATICAL FORMULATION
3.1 FLOW DEFINITION:
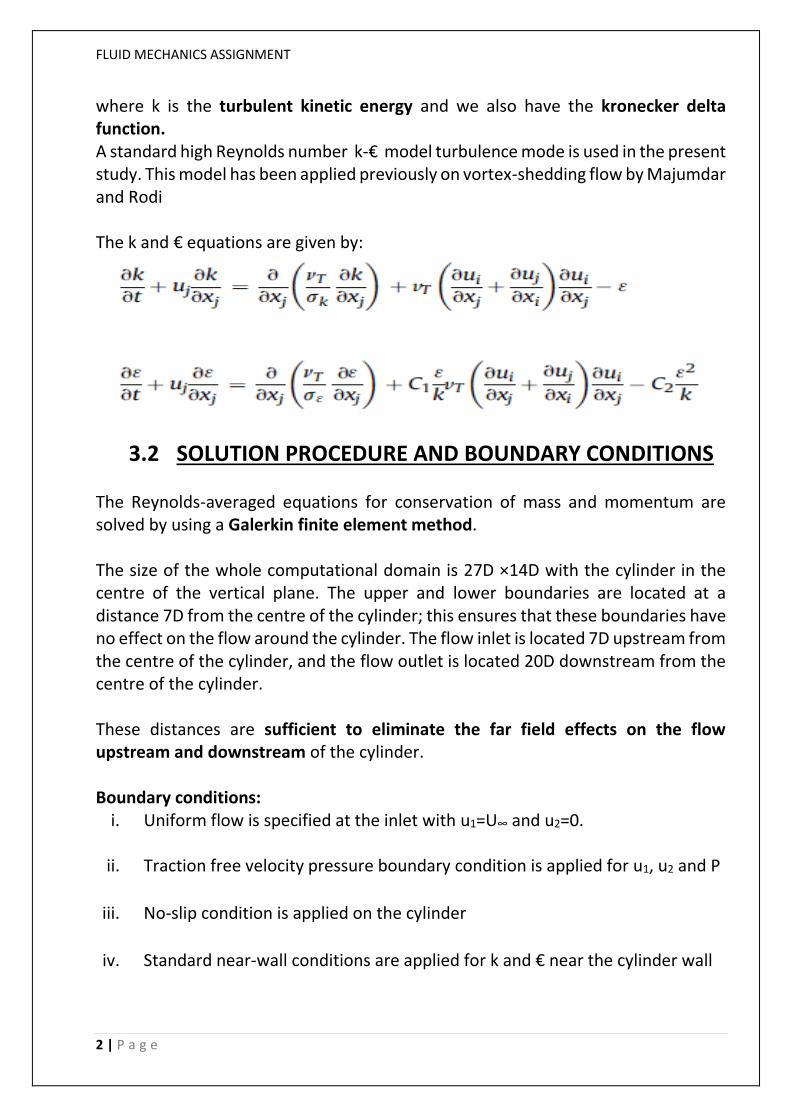
The Reynolds-averaged equations for conservation of mass and momentum are
given by
The last part of the equation above is the Reynolds stress component where ui‘ denotes the fluctuating part of the velocity. The Reynolds stress component is expressed in terms of a turbulent viscosity and the mean flow gradients using the Boussinesq approximation,
FLUID MECHANICS ASSIGNMENT
2 | P a g e
where k is the turbulent kinetic energy and we also have the kronecker delta function. A standard high Reynolds number k-€ model turbulence mode is used in the present study. This model has been applied previously on vortex-shedding flow by Majumdar and Rodi The k and € equations are given by:
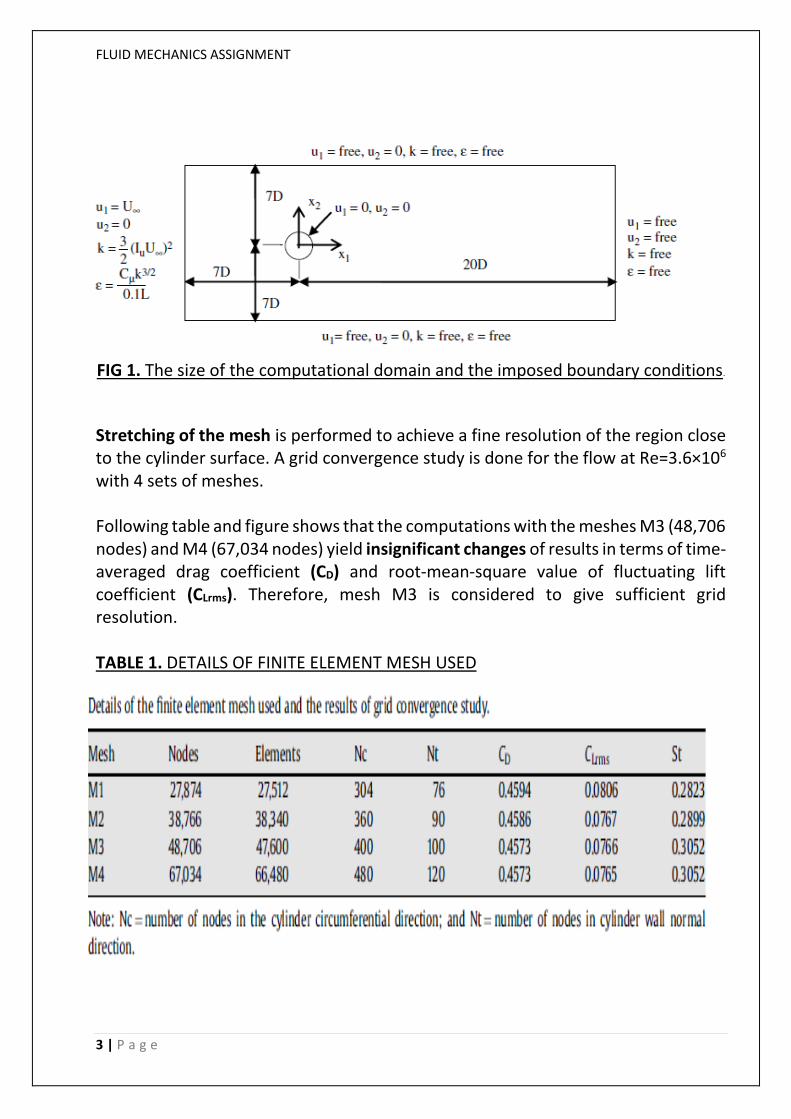
3.2 SOLUTION PROCEDURE AND BOUNDARY CONDITIONS The Reynolds-averaged equations for conservation of mass and momentum are solved by using a Galerkin finite element method. The size of the whole computational domain is 27D ×14D with the cylinder in the centre of the vertical plane. The upper and lower boundaries are located at a distance 7D from the centre of the cylinder; this ensures that these boundaries have no effect on the flow around the cylinder. The flow inlet is located 7D upstream from the centre of the cylinder, and the flow outlet is located 20D downstream from the centre of the cylinder. These distances are sufficient to eliminate the far field effects on the flow upstream and downstream of the cylinder. Boundary conditions:
i. Uniform flow is specified at the inlet with u1=U∞ and u2=0.
ii. Traction free velocity pressure boundary condition is applied for u1, u2 and P
iii. No-slip condition is applied on the cylinder
iv. Standard near-wall conditions are applied for k and € near the cylinder wall
FLUID MECHANICS ASSIGNMENT
3 | P a g e
FIG 1. The size of the computational domain and the imposed boundary conditions.
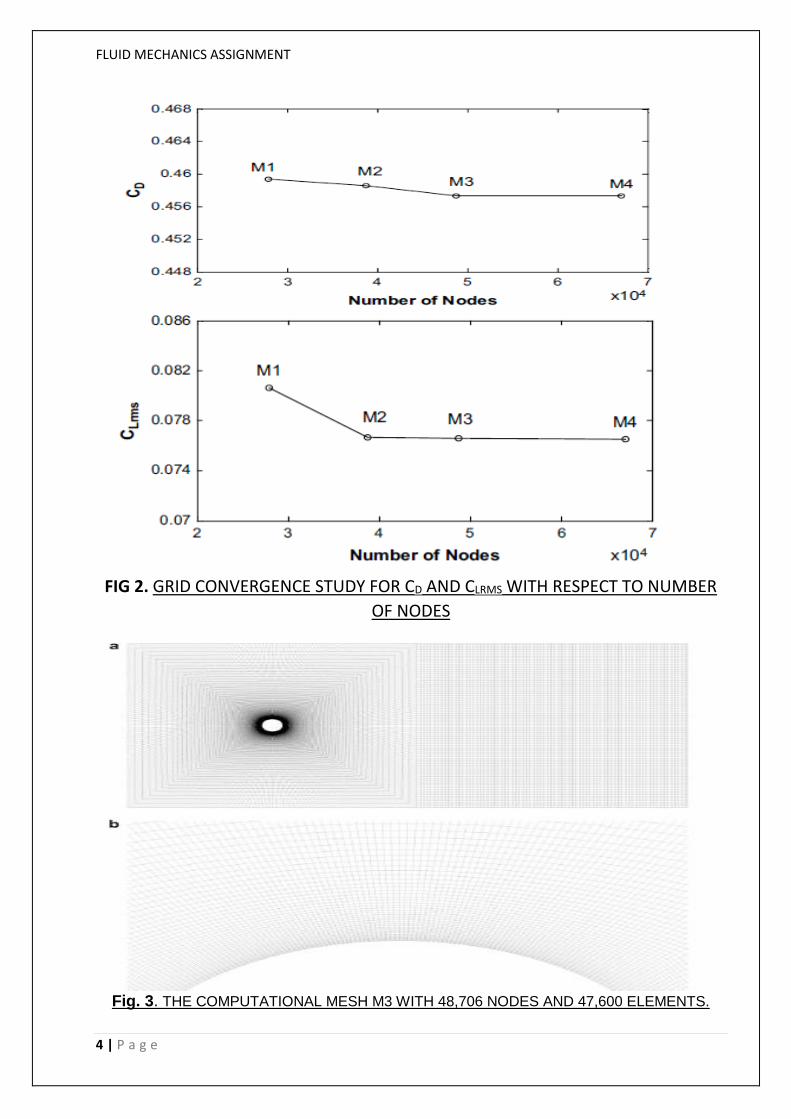
Stretching of the mesh is performed to achieve a fine resolution of the region close to the cylinder surface. A grid convergence study is done for the flow at Re=3.6×10⁶ with 4 sets of meshes. Following table and figure shows that the computations with the meshes M3 (48,706 nodes) and M4 (67,034 nodes) yield insignificant changes of results in terms of time-averaged drag coefficient (CD) and root-mean-square value of fluctuating lift coefficient (CLrms). Therefore, mesh M3 is considered to give sufficient grid resolution. TABLE 1. DETAILS OF FINITE ELEMENT MESH USED
FLUID MECHANICS ASSIGNMENT
4 | P a g e
FIG 2. GRID CONVERGENCE STUDY FOR CD AND CLRMS WITH RESPECT TO NUMBER
OF NODES
Fig. 3. THE COMPUTATIONAL MESH M3 WITH 48,706 NODES AND 47,600 ELEMENTS.
FLUID MECHANICS ASSIGNMENT
5 | P a g e
4.RESULTS AND DISCUSSIONS:
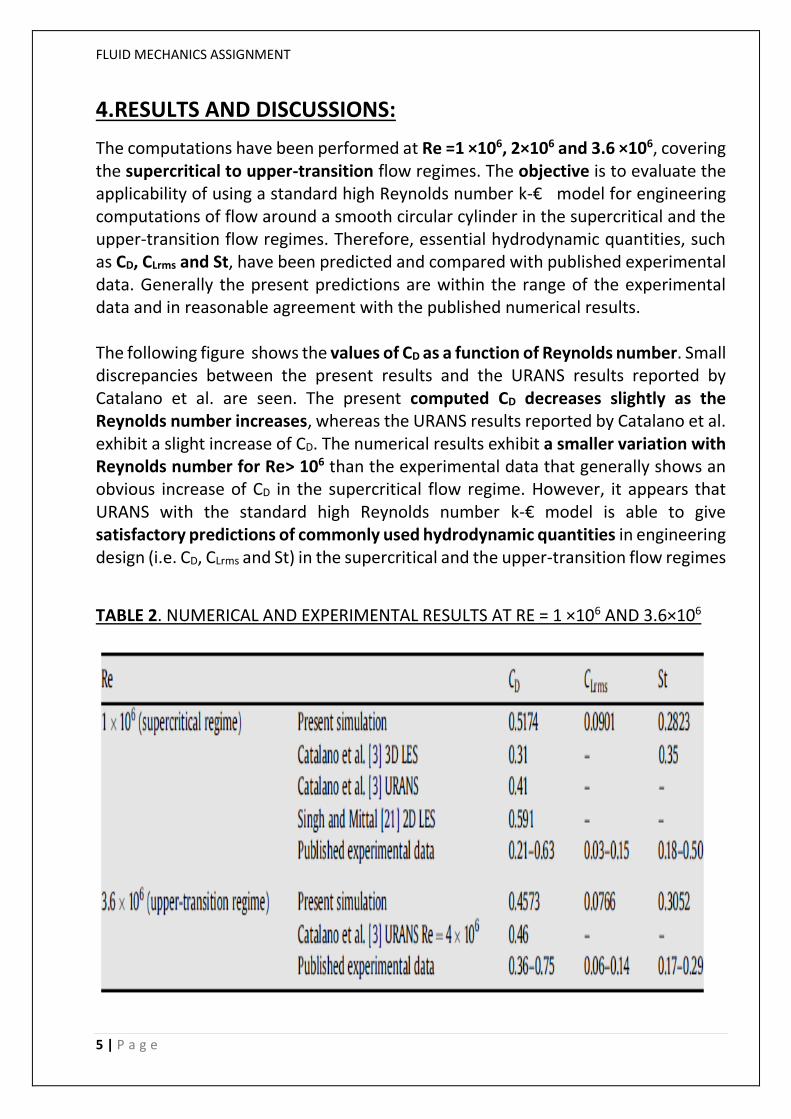
The computations have been performed at Re =1 ×10⁶, 2×10⁶ and 3.6 ×10⁶, covering the supercritical to upper-transition flow regimes. The objective is to evaluate the applicability of using a standard high Reynolds number k-€ model for engineering computations of flow around a smooth circular cylinder in the supercritical and the upper-transition flow regimes. Therefore, essential hydrodynamic quantities, such as CD, CLrms and St, have been predicted and compared with published experimental data. Generally the present predictions are within the range of the experimental data and in reasonable agreement with the published numerical results. The following figure shows the values of CD as a function of Reynolds number. Small discrepancies between the present results and the URANS results reported by Catalano et al. are seen. The present computed CD decreases slightly as the Reynolds number increases, whereas the URANS results reported by Catalano et al. exhibit a slight increase of CD. The numerical results exhibit a smaller variation with Reynolds number for Re> 106 than the experimental data that generally shows an obvious increase of CD in the supercritical flow regime. However, it appears that URANS with the standard high Reynolds number k-€ model is able to give satisfactory predictions of commonly used hydrodynamic quantities in engineering design (i.e. CD, CLrms and St) in the supercritical and the upper-transition flow regimes
TABLE 2. NUMERICAL AND EXPERIMENTAL RESULTS AT RE = 1 ×10⁶ AND 3.6×10⁶
FLUID MECHANICS ASSIGNMENT
6 | P a g e
Fig 5. Time-averaged drag coefficient as a function of Reynolds number.
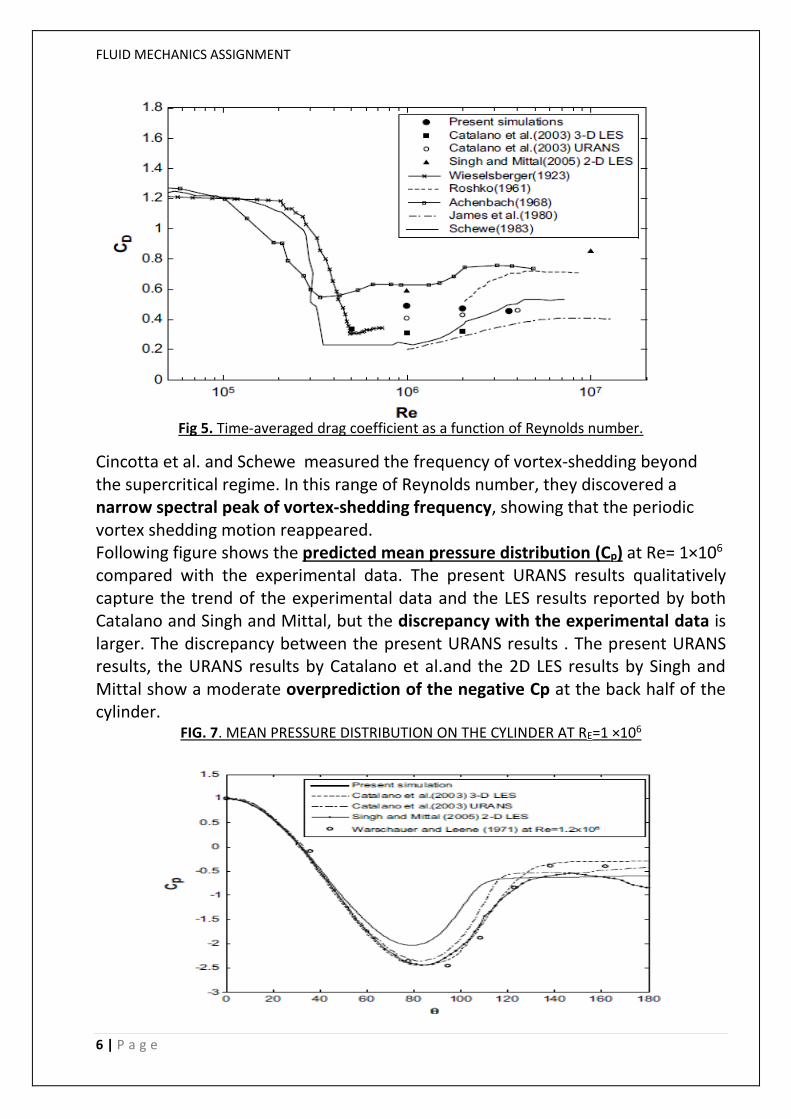
Cincotta et al. and Schewe measured the frequency of vortex-shedding beyond the supercritical regime. In this range of Reynolds number, they discovered a narrow spectral peak of vortex-shedding frequency, showing that the periodic vortex shedding motion reappeared. Following figure shows the predicted mean pressure distribution (Cp) at Re= 1×10⁶ compared with the experimental data. The present URANS results qualitatively capture the trend of the experimental data and the LES results reported by both Catalano and Singh and Mittal, but the discrepancy with the experimental data is larger. The discrepancy between the present URANS results . The present URANS results, the URANS results by Catalano et al.and the 2D LES results by Singh and Mittal show a moderate overprediction of the negative Cp at the back half of the cylinder.
FIG. 7. MEAN PRESSURE DISTRIBUTION ON THE CYLINDER AT RE=1 ×10⁶
FLUID MECHANICS ASSIGNMENT
7 | P a g e
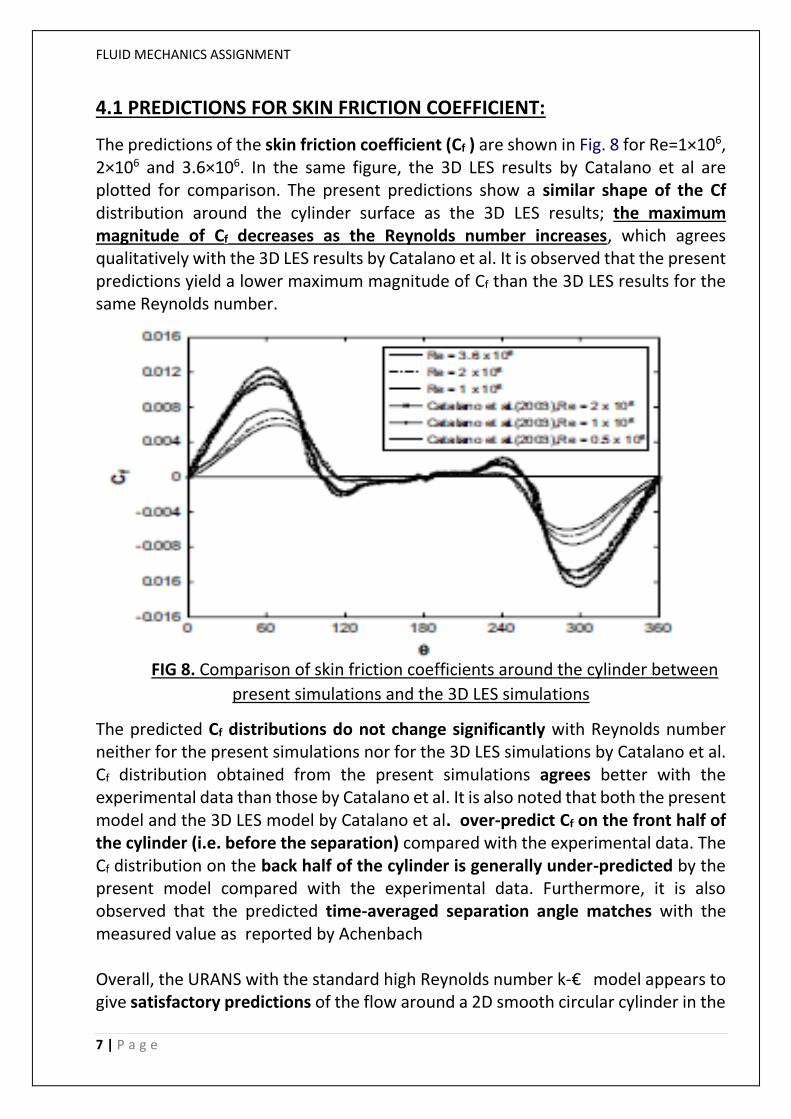
4.1 PREDICTIONS FOR SKIN FRICTION COEFFICIENT:
The predictions of the skin friction coefficient (Cf ) are shown in Fig. 8 for Re=1×10⁶, 2×10⁶ and 3.6×10⁶. In the same figure, the 3D LES results by Catalano et al are plotted for comparison. The present predictions show a similar shape of the Cf distribution around the cylinder surface as the 3D LES results; the maximum magnitude of Cf decreases as the Reynolds number increases, which agrees qualitatively with the 3D LES results by Catalano et al. It is observed that the present predictions yield a lower maximum magnitude of Cf than the 3D LES results for the same Reynolds number.
FIG 8. Comparison of skin friction coefficients around the cylinder between
present simulations and the 3D LES simulations
The predicted Cf distributions do not change significantly with Reynolds number neither for the present simulations nor for the 3D LES simulations by Catalano et al. Cf distribution obtained from the present simulations agrees better with the experimental data than those by Catalano et al. It is also noted that both the present model and the 3D LES model by Catalano et al. over-predict Cf on the front half of the cylinder (i.e. before the separation) compared with the experimental data. The Cf distribution on the back half of the cylinder is generally under-predicted by the present model compared with the experimental data. Furthermore, it is also observed that the predicted time-averaged separation angle matches with the measured value as reported by Achenbach Overall, the URANS with the standard high Reynolds number k-€ model appears to give satisfactory predictions of the flow around a 2D smooth circular cylinder in the
FLUID MECHANICS ASSIGNMENT
8 | P a g e
range Re= 1×10⁶ to 3.6×10⁶. This is based on comparing the results with the published experimental data and numerical results.
5.USE OF THE STUDY OF THE FLOW AND DRAWBACKS OF PAPER
The results of the present study are encouraging for CFD-based engineering applications, e.g. modeling of vortex-induced vibration responses of marine pipelines and risers together with a strip theory approach to obtain 3D hydrodynamic loads, because the URANS with the standard high Reynolds number k-€ model requires less computational effort compared with LES and DNS for region beyond the supercritical flow regime. Furthermore, its accessibility is high as it is available in most of the commercial CFD software packages. This model is known to yield less accurate predictions of flows with strong anisotropic turbulence
6. CONCLUSIONS The flow around a 2D smooth circular cylinder has been computed for very high Reynolds numbers, covering the supercritical to upper-transition flow regime, using the 2D URANS in conjunction with a standard high Reynolds number k-€ model. Although it has been shown earlier that this model gives less accurate predictions of flow with strong anisotropic turbulence, the present study shows that for engineering design purposes it gives satisfactory qualitative agreements with the published experimental data and numerical results in the supercritical and upper-transition flow regimes. However, more experimental data are required beyond the supercritical flow regime, especially velocity and Reynolds stress profile measurements, in order to perform a more detailed validation study of the model. In the meantime the present study should be reliable and useful as an engineering assessment tool for design work.