Embed Size (px)
Citation preview
1278 IEEE TRANSACTIONS ON INTELLIGENT TRANSPORTATION SYSTEMS, VOL. 14, NO. 3, SEPTEMBER 2013
Person-Based Traffic ResponsiveSignal Control Optimization
Eleni Christofa, Ioannis Papamichail, and Alexander Skabardonis
Abstract—This paper presents a person-based traffic respon-sive signal control system for transit signal priority (TSP) onconflicting transit routes. A mixed-integer nonlinear program(MINLP) is formulated, which minimizes the total person delayat an intersection while assigning priority to the transit vehiclesbased on their passenger occupancy. The mathematical formula-tion marks an improvement to previous formulations by ensur-ing global optimality for undersaturated traffic conditions andintersection design and traffic characteristics that lead to convexobjective functions in reasonable computation time for real-timeapplications. The system has been tested for a complex signalizedintersection located in Athens, Greece, which is characterizedby multiple bus lines traveling in conflicting directions. Testingincludes cases with deterministic vehicle arrivals at the inter-section and emulation-in-the-loop simulation (EILS) tests thatincorporate stochasticity in the vehicle arrivals. The results showthat the proposed person-based traffic responsive signal controlsystem reduces the total person delay at the intersection andeffectively provides priority to transit vehicles, even when perfectinformation about the auto and transit arrivals at the intersectionis not available.
Index Terms—Mathematical model, person delay, traffic signalcontrol, transit signal priority (TSP).
I. INTRODUCTION
T RAFFIC congestion is one of the biggest problems thaturban areas are facing. Conflicts among multiple modes
that share the same infrastructure further complicate the systemand exacerbate this problem. However, multimodal systems areessential for achieving more efficient, sustainable, and equi-table transportation operations. If properly optimized, trafficsignal systems hold potential to achieve efficient multimodaltraffic operations while mitigating congestion and its negativeexternalities in urban networks. These systems are tradition-ally optimized by minimizing total delays for vehicles. Suchvehicle-based optimization can lead to unfair treatment of pas-sengers in high occupancy vehicles.
Manuscript received October 18, 2012; revised February 22, 2013; acceptedApril 7, 2013. Date of publication May 16, 2013; date of current versionAugust 28, 2013. The Associate Editor for this paper was W. Fan.
E. Christofa is with the Department of Civil and Environmental Engineering,University of Massachusetts, Amherst, MA 01003 USA (e-mail: [email protected]).
I. Papamichail is with the Department of Production Engineering and Man-agement, Technical University of Crete, Chania 73100, Greece (e-mail: [email protected]).
A. Skabardonis is with the Department of Civil and Environmental Engineer-ing, Institute of Transportation Studies, University of California, Berkeley, CA94720 USA (e-mail: [email protected]).
Color versions of one or more of the figures in this paper are available onlineat http://ieeexplore.ieee.org.
Digital Object Identifier 10.1109/TITS.2013.2259623
Transit vehicles contribute less to congestion and pollutionper passenger, but their users often experience higher overalltravel costs than auto users. There is a need for grantingpriority to transit vehicles at bottlenecks, such as signalizedintersections, which are responsible for a significant portion oftheir delay. Prioritizing transit vehicles through improvementsin facility design (e.g., bus lanes) is not always feasible be-cause of geometric or spatial restrictions. Transit signal priority(TSP) is an operational strategy that facilitates efficient transitoperations by providing priority to transit vehicles at signalizedintersections, and it has been incorporated in several real-time signal control systems. These systems use detection ofvehicular traffic at some point upstream and/or downstream ofan intersection to predict the traffic conditions and adjust thesignal settings in real time. Using the available information,the signal settings are optimized on a decision horizon equalto one cycle or a few minutes (traffic responsive systems) or ona rolling horizon (adaptive systems). Recently, an arterial-leveladaptive signal control system has been developed, which opti-mizes signal settings using mobile sources, but its success de-pends on the existence of high market penetration of equippedvehicles [1].
The literature provides several examples of real-time (i.e.,adaptive and traffic responsive) traffic signal control systemsthat incorporate TSP with various levels of success underdifferent traffic conditions. Despite the number of systems thathave been designed, there are still several issues that have notbeen successfully addressed. First of all, the majority of theexisting systems do not provide priority in a systematic wayto transit vehicles traveling in conflicting directions. Existingwork has dealt with this issue either by predetermining the rela-tive priority level of the transit routes [2], [3] or by constrainingthe implementation of the system to networks that include onlytransit vehicles traveling in nonconflicting directions [4]–[6].Moreover, transit priority is often unconditionally provided,without considering specific criteria, such as passenger oc-cupancy and schedule delay [7]. Such criteria could ensureimprovement in the operations of transit vehicles while pro-tecting cross streets from reaching oversaturated conditions. Inaddition, the existing systems do not account for the differencein the passenger occupancy of autos and transit vehicles, insteadoptimizing their systems on a per-vehicle basis [4], [8], [9]. Theprovision of priority is often rule based [10], and as a result, itis not explicitly included in the optimization process.
Recently, a traffic responsive signal control system with TSPhas been developed and tested by the authors [11], [12]. Theobjective of this system is to optimize the signal timings at anintersection, such that conditional priority is granted to transit
1524-9050 © 2013 IEEE

CHRISTOFA et al.: PERSON-BASED TRAFFIC RESPONSIVE SIGNAL CONTROL OPTIMIZATION 1279
vehicles based on their passenger occupancy. Conditional pri-ority is used as a way to assign priority when two or moretransit vehicles from conflicting directions are expected toarrive at the intersection at approximately the same time andto compete for priority. In addition, the impact of TSP on theauto delays is taken into account by using the total person delayin the objective function for all of the vehicles present at theintersection. The system is based on data from readily availablesensing systems to predict vehicle arrivals. It has been testedfor a variety of undersaturated and oversaturated conditions fordeterministic vehicle arrivals at an isolated intersection. Theresults indicate that the system leads to significant reductionsin the transit users’ delay and the total person delay at theintersection for a wide range of operating conditions.
This paper introduces a significant extension of our pre-vious work by presenting an improved formulation of themathematical program for undersaturated traffic conditions andisolated intersections, which ensures global optimality, as longas the objective function for the specific intersection is convex(which is the case for the intersections tested). It does this insufficiently short computation time for real-time applications.In addition, this paper presents the development and applicationof an emulation-in-the-loop simulation (EILS) approach, whichallows for realistic evaluation of the proposed system andcalculation of several performance measures that cannot beeasily and analytically assessed, e.g., emissions. This paper alsodemonstrates the robustness of the proposed system throughthe simulation experiments. The system is shown to improvetransit operations and to reduce total passenger delay at asignalized intersection, even when perfect information on theactual arrivals of autos and transit vehicles is not available.
The paper is organized as follows. First, we describe themathematical program that minimizes person delays for allusers traveling through the intersection. Then, the study siteused for testing the proposed person-based traffic responsivesignal control system is presented. The results from the teststhat are performed with deterministic vehicle arrivals and theresults from the simulation tests that incorporate stochastic ve-hicle arrivals follow. Finally, the study findings are summarized,and ongoing and future research works are outlined.
II. MATHEMATICAL MODEL
A mathematical model that minimizes total person delay atan intersection has been formulated for undersaturated trafficconditions. Minimization of the total person delay is achievedby weighting delays for both autos and transit vehicles bytheir respective passenger occupancies. This way, the issue ofproviding priority when conflicting transit routes are present isalso addressed.
The mathematical model is formulated based on the as-sumption that perfect information is available about the vehiclearrivals, passenger occupancies, and lane capacities at the inter-section. Auto vehicle arrivals are assumed to be uniform sincethe focus is on isolated intersections for which vehicle arrivalsdo not depend on the signal settings of upstream intersectionsand are considered to be deterministic for delay estimationpurposes. For the analysis period, the cycle length is assumed
to be constant, and the sequence of the phases and the phasedesign are predetermined and fixed. In addition, all of thephases that serve a specific lane group1 are assumed to beconsecutive within each cycle, and the phase yellow times areassumed to be known. It is also assumed that the capacity foreach approach at the intersection is fixed and not affected bytraffic operations, which means that the saturation flow for eachof the lane groups is constant. Finally, the model is formulated,assuming that transit vehicles travel on mixed-use traffic lanesalong with autos. However, the formulation of the mathematicalmodel holds even when dedicated lanes for transit vehiclesexist.
The mathematical program minimizes the total person delayat the intersection by changing the green times for each phasei, i.e., gi, T , within the cycle under consideration (indexed byT ), constrained by minimum and maximum green times and afixed cycle length C. The mathematical program is run once forevery cycle, and the generalized formulation that optimizes thesignal settings for any design cycle T is as follows:
min
AT∑a=1
oada,T +
BT∑b=1
obdb, T (1a)
s.t. gimin ≤ gi, T ≤ gimax (1b)
lj∑i=kj
gi, T +
lj−1∑i=kj
yi ≥ gjmin (1c)
I∑i=1
gi, T + L = C (1d)
wherea auto vehicle index;b transit vehicle index;AT total number of autos served by the intersection
during cycles T and T + 1;BT total number of transit vehicles present at the inter-
section during cycle T ;oa passenger occupancy of auto a [passengers/vehicle];ob passenger occupancy of transit vehicle b [passen-
gers/vehicle];da,T delay for auto a for cycle T [seconds];db, T delay for transit vehicle b for cycle T [seconds];gi, T green time allocated to phase i in cycle T [seconds];gimin minimum green time for phase i [seconds];gimax maximum green time for phase i [seconds];kj first phase in a cycle that can serve lane group j;lj last phase in a cycle that can serve lane group j;yi yellow time for phase i;gjmin minimum green time for lane group j [seconds];I total number of phases in a cycle;L lost time [seconds];C cycle length [seconds].
1A lane group is defined per the Highway Capacity Manual 2000 [13] as oneor more adjacent lanes at each intersection approach that can be served by thesame phases.
1280 IEEE TRANSACTIONS ON INTELLIGENT TRANSPORTATION SYSTEMS, VOL. 14, NO. 3, SEPTEMBER 2013
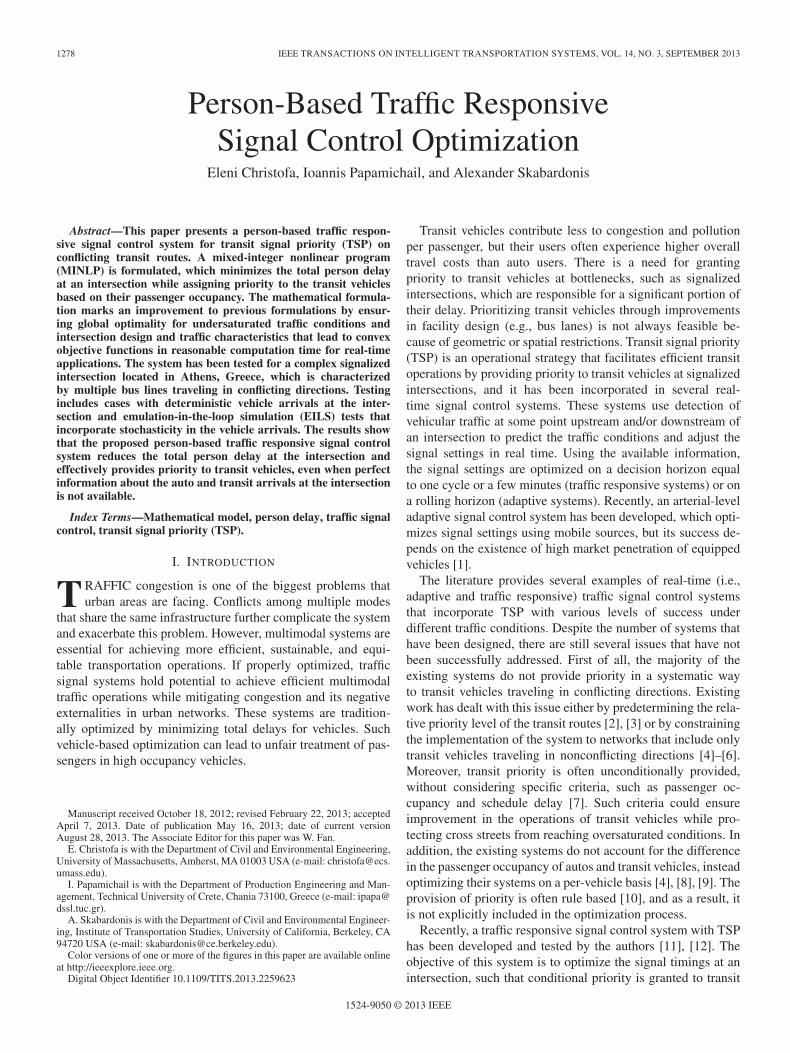
Fig. 1. Queueing diagram for lane group j.
The objective function consists of the sum of the delayfor auto passengers that are served by the intersection duringthe design cycle T and during the next cycle T + 1 and thetransit passengers that are present at the intersection during thedesign cycle T . Delays for autos and transit vehicles dependon the green times gi, T , which are the decision variables forthe mathematical program. In fact, the auto and transit vehicledelays, i.e., da,T and db, T , respectively, also depend on thegreen times of the previous and the next cycles, the yellowtimes, and numerous other input parameters, which are eitherprespecified by the user or collected with the use of surveillancetechnologies. The delays of both autos and transit vehiclesare weighted by their respective passenger occupancies in theobjective function to make this a person-based optimization.
Three constraints are introduced for the decision variables.The green times of each phase i are constrained by theirminimum and maximum green times [see constraint (1b)]. Min-imum green times gimin are necessary to ensure safe vehicleand pedestrian crossings. In addition, they guarantee that nophase is skipped. Note that, if the user wants to allow a phaseto be skipped, the corresponding minimum green time canbe set equal to zero. Maximum green times gimax are usedto restrict the domain of solutions for the green times of thephases and to reduce computation times. Phase green times arefurther constrained by minimum lane group green times gjmin
to ensure undersaturated traffic conditions for each lane group[see constraint (1c)], i.e., gjmin = Cqj/sj . The phase greentimes are also constrained, such that the sum of the green timesfor all phases at each intersection and the lost time adds up tothe cycle length [see constraint (1d)], which is kept constant forevery cycle in the analysis period. Lost time L is assumed to bethe summation of the yellow times for each phase, i.e.,
L =
I∑i=1
yi. (2)
Note that the yellow times do not have to be constant across allphases.
A. Auto Delay
The person delay for the auto passengers included in theobjective function is the sum of two terms: 1) the person delay
that corresponds to the autos that are served during the designcycle T and 2) an estimate of the delay for those that will beserved during the next cycle T + 1. This second delay estimateis included in the objective function to account for the impactthat the design of the signal timings for T will have on thedelays of T + 1. If this second delay estimate was not included,the optimized signal timings for the design cycle would providethe minimum green times to all of the phases apart from the lastone, and this would substantially increase the auto delay for thenext cycle.
Based on the deterministic component of Webster’s delayformula [14], the total delay for all vehicles in a lane groupj and for one cycle, which is denoted by Dj , is calculated asa function of the red time interval Rj , during which the queuegrows; the rate at which vehicles arrive qj ; and the rate at whichvehicles are served sj ; as follows:
Dj =12
qjR2j(
1 − qjsj
) . (3)
Fig. 1 shows the delay for the vehicles of a lane group jand the cumulative number of vehicles of that lane group servedby an intersection during cycle T or T + 1. Note that thecumulative count for each cycle restarts at the end of the greenphase that serves the subject lane group in the previous cycle.
The cycle length for each lane group can be split into threecomponents, which are functions of the phase green times.The first component is the red time from the start of thecycle to the beginning of the green time for the subject lanegroup R
(1)j (gi, T ), the second component is the duration of the
effective green time itself Gej(gi, T ), and the third component is
the red time from the end of the green time until the end of thecycle R
(2)j (gi, T ). These components are shown in Fig. 1 and
can be calculated as follows:
R(1)j (gi, T ) =
kj−1∑i=1
gi, T +
kj−1∑i=1
yi (4a)
Gej(gi, T ) =
lj∑i=kj
gi, T +
lj−1∑i=kj
yi (4b)
R(2)j (gi, T ) =
I∑i=lj+1
gi, T +I∑
i=lj
yi. (4c)

CHRISTOFA et al.: PERSON-BASED TRAFFIC RESPONSIVE SIGNAL CONTROL OPTIMIZATION 1281
Note that, to simplify the illustration, the yellow time intervalshave not been marked on the time axis but are considered to beincluded at the end of each phase.
The shaded area between the solid lines represents the totaldelay experienced by the autos of lane group j that are servedduring the design cycle T , and it is denoted by Dj, T . Theshaded area between the dashed lines represents the estimateof the total delay experienced by the autos of lane group j thatare served during the next cycle T + 1, and it is denoted byDj, T+1. The delay for a lane group j for cycle T is countedfrom the end of the green phase that served j in cycle T − 1until the end of the corresponding green phase in cycle T . As aresult, the signal timings for the previous cycle T − 1 must beknown to determine the delays of the vehicles that arrive at theintersection during cycle T − 1 but will be served during thedesign cycle T . Such queueing diagrams can be drawn for eachlane group to estimate the delay for autos under the assumptionof first-in–first-out queueing discipline. The calculation of autodelays for cycles T and T + 1 is presented in the following.
Auto Delay for Cycle T : The total delay for all autos of lanegroup j that are served during cycle T , i.e., Dj, T , is derivedfrom (3) as follows:
Dj, T =12
qj(1 − qj
sj
) (R
(2)j (gi,T−1) +R
(1)j (gi, T )
)2
. (5)
Auto Delay for Cycle T + 1: The estimate of the total delayfor all autos that will be served during cycle T + 1, i.e.,Dj, T+1, is derived from (3) as follows:
Dj, T+1 =12
qj(1 − qj
sj
) (R
(2)j (gi, T ) +R
(1)j (ginext)
)2
(6)
where ginext is a user-specified value for the green time ofphase i during cycle T + 1. Base case signal timings, optimalfixed signal timings that have been determined offline, or theoptimal green times obtained from the optimization of cycleT − 1 can be used as the phase green times for the next cyclewithout significantly affecting the performance of the system.Equation (6) is also based on the assumption that the arrivalrate for the next cycle is the same as for the design cycle and istherefore equal to qj .
As a result of these delay components, the first part of theobjective function (auto person delay) becomes
AT∑a=1
oada,T = oa
J∑j=1
(Dj, T + Dj, T+1) (7)
where J is the total number of lane groups at the intersection.Dj, T and Dj, T+1 depend on the decision variables gi, T , asshown in (5) and (6). An average value of passenger occupancyper auto oa is used because the total auto delay is collectivelycalculated rather than accounting for each vehicle separately.However, the delays experienced by any individual auto couldbe easily estimated with the use of queueing diagrams such asthat in Fig. 1, given that the arrival time of the vehicle at theback of the queue is known. This approach is used to estimatetransit vehicle delays, as shown in the following.
B. Transit Delay
The person delay for the transit passengers included in theobjective function is the sum of two terms: 1) the persondelay that corresponds to the transit vehicles that are servedduring the design cycle T and 2) an estimate of the delayfor those that arrive in cycle T but will be served duringthe next cycle T + 1. Under the assumption that the arrivaltimes of transit vehicles at the intersection are known onlyfor the design cycle, transit vehicles that arrive at the inter-section during cycle T + 1 are not taken into account. Theexclusion of such vehicles is not expected to significantly affectthe performance of the system because these vehicles willbe considered when the signal timings for cycle T + 1 areoptimized.
Transit vehicles travel in mixed-use traffic lanes with theautos; therefore, the delay of a transit vehicle b that arrives atthe back of its lane group’s queue at some time tb is the sameas an auto that arrives at the same time at the back of that lanegroup’s queue. The delay for a transit vehicle that belongs to alane group j can be calculated by the same queueing diagramsused for auto delay estimation (see Fig. 1). The estimation of thetransit delay used in the optimization of each cycle T dependson the actual arrival time of the transit vehicle tb relative tothe end of the last phase that can serve its lane group j in cycleT − 1, which is denoted by τj, T−1, and the end of the last phasethat can serve j in T , which is denoted by τj, T , where
τj, T = (T − 1)C +R(1)j (gi, T ) +Ge
j(gi, T ). (8)
The possible cases are summarized in the following.Case 1—Arrival Before the End of Green Time in T : If a
transit vehicle b that belongs to lane group j has arrived in theprevious cycle T − 1 at some time after the end of the last phasethat can serve j (tb > τj, T−1) or arrives in the design cycleT before the end of the phases that can serve it (tb ≤ τj, T ),its delay for cycle T , which is denoted by d′b, T , depends onits arrival time tb and phase green times gi, T . This delay isexpressed as
d′b, T = (T − 1)C +R(1)j (gi, T ) +
qjsj
(tb − τj, T−1)− tb. (9)
If the transit vehicle arrives before or at the clearance of its lanegroup’s queue, (9) will give a nonnegative delay. Define this astime interval α, i.e.,
α ={τj, T−1 < tb ≤ τj, T | d′b, T ≥ 0
}. (10)
However, if the transit vehicle arrives after the clearance of thatqueue and at a time within the phases that can serve it, (9)will give a negative delay, which implies that the true delay forsuch a transit vehicle will be zero. Define this as time intervalβ, i.e.,
β ={τj, T−1 < tb ≤ τj, T | d′b, T < 0
}. (11)
Therefore, the transit vehicle delay db, T for this case is ex-pressed as
db, T = max{d′b, T , 0}. (12)

1282 IEEE TRANSACTIONS ON INTELLIGENT TRANSPORTATION SYSTEMS, VOL. 14, NO. 3, SEPTEMBER 2013
Case 2—Arrival After the End of Green Time in T : If atransit vehicle b that belongs to lane group j arrives during cycleT after the last phase that can serve j (tb > τj, T ), the transitvehicle will be served during the next cycle T + 1. Define thisas time interval γ, i.e.,
γ = {tb > τj, T }. (13)
In this case, the transit delay consists of the delay experienceduntil the end of cycle T , denoted by d′′b, T , and an estimateof the delay that the transit vehicle will experience until it isserved during the next cycle, denoted by db, T+1. The delayexperienced until the end of cycle T , i.e., d′′b, T , is expressed as
d′′b, T = TC − tb (14)
and the estimate of the delay that such a transit vehiclewill experience during the next cycle T + 1, i.e., db, T+1, isexpressed as
db, T+1 = R(1)j (ginext) +
qjsj
(tb − τj, T ) (15)
where the user-specified phase green times for the next cycleginext are the same as those used in the auto delay estimation.
Therefore, the transit vehicle delay db, T for this case isexpressed as
db, T = d′′b, T + db, T+1
=TC +R(1)j (ginext) +
qjsj
(tb − τj, T )− tb. (16)
C. Mathematical Program Formulation
As described by the earlier equations, the mathematical pro-gram that minimizes the person delay for auto and transit usersat a signalized intersection for one cycle can be formulatedas a mixed-integer nonlinear program (MINLP). The integervariables are introduced due to the different delay formulasthat correspond to each of the three time intervals in which atransit vehicle could possibly arrive (α, β, γ). As a result, foreach transit vehicle b considered in the optimization, there arethree binary variables introduced, i.e., wα
b , wβb , and wγ
b , wherewf
b = 1 if tb ∈ f or wfb = 0 if otherwise, for f ∈ {α, β, γ}. A
summary of the formulation is shown in the following.Objective Function (person delay component for autos):
oa12
J∑j=1
qj1 − qj
sj
[(R
(2)j (gi,T−1) +R
(1)j (gi, T )
)2
+(R
(2)j (gi, T ) +R
(1)j (ginext)
)2]
(17)
Objective Function (person delay component for transit):
BT∑b=1
ob
[wα
b
((T − 1)C+R
(1)j (gi, T )+
qjsj
(tb − τj, T−1)− tb
)
+ wγb
(TC +R
(1)j (ginext) +
qjsj
(tb − τj, T )− tb
)](18)
Constraints:
(T − 1)C +R(1)j (gi, T )
+qjsj
(tb − τj, T−1)− tb ≥ − (1 − wαb )M1 ∀b (19)
(T − 1)C +R(1)j (gi, T )
+qjsj
(tb − τj, T−1)− tb ≤wαb M1 ∀b (20)
(1 − wγb ) tb ≤ τj, T ∀b (21)
(1 − wγb )M2 + wγ
b tb ≥ τj, T ∀b (22)
Gej(gi, T ) ≥
qjsj
C ∀j (23)
I∑i=1
gi, T +
I∑i=1
yi =C (24)
gi, T ≥ gimin ∀i (25)
gi, T ≤ gimax ∀i (26)
wαb + wβ
b + wγb = 1 ∀b (27)
wαb , w
βb , w
γb ∈{0, 1} ∀b (28)
where M1 and M2 are big numbers that can be set equal to Cand TC, respectively. The constraints are described as follows.
• Constraints (19)–(22) ensure that the correct delay formulawill be added to the objective function for each of the tran-sit vehicles present at the intersection during the designcycle T .
• Constraint (23) ensures undersaturated conditions for eachlane group.
• Constraint (24) ensures that the green times for each phase,which will be the outcome of the optimization, and thesum of the yellow times (i.e., lost time) add up to the cyclelength.
• Constraints (25) and (26) set the upper and lower boundsfor the continuous decision variables gi, T .
• Constraints (27) and (28) ensure that only one binaryvariable will be equal to one.
Note that the formulation of the given mathematical pro-gram leads to bilinearities (i.e., nonconvexity in the objectivefunction) due to the multiplication of the continuous variablesgi, T with the integer variables wα
b , wβb , and wγ
b . To avoid thisproblem, three new continuous variables gαi, b, gβi, b, and gγi, b areintroduced for each phase and for each of the transit vehicleswhose delays are included in the objective function [15]. Theinitial continuous decision variables gi, T are now defined as
gi, T = gαi, b + gβi, b + gγi, b ∀i, b (29)
where
gβi, b = gγi, b = 0 ∀i, b if tb ∈ α (30)
gαi, b = gγi, b = 0 ∀i, b if tb ∈ β (31)
gαi, b = gβi, b = 0 ∀i, b if tb ∈ γ. (32)

CHRISTOFA et al.: PERSON-BASED TRAFFIC RESPONSIVE SIGNAL CONTROL OPTIMIZATION 1283
Equation (29) is an extra constraint added to the initial math-ematical program. To avoid the bilinear terms, i.e., nonlinearterms that are nonconvex, in the transit person delay componentof the objective function, we use the substitution of (29) torewrite (18) as follows:
BT∑b=1
ob
⎡⎣wα
b
⎛⎝(T − 1)C +
kj−1∑i=1
yi +qjsj
(tb − τj, T−1)− tb
⎞⎠
+ wγb
⎛⎝TC +R
(1)j (ginext)− tb
+qjsj
⎛⎝tb − (T − 1)C −
lj−1∑i=1
yi
⎞⎠⎞⎠
+
kj−1∑i=1
gαi, b −qjsj
lj∑i=1
gγi, b
⎤⎦ (33)
and replace constraints (25) and (26) by
gfi, b ≥wfb gi min ∀i, b,∀f ∈ {α, β, γ} (34)
gfi, b ≤wfb gi max ∀i, b,∀f ∈ {α, β, γ}. (35)
III. INPUT REQUIREMENTS
The formulation and implementation of the proposed person-based traffic responsive signal control system is based on theavailability of real-time information about auto and transitvehicle arrivals and passenger occupancies. The required in-formation can be provided by surveillance and communicationtechnologies that are currently deployable in many urban net-works worldwide.
Traffic demand can be obtained in real time by inductive loopdetectors placed far enough upstream of the intersection so thatthe vehicle arrivals are measured under free-flow conditions.The detectors provide information on average arrival flows percycle that can be used to predict vehicle arrivals at the subjectapproach. When located at the downstream end of a link,detectors can also provide information on the turning ratiosof the different movements that are necessary to predict thedemands for the different lane groups.
Transit vehicle arrival times can be predicted using datafrom automated vehicle location (AVL) systems, commonlyemployed in transit fleets. AVL systems continuously trackthe location and speed of transit vehicles in real time. Suchinformation can be used as input to arrival prediction models,e.g., in [16], to obtain the arrival time of a transit vehicle at theintersection.
Real-time information about auto passenger occupancies iscurrently not available, and only historical data can provideestimates of average occupancy per auto. Given that suchestimates vary slightly from day to day for a specific time of
day, an average value should be sufficient. A typical rangeof values is 1.2 to 1.5 passengers/vehicle. Transit passengeroccupancies are expected to be more variable, and since theproposed signal control system depends highly on the numberof people on board to provide priority, real-time informationis highly desirable. Such information can be obtained with theuse of automated passenger counter systems that provide thenumber of passengers boarding and alighting at transit stopsand are currently used by many transit agencies.
IV. APPLICATION
The performance of the person-based traffic responsive sig-nal control system has been tested with data from the real-world intersection of Mesogion and Katechaki Avenues locatedin Athens, Greece. Two types of tests have been performed:1) deterministic arrival tests and 2) stochastic arrival tests.Deterministic arrival tests correspond to cases where perfectinformation is available for the auto and transit vehicle ar-rivals and passenger occupancies. Stochastic arrival tests havebeen performed through simulation under the assumption ofexponentially distributed auto arrivals. The simulation exper-iments have been performed with the microscopic simulationsoftware AIMSUN [17] using EILS. EILS consists of using anapplication programming interface that models traffic control,so that the signal control system is tested in an environmentthat emulates its operation in a real-world setting [18]. In anutshell, EILS has been used to test the performance of theproposed signal control optimization in more realistic trafficconditions, where vehicles do not arrive deterministically andwhere errors exist in the prediction of the auto and transitvehicle arrivals. The formulation of the mathematical programused for the optimization is still based on the assumption ofperfect information for the input. As a result, stochastic arrivaltests examine how well the system performs when estimatesor predictions are used as input to the optimization in thecase that perfect information is not available. The simulationhas the additional advantage of evaluating the system on thebasis of several performance measures that would be hard toassess analytically, such as average speed, number of stops, andemissions.
Both types of tests include evaluation of two different op-timization scenarios for 1 h of traffic operations: Scenario 1,when only vehicle delay is minimized (i.e., vehicle-basedoptimization where vehicle delays are not weighted by theirrespective passenger occupancies), and Scenario 2, when thetotal person delay for both transit and auto passengers is mini-mized (i.e., person-based optimization where vehicle delays areweighted by their respective passenger occupancies). In addi-tion, we have tested the performance of optimized fixed-timesignal settings obtained using TRANSYT-7F [19] (Scenario 0).For each scenario, a warm-up period equal to one cycle lengthis used. In addition, each scenario is evaluated ten times toaccount for the effect of variations in vehicle arrivals at theintersection. The resulting average values of the ten replicationsare presented. The site used to test the proposed system andits performance under both types of tests are presented in thefollowing.

1284 IEEE TRANSACTIONS ON INTELLIGENT TRANSPORTATION SYSTEMS, VOL. 14, NO. 3, SEPTEMBER 2013
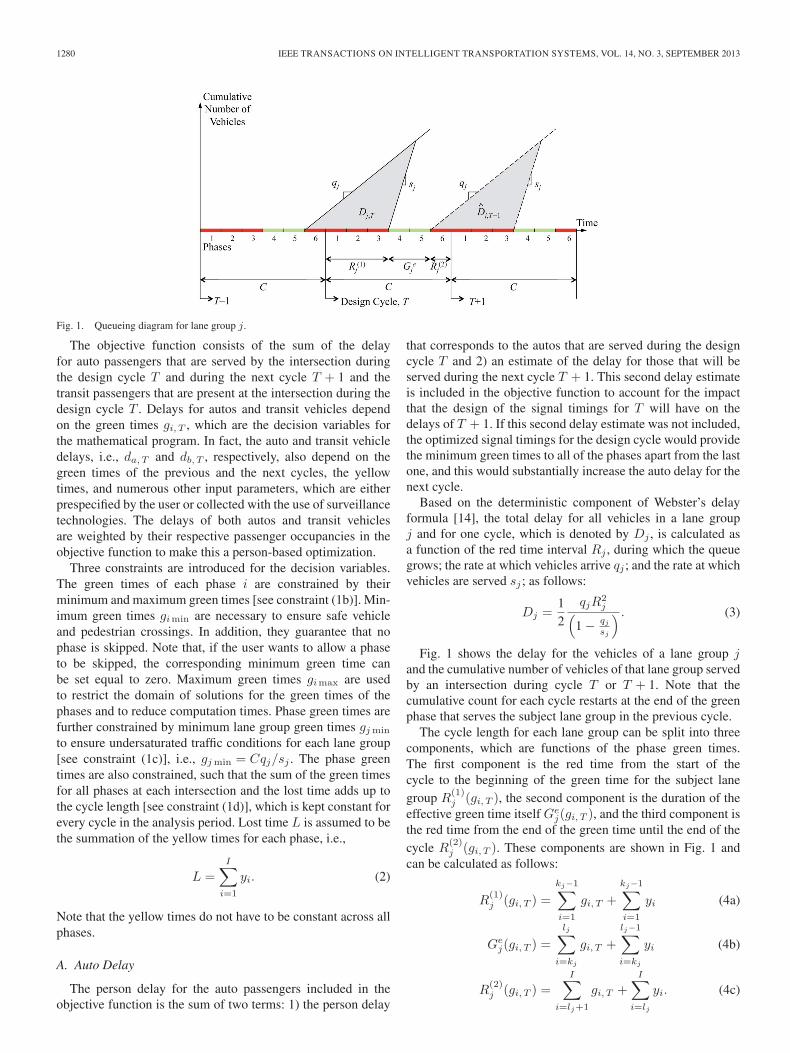
Fig. 2. Layout and bus routes for the intersection of Katechaki and Mesogion Avenues.
A. Test Site
The intersection of Katechaki and Mesogion Avenues is abusy intersection of two main signalized arterials located inAthens, Greece. This test intersection has been selected becauseof the high traffic volumes on all approaches, its complicatedphasing scheme, and the existence of multiple conflicting busroutes.
The intersection’s layout is shown in Fig. 2. As the figureshows, this is a complex intersection with through and turningtraffic in all directions (the main through movement is onKatechaki Avenue). Fig. 3 shows the lane groups (on the rightlabeled 1–8r), phasing, and green and yellow times for theintersection during the morning peak. The intersection signaloperates on a fixed six-phase cycle. Auto volume data areavailable at a rate of once per second from loop detectors placed40 m upstream of the intersection on each approach. Measuredtraffic volumes during the morning peak hour (7:00–8:00 A.M.)are used as a representative demand. These volumes correspondto an intersection flow ratio of Y = 0.9.2 For the signal’scurrent cycle length of C = 120 s and lost time of L = 14 s,this indicates nearly saturated traffic conditions.
Nine bus routes travel through the intersection in mixed-usetraffic lanes with headways that vary from 15 to 40 min for eachroute. This corresponds to 43 buses in the morning peak hour.
2Intersection flow ratio is defined as the sum of flow ratios (the ratio ofdemand to saturation flow) for each critical lane group per signal phase at theintersection [13].
The numbers next to the directional arrows in Fig. 2 indicatethe different bus routes. The bus routes run in four conflictingdirections with 70% traveling on the northeast–southwest ap-proaches (Mesogion Avenue) and the rest on the northwest–southeast approaches (Katechaki Avenue). Their bus stops arelocated nearside (i.e., upstream of the intersection). The busstop on the southwest approach is not shown in the figurebecause of its longer distance from the stop line, which alsodiminishes its impact on the traffic operations of the intersec-tion. However, the impact of all bus stops on the operation ofthe intersection is ignored. Information about the bus sched-ule is available at the Athens Urban Transport Organisation’swebsite [20].
B. Deterministic Arrival Tests
The first type of tests have been performed under the as-sumption that autos arrive deterministically at a constant rateusing data from the test site described earlier. For these tests,it is assumed that perfect information is available about thearrival rates of autos and the arrival times of buses at theintersection. The auto arrival rates are set as the average flowduring the morning peak hour for the intersection of Katechakiand Mesogion Avenues. In addition, the average auto occu-pancy oa is assumed to be 1.25 passengers/vehicle. Bus arrivaltimes at the intersection are simulated based on a shiftednormal distribution around their scheduled arrival times sinceno information is available about the real distribution of theirschedule deviation. For the buses, the passenger arrivals at

CHRISTOFA et al.: PERSON-BASED TRAFFIC RESPONSIVE SIGNAL CONTROL OPTIMIZATION 1285
Fig. 3. Lane groups, phasing, and green and yellow times for the intersection of Katechaki and Mesogion Avenues.
the bus stops are assumed to be deterministic and constantbecause headways are short enough that people do not rely on apublished schedule. As a result, the bus occupancy is a functionof the time between the actual arrivals at the intersection of twoconsecutive buses of the same route. This means that the busesare assumed to operate as if they arrive empty at the bus stopjust upstream of the intersection under consideration; therefore,a larger headway would lead to a higher number of passengerson board. The passenger occupancy of a bus b when arriving atthe intersection is
ob = pm(tb,m − tb−1,m) (36)
where pm is the passenger demand rate for bus route m, andtb,m is the actual time that bus b belonging to route m arrives atthe back of its queue at the intersection under consideration.Despite the fact that the schedule delay of the buses is notdirectly considered, it is implicitly taken into account in theoptimization process through the higher passenger occupancyexpected of late buses. For the initial testing of the signal con-trol system, an average bus occupancy of ob = 40 passengers/vehicle is assumed.
The user-specified ginext that are used as the phase greentimes for the next cycle are set to be the same as the fixedoptimal signal timings provided by TRANSYT-7F for the spe-cific traffic conditions. In addition, the upper bounds for thegreen times of the phases gi max are set equal to C −
∑Ii=1 yi.
Nonzero lower bounds for the phase green times gi min arealso introduced to ensure that all phases are allocated someminimum green time. A total minimum green time of 7 s isassigned to each of the left-turn phases and 10 s to each of thethrough phases.
The MINLP, which is described in Section II-C, has aquadratic objective function and linear constraints. As long asthe objective function remains convex, the global optimum canbe easily found using the branch-and-bound method utilizedfor solving mixed-integer linear programs. Indeed, the Hessianmatrix of the objective function is positive definite for alltested scenarios; therefore, the objective function is convex.The MINLP is solved in MATLAB [21] using the branch-and-
TABLE IPERSON DELAYS FOR Y = 0.90 AND ob/oa = 40/1.25
(DETERMINISTIC ARRIVAL TESTS)
bound method through a recursive function programmed bythe authors. The MATLAB fmincon function is used to solveeach subsequent nonlinear mathematical program. The absoluteoptimality tolerance is set to 10−6, and the computation timefor the optimization of signal timings for one cycle is between5 and 10 s for the tests performed.3
Table I shows the person delays for autos, buses, andthe total number of users obtained by the three scenariostested for an intersection flow ratio of Y = 0.90. A com-parison of the person-based optimization with the vehicle-based one indicates that the former can achieve a reductionof 5% in the total person delay at the intersection by re-ducing the delay of bus users by 26% and increasing autouser delay by 2%. This translates into a reduction in averagebus delay of 9 s and an increase in average auto delay ofonly 1 s. Comparing the delays obtained from the vehicle-based optimization with those delays from implementingthe optimized fixed timings obtained from TRANSYT-7F, oneobserves that the vehicle-based optimal signal timings resultin lower auto, bus, and overall passenger delays. As a result,evaluation of the person-based traffic responsive signal controlsystem is performed by comparing the person delays from theperson-based optimization with those from the vehicle-basedoptimization because the latter provides the lowest delays thatcan be achieved for autos.
3All tests, both for deterministic and stochastic arrivals, were performed onan Intel Core i5 2.4-GHz processor with memory of 4 GB.

1286 IEEE TRANSACTIONS ON INTELLIGENT TRANSPORTATION SYSTEMS, VOL. 14, NO. 3, SEPTEMBER 2013
Fig. 4. Percent change in person delay for different intersection flow ratiosand ob/oa = 40/1.25 (deterministic arrival tests).
The performance of the system has been tested for differentintersection flow ratios that vary from 0.4 to 0.9 for averageoccupancies of 40 passengers per bus and 1.25 passengers perauto. The results, which are shown in Fig. 4, indicate consistentpatterns in the person delay changes for all intersection flowratios that have been tested. The higher the intersection flowratio, the lower the benefit for bus users and for all userstraveling through the intersection, and as a result, the lowerthe increase in auto user delay. This is expected due to thefact that higher intersection flow ratios imply higher auto trafficdemand and, consequently, lower flexibility to change the signaltimings while maintaining undersaturated conditions. For veryhigh intersection flow ratios, the vehicle-based optimizationand person-based optimization converge to the same optimalsignal timings and the same person delays since the highauto flow outweighs the higher occupancies of the buses. Thefigure also shows the 95% confidence intervals of the percentchanges for person delays of autos, buses, and all travelers atthe intersection. The plotted confidence intervals indicate thatthese percent changes are significantly different than zero.
Tests have also been performed for different average bus toauto passenger occupancy ratios to investigate how changesin bus ridership affect the provision of priority. The averageauto occupancy is kept constant for all tests and equal to1.25 passengers/vehicle. Fig. 5 shows the results obtained bycomparing the person delays from the person-based optimiza-tion with those from the vehicle-based optimization for anintersection flow ratio of Y = 0.5. The figure indicates that,for very low average occupancy ratios, the collective benefitsto all passengers diminish along with the benefits to the buspassengers. The converse is also true; the higher the passengeroccupancy of buses, the higher the savings for their passengersand the higher the delays for auto users compared with theperson delays from vehicle-based optimization. This outcomeis expected since a higher bus passenger occupancy leads to alarger weight for the bus delays, and given that the intersec-tion is undersaturated and there is spare time, more priorityis provided to serve the buses. However, for high averagebus to auto passenger occupancy ratios, the system eventuallyconverges toward one set of signal timings and the benefit to buspassengers levels off once the system has reached the maximum
Fig. 5. Percent change in person delay for different average bus to autopassenger occupancy ratios and Y = 0.5 (deterministic arrival tests).
amount of transit priority that it can provide for the specifictraffic conditions.
Similar patterns as those observed in Fig. 5 are obtainedfor all intersection flow ratios tested. However, tests for otherintersection flow ratios have shown that the benefits level offat different occupancy ratios. The higher the intersection flowratio, the lower the spare capacity at the intersection and thelower the occupancy ratio at which benefits for transit userslevel off.
Tests performed for another real-world intersection of SanPablo and University Avenues in Berkeley, CA, USA, show asimilar behavior. The percent changes for different intersectionflow ratios are different between the two test sites because theydepend on multiple factors such as the intersection’s layout, thephase sequence, and the frequency of the buses.
C. Stochastic Arrival Tests
Stochastic arrival tests have been performed under the as-sumption that auto interarrival times follow an exponentialdistribution. To predict the auto demand for each cycle usingthe same method that would be required in reality, detectors arelocated approximately 100 m upstream from the intersectionon each approach. Detectors are also located at the exits ofeach of the approaches to measure the exit flow for each lanegroup and cycle. To predict the demand of the respective lanegroup for the design cycle, exponential smoothing is used onthe measured flows of both sets of detectors during the previouscycle. The predicted arrival rate qj, T is a weighted averageof the prediction qj, T−1 and the observed value qj, T−1 of theprevious cycle and is given by
qj, T = eqj, T−1 + (1 − e)qj, T−1 (37)
where e is a factor between 0 and 1 that determines how muchweight is placed on the most recent observation. A value ofe = 0.2 has been used in the performed tests. The maximum ofthe two smoothed flows from the two sets of detectors is usedas an input for the optimization of the next cycle to account forcases that signal timings in the previous cycle are not able toserve all of the incoming demand.

CHRISTOFA et al.: PERSON-BASED TRAFFIC RESPONSIVE SIGNAL CONTROL OPTIMIZATION 1287
Fig. 6. Percent change in person delay for different intersection flow ratiosand ob/oa = 40/1.25 (stochastic arrival tests).
The timetable of the bus arrivals at the entry links of thenetwork is fixed and based on the same headways as in thedeterministic arrival tests. To predict the arrival time of busesat the intersection for the traffic signal optimization, detectorsare placed upstream on entry links at distances equivalent toa travel time of one cycle length from the intersection. Thebus arrivals at the approaches are predicted using an averagenominal speed of 45 km/h. The average passenger occupancyfor the autos is assumed to be 1.25 passengers/vehicle, whereaseach transit vehicle is assigned a random number of passengerswith an average value of 40 passengers/vehicle.
The green times for the next cycle ginext and the upper andlower bounds gi max and gi min, respectively, are defined asin the deterministic arrival tests. Ten replications have beenperformed for each of the intersection flow ratios tested before(Y = {0.4, 0.5, . . . , 0.9}), which allow for variation in the autoand bus arrivals at the intersection. As in the deterministicarrival tests, the Hessian matrix of the objective function ispositive definite for all tested cases; therefore, the problem canbe solved using the branch-and-bound method, as describedearlier. The computation time for the optimization of signaltimings for one cycle remains between 5 and 10 s, which ispromising for real-time implementations. The optimization isrun once per cycle during the first phase of the cycle. If thatfirst phase is chosen to be one with a minimum green time thatis greater than the computation time, then the proposed signalcontrol system can be implemented in real time.
The results from the simulation tests are shown in Fig. 6.A comparison of the results from the simulation with thosefrom the deterministic arrival tests indicates that, for the sameintersection flow ratio, the percent benefit achieved in per-son delay for the whole intersection is on the same order ofmagnitude. The same holds for the percent increase of autopassenger delay. Since no delay at bus stops is considered inthe simulation tests, the differences between the results of thedeterministic and stochastic arrival tests can be attributed onlyto the variations in the prediction of auto and bus arrivals, whichare not accounted for in the first type of tests. This results ina reduction in the benefit that is achieved for bus users and alltravelers at the intersection, compared with the test for the sametraffic demand with perfect information (deterministic arrivals).
For example, for an intersection flow ratio of Y = 0.6, a 31%reduction in person delay for transit users is observed, butthe reduction assuming perfect information is 46%. Since theoptimization relies on predictions of arrival rates for autos andarrival times for transit vehicles that contain errors, it cannotprovide the optimal phase duration as it would with perfectinformation.
When the intersection flow ratio is Y = 0.9, the person-basedoptimization does not reduce the total person delay and the buspassenger delay for all replications compared with the vehicle-based optimization. In addition, the person-based optimizationreduces auto passenger delay on average compared with thevehicle-based optimization. These inconsistencies are causedby errors in vehicle arrival predictions, which can lead to signaltimings that cause oversaturated traffic conditions for certainintersection approaches. This results in less accurate predictionsof auto arrival rates and bus arrival times for the subsequentcycle, which further impede the operation of the signal controlsystem. Furthermore, the proposed system is used to optimizeone cycle at a time (accounting for the impact on the next cy-cle), which does not guarantee global optimality for the wholehour. Since the optimal signal timings may differ between thetwo optimization scenarios even for the first cycle, the inputsfor the second cycle are not necessarily the same and maydiffer substantially for all subsequent cycles. Therefore, the twooptimization cases are not always equivalent for comparison.
Simulation tests also allow for evaluation of the systemwith several additional performance measures that are directlyprovided from the simulation software output, such as thoseshown in Table II. The results shown in the table for an inter-section flow ratio of Y = 0.6 indicate that there is a decreasein the number of stops for buses of 14% and an increase inthe average speed for buses of 8.5% when using person-basedoptimization compared with the vehicle-based optimization. Atthe same time, the number of stops for autos increases by 2%,which leads to a slight increase in CO emissions of 0.1%.However, the signal timings from person-based optimizationlead to a substantial reduction in the CO emitted by busesof 7%. Overall, the higher the auto traffic demand, the lowerthe benefit achieved with the proposed system in terms ofimproving bus speeds and reducing stops per bus.
V. CONCLUSION
A person-based traffic responsive signal control system withTSP has been developed and tested at an isolated intersection.The optimization method explicitly accounts for the passengeroccupancy of autos and transit vehicles to assign priority inan efficient way, even when transit vehicles travel in conflict-ing directions. The proposed traffic responsive signal controlsystem is generic and offers flexibility to weigh the relativemerit of the passenger and vehicle delays since it allows fordifferent tradeoffs between auto and transit delays by adjustingthe passenger weights in the objective function.
The results from testing the proposed system on a real-worldintersection show that it can reduce the overall person delay andtransit passenger delay, and it can effectively provide priority totransit vehicles while increasing the auto passenger delay by

1288 IEEE TRANSACTIONS ON INTELLIGENT TRANSPORTATION SYSTEMS, VOL. 14, NO. 3, SEPTEMBER 2013
TABLE IIPERFORMANCE MEASURES FOR DIFFERENT INTERSECTION FLOW RATIOS AND ob/oa = 40/1.25 (STOCHASTIC ARRIVAL TESTS)
only a small amount. The optimization is shown to be effectivein reducing total person delay at the isolated intersection fora wide range of auto traffic demands and transit passengeroccupancies. The deterministic arrival tests show that an in-crease in the auto traffic demand lowers the benefits for boththe total and the transit passengers and reduces the negativeimpact on auto users. For very high auto traffic demand, person-based optimization and vehicle-based optimization convergeto the same outcome. Sensitivity analysis with respect to thetransit passenger occupancy shows that, in general, the higherthe passenger occupancy of a transit vehicle, the higher thepriority provided to it, and the higher the benefit for transitusers. However, there is a limit to the amount of priority thatcan be provided to transit vehicles that depends on the trafficconditions at the intersection and the operating characteristicsof the transit system.
Comparison of the performance of the system through sim-ulation with the tests performed under the assumption of per-fect information shows that it improves transit operations andreduces total passenger delay even without incorporating theprediction errors in auto demand and transit vehicle arrivaltimes in the formulation of the mathematical model. Althoughthe benefit to transit users is lower due to errors in the predic-tions, the system still achieves significant delay reductions for arange of auto traffic demands. Accounting for the uncertaintyof arrivals in the delay calculation and developing improvedprediction algorithms for vehicle arrivals can reduce errors inthe system and lead to improved performance.
The proposed person-based traffic responsive signal controlsystem is particularly beneficial for major signalized intersec-tions where multiple transit lines with small headways run inconflicting directions. This is a common phenomenon at transittransfer locations, such as subway stations, that are served bymany buses. The results are promising for improving transitreliability of urban networks. Ongoing and future work includesimproving the robustness of the system by accounting forinput inaccuracy in the mathematical program and developing
improved prediction algorithms. In addition, we plan to includepedestrian delays in the objective function and extend thesystem to signalized arterials and grid networks by taking intoconsideration that autos will be arriving in platoons, whose sizeand arrival times depend on the signal settings of upstreamintersections. Heuristic algorithms will also be developed, ifneeded, to ensure computation times that are sufficiently smallfor real-world implementations. This is part of a major effortto develop TSP strategies to improve transit operations and theperson capacity of arterials and grid networks for a wide rangeof operating conditions.
REFERENCES
[1] Q. He, K. Head, and J. Ding, “PAMSCOD: Platoon-based arterial multi-modal signal control with online data,” Transp. Res. Part C, Emerg.Technol., vol. 20, no. 1, pp. 164–184, Feb. 2012.
[2] J. Henry and J. Farges, “P.T. priority and prodyn,” in Proc. 1st WorldCongr. Appl. Transp. Telematics Intell. Veh.-Highway Syst., 1994, vol. 6,pp. 3086–3093.
[3] V. Mauro and C. Di Taranto, “UTOPIA,” in Proc. 6th IFAC-IFIP-IFORSSymp. Control, Comput. Commun. Transp., 1989, pp. 245–252.
[4] P. Cornwell, J. Luk, and B. Negus, “Tram priority in SCATS,” Traffic Eng.Control, vol. 27, no. 11, pp. 561–565, Nov. 1986.
[5] C. Diakaki, V. Dinopoulou, K. Aboudolas, M. Papageorgiou,E. Ben-Shabat, E. Seider, and A. Leibov, “Extensions and newapplications of the traffic-responsive urban control strategy: Coordinatedsignal control for urban networks,” Transp. Res. Rec., J. Transp. Res.Board, vol. 1856, pp. 202–211, 2003.
[6] Y. Li, P. Koonce, M. Li, K. Zhou, Y. Li, S. Beaird, W. Zhang, L. Hegen,K. Hu, A. Skabardonis, and Z. Sonja Sun, “Transit signal priority researchtools,” Calif. Partners Advanced Transit Highways, Univ. Calif., Berkeley,CA, USA, PATH Res. Rep. UCB-ITS-PRR-2008-4, 2008.
[7] M. Li, “Toward deployment of adaptive transit signal priority systems,”Calif. Partners Adv. Transit Highways, Univ. Calif., Berkeley, CA, USA,PATH Res. Rep. UCB-ITS-PRR-2008-24, 2008.
[8] P. Hunt, R. Bretherton, D. Robertson, and M. Royal, “SCOOT on-linetraffic signal optimisation technique,” Traffic Eng. Control, vol. 23, no. 4,pp. 190–192, Apr. 1982.
[9] D. Bretherton, G. Bowen, and K. Wood, “Effective urban traffic manage-ment and control: SCOOT Version 4.4,” in Proc. Eur. Transp. Conf., 2002,pp. 1–14.
[10] M. Conrad, F. Dion, and S. Yagar, “Real-time traffic signal optimizationwith transit priority: Recent advances in the signal priority procedure

CHRISTOFA et al.: PERSON-BASED TRAFFIC RESPONSIVE SIGNAL CONTROL OPTIMIZATION 1289
for optimization in real-time model,” Transp. Res. Rec., J. Transp. Res.Board, vol. 1634, pp. 100–109, 1998.
[11] E. Christofa and A. Skabardonis, “Traffic signal optimization with con-ditional transit signal priority for conflicting transit routes,” in Proc. 12thWorld Conf. Transp. Res., Lisbon, Portugal, Jul. 2010, pp. 1–16.
[12] E. Christofa and A. Skabardonis, “Traffic signal optimization with appli-cation of transit signal priority to an isolated intersection,” Transp. Res.Rec., J. Transp. Res. Board, vol. 2259, pp. 192–201, 2011.
[13] Highway Capacity Manual 2000, Transp. Res. Board Special Rep. 209.[14] F. Webster, “Traffic signal settings,” Road Res. Lab., Ministry Transport,
HMSO, London, U.K., Road Res. Tech. Paper 39, 1958.[15] C. Floudas, Nonlinear and Mixed-Integer Optimization: Fundamentals
and Applications. New York, NY, USA: Oxford Univ. Press, 1995.[16] C. Tan, S. Park, H. Liu, Q. Xu, and P. Lau, “Prediction of transit vehicle
arrival time for signal priority control: Algorithm and performance,” IEEETrans. Intell. Transp. Syst., vol. 9, no. 4, pp. 688–696, Dec. 2008.
[17] Aimsun Users Manual v6.1, Transport Simulation Syst., Barcelona, Spain,2010.
[18] A. Stevanovic and P. Martin, “Integration of SCOOT and SCATS inVISSIM Environment,” presented at the PTV Users Group Meeting, ParkCity, UT, USA, May 2007.
[19] TRANSYT-7F User’s Manual, McTrans, Univ. Florida, Gainesville, FL,USA, 2003.
[20] OASA, Search Route. Athens Urban Transport Org., 2010. [Online].Available: www.oasa.gr
[21] Matlab User’s Manual, The MathWorks, Natick, MA, USA, 2009.
Eleni Christofa was born in Mytilene, Greece, in1984. She received the Diploma in civil engineeringfrom the National Technical University of Athens,Athens, Greece, and the M.Sc. and Ph.D. degreesin civil and environmental engineering from theUniversity of California, Berkeley, CA, USA.
She is currently an Assistant Professor with theDepartment of Civil and Environmental Engineering,University of Massachusetts, Amherst, MA, USA.She is the author and coauthor of multiple tech-nical papers in scientific journals and conference
proceedings. Her research interests include intelligent transportation systems,traffic operations and control, public transportation, and incident detection andmanagement.
Dr. Christofa received the Eugenidi Foundation scholarship for postgraduatestudies (2007–2008), the Gordon F. Newell Memorial Fellowship (2007–2008),and the Dwight David Eisenhower Transportation Fellowship (2009–2011).
Ioannis Papamichail was born in Toronto, ON,Canada, in 1976. He received the Dipl.-Eng. (honors)degree in chemical engineering from the Na-tional Technical University of Athens, Athens,Greece, in 1998 and the M.Sc. degree in pro-cess systems engineering (with distinction) and thePh.D. degree in chemical engineering from ImperialCollege London, London, U.K., in 1999 and 2002,respectively.
From 1999 to 2002, he was a Research and Teach-ing Assistant with the Center for Process Systems
Engineering, Imperial College London. From 2003 to 2004, he served hismilitary service in Greece as a Chemical Engineer. Since 2009, he has beenan Assistant Professor with the Department of Production Engineering andManagement, Technical University of Crete, Chania, Greece, where he was anAdjunct Lecturer from 2004 to 2005 and a Lecturer from 2005 to 2009. He isthe author and coauthor of several technical papers in scientific journals andconference proceedings. His research interests include automatic control andoptimization theory and its applications to traffic and transportation systems.
Dr. Papamichail received the Eugenidi Foundation scholarship for postgrad-uate studies (1998–1999) and the Transition to Practice Award from the IEEEControl Systems Society in 2010.
Alexander Skabardonis was born in Athens,Greece, in 1954. He received the Diploma in civilengineering from the National Technical Universityof Athens, Athens, Greece, and the M.Sc. and Ph.D.degrees in transportation engineering from the Uni-versity of Southampton, Southampton, U.K.
He is currently a Professor with the Universityof California, Berkeley, CA, USA, and a formerDirector with Partners for Advanced Transporta-tion Technology (PATH), Institute of TransportationStudies, University of California, Berkeley. He is an
internationally recognized expert in traffic flow theory and models, traffic man-agement and control systems, design, operation and analysis of transportationfacilities, intelligent transportation systems, energy, and environmental impactsof transportation. He is the author of over 275 papers and technical reports.He has worked extensively in the development and application of models andtechniques for traffic control, performance analysis of highway facilities, andapplications of advanced technologies to transportation.
Dr. Skabardonis is a Member of the Traffic Flow Theory, Freeway Op-erations, Highway Capacity, and Traffic Signal Systems Committees of theTransportation Research Board. He serves as a member of the editorial boardfor the Intelligent Transportation Systems Journal and as a Reviewer for severalarchival journals in transportation.