Embed Size (px)
Citation preview

Presented at: Power-Gen Natural Gas conference, Columbus, OH 8/24/2016
1 of 18
Maximizing Gas Turbine and Combined Cycle Capacities and Ratings
By:
W. Cary Campbell, P.E. Senior Consulting Engineer True North Consulting, LLC [email protected]
In order to achieve maximum plant output and receive credit for actual maximum dependable capability, the designers, owners, and operators of a gas turbine or combined cycle power plant must properly consider all environmental, permitting, and operational limitations of their equipment. During initial commissioning and routine performance testing of numerous simple cycle and combined cycle gas turbine power plants over the past 25 years, the author has encountered several design, analytical and operational problems which limited the output and demonstrated capacity of these units. This paper describes many of these problems and methods used to resolve them.
Design Opportunities The design capability of a unit is a function of:
The equipment utilized Expected load profile Site elevation Prevailing wind direction Ambient temperature and humidity Barometric pressure Cooling water source Fuel properties Air permit requirements.
The actual demonstrated plant capability may not live up to design expectations due to initial deficiencies in equipment capabilities, degradation, instrumentation problems, control issues, inefficient operation, or improper corrections for test conditions. All of these issues may affect the results during a capacity demonstration test that may be used to verify that it meets the requirements of a power purchase agreement or to determine the value of an annual capacity payment. During the design phase of a new plant or retrofit, opportunities, justifications and benefits for producing maximum output should be considered. These may include the following power augmentation capabilities:
Gas turbine inlet air cooling Steam or water injection into gas turbines
Presented at: Power-Gen Natural Gas conference, Columbus, OH 8/24/2016
2 of 18
Elevated gas turbine firing temperatures HRSG duct burner heat input Elevated steam turbine throttle pressures Minimal auxiliary power requirements
The need and benefit of these features depends on the required flexibility and expected load profile of the unit. Many combined cycle units were designed when natural gas prices where projected to be in the $2.50 to $4 per MMBtu range and coal units were still the dominant source of power generation. Combined cycle units were expected to operate near base load much of their life and many of these power augmentation features may not have been economically justified. Steam turbines were sized to operate at throttle pressures near full flow capacity where they are most efficient. Later plants were designed during times of higher more volatile natural gas prices. These plants may have included larger steam turbines which operated at lower pressure at base load but had the capability to accept as much as 40% more steam during duct fired HRSG operation. With the recent decreases in natural gas prices to as low as $1.57 per MMBtu (March 2016), increases in production costs using coal and the increasing contributions of renewable energy sources, gas turbines and combined cycle units now require the ability to operate more quickly and efficiently over a wide range of loads. The inclusion or addition of some of the power augmentation capabilities listed above in a unit’s design can provide cost effective methods for boosting and varying unit output when needed.
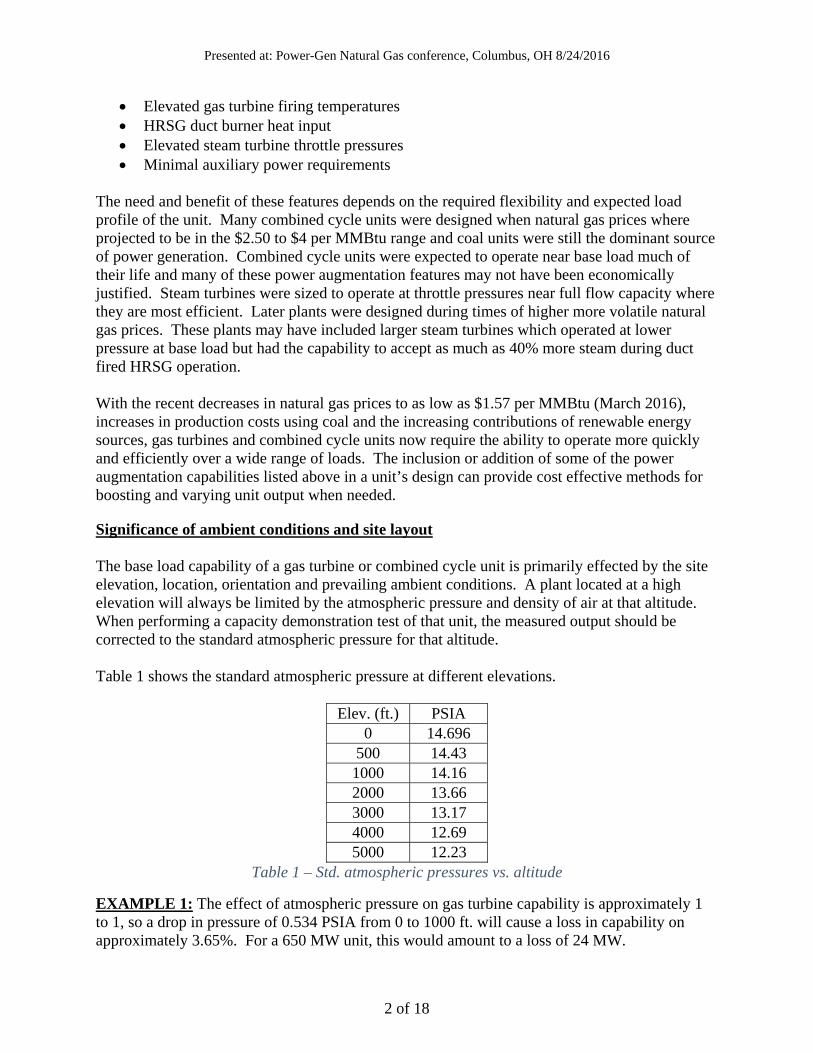
Significance of ambient conditions and site layout The base load capability of a gas turbine or combined cycle unit is primarily effected by the site elevation, location, orientation and prevailing ambient conditions. A plant located at a high elevation will always be limited by the atmospheric pressure and density of air at that altitude. When performing a capacity demonstration test of that unit, the measured output should be corrected to the standard atmospheric pressure for that altitude. Table 1 shows the standard atmospheric pressure at different elevations.
Elev. (ft.) PSIA 0 14.696
500 14.43 1000 14.16 2000 13.66 3000 13.17 4000 12.69 5000 12.23
Table 1 – Std. atmospheric pressures vs. altitude
EXAMPLE 1: The effect of atmospheric pressure on gas turbine capability is approximately 1 to 1, so a drop in pressure of 0.534 PSIA from 0 to 1000 ft. will cause a loss in capability on approximately 3.65%. For a 650 MW unit, this would amount to a loss of 24 MW.
Presented at: Power-Gen Natural Gas conference, Columbus, OH 8/24/2016
3 of 18
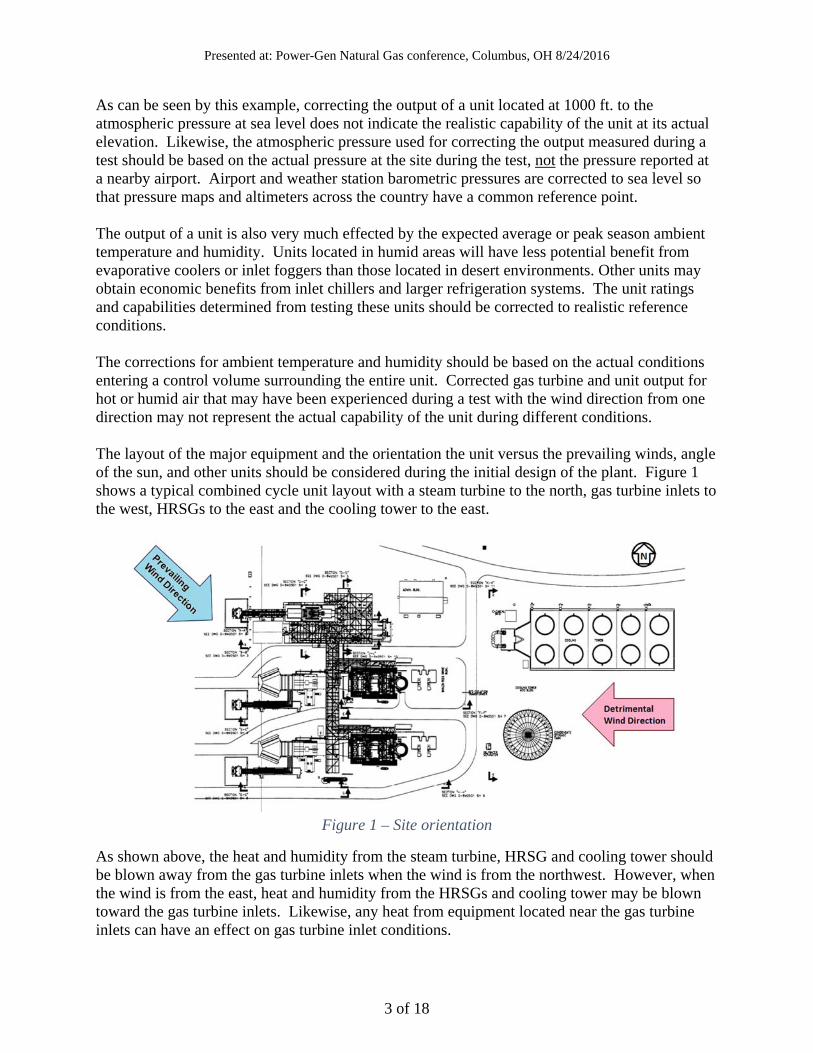
As can be seen by this example, correcting the output of a unit located at 1000 ft. to the atmospheric pressure at sea level does not indicate the realistic capability of the unit at its actual elevation. Likewise, the atmospheric pressure used for correcting the output measured during a test should be based on the actual pressure at the site during the test, not the pressure reported at a nearby airport. Airport and weather station barometric pressures are corrected to sea level so that pressure maps and altimeters across the country have a common reference point. The output of a unit is also very much effected by the expected average or peak season ambient temperature and humidity. Units located in humid areas will have less potential benefit from evaporative coolers or inlet foggers than those located in desert environments. Other units may obtain economic benefits from inlet chillers and larger refrigeration systems. The unit ratings and capabilities determined from testing these units should be corrected to realistic reference conditions. The corrections for ambient temperature and humidity should be based on the actual conditions entering a control volume surrounding the entire unit. Corrected gas turbine and unit output for hot or humid air that may have been experienced during a test with the wind direction from one direction may not represent the actual capability of the unit during different conditions. The layout of the major equipment and the orientation the unit versus the prevailing winds, angle of the sun, and other units should be considered during the initial design of the plant. Figure 1 shows a typical combined cycle unit layout with a steam turbine to the north, gas turbine inlets to the west, HRSGs to the east and the cooling tower to the east.
Figure 1 – Site orientation
As shown above, the heat and humidity from the steam turbine, HRSG and cooling tower should be blown away from the gas turbine inlets when the wind is from the northwest. However, when the wind is from the east, heat and humidity from the HRSGs and cooling tower may be blown toward the gas turbine inlets. Likewise, any heat from equipment located near the gas turbine inlets can have an effect on gas turbine inlet conditions.
Presented at: Power-Gen Natural Gas conference, Columbus, OH 8/24/2016
4 of 18
Examples of heat and humidity sources include:
Generators Generator coolers Lube oil coolers Transformers Exciters Auxiliary equipment Control compartment air conditioners Even radiant heat from asphalt pavement
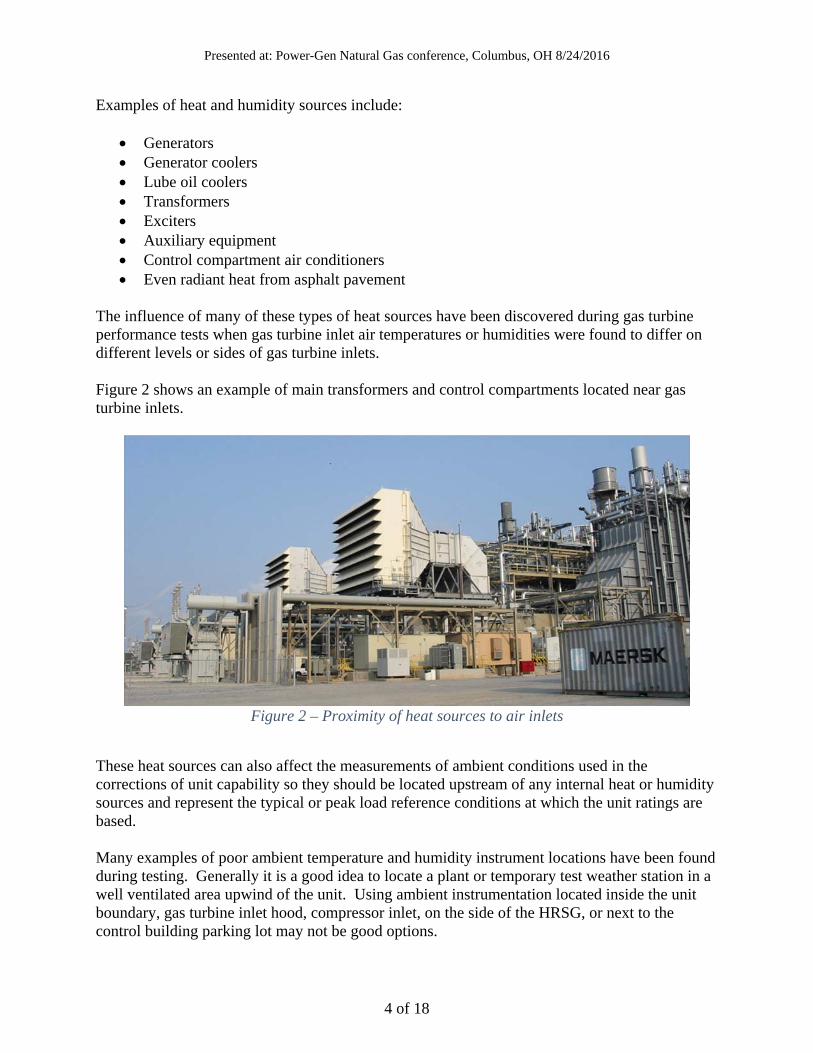
The influence of many of these types of heat sources have been discovered during gas turbine performance tests when gas turbine inlet air temperatures or humidities were found to differ on different levels or sides of gas turbine inlets. Figure 2 shows an example of main transformers and control compartments located near gas turbine inlets.
Figure 2 – Proximity of heat sources to air inlets
These heat sources can also affect the measurements of ambient conditions used in the corrections of unit capability so they should be located upstream of any internal heat or humidity sources and represent the typical or peak load reference conditions at which the unit ratings are based. Many examples of poor ambient temperature and humidity instrument locations have been found during testing. Generally it is a good idea to locate a plant or temporary test weather station in a well ventilated area upwind of the unit. Using ambient instrumentation located inside the unit boundary, gas turbine inlet hood, compressor inlet, on the side of the HRSG, or next to the control building parking lot may not be good options.
Presented at: Power-Gen Natural Gas conference, Columbus, OH 8/24/2016
5 of 18
EXAMPLE 2: Corrected unit output for a unit was inconsistent and seemed to get more erratic during hot weather. After investigation, the station instrument being used for ambient temperature corrections was found to be located on a handrail above an MCC building air conditioning unit. Whenever the air conditioner turned on, the apparent ambient temperature would go up, as would the corrected unit output. A dedicated station weather station was procured and located upwind of the unit.
Test Conditions Since a capacity demonstration test can seldom be run exactly at the reference conditions, corrections are applied for the deviation of the most significant ambient and operating conditions from the reference conditions. These tests are usually based on the ASME performance test codes but may be simplified to correct only for parameters which have the most significant impact on a particular unit’s performance and repeatability. For example, if the unit typically runs near a power factor of 1.0, or a very consistent power factor, it may not be necessary to correct the test output to a design 0.85 power factor. What is most important is that the output demonstrated and reported is what can realistically be expected when called upon by the power purchaser or system dispatcher. Unit controls should be set to routine setpoints and remain in automatic. No exceptionally high setpoints or unique operating conditions should be selected during the test. The cleanliness of the gas turbine compressors should also be in a typical condition for the test. If the compressor is regularly cleaned or if it is cleaned prior to peak season, then the test may be run soon after a water wash. However, if the unit is continuously on-line and water washes are not performed routinely, the test should not be performed immediately after an off-line water wash unless some type of expected degradation debit is applied. No special operation conditions, cycle isolation, system alignments, or station service requirements should exist during the test, unless there is a temporary problem with the plant which can and will be fixed before the unit’s expected dispatch period. For example, if there is a chronic problem with a leaking cycle isolation valve, that valve should not be manually isolated during the test since it will most likely be leaking when the unit is called upon. However, if a valve has a temporary problem during the test and it is agreed that it will be repaired before peak season, then a credit may be applied for its estimated performance loss. EXAMPLE 3: Plant outdoor lighting was turned off during a capacity test to temporarily reduce station service loads. This is not allowed since lights are necessary to safely perform normal operation and maintenance activities. Some examples of other abnormal operating conditions that may be corrected via calculation after a test with mutual agreement:
Accidentally leaving a spare feedpump running Temporarily high blowdown flows Cooling tower fans out of service for routine maintenance (if the effect is quantifiable) Known watt meter errors
Presented at: Power-Gen Natural Gas conference, Columbus, OH 8/24/2016
6 of 18
Test experience and case studies Even though the tested performance of the individual pieces of major equipment may have met their guarantees (when corrected to their particular guaranteed conditions), the net output of the entire unit may be less than expected. What the HRSG or steam turbine can produce at its reference conditions is different from what it can produce at the actual gas turbine and HRSG outlet conditions. Gas Turbine Problems: Many of the causes of low unit output have be traced to problems with gas turbine performance. Some of the problems found with gas turbines during routine performance and capacity tests include:
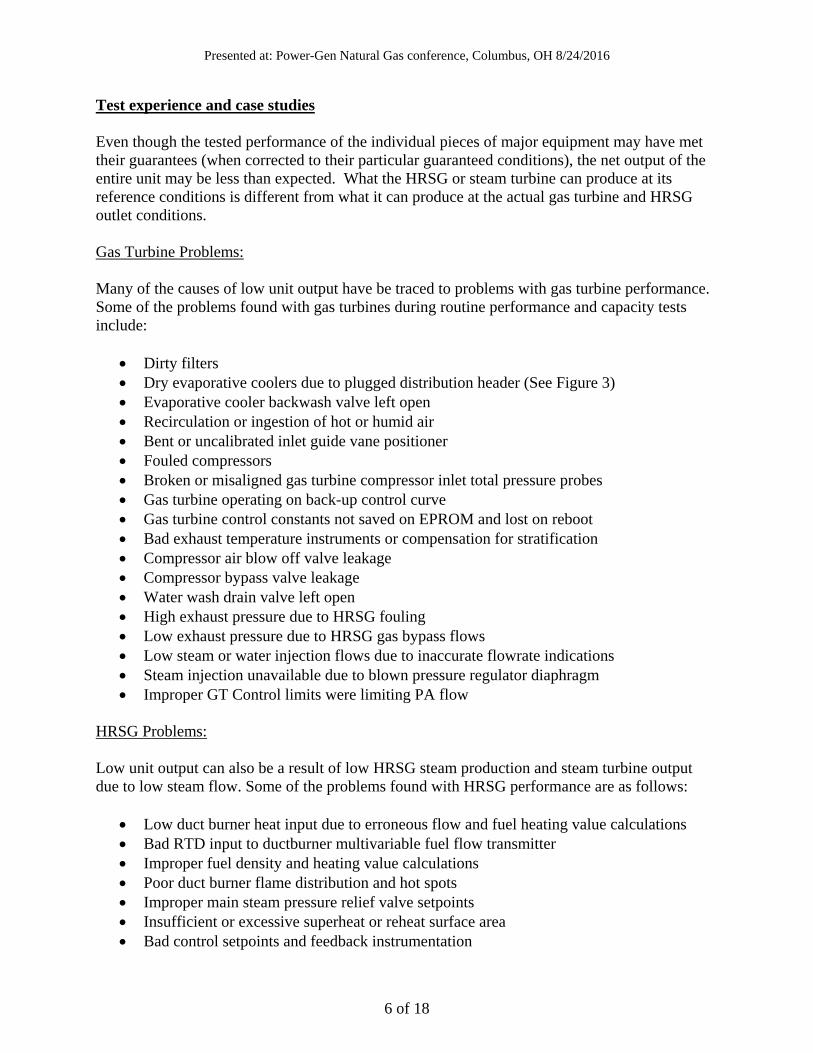
Dirty filters Dry evaporative coolers due to plugged distribution header (See Figure 3) Evaporative cooler backwash valve left open Recirculation or ingestion of hot or humid air Bent or uncalibrated inlet guide vane positioner Fouled compressors Broken or misaligned gas turbine compressor inlet total pressure probes Gas turbine operating on back-up control curve Gas turbine control constants not saved on EPROM and lost on reboot Bad exhaust temperature instruments or compensation for stratification Compressor air blow off valve leakage Compressor bypass valve leakage Water wash drain valve left open High exhaust pressure due to HRSG fouling Low exhaust pressure due to HRSG gas bypass flows Low steam or water injection flows due to inaccurate flowrate indications Steam injection unavailable due to blown pressure regulator diaphragm Improper GT Control limits were limiting PA flow
HRSG Problems: Low unit output can also be a result of low HRSG steam production and steam turbine output due to low steam flow. Some of the problems found with HRSG performance are as follows:
Low duct burner heat input due to erroneous flow and fuel heating value calculations Bad RTD input to ductburner multivariable fuel flow transmitter Improper fuel density and heating value calculations Poor duct burner flame distribution and hot spots Improper main steam pressure relief valve setpoints Insufficient or excessive superheat or reheat surface area Bad control setpoints and feedback instrumentation
Presented at: Power-Gen Natural Gas conference, Columbus, OH 8/24/2016
7 of 18
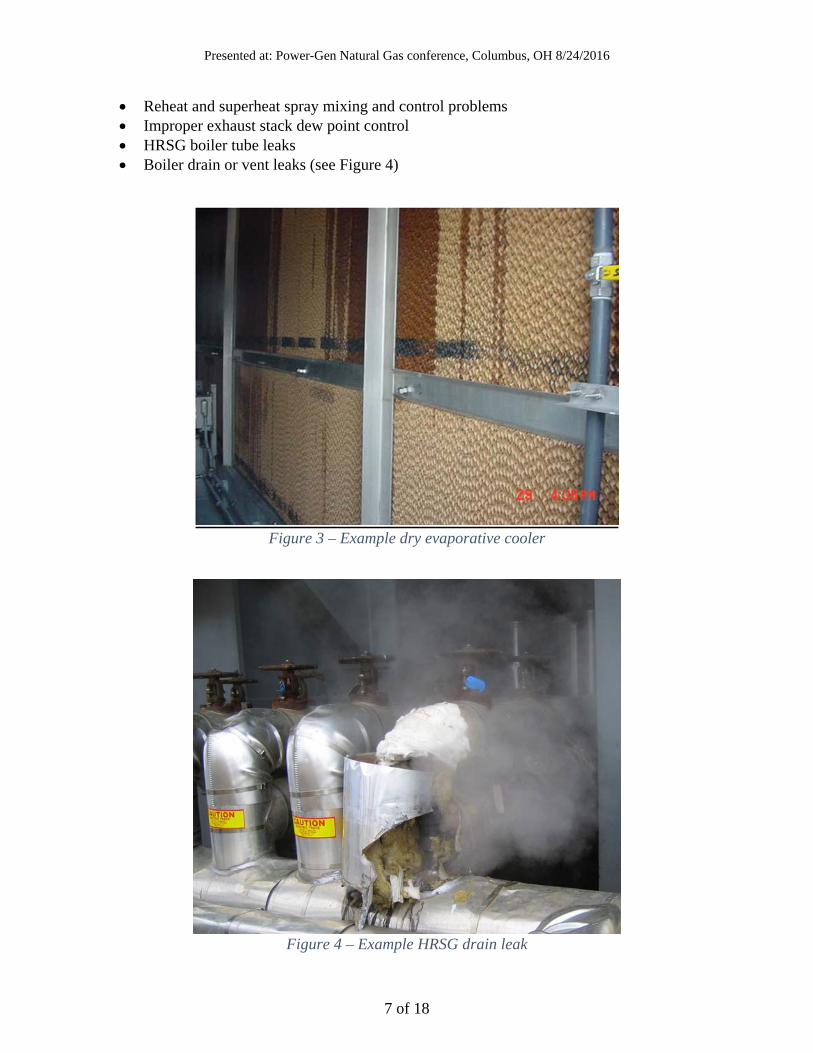
Reheat and superheat spray mixing and control problems Improper exhaust stack dew point control HRSG boiler tube leaks Boiler drain or vent leaks (see Figure 4)
Figure 3 – Example dry evaporative cooler
Figure 4 – Example HRSG drain leak
Presented at: Power-Gen Natural Gas conference, Columbus, OH 8/24/2016
8 of 18
Steam Turbine Problems: Low steam turbine output can also be due to:
Throttle valves not wide open (valve or position indication problems) HP, IP and LP bypass valve leakages Low throttle pressure setpoint feedback or indication Poor condenser and cooling tower performance Internal cycle isolation valve leakages to the condenser Condenser expansion joint leaking or other air in-leakage Vacuum pump problems
Other Net Unit Performance Problems: Actual or corrected net unit output can also be low due to:
Erroneous or unrealistic correction curves Watt metering errors Abnormal power factors and transmission system losses Excessive station service loads Poor weather station instrumentation and location Bad Gas Chromatograph outputs
Ideally these types of problems would be found and resolved before a capacity demonstration test; however, many tests are conducted on short notice when ambient conditions or load conditions make it economical to test. These tests are sometimes conducted soon after a unit starts up from an outage or after a period of extended shutdown when power augmentation systems may have been drained and not used. Running a unit at maximum capacity just for the purposes of a capacity test in non-peak season is not always economical so the tests are often started prematurely before power augmentation systems have been checked out and verified to be ready for operation.
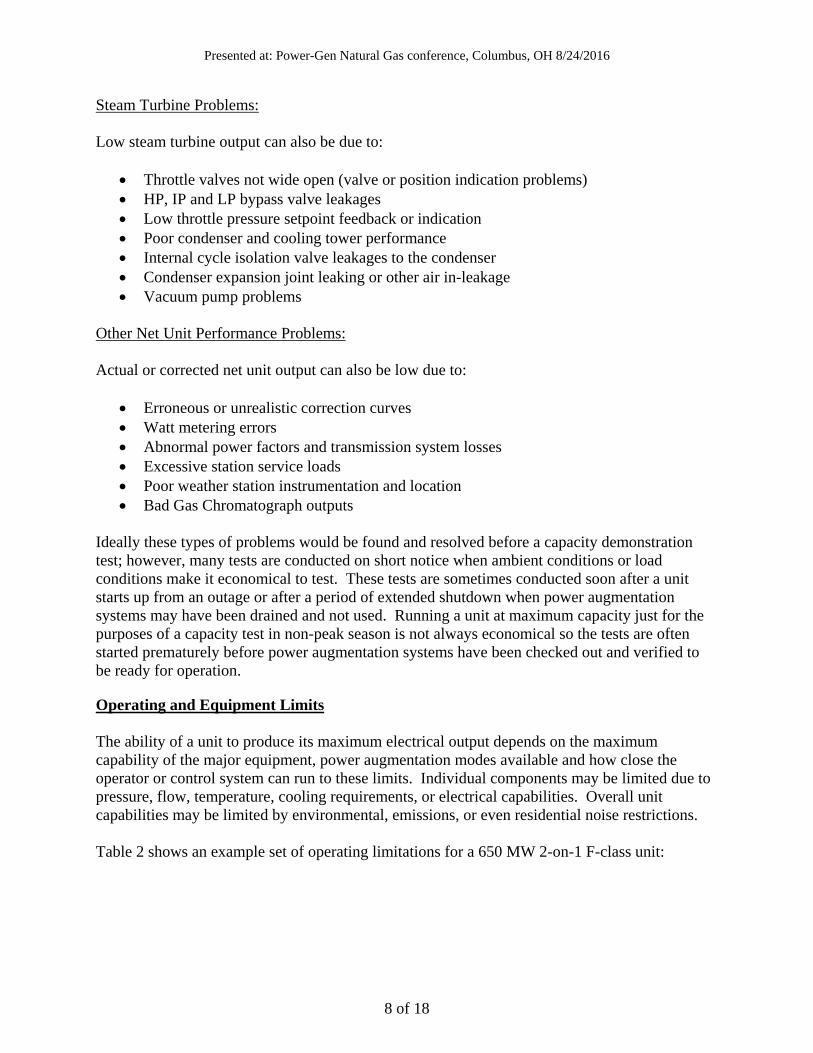
Operating and Equipment Limits The ability of a unit to produce its maximum electrical output depends on the maximum capability of the major equipment, power augmentation modes available and how close the operator or control system can run to these limits. Individual components may be limited due to pressure, flow, temperature, cooling requirements, or electrical capabilities. Overall unit capabilities may be limited by environmental, emissions, or even residential noise restrictions. Table 2 shows an example set of operating limitations for a 650 MW 2-on-1 F-class unit:
Presented at: Power-Gen Natural Gas conference, Columbus, OH 8/24/2016
9 of 18
Parameter Limit or Permissive Evap. cooler ON Only when ambient temp. >= 60 F GT steam injection Only when comp. inlet temp. >= 59 F HRSG HP SH Outlet Header Press. 2147 PSIG HRSG HP Drum Press. 2299 PSIG HRSG Hot Reheat Hdr. Press. 484.1 PSIG HRSG IP SH Press. 512.0 PSIG HRSG LP SH Press. 104.6 PSIG HRSG LP Drum Press. 122 PSIG DB Heat Input 541.7 MMBtu/hr (HHV) Min. LP Econ. Inlet Temp. 120 F or 140 F (during steam Inj.) Superheater Outlet Temp. 1055 F (at HRSG) Reheater Outlet Temp. 1055 F (at HRSG) GT Fuel Gas Inlet Temp. 280 F DB Outlet Temp. 1500 F (SH tube surface temps.) Max. HP Drum Sep. Flow 923,100 lb/hr @ 2095 PSIG Max. IP Drum Sep. Flow 85,794 lb/hr @ 535 PSIG Max. LP Drum Sep. Flow 100,979 lb/hr @ 122 PSIG ST HP Flow 1,800,964 lb/hr (110% Design) ST RH Flow 1,701,494 lb/hr (115% Design) HP throttle pressure 2300 PSIG HP and IP turbine inlet temp. 1050 F (at Turbine Inlet) ST Output MW (MVA) From vendor curve vs. Cooling Water
Temp. & PF Generator cooler service water inlet temp. 95 F GSU MVA From vendor curve vs. ambient temp.
Table 2 – Example equipment and unit operating limitations
Depending on the ambient conditions and operating mode, one of these parameters may be limiting factor to maximum unit output on a given day. If a unit is running at base load, ambient conditions may limit the output based on whether evaporative coolers can be operated. If a unit running in full pressure mode, duct burner heat input may be the limit. During power augmentation mode with full gas turbine steam injection, maximum duct burner heat input and evaporative coolers in service, the maximum KVA output of the steam turbine generator may be reached. All of these limits should be monitored by the plant computer and operators as the unit is loaded until one of them becomes the limiting factor. Since the limiting parameter may vary based on ambient conditions, the limit during a maximum capacity test performed in the spring or fall may not be the same as that which will actually be the limit during peak operation in the summer or winter. Therefore, it is best to conduct capacity demonstration tests as close as possible to actual reference or peak ambient conditions. If this is
Presented at: Power-Gen Natural Gas conference, Columbus, OH 8/24/2016
10 of 18
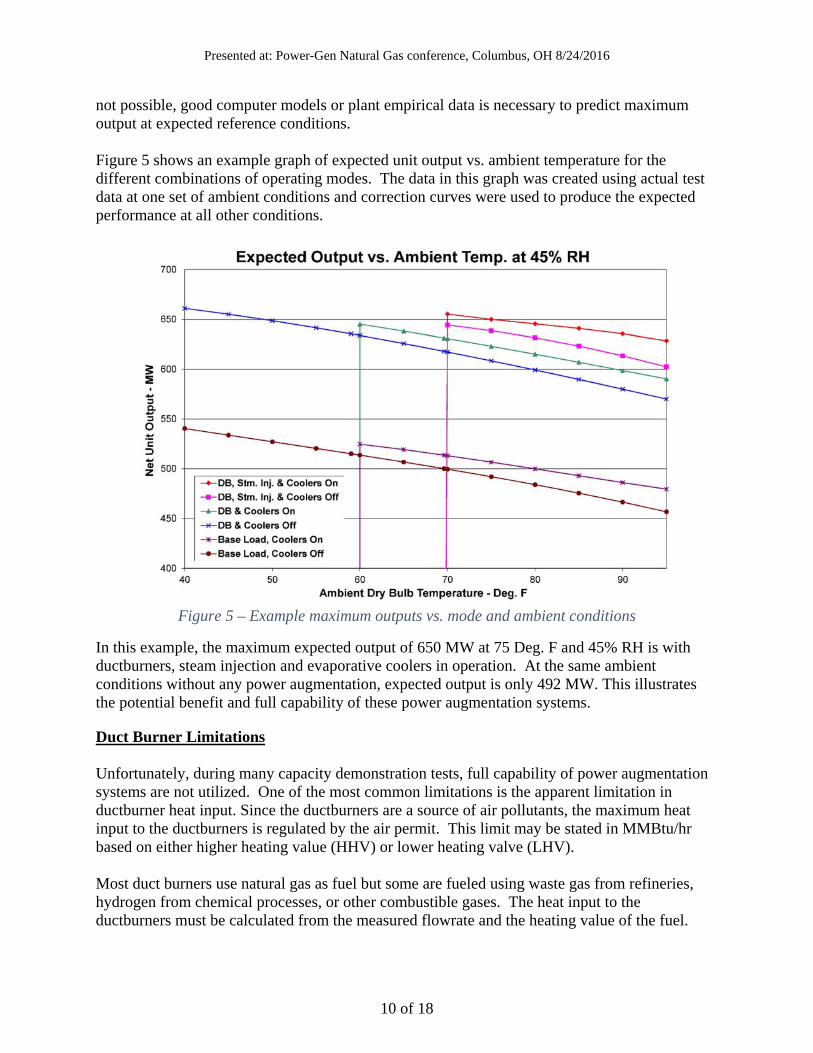
not possible, good computer models or plant empirical data is necessary to predict maximum output at expected reference conditions. Figure 5 shows an example graph of expected unit output vs. ambient temperature for the different combinations of operating modes. The data in this graph was created using actual test data at one set of ambient conditions and correction curves were used to produce the expected performance at all other conditions.
Figure 5 – Example maximum outputs vs. mode and ambient conditions
In this example, the maximum expected output of 650 MW at 75 Deg. F and 45% RH is with ductburners, steam injection and evaporative coolers in operation. At the same ambient conditions without any power augmentation, expected output is only 492 MW. This illustrates the potential benefit and full capability of these power augmentation systems.
Duct Burner Limitations Unfortunately, during many capacity demonstration tests, full capability of power augmentation systems are not utilized. One of the most common limitations is the apparent limitation in ductburner heat input. Since the ductburners are a source of air pollutants, the maximum heat input to the ductburners is regulated by the air permit. This limit may be stated in MMBtu/hr based on either higher heating value (HHV) or lower heating valve (LHV). Most duct burners use natural gas as fuel but some are fueled using waste gas from refineries, hydrogen from chemical processes, or other combustible gases. The heat input to the ductburners must be calculated from the measured flowrate and the heating value of the fuel.
Presented at: Power-Gen Natural Gas conference, Columbus, OH 8/24/2016
11 of 18
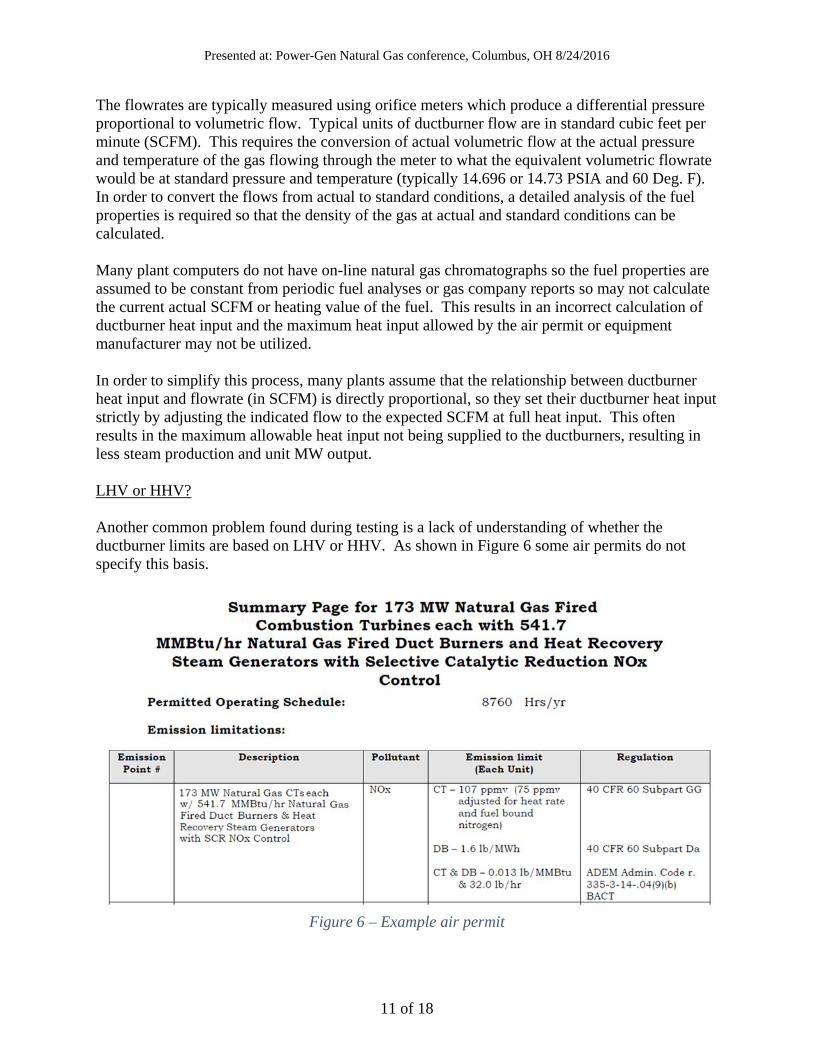
The flowrates are typically measured using orifice meters which produce a differential pressure proportional to volumetric flow. Typical units of ductburner flow are in standard cubic feet per minute (SCFM). This requires the conversion of actual volumetric flow at the actual pressure and temperature of the gas flowing through the meter to what the equivalent volumetric flowrate would be at standard pressure and temperature (typically 14.696 or 14.73 PSIA and 60 Deg. F). In order to convert the flows from actual to standard conditions, a detailed analysis of the fuel properties is required so that the density of the gas at actual and standard conditions can be calculated. Many plant computers do not have on-line natural gas chromatographs so the fuel properties are assumed to be constant from periodic fuel analyses or gas company reports so may not calculate the current actual SCFM or heating value of the fuel. This results in an incorrect calculation of ductburner heat input and the maximum heat input allowed by the air permit or equipment manufacturer may not be utilized. In order to simplify this process, many plants assume that the relationship between ductburner heat input and flowrate (in SCFM) is directly proportional, so they set their ductburner heat input strictly by adjusting the indicated flow to the expected SCFM at full heat input. This often results in the maximum allowable heat input not being supplied to the ductburners, resulting in less steam production and unit MW output. LHV or HHV? Another common problem found during testing is a lack of understanding of whether the ductburner limits are based on LHV or HHV. As shown in Figure 6 some air permits do not specify this basis.
Figure 6 – Example air permit

Presented at: Power-Gen Natural Gas conference, Columbus, OH 8/24/2016
12 of 18
EXAMPLE 4: Ductburners were sized according to an expected heat input of 488 MMBtu/hr LHV which is equivalent to 541.7 MMBtu/hr HHV. However, the plant computer was programmed to limit the ductburner flowrate to an SCFM flowrate value which corresponded to 488 MMBtu/hr HHV - which is actually only 90% of the permit limit. This resulted in an HP steam flow approximately 4% low. After correcting the heat input limit to the HHV value, unit output increased 12 MW. Ductburner Flame Distribution It should be noted that both the HRSG and steam turbine must be sized to handle the increased tube surface temperatures, superheater outlet pressures and temperatures, superheat spray requirements and steam flows produced by maximum duct burner heat input. For units tested with a maximum tube surface temperature of 1500 Deg. F, it only takes one hot spot indication to limit the total heat input of the entire set of ductburners. This hot spot may be due to abnormally long flame lengths due to improper sizing or spacing of burner holes, or tube surface temperature instrumentation errors. Improper distribution of burner heat can also be detected by an imbalance in superheater outlet header steam temperatures. EXAMPLE 5: During ductburner testing of a large 2-on-1 G-class unit with three-wide HRSG sections, superheater outlet steam temperatures on the far end of the header were approaching design limits which required limiting ductburner heat input. During an outage, the vendor drilled out or inserted orifices along the length of ductburner burner holes to produce proper distribution of the gas. Upon startup ductburner flame lengths and superheater header temperature were more uniform and duct burner heat input could be increased to the maximum allowed limit. A picture of a well-adjusted ductburner flame is shown in Figure 7.
Figure 7 – Ductburner flame
Presented at: Power-Gen Natural Gas conference, Columbus, OH 8/24/2016
13 of 18
Superheater Outlet Pressures Operating with maximum duct burner heat input and testing during cold weather when ambient temperatures are below reference conditions can produce HP steam flows and pressures which approach or exceed design superheater outlet header pressure limits. Problems with safety relief valves may not be apparent until the actual pressure in the superheater headers are pushed to the limits. EXAMPLE 6: A large 950 MW combined cycle unit designed for fully fired ductburner operation at 40 Deg. F was tested in January when the temperatures was near 32 Deg. F. Ductburner heat input was being increased and HRSG steam flows, HP steam and reheater outlet pressures were still within design limits when several safety valves started to lift. After reducing pressure the valves continued to leak due to damage. After investigation, it was discovered that the safety valve setpoints had been set too low and a special safety valve maintenance crew had to be called in to repair and reset the valves – delaying the capacity test by several days.
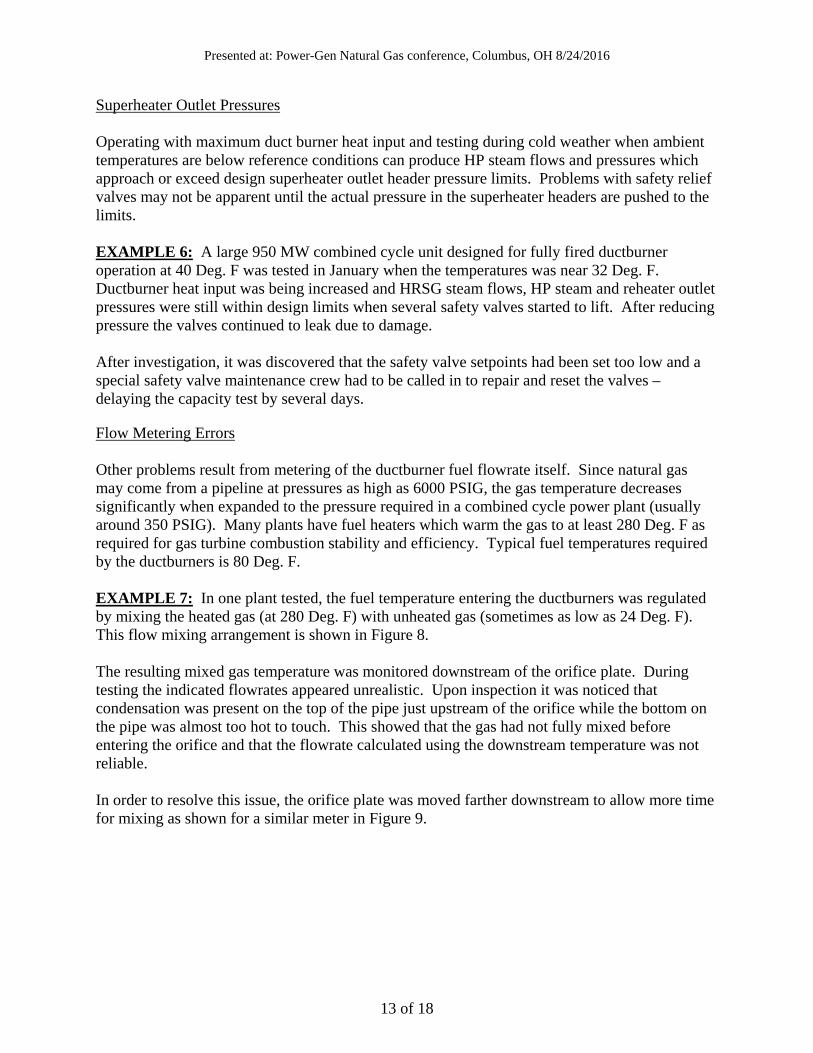
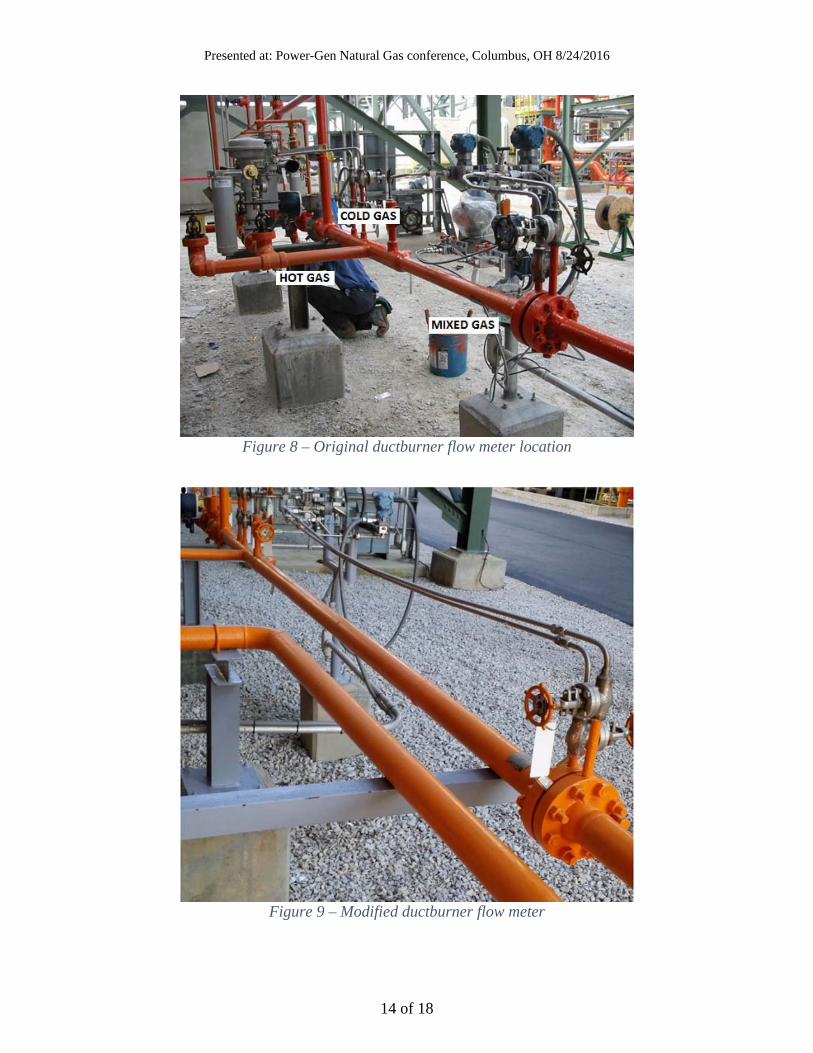
Flow Metering Errors Other problems result from metering of the ductburner fuel flowrate itself. Since natural gas may come from a pipeline at pressures as high as 6000 PSIG, the gas temperature decreases significantly when expanded to the pressure required in a combined cycle power plant (usually around 350 PSIG). Many plants have fuel heaters which warm the gas to at least 280 Deg. F as required for gas turbine combustion stability and efficiency. Typical fuel temperatures required by the ductburners is 80 Deg. F. EXAMPLE 7: In one plant tested, the fuel temperature entering the ductburners was regulated by mixing the heated gas (at 280 Deg. F) with unheated gas (sometimes as low as 24 Deg. F). This flow mixing arrangement is shown in Figure 8. The resulting mixed gas temperature was monitored downstream of the orifice plate. During testing the indicated flowrates appeared unrealistic. Upon inspection it was noticed that condensation was present on the top of the pipe just upstream of the orifice while the bottom on the pipe was almost too hot to touch. This showed that the gas had not fully mixed before entering the orifice and that the flowrate calculated using the downstream temperature was not reliable. In order to resolve this issue, the orifice plate was moved farther downstream to allow more time for mixing as shown for a similar meter in Figure 9.
Presented at: Power-Gen Natural Gas conference, Columbus, OH 8/24/2016
14 of 18
Figure 8 – Original ductburner flow meter location
Figure 9 – Modified ductburner flow meter
Presented at: Power-Gen Natural Gas conference, Columbus, OH 8/24/2016
15 of 18
The location of these meters can also have a significant effect on the reliability of the flow calculations. Some ductburner flow meters are located downstream of the burner pressure regulators where they operate at low pressures which vary with ductburner flow demand. The natural gas pressure and density can vary significantly at these location causing large swings in actual orifice meter volumetric flow, differential pressure and head loss. Therefore, it is preferable to locate ductburner flow meters upstream of the pressure regulators where they experience a more constant pressure, usually near the gas turbine inlet pressure of around 350 PSIG. The higher pressure and density also allows the purchase and use of a smaller meter. EXAMPLE 8: An indication of ductburner flow was not changing although the burner fuel supply valves were opening and the burner skid outlet pressures were dropping. After review it was found that the gas pressure at the flow orifice had dropped significantly, causing the DP produced by the transmitter to eventually to top out at its high range setting.
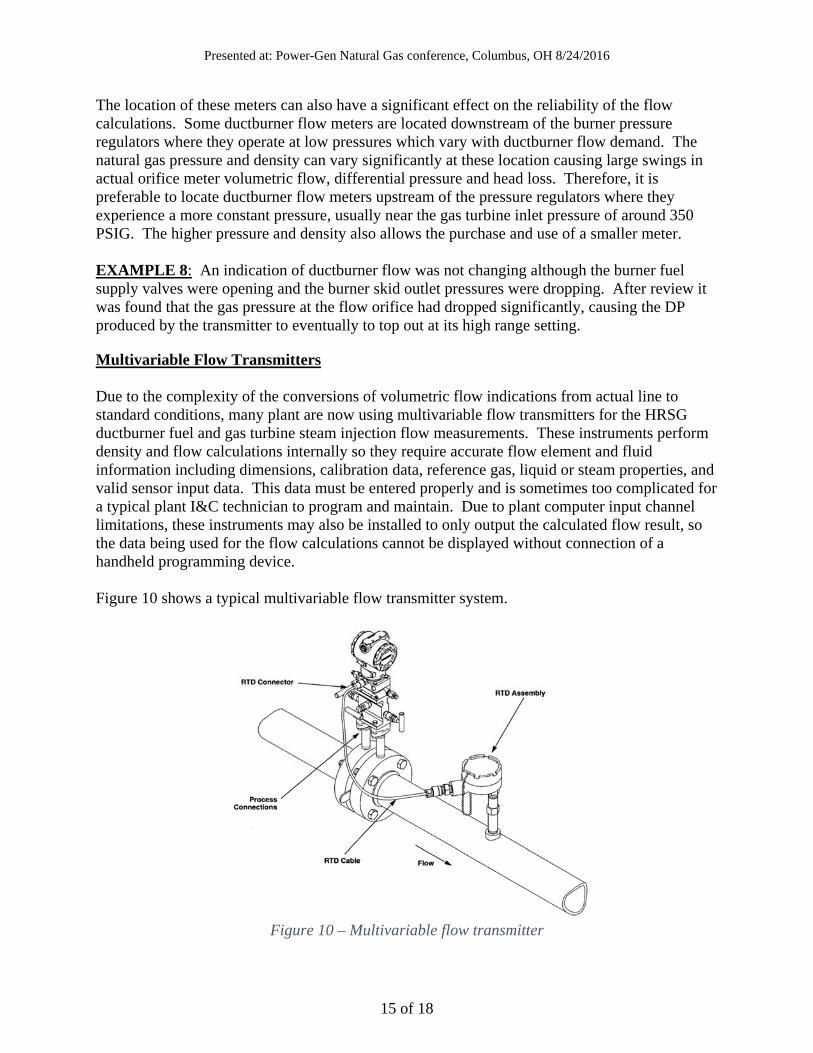
Multivariable Flow Transmitters Due to the complexity of the conversions of volumetric flow indications from actual line to standard conditions, many plant are now using multivariable flow transmitters for the HRSG ductburner fuel and gas turbine steam injection flow measurements. These instruments perform density and flow calculations internally so they require accurate flow element and fluid information including dimensions, calibration data, reference gas, liquid or steam properties, and valid sensor input data. This data must be entered properly and is sometimes too complicated for a typical plant I&C technician to program and maintain. Due to plant computer input channel limitations, these instruments may also be installed to only output the calculated flow result, so the data being used for the flow calculations cannot be displayed without connection of a handheld programming device. Figure 10 shows a typical multivariable flow transmitter system.
Figure 10 – Multivariable flow transmitter

Presented at: Power-Gen Natural Gas conference, Columbus, OH 8/24/2016
16 of 18
The flow calculations performed internally by these transmitters are often found to be more accurate that those performed by the plant computer due to their use of simplified formulas which combined many variable into one large flow coefficient. These coefficients may not account for changes in fluid temperature or density. EXAMPLE 9: A ductburner flow indication was apparently reading low. Connection of a handheld digital communicator showed that the DP and pressure readings were reasonable but the RTD input had failed. In addition the flow coefficient for the orifice plate was being calculated internally using built in AGA formulas. In order to repair and obtain the most accurate output signal, the RTD was replaced, specific calibration data for this particular orifice meter, and realistic fuel constituent properties were entered into the meter software database. Based on experience with these transmitters, it is recommended that the all process inputs including differential pressure, pressure and temperature also be output and connected to plant computer systems so that the flow calculations can be verified and failure of any input parameter can be detected. Correction of the flowrate calculated internally by the transmitter may also be necessary for actual fluid density.
Recommended Methods to Achieve Maximum Unit Output Based on these lessons learned from maximum capacity and performance testing, there are several activities that should be performed prior to the tests to prepare and assist the unit in achieving maximum output. In addition to major maintenance activities, these include the following activities which generally must be performed when the unit is off-line:
1. Check calibration of key control and test instrumentation 2. Clean or replace inlet air filters 3. Clean out evaporative cooler distribution headers and verify proper flow settings 4. Verify that compressor inlet pressure probes are undamaged and properly oriented 5. Check bleed heat, compressor blowoff and bypass valves for damage and possible
leakage 6. Perform an off-line water wash and close all water wash drains 7. Verify that proper gas turbine control constants are installed 8. Verify that the steam injection flow meter is valved in and available 9. Inspect steam injection and duct burner flow orifice plates for wear or damage 10. Verify that that multivariable flow transmitter are properly programmed and all inputs are
working 11. Check HP, IP and LP bypass valves for damage and possible leakage 12. Clean condenser water boxes and tubes if needed 13. Clean vacuum pump coolers 14. Check condenser and valves under vacuum for air in-leakage (during operation) 15. Verify validity of planned test procedures and correction curves
Presented at: Power-Gen Natural Gas conference, Columbus, OH 8/24/2016
17 of 18
Key control and test instrumentation Of all of the plant instruments in a combined cycle power plant, the following instruments have the most significant impact on gas turbine control, HRSG firing rates, unit capacity, and performance testing:
Barometric pressure Compressor inlet pressure Compressor discharge pressure GT exhaust temperature IGV position Compressor Inlet Temperature Steam injection flow DP, pressure and temperature Condensate inlet temperature (after recirc. pump flows) Ductburner flow DP, pressure and temperature Gas chromatograph readings Gas path temperatures (downstream of duct burner) Superheater outlet header temperatures Drum pressures Superheater outlet pressures HP steam pressure (at turbine inlet) HP steam temperature (at turbine inlet) Hot reheat temperature (at turbine inlet) Revenue watt meters Plant ambient temperature and relative humidity (if used for the test)
Failure or drift of these instruments can cause improper unit control and contribute to incorrect reporting of maximum dependable capacity test results.
Methods to improve and verify performance before the official capacity test Once the unit is on-line, proper operation, performance and capability of the unit should be verified before the official test is scheduled and test personnel or witnesses arrive on-site. Activities that should be performed include:
1. Verify all normally closed valves are closed. Isolate blowdown and look for steam or hot water flows from and to blowdown tanks
2. Verify proper operation of automatic opening or regulating valves 3. Validate compressor inlet and ambient air temperatures when inlet coolers are off 4. Test inlet cooling systems 5. Test steam injection systems and control instrumentation 6. Test ductburner systems, maximum flow and pressure capabilities 7. Check for condenser air in-leakage and resolve any problems 8. Consider hiring an independent test consultant to evaluate performance, perform a
preliminary test and correct results to reference conditions
Presented at: Power-Gen Natural Gas conference, Columbus, OH 8/24/2016
18 of 18
Official Maximum Capacity Test Checklist Schedule the test for a day near design reference conditions and optimum wind conditions. If the test is performed soon after an outage, try to allow time for water chemistry to stabilize and blowdown flowrates to return to more routine values; however, do not delay the test longer than necessary in order to minimize any possible degradation or fouling. Prior to the test the unit should be allowed to warm up and stabilize. For a valid maximum dependable capacity test, the following operating modes and test procedures are recommended: Turn on inlet cooling systems and allow to stabilize Adjust steam injection to maximum allowable flow
Note: The additional output produced by injecting steam to the gas turbines usually exceeds any loss in steam turbine output due to extracting the steam from the main steam or cold reheat lines.
Adjust ductburners to maximum heat input or until maximum allowable HP steam
pressure is obtained Monitor HP steam pressure and temperatures as close as possible to steam turbine inlets Verify that all cooling tower fans are running and any plume abatement system is off
Note: The additional net output produced by running all available cooling tower fans is usually greater than the station service loss from running additional fans.
Run all available cooling water pumps Run only the minimum number of condensate and feed pumps required for that load Maximize feedpump regulation valve positions for variable speed motors Verify that LP economizer inlet temperatures are set to the required mode Adjust power factor to near 1.0 in order to minimize generator losses Raise hydrogen pressures and purity to design Leave auxiliary equipment and station service in routine conditions Allow time for gas turbine and steam turbine output to stabilize Measure atmospheric pressure, ambient temperature and humidity using a valid dedicated
plant weather station or test instruments Utilize the same watt meters that will be used for revenue payments; however, also
record individual generator outputs and auxiliary power measurements for validation of net power measurements.
Conclusions Lessons learned from capacity testing of numerous gas turbine and combined cycle units have shown that many design deficiencies, equipment problems or operating conditions can occur that unnecessarily limit actual and indicated net unit maximum dependable capacity. Through diligent effort and cooperation of test consultants, plant engineers, unit designers, vendors, and plant operators, most of these problems can be overcome and the maximum capability of a combined cycle unit can be achieved and demonstrated.


![Optimal Power Control Strategy of Maximizing Wind Energy ... · A turbine generator can not fully capture wind energy. Then, the output power of the wind-turbine is described as [10]:](https://img.pdfslide.net/doc/110x75/5ed6625a8368e16df13cdff6/optimal-power-control-strategy-of-maximizing-wind-energy-a-turbine-generator.jpg)