Embed Size (px)
Citation preview

Seediscussions,stats,andauthorprofilesforthispublicationat:https://www.researchgate.net/publication/277477965
ModelingofCO2captureviachemicalabsorptionprocesses−Anextensiveliteraturereview
ArticleinRenewableandSustainableEnergyReviews·October2015
ImpactFactor:5.9·DOI:10.1016/j.rser.2015.04.124
CITATIONS
3
READS
77
3authors:
I.P.Koronaki
NationalTechnicalUniversityofAthens
64PUBLICATIONS897CITATIONS
SEEPROFILE
LoukiaPrentza
NationalTechnicalUniversityofAthens
3PUBLICATIONS3CITATIONS
SEEPROFILE
VasilisDPapaefthimiou
NationalTechnicalUniversityofAthens
22PUBLICATIONS108CITATIONS
SEEPROFILE
Availablefrom:VasilisDPapaefthimiou
Retrievedon:05July2016

Modeling of CO2 capture via chemical absorption processes� An extensive literature review
I.P. Koronaki n, L. Prentza, V. PapaefthimiouLaboratory of Applied Thermodynamics, School of Mechanical Engineering, Thermal Engineering Section National Technical University of Athens, HeroonPolytechniou 9, Zografou Campus 15780, Athens, Greece
a r t i c l e i n f o
Article history:Received 17 October 2014Received in revised form11 March 2015Accepted 23 April 2015
Keywords:Chemical absorptionCCSRate-based modelDynamic modelingCO2
a b s t r a c t
Climate change mainly due to the release of greenhouse gases into the atmosphere is getting alarmingdimensions. CO2 capture from point source emissions is a promising solution, lately receiving significantattention. In particular, chemical absorption of CO2 from flue gases using aqueous solvents (mainlyalkanolamines) is a well-known process, studied in detail. Modern research aims to optimize thisprocess, maximizing the absorption rates and minimizing the parasitic but not negligible energyrequirements for solvent regeneration. This type of analysis requires considering the coupling of theabsorption with the power plant operation or other source of CO2. The operation fluctuations anddisturbances, such as load variations or start-up mode have to be reflected in the process modeling,justifying the emerging need for dynamic modeling. However, dynamic analysis is not always realizableas dynamic experimental data are scarce in order to enable accurate model validation. Thus, steady statemodels are still convenient for certain cases. The current work provides a short description of the mainmodeling approaches followed and enlists representative steady state and dynamic models found inliterature. Finally, a primary comparison is performed for some comparable models that used the sameset of experimental data for model validation.
& 2015 Elsevier Ltd. All rights reserved.
Contents
1. Introduction . . . . . . . . . . . . . . . . . . . . . . . . . . . . . . . . . . . . . . . . . . . . . . . . . . . . . . . . . . . . . . . . . . . . . . . . . . . . . . . . . . . . . . . . . . . . . . . . . . . . . . . . 5482. Structure . . . . . . . . . . . . . . . . . . . . . . . . . . . . . . . . . . . . . . . . . . . . . . . . . . . . . . . . . . . . . . . . . . . . . . . . . . . . . . . . . . . . . . . . . . . . . . . . . . . . . . . . . . 5483. Chemical absorption process and solvents . . . . . . . . . . . . . . . . . . . . . . . . . . . . . . . . . . . . . . . . . . . . . . . . . . . . . . . . . . . . . . . . . . . . . . . . . . . . . . . . 5484. Chemical absorption modeling . . . . . . . . . . . . . . . . . . . . . . . . . . . . . . . . . . . . . . . . . . . . . . . . . . . . . . . . . . . . . . . . . . . . . . . . . . . . . . . . . . . . . . . . . 549
4.1. Modeling requirements . . . . . . . . . . . . . . . . . . . . . . . . . . . . . . . . . . . . . . . . . . . . . . . . . . . . . . . . . . . . . . . . . . . . . . . . . . . . . . . . . . . . . . . . . 5494.2. Modeling approaches . . . . . . . . . . . . . . . . . . . . . . . . . . . . . . . . . . . . . . . . . . . . . . . . . . . . . . . . . . . . . . . . . . . . . . . . . . . . . . . . . . . . . . . . . . 5494.3. Mass transfer approaches . . . . . . . . . . . . . . . . . . . . . . . . . . . . . . . . . . . . . . . . . . . . . . . . . . . . . . . . . . . . . . . . . . . . . . . . . . . . . . . . . . . . . . . 5494.4. Thermodynamic models . . . . . . . . . . . . . . . . . . . . . . . . . . . . . . . . . . . . . . . . . . . . . . . . . . . . . . . . . . . . . . . . . . . . . . . . . . . . . . . . . . . . . . . . 550
4.4.1. Kent�Eisenberg model . . . . . . . . . . . . . . . . . . . . . . . . . . . . . . . . . . . . . . . . . . . . . . . . . . . . . . . . . . . . . . . . . . . . . . . . . . . . . . . . . . 5504.4.2. Electrolyte non-random two-liquid (e-NTRL) model . . . . . . . . . . . . . . . . . . . . . . . . . . . . . . . . . . . . . . . . . . . . . . . . . . . . . . . . . . . 5504.4.3. EoS/GE models . . . . . . . . . . . . . . . . . . . . . . . . . . . . . . . . . . . . . . . . . . . . . . . . . . . . . . . . . . . . . . . . . . . . . . . . . . . . . . . . . . . . . . . . . 5504.4.4. SAFT (statistical association fluid theory) model . . . . . . . . . . . . . . . . . . . . . . . . . . . . . . . . . . . . . . . . . . . . . . . . . . . . . . . . . . . . . . 551
4.5. Kinetic models . . . . . . . . . . . . . . . . . . . . . . . . . . . . . . . . . . . . . . . . . . . . . . . . . . . . . . . . . . . . . . . . . . . . . . . . . . . . . . . . . . . . . . . . . . . . . . . . 5514.6. Absorption column model. . . . . . . . . . . . . . . . . . . . . . . . . . . . . . . . . . . . . . . . . . . . . . . . . . . . . . . . . . . . . . . . . . . . . . . . . . . . . . . . . . . . . . . 5514.7. Dynamic modeling. . . . . . . . . . . . . . . . . . . . . . . . . . . . . . . . . . . . . . . . . . . . . . . . . . . . . . . . . . . . . . . . . . . . . . . . . . . . . . . . . . . . . . . . . . . . . 551
5. Models review . . . . . . . . . . . . . . . . . . . . . . . . . . . . . . . . . . . . . . . . . . . . . . . . . . . . . . . . . . . . . . . . . . . . . . . . . . . . . . . . . . . . . . . . . . . . . . . . . . . . . . 5515.1. Rational for this review. . . . . . . . . . . . . . . . . . . . . . . . . . . . . . . . . . . . . . . . . . . . . . . . . . . . . . . . . . . . . . . . . . . . . . . . . . . . . . . . . . . . . . . . . 551
Contents lists available at ScienceDirect
journal homepage: www.elsevier.com/locate/rser
Renewable and Sustainable Energy Reviews
http://dx.doi.org/10.1016/j.rser.2015.04.1241364-0321/& 2015 Elsevier Ltd. All rights reserved.
n Corresponding author. Tel.: þ30 2107721581; fax: þ30 2107723670.E-mail addresses: [email protected] (I.P. Koronaki), [email protected] (L. Prentza), [email protected] (V. Papaefthimiou).
Renewable and Sustainable Energy Reviews 50 (2015) 547–566

5.2. Chemical absorption models literature review. . . . . . . . . . . . . . . . . . . . . . . . . . . . . . . . . . . . . . . . . . . . . . . . . . . . . . . . . . . . . . . . . . . . . . . 5515.2.1. Steady state models . . . . . . . . . . . . . . . . . . . . . . . . . . . . . . . . . . . . . . . . . . . . . . . . . . . . . . . . . . . . . . . . . . . . . . . . . . . . . . . . . . . . . 5515.2.2. Dynamic models . . . . . . . . . . . . . . . . . . . . . . . . . . . . . . . . . . . . . . . . . . . . . . . . . . . . . . . . . . . . . . . . . . . . . . . . . . . . . . . . . . . . . . . 5595.2.3. Model comparisons . . . . . . . . . . . . . . . . . . . . . . . . . . . . . . . . . . . . . . . . . . . . . . . . . . . . . . . . . . . . . . . . . . . . . . . . . . . . . . . . . . . . . 561
6. Conclusions and scope for future work . . . . . . . . . . . . . . . . . . . . . . . . . . . . . . . . . . . . . . . . . . . . . . . . . . . . . . . . . . . . . . . . . . . . . . . . . . . . . . . . . . 563Acknowledgements . . . . . . . . . . . . . . . . . . . . . . . . . . . . . . . . . . . . . . . . . . . . . . . . . . . . . . . . . . . . . . . . . . . . . . . . . . . . . . . . . . . . . . . . . . . . . . . . . . . . . . 564Appendix A. List with recent models . . . . . . . . . . . . . . . . . . . . . . . . . . . . . . . . . . . . . . . . . . . . . . . . . . . . . . . . . . . . . . . . . . . . . . . . . . . . . . . . . . . . . 564References . . . . . . . . . . . . . . . . . . . . . . . . . . . . . . . . . . . . . . . . . . . . . . . . . . . . . . . . . . . . . . . . . . . . . . . . . . . . . . . . . . . . . . . . . . . . . . . . . . . . . . . . . . . . . 565
1. Introduction
Facing climatic change as a detrimental result of the increasingglobal energy demand, various policies have been adopted aiming tomitigate the consequences, mainly to the reduction of greenhouseemissions. During the last years, the penetration of renewable sourcesof energy has been mainly promoted as a promising solution.However, it seems that fossil fuels will still be a predominantcomponent of the global energy mix, posing the need for more directways of response. At the same time, EU and its member states arecommitted to an emission reduction target of 20% by 2020, comparedwith 1990 levels. This target could be increased to 30% underconditions set out by the European Council [1]
Carbon Capture and Storage (CCS) is a promising techniquegaining increasing interest among researchers and policymakers.In specific, CCS is a process where CO2 is separated from industrialproduction or energy conversion, is transported to the storage siteunder high pressure and finally geologically stored, aiming torealize zero emissions in the process of fossil energy extraction,conversion and usage [2]. CCS refers to the capture of CO2
emissions either before the combustion of the fuel or directlyfrom the flue gas. Post combustion methods are more applicable asthey have no retrofitting requirements for the existing equipment.The most applied and efficient post combustion method ischemical absorption. In comparison with other post-combustionCO2 absorption processes, chemical absorbents ensure higherabsorption efficiency and selectivity, and lower energy [3].
In order to enable a wider scale implementation of CCS, detailedand efficient modeling of the process is a prerequisite. This is becausethe study of reactive absorption is mainly based on simulations, asexperimental data are limited and not always reliable. Chemicalabsorption of CO2 by aqueous solvents, mainly amines, has beenstudied for decades by numerous researchers with satisfying results.The developed models include both kinetic and thermodynamicaspects and are aiming to optimize the absorption. It is only recentlythough, that these attempts include dynamic characteristics and morerealistic representations of the process.
The current work objective is to outline briefly the commonmodeling approaches in the field of post-combustion CO2 absorp-tion and also attempt to list a wide spectrum of specific models,steady and dynamic, encompassing their assumptions, modelingand validations tools and main outcome. Finally, the paper aims toconclude on the prediction efficiency of several models, compar-ing, to the point it is possible, results of different researcherswhich are based on the same experimental data.
2. Structure
The article is structured in 5 Sections. Section 1 is theintroductory section providing information about the CO2 emis-sions problem and the necessity to confront this. In following,Section 2 outlines the chemical absorption process and certaincommercially used solvents. Section 3 provides the fundamentals,assumptions and requirements of the reactive absorption
modeling. Different mass transfer models, thermodynamic andkinetic models are listed. At the end an introduction to dynamicmodeling is included. Section 4 includes the analysis of represen-tative models from literature. Different sub-sections for steadystate and dynamic models are encompassed, providing informa-tion for the assumptions made, equations applied and mainoutcome. In following in the same Section, three absorption unitsare presented that have provided very useful and widely usedexperimental results. Based on these data, certain rough compar-isons are performed between models. Summarizing, Section 5outlines the conclusions made by this literature research andsuggest fields for future work.
3. Chemical absorption process and solvents
Chemical absorption (or reactive absorption) is the processwhere a gas is absorbed by a liquid phase with combination ofreaction and absorptive mass transport. Amine-based systems,carbonate-based systems, aqueous ammonia and ionic liquids–based systems are typical systems for chemical absorption.
In specific for CO2 capture, chemical absorption involves thereaction of CO2 with a chemical solvent forming a weakly bondedintermediate compound, a process that can be reversed applying heatand resulting to the original solvent and a CO2 stream [3]. Theregeneration process is the most demanding by means of energy, as itmay cost up to 14% of the power plant efficiency [4]. During chemicalabsorption the flue gas enters usually an absorption tower where itcontacts countercurrent the solvent under low temperature (40–60 1C). The rich in CO2 solvent is compressed, heated in an exchangerand inserted in the desorption column (stripper) where it is regen-erated under low pressure (close to ambient) and high temperatures(100–140 1C). The regenerated (lean) solvent exits the column and re-enters the absorber after dissipating its heat in the rich solventthrough the above mentioned exchanger.
The chemical absorption process was initially performed usingamine aqueous solvents. The most mature and commerciallyapplied amine is Monoethanolamine (MEA) due to its highabsorptive capacity. MEA is considered an attractive solvent atlow partial pressures of CO2 in the flue gas due to its fast reactionrates compared to that of secondary and tertiary amines [5]. Othercommon amines are Diethanolamine (DEA), Methyl diethanola-mine (MDEA), Diglycolamine (DGA), and Diisopropanolamine(DIPA) and Piperazine (PZ) or mixtures of amines that arecharacterized by satisfactory reaction rates and lower regenerationenergy than MEA. Piperazine is usually added as a promoter as ithas been found to have faster reaction rates than MEA. Due to itshigh volatility though, its application in CO2 absorption is moreexpensive and is still under development [6]. A special category ofamines are sterically hindered amines (SHA) that e.g. 2-Amino-2-methyl-1-propanol (AMP). SHA form more unstable carbamates incomparison with other amines. Thus, they are more efficientduring regeneration, as the unstable carbamates are easier to bereversed, leading therefore to quicker desorption and less energy
I.P. Koronaki et al. / Renewable and Sustainable Energy Reviews 50 (2015) 547–566548

requirements [7]. Alternative solvents for chemical absorption areaqueous ammonia, ionic liquids and potassium carbonate. Inspecific, aqueous ammonia is a strongly promising solvent char-acterized by many assets, as high absorption efficiency, highabsorption capacity, low energy requirement for absorbent regen-eration and wide distribution of resources [8].
4. Chemical absorption modeling
Within this section the main modeling processses and tools areprovided. The required steps in order to simulate accurately theprocess of CO2 absorption are described as well as the dominatingtechniques.
4.1. Modeling requirements
Chemical absorption process involves complexmechanisms both ofthermodynamic and chemical nature. This process is described asreactive absorption considering that reactions and absorptive masstransport phenomena occur simultaneously. An important character-istic of reactive absorption processes is the variation of reactionvelocities, from very low (slow reactions) up to infinitely high(instantaneous reactions).Thus, the modeling of these mechanisms ischallenging and requires a multi-factor design. The ideal model has tobe rigorous enough to encompass all complex aspects of the problemand manageable enough in order to enable an easy implementation ofthe modeling process [9].
A thermodynamic model has to describe through its differentialequations certain fundamentals: the chemical equilibrium, thevapour� liquid equilibrium, the liquid phase constitution, theregeneration energy, and the two phases’ mass [10].
4.2. Modeling approaches
There are two modeling approaches corresponding reactiveprocesses: the equilibrium models and the rate-based models (ornon-equilibrium models). The equilibrium models assumevapour� liquid equilibrium at each stage [11]. Non-equilibriummodels consider the actual reaction rates and are more accurate asphysical equilibrium is hard to attain.
Equilibrium models assume a quick and cursive mass transfer.Thus, they are more applicable for solvents with high reaction rates,e.g. primary amines. Equilibrium models apply MESH (Materialbalances, Equilibrium equations, Mole Fractions Sum conditions andHeat balance) equations. These models are usually based on theore-tical stages in which liquid and vapour phases reach equilibrium.Stages use height equivalent to a theoretical plate (HETP) and assumethe equilibrium state between the streams leaving each stage [12].These stages correspond either to real column stages, for disc columns,or equivalent stages, for columns with filler materials.
Non-equilibrium models, as mentioned, estimate the realreaction rates and mass transfer resistances. These phenomenaare often approached via enhancement factors that amend theequilibrium computations. The enhancement factor is actually thechemical mass transfer coefficient to the physical mass transfercoefficient. It is either obtained by fitting experimental data ortheoretically based on simplified model assumptions [13]. This is avery common approach of modeling reaction kinetics. However,this approach is often simplified as binary systems are not suitableto estimate the enhancement factors and theoretical approachesare based on rough simplifications. More complex simulations areinstructed that consider directly the reaction rates.
Rate based models describe the interfacial molar fluxes directly.The mass transfer is usually described through Maxwell�Stefanequations from the kinetic theory of gases modified for binary
systems with gas and liquids [9]. The modified equation giving thegeneralized driving force is the following:
di ¼Xmj ¼ 1
xlfi nlfj �xlfj n
lfi
Clft Dij
where D is the Maxwell�Stefan diffusion coefficient, xlfi and xlfj arethe liquid mole fractions in the liquid film for i and j components,nlfj and nlf
i are the molar fluxes in the liquid film for i and jcomponents and Clf
t is the total molar concentration in theliquid film.
The electrolytes effect should be included in this analysis andfor dilute electrolyte systems, the diffusional interactions can beneglected giving the generalized Maxwell�Stefan equationsreduced to the following Nernst�Planck equation:
nlfi ¼ Clf
t Dli;ef f ∇xlfi þxlfi zi
FRT
∇φ� �
þxlfi nlfm
where Dli;ef f is the effective diffusion coefficient, zi the ionic charge
of component i, F Faraday’s constant, R the gas constant, T thetemperature and φ the electrical potential.
This approach requires also the assumption of electroneutralityin each region of the liquid phase expressed by the followingformula:
Xmi ¼ 1
xizi ¼ 0
Another method to describe the interfacial mass transfer isKarhunen–Loeve Galerkin (KLG). The KLG method is a Galerkinmethod employing the empirical eigenfunctions of the Karhunen–Loeve decomposition as basis functions. [14].
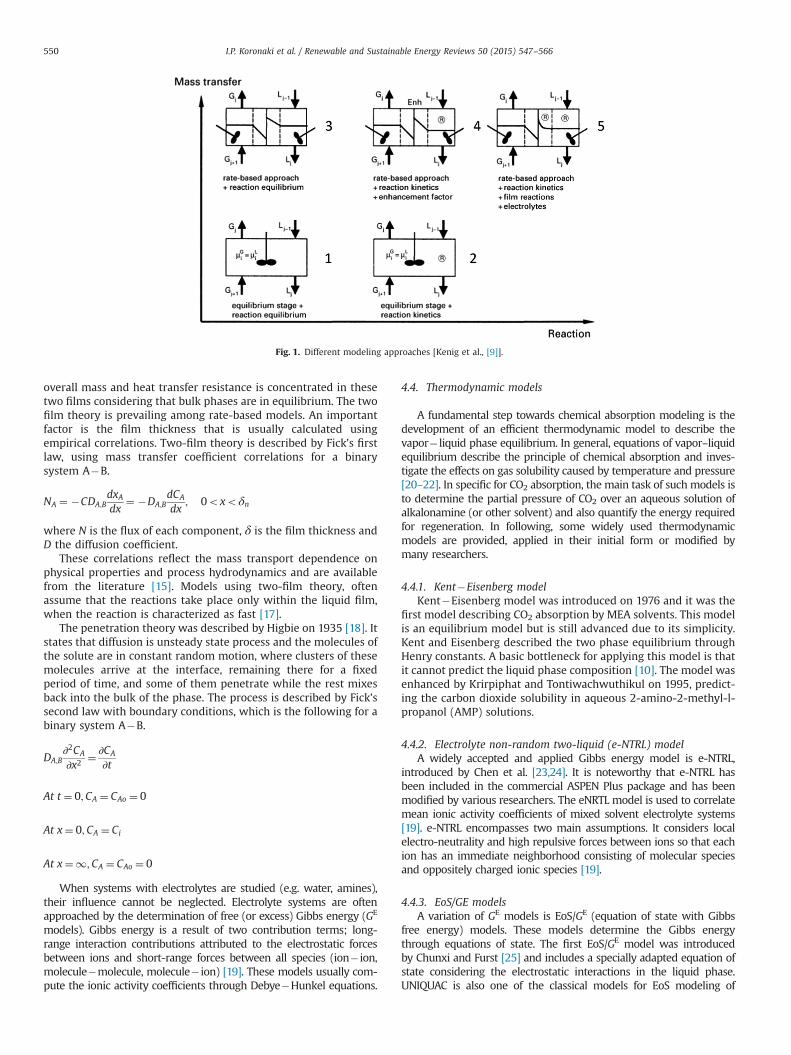
Both equilibrium and rate-based models may consider the reactionkinetics or not. If the reaction rate is slower than themass transfer rate,kinetics should be considered as a dominating factor [13]. Fig. 1 iswidely cited as it clusters reactive absorption models through a veryefficient approach [15]. The lowest level of complexity begins from thebottom left of Fig. 1 with the simple equilibrium stage model. Thismodel assumes physical equilibrium and no reactions within theore-tical stages. The next level moving rightwards is the equilibriummodelincluding also reaction kinetics. Themodel can consider the bulk phasereaction kinetics or both the bulk and film reaction kinetics, dependingon its complexity and accuracy. The equilibrium stage extended by theconsideration of kinetically controlled reactions is physically incon-sistent; however, this model has often been applied in the literature.Upwards and beginning from the left, the simplest rate based approachassumes mass transfer rates and could take into account movingrightwards, additional factors such as reaction kinetics and electrolytesinfluence. The 5 types of models are numbered from 1 to 5 beginningfrom the less complex (equilibrium stage, reaction equilibrium) to themost complicated (rate based with reaction kinetics, film reactions andelectrolytes), in order to be referenced later.
4.3. Mass transfer approaches
Different approaches were followed in order to describe themass transfer phenomena between the liquid and the gas phase.The dominant theories are the two film theory and the penetrationtheory.
The two-film theory [16] suggest that there are two thin areas(films) that are adjacent to the two phases interface separating itfrom the bulk phases, which are ideally mixed. It is assumed that
I.P. Koronaki et al. / Renewable and Sustainable Energy Reviews 50 (2015) 547–566 549
overall mass and heat transfer resistance is concentrated in thesetwo films considering that bulk phases are in equilibrium. The twofilm theory is prevailing among rate-based models. An importantfactor is the film thickness that is usually calculated usingempirical correlations. Two-film theory is described by Fick’s firstlaw, using mass transfer coefficient correlations for a binarysystem A�B.
NA ¼ �CDA;BdxAdx
¼ �DA;BdCA
dx; 0oxoδn
where N is the flux of each component, δ is the film thickness andD the diffusion coefficient.
These correlations reflect the mass transport dependence onphysical properties and process hydrodynamics and are availablefrom the literature [15]. Models using two-film theory, oftenassume that the reactions take place only within the liquid film,when the reaction is characterized as fast [17].
The penetration theory was described by Higbie on 1935 [18]. Itstates that diffusion is unsteady state process and the molecules ofthe solute are in constant random motion, where clusters of thesemolecules arrive at the interface, remaining there for a fixedperiod of time, and some of them penetrate while the rest mixesback into the bulk of the phase. The process is described by Fick’ssecond law with boundary conditions, which is the following for abinary system A�B.
DA;B∂2CA
∂x2¼ ∂CA
∂t
At t ¼ 0;CA ¼ CAo ¼ 0
At x¼ 0;CA ¼ Ci
At x¼1;CA ¼ CAo ¼ 0
When systems with electrolytes are studied (e.g. water, amines),their influence cannot be neglected. Electrolyte systems are oftenapproached by the determination of free (or excess) Gibbs energy (GE
models). Gibbs energy is a result of two contribution terms; long-range interaction contributions attributed to the electrostatic forcesbetween ions and short-range forces between all species (ion� ion,molecule�molecule, molecule� ion) [19]. These models usually com-pute the ionic activity coefficients through Debye�Hunkel equations.
4.4. Thermodynamic models
A fundamental step towards chemical absorption modeling is thedevelopment of an efficient thermodynamic model to describe thevapor� liquid phase equilibrium. In general, equations of vapor–liquidequilibrium describe the principle of chemical absorption and inves-tigate the effects on gas solubility caused by temperature and pressure[20–22]. In specific for CO2 absorption, the main task of such models isto determine the partial pressure of CO2 over an aqueous solution ofalkalonamine (or other solvent) and also quantify the energy requiredfor regeneration. In following, some widely used thermodynamicmodels are provided, applied in their initial form or modified bymany researchers.
4.4.1. Kent�Eisenberg modelKent�Eisenberg model was introduced on 1976 and it was the
first model describing CO2 absorption by MEA solvents. This modelis an equilibrium model but is still advanced due to its simplicity.Kent and Eisenberg described the two phase equilibrium throughHenry constants. A basic bottleneck for applying this model is thatit cannot predict the liquid phase composition [10]. The model wasenhanced by Krirpiphat and Tontiwachwuthikul on 1995, predict-ing the carbon dioxide solubility in aqueous 2-amino-2-methyl-l-propanol (AMP) solutions.
4.4.2. Electrolyte non-random two-liquid (e-NTRL) modelA widely accepted and applied Gibbs energy model is e-NTRL,
introduced by Chen et al. [23,24]. It is noteworthy that e-NTRL hasbeen included in the commercial ASPEN Plus package and has beenmodified by various researchers. The eNRTL model is used to correlatemean ionic activity coefficients of mixed solvent electrolyte systems[19]. e-NTRL encompasses two main assumptions. It considers localelectro-neutrality and high repulsive forces between ions so that eachion has an immediate neighborhood consisting of molecular speciesand oppositely charged ionic species [19].
4.4.3. EoS/GE modelsA variation of GE models is EoS/GE (equation of state with Gibbs
free energy) models. These models determine the Gibbs energythrough equations of state. The first EoS/GE model was introducedby Chunxi and Furst [25] and includes a specially adapted equation ofstate considering the electrostatic interactions in the liquid phase.UNIQUAC is also one of the classical models for EoS modeling of
Fig. 1. Different modeling approaches [Kenig et al., [9]].
I.P. Koronaki et al. / Renewable and Sustainable Energy Reviews 50 (2015) 547–566550

activity coefficients. Through UNIQUAC, activity coefficients are calcu-lated in relation to the excess Gibbs free energy. UNIFAC is anothermodel that can be described as a group contribution method. Whilebeing based on essentially the same model as UNIQUAC it considersmolecules as a set of groups. By obtaining data for segments ofmolecules it is possible to predict the activity of any moleculecomposed of groups of which parameters are known. This givesUNIFAC predictive properties that UNIQUAC does not have [26].
4.4.4. SAFT (statistical association fluid theory) modelSAFT model also uses an equation of state (SAFT equation) but it
determines Helmholtz excess energy instead of Gibbs. SAFT modeldoes not require the equilibrium constants like other models but isbased on a number of factors. SAFT equations of state are clusteredin the mean field theories, leading to low accuracy when localproperties of the fluid have big fluctuations [27].
4.5. Kinetic models
In order to approach the kinetics of chemical absorption ofCO2, the first step of the researcher is to determine whichreactions are taking place in the liquid bulk. The type of reactionsconsidered depends on the assumptions for the CO2-solventreaction mechanism. There are three main approaches on themechanism of CO2 reaction with amine solvents, the zwitterionmechanism, the termolecular and the based-catalyzed hydrationmechanism.
� The zwitterion mechanismThis reaction mechanism was first proposed by Caplow andreintroduced by Danckwerts. Based on this mechanism, thesolvent and CO2 form zwitterions firstly, and then zwitterion isfurther deprotonated by a base to form carbamate [8].
� The termolecular mechanismTermolecular mechanism suggests that the formation of thezwitterions and the deprotonization occur simultaneously.
� Base-catalyzed hydration mechanismTertiary alkanolamines cannot react directly with CO2. Suchamines have a base-catalytic effect on the hydration of CO2 andamine dissociation reaction may also occur.
Generally, the reaction of CO2 with primary, secondary andsterically hindered amines is governed by the zwitterion mechan-ism, whereas the reaction with tertiary amines is described by thebase-catalyzed hydration of CO2 [28].
The above mentioned reactions occurring within the liquidphase are clustered in two categories; equilibrium reactions andkinetically controlled reactions. Equilibrium reactions are fastenough reactions to consider that the species are in chemicalequilibrium. Kinetically determined reactions should consider thereaction kinetics. Equilibrium and rate constants (usually given bytemperature dependent correlations) are fundamental parametersof a reactive absorption model, as they lead to the determina-tion of the liquid phase composition. These constants usuallyderive from fitting experimental data or other researchers’ corre-lations. In literature there are various equations for differentsolvents, correlating equilibrium and rate constants withtemperature.
4.6. Absorption column model
Reactive absorption is a complex process making its modelingchallenging. Within a model, a number of assumptions for theabsorption column should be performed in order to simplify the
process. The main common assumptions that most simulations adoptare the following:
� All reactions are performed within the liquid film. The liquidbulk is at chemical equilibrium.
� The column is adiabatic and pressure is constant.� There is plug flow of gas and liquid� The gas and liquid flow rates are constant throughout
the column� The diffusion in the axial direction and the solvent evapora-
tions are negligible.� The interface temperature is equal to the temperature of the
bulk phase.� Ideal phases
4.7. Dynamic modeling
The majority of models refer to steady state conditions. However,the CO2 absorption process should be coupled with the power plant(or other industry) real time operation. In case of biofuels and coal-based power plants, the parameters of the fuel might vary duringoperation leading to fluctuations in flue gas composition [29]. Theeffect of these fluctuations is crucial to be reflected by the model. Adynamic simulation tool can include three factors [30]; optimaldesign of the absorption/desorption column often interferes witheach other, the load variation and the emerging technologies thatmake the process more complex. Dynamic simulation will play apivotal role in identifying any operational bottlenecks at transientconditions for the integrated power and CO2 capture plants. How-ever, as mentioned, the validation of such models is not alwayspossible, as dynamic experimental data are very scarce.
5. Models review
An extensive literature review is included in this section,providing information for a wide range of models examined.
5.1. Rational for this review
During the last decade, an increment of interest on modelingpost-combustion CO2 capture is observed. Numerous researchersdevelop models covering all simulation approaches, differentsolvents, evaluating different parameters aiming to the optimiza-tion of the process and the effective junction with the power plant.Searching literature there are only few attempts to list theseprojects [29,31]. Existing reviews address mainly dynamic model-ing and are providing brief descriptions of the studied models. Thecurrent work attempts to describe in detail and compare in aquantitative approach a number of fundamental models while alsoproviding tables presenting in short more models.
5.2. Chemical absorption models literature review
An extensive literature survey has been carried out, listing anumber of representative prototype models developed byresearchers based on previous work. The current work aims tocover the spectrum of different solvents and modeling approaches.
5.2.1. Steady state modelsAt first, Table 1 encompasses 7 steady state models that are
going to be further described in following. Following, the modelsare further described and tables with main correlations applied arepresented (Tables 2–14).
Equilibrium models, as mentioned before, are not very applic-able as equilibrium is very unlike to be reached. However, arepresentative equilibrium stage model is presented.
I.P. Koronaki et al. / Renewable and Sustainable Energy Reviews 50 (2015) 547–566 551

Mores et al. [32] introduced an equilibrium stage model, inorder to simulate CO2 absorption by MEA solvents and optimizethe operating conditions to remove CO2 from flue-gases in a stagecolumn. The simulation tool determines the optimal operationthrough two factors, given the flue gas composition; the ratiobetween the total absorbed CO2 and the total heating and coolingutilities (exchanger, condenser and reboiler heat duties) and theratio between total absorbed CO2 and the total amine flow-rate.The model assumptions include ideal mixtures, equilibrium stages,neglected solvent vaporization, and two-film model. Mass andenergy balances are applied for each theoretical stage z. Chemicalequilibrium constants are calculated through activity coefficientstaken from Aboudheir et al. [33]. Electrolytes influence is con-sidered applying charge and ionic mass balance in each theoreticalstage. Moreover, thermodynamic non-idealities are expressed viastage efficiencies correlations as a function of liquid physicalproperties and an enhancement factor. In order to optimize theoperations of the absorber the indicator of CO2 removal efficiencyis introduced comparing the CO2 input and output concentrations.
In addition, the effective area of mass transfer is determined, usingequations developed by Onda et al. [34], Wilson [35] and Bravoand Fair [36]. A similar model for the desorber is applied assumingthe same constraints. The stripper model also includes mass andenergy balances corresponding to the condensers, heaters andreboiler. Finally, it considers constraints to compute the Henry’slaw constant, enthalpies, reaction heats, viscosity, vapour pres-sures, fugacity coefficients and surface tension among others.
The developed VLE (vapour–liquid equilibrium) model wasvalidated against simulation results by Austgen and Rochelle [37]and Aboudheir et al. [33]. The CO2 concentration is figured inrelation to the individual species concentrations and partial CO2
pressure. The agreement between the model and literature issatisfactory. The absorber column is validated compared withexperimental measurements from pilot plant [38] and simulationresults using HYSYS process simulator. Results are presented forthe three approaches mentioned before (Onda et al. [34], Wilson[35] and Bravo and Fair [36]) and compared with the experimentaldata and simulation. Temperature, CO2 and vapour flow rate
Table 1Overview of the studied steady state models.
Researcher Modeltype
Solvent Simulatedequipment
Evaluation parameter Experimental data forvalidation
Sensitivity analysis
[Mores et al.[32]]
2 MEA Absorber/Desorber
Total heat duty/CO2
recovery and CO2 recovery/amine solution flow-rateoptimization
Pilot Plant Study at theUniversity of Texas, Austin[Dugas, [38]]
Not performed
[Khan et al.,[41]]
4 MEA Absorber CO2 and MEAconcentrations along thecolumn
Two pilot [Tontiwachwuthikulet al. [43], Aroonwilas and oneindustrial plant [Pintola et al.[44]]
Different correlations for mass transfer coefficients
[Kucka et al.,[49]]
5 Amines Absorber CO2 concentration andtemperature profile
Pilot [Tontiwachwuthikul et al.[43]], and industrial plant[Pintola et al. [44]]
Evaluating different correlations for reaction kinetics
[Bolhàr-Norden-kampf et al.,[52]]
4 MDEA Absorber/Desorber
CO2 and H2Sconcentrations along thecolumn
A commercially operatedselective MDEA plant
Not performed
[Gabrielsenet al. [5]]
4 AMP Absorber CO2 concentration, liquidtemperature along thecolumn
Pilot plant [Tontiwachwuthikulet al. [43]
Performed for different parameters, model sensitiveto surface tension of the liquid solution, the Henry’sLaw constant for CO2, and the diffusivity of CO2 inthe liquid solution
[Puxty et al.,[57]]
5 Amines/Ammmoniamixtures
Absorber Calculated versus measuredCO2 absorption flux
A wetted wall apparatus Not performed
[Al-Baghliet al., [58]]
4 MEA andDEA
Absorber Column stages in order toachieve a specific level ofseparation
Not available Not performed
Table 2Mores model correlations.
Mores model
Parameter Correlation Nomenclature
Species mass balance instage z
Lzþ1xiz–LzxizþVz�1yjz�1–Vzyjz¼0 aiz: activityD: diffusivity of CO2 in MEAΕ: enhancement factor
Energy balance in stage z Lzþ1hz�LzhzþVz�1Hz�1�VzHzþΔHR�ΔHH2O¼0 Gʹ and Lʹ:gas and liquid velocitieskL,G: mass transfer coefficient for liquid and gas phase respectivelyChemical equilibrium
constantsKm ¼∏
iaizð Þvi ¼ ∏
ixizγiz� �vi
kr: forward reaction constantL: liquid molar flow
Stage efficiency ηz ¼ Vzyiz �Vz� 1yiz� 1Vzyniz �Vz� 1yiz� 1
or
ηz ¼ 1�eh=að Þ G'=RTkGρG
� �þ λL'=kLρLE� �� �h i !
z
V: vapour molar flowvi: estequiometric coefficientyn
iz : equilibrium composition of molecular specie considered leaving thestage z
Enhancement factorEz ¼
ffiffiffiffiffiffiffiffiffiffiffiffiffiffiffiffiffiffiffiffiffiffiffiffiffiffiffiffiffiffiffiffiffiffiffiffiffiffiffiffiffiffiffiffiffiffiffiffiffiffiffiffiffiffiffiffiffiffiffiffiffiffiDCO2
kr;CO2�MEA MEA½ �þkr;CO2�OH CO2½ �ð Þp
kL
γiz : coefficient activityλ: stripping factorρ: gas and liquid densities
I.P. Koronaki et al. / Renewable and Sustainable Energy Reviews 50 (2015) 547–566552

profiles are illustrated along the column height. All approachesprovide good predictions for both experimental data and simula-tion results. In specific, for temperature and vapour flow rate thecorrelation of Bravo is in a better agreement with the simulationresults. On the other hand, experimental measurements are betterpredicted by Onda’s equation. The validation of the stripper isperformed using experimental data by Tobienssen et al. [39];Freguia and Rochelle, [40] and Dugas [38]. The paper does notpresent analytical results for the regenerator but the predictionsare in satisfactory agreement with the model simulations.
Following the model validation, a scenario is tested where theoptimal operating conditions in absorber to maximize the CO2
recovery are investigated. The optimization is oriented towardstwo factors: the minimization of total heat duty/CO2 recovery(OF1) and the maximization of CO2 recovery/amine solution flow-rate (OF2). Profiles of these factors optimal values, heating andcooling total utilities, amount of CO2 recovered, CO2 lean loadingand amine solution flow-rates are presented along the columnheight. From these figures it can be seen that the optimal OF1value decreases as the absorber height increases. The same
Table 4Kucka model correlations.
Kucka model
Parameter Correlation Nomenclature
Mass action law Kr ¼∏pxvpp;r γ
vpp;r
∏exvep;r γvep;r
a: specific areaAC: cross-section area of columnDeff: effective diffusion coefficient
Bulk mass balance equations ∂Lxlbi∂z ¼ nlb
i aiAcþ Rlb
i φlAc
F: Faraday’s constanth: molar enthalpyni molar flux of component i
∂Gygbi
∂z ¼ ngbi aiAc
p: product indexq: heat fluxRG: gas constant
Bulk enthalpy balance equations ∂Lhlb∂z ¼ qlf aiAc r: reaction index
R: reaction ratet: total
∂Ghgb∂z ¼ qgf aiAc
γ: activity coefficientsδ: film thicknessη: dimensionless film co-ordinate
Film balance equationsnlft ¼ � clft D
lef f ;i
δ1∂xlf
i∂ηl þxlfi zi
FRGT
∂φ∂ηl
� �þxlfi n
lft
λ: thermal conductivityφ: volumetric hold-up
Pressure drop in the gas bulk ∂p∂z ¼ f ðL;G; ρl; ρg; …Þ
Heat flux through filmsqlf ¼ � λlf
δl∂Tl
∂ηl þPnl
i ¼ 1nlfi h
lfi
qgf ¼ � λgf
δg∂Tg
∂ηg þPng
i ¼ 1ngfi hgf
i
Table 3Khan model correlations.
Khan model
Parameter Correlation Nomenclature
Enhancement factor E¼ 1þ 1
1E1 � 1
� �1:35þ 1
E1 � 11:35
� �h i1=1:35 a: gas–liquid interfacial area per unit volume of packing
where: CAi: CO2 concentration at the gas–liquid interface
E1 ¼ 1þ CBlDBbDAlCAi
; E1 ¼ffiffiffiffiM
p
tanhffiffiffiffiM
p ; M2 ¼ DAlk2CBl
k0l� �2 CBl: MEA concentration in bulk liquid
Rate constant log k2ð Þ ¼ 10:99�2152T
CMEA: MEA concentration
Overall rate of absorption of CO2 rCO2 ¼pCO2
1kg a
� �þ
HCO2k01aE
� � CCO2,g: molar concentration of CO2 in the gas phase
Henry’s constant HCO2 ¼ 10 5:3�0:035CMEA �1140=Tð Þ DAl and DBl: diffusivities of CO2 and MEA in liquid, respectively
Mass balance equation d uzCCO2;g
� �dz ¼ dNCO2;g
dz ¼ SCO2
G: molar flow rate of gas per unit cross-sectional area of the column
Energy balance equations GYCO2CpgdTg
dz ¼ hga Tg�Tl� � Hg: gas phase heat transfer coefficient
LCpldTldz ¼GYCO2Cpg
dTg
dz þG HRþ HSð ÞdYCO2dz
HR: heat of reactionHs: heat of solutionk2: second-order rate constantE: enhancement factorHCO2: is the Henry’s law constant
kg and k0l : the gas- and liquid-film physical mass transfer coefficientsNCO2,g(¼uzCCO2,g¼GYCO2): molar flux of CO2
pCO2: partial pressure of CO2 in bulk gas phaseSCO2: source term representing the overall rate of absorption of CO2
Tg: gas temperatureTl: liquid temperatureuz: gas velocity in the axial directionYCO2: mole ratio of CO2 in the gas phase
I.P. Koronaki et al. / Renewable and Sustainable Energy Reviews 50 (2015) 547–566 553

Table 6Gabrielsen model correlations.
Gabrielsen model
Parameter Correlation Nomenclature
Molar flux of CO2 NCO2aAc
1 ¼ L1dxBdz ¼ L
1dxH2Odz
L�1
dXCO2dz
a: specific wetted area for mass transfer
Stoichiometric relations for the chemical reaction dGdz ¼ � NCO2 þNH2O
� �aAc AC: cross-sectional area of the column
dyCO2dz ¼ NCO2
aAc yCO2 �1� �
þNH2OyCO2 aAc
GC0AMP : concentration of AMP in the bulk liquid
dyH2Odz ¼ NH2O
aAc yH2O �1� �
þNCO2yH2OaAc
GCinfCO2
: concentration of molecular CO2 at the liquid interphase
dLdz ¼ �NCO2aAc k2: rate constant
dxCO2dz ¼ NH2O
XCO2� NCO2
� �aAc
L
KCO2 :combined Henry’s Law and chemical equilibrium constant for
dxH2Odz ¼ NH2O
xH2O �1� �
NCO2
� �aAc
L
CO2 partial pressureDi,L: diffusivity of component i in the liquid
dTGdz ¼ � qaAc
GCp;GNCO2: molar flux of CO2
dTLdz ¼ NCO2
Cp;CO2þNH2O
Cp;H2O
� �aAc TL � TGð Þ
LCp;L
�qaAc
LCp;LþNCO2ΔHCO2 þNH2OΔHH2O
LCp;L
q: heat flux
Enhancement factorE¼
ffiffiffiffiffiffiffiffiffiffiffiffiffiffiffiM E1 � E
E1 � E1
qtanh
ffiffiffiffiffiffiffiffiffiffiffiffiffiffiffiM E1 � E
E1 � E1
q� � XCO2: mole fraction of chemically bound CO2 in the bulk of the liquid phase
where: ΔHH2O: heat of condensation of H2O
E1 ¼ 1þ DAMP;LC0AMP
2DCO2 ;LCinfCO2
� �, M¼ k2DCO2 ;L
C0AMP
k2L;CO2
ΔHCO2: heat of absorption of CO2
Equilibrium partial pressure pn
CO2¼ KCO2XCO2
θ1� θð Þ θ: loading, mole CO2/mole initial amine
Heat of absorption ΔΗCO2 ¼ R �8161þ47652θΤ
� �
Table 7Puxty model correlations.
Puxty model
Parameter Correlation Nomenclature
Differential equations ∂ci∂t ¼ Di
∂2ci∂x2 �ri ci: the concentration of species i
DCO2;W ;DN2O;W :respective diffusion coefficients of CO2 and N2O in waterAveraged CO2 flux across the gas-liquid interface N ¼ �DCO2te
R te0
∂cCO2∂x dt DCO2; Am , DN2O;Am: respective diffusion coefficients of CO2 and N2O in an aqueous amine
solutionRatio of diffusion coefficients between N2O and CO2inwater
DCO2; Am ¼ DN2O;AmDCO2; WDN2O;W
N: the time averaged fluxri: the rate of formation or destruction of i by chemical reactionx: the distance from the gas-liquid interface
Table 5Bolhàr�Nordenkampf model correlations.
Bolhàr�Nordenkampf model
Parameter Correlation Nomenclature
Overall mass and energy transfer rates through the interfacial area onstage k of the column
Ni;k ¼ yi;kþ1Vkþ1�yi;kVk ¼ aint;kNVi;k
aint:the interfacial area
Ek ¼Hkþ1Vkþ1�HkVk H: specific enthalpyMole fractions and at the vapour–liquid interface Hi;k ¼
yli;kxli;k
Hi: Henry-coefficient of component i
Enhancement factor ECO2 ¼ 11� 1
E1Ha3=2
þ 1E13=2
� �2=3E1 :enhancement factor for infinite fast reaction
Film thickness δ¼ffiffiffiffiffiffiffiffiffiffiffiffiffiffiffiffiffiffiffiffi
3wηL
aintρLg sin2ψ
3q
, w¼δ � aint �u � sin ψ Ha: Hatta numberNi: molar flux of component iu: the average liquid film velocityV: vapour flowψ the angel of the inclined plane in reference to thehorizontal plane
I.P. Koronaki et al. / Renewable and Sustainable Energy Reviews 50 (2015) 547–566554

approach is followed aiming to OF2 optimization, concluding thatoptimal OF2 and amine flow-rate increase with the increasing ofthe absorber height. Finally, higher total heating and coolingutilities are needed to reach the maximum CO2 recovery whenthe absorber height is increased.
Khan et al. [41] developed a typical, simple steady state rate-based model simulating CO2 absorption by MEA solvent, usingtheoretical column stages. The developed model was validatedcompared with two pilot columns [42,43] and one industrialcolumn [44]. The model applies the two film theory and uses anenhancement factor to consider the reaction kinetics. The overallsecond order reaction rate is calculated through CO2 and MEAconcentrations as this approach is valid [45] and the rate constantcorrelation was taken from [46]. The overall CO2 absorption rate iscalculated through Levenspiel [47] correlation and it is correctedthrough the enhancement factor. Gas and liquid–film mass trans-fer coefficients and the interfacial area for random packings areobtained from the widely used correlations provided by Onda et al.[34]. A number of semi-empirical correlations that relate CO2
diffusivity to temperature and viscosity are used. Henry’s constantwas used in order to calculate the solubility of CO2 in MEAsolutions as a function of MEA concentration, CMEA, and solutiontemperature. Column assumptions include steady-state and adia-batic operations, plug-flow of gas and liquid, negligible diffusion inthe axial direction, constant gas and liquid flow rates throughout
the column, negligible evaporation of solvent and constant pres-sure. Mass and energy balance equations were solved for differentheights of the absorption column to calculate CO2 concentrationprofile along the column.
The comparisons of simulation predictions with the experi-mental data showed the following: for Tontiwachwuthikul pilotplant (random packing), overall agreement between the predictionand measurement is satisfactory for CO2 and MEA concentrationalong the column. The CO2 concentration is slightly underpre-dicted for the bottom part of the column and for MEA over-predicted respectively. However, this part is crucial as predictionresults showed that the major absorption process takes place inthe bottom part of the column as the concentrations decreaserapidly. In addition, in these areas, the predicted solvent tempera-ture deviates from experimental data. This deviation is accordingto the authors due to the neglection of the solvent evaporation inthe energy balance. The temperature profile confirms that themain exothermic absorption occurs in the same column heights, asa rapid temperature drop is predicted. The predictions are also in avery good agreement with experimental data for Aroonwilas pilotplant (structured packing). For the industrial plant experimentaldata were not available. Predictions were only validated againstthe CO2 exit concentration with very good results.
A sensitivity analysis is also performed using different correlationsfor mass transfer coefficients. The correlations for the gas– and
Table 9Overview of the studied dynamic models.
Researcher Modeltype
Solvent Simulatedequipment
Evaluation parameter Data for validation Sensitivityanalysis
[Kvamsdalet al.,[30]]
4 MEA Absorber Temperature profile along the column, effect ofdisturbances on temperature and absorption rate
Pilot Plant from Separation ResearchProgram (SRP) at the University of Texas atAustin [Dugas, [38]]
Notperformed
[Ghaemiet al.[61]]
4 Partiallycarbonatedammonia
Absorber Temperature profile along the column, CO2 concentrationacross the film
Absorption column pilot plant Notperformed
[Kenig et al.[15]]
5 Aqueousammonia
Absorber Dynamic and steady concentration profiles in thediscretized liquid film, axial profiles of the mass transferand reaction rates
Pilot plant of the coke plant AugustThyssena in Duisburg, Germany.
Notperformed
[Harunet al.[63]]
4 MEA Absorber/Desorber
L/G ratio, CO2 absorption, CO2 loading, gas flow rate in thestripper
Simulation results from Aspen Plus Notperformed
[Jayarathnaet al.,2013]
4 MEA Absorber Time dependency of temperature profiles, CO2 loading, CO2
removal efficiency, re-boiler heat dutyPilot Plant Study at the University of Texas,Austin [Dugas, [38]]
Notperformed
[Lawal et al.[70]]
5 MEA Absorber/Desorber
Temperature profiles along the column height, water massfraction, lean loading, CO2 capture level, reboiler dutythrough time
Pilot plant of Separations ResearchProgram at the University of Texas atAustin
Notperformed
Table 8Al-Baghli model correlations.
Al-Baghli model
Parameter Correlation Nomenclature
Enhancement factor E¼ �DiðdCi=dzÞj z ¼ 0þ ri j z ¼ 0kl ðCi; int �Ci;blkÞ
Ci,int and Ci,bulk the interfacial and bulk molar concentration of the solute gasDi is the diffusivity of solute gas i in the liquidFlux of the solute gas Ni;z ¼ Vinyi;in�Voutyi;out ¼ kg;ia Pi;out�Pi;int
� �¼ k0l;iaEi Ci;int� Ci;bulk
� � kg,i and kl,i: gas and liquid phase physical mass transfer coefficients of the solute gas i
Overall rate of absorption of CO2 For MEA
�rCO2 ¼ kCO2CCO2CRR0NH�kCO2KAm
CRR0NH2 þCRR0NCO2�CRR0NH
Pi,int the interfacial partial pressure
For DEA ri |z¼0 the rate of surface reaction at the edge of the liquid film�rCO2 ¼ kH2OCH2Oþ kRR0NHCRR0NH
CCO2CRR0NH�
CRR'NH2
þ CRR0NCO2�
KAmCRR0NH
( ) R¼C2H4OH, Rʹ¼H for MEAandR¼Rʹ¼C2H4OH for DEA
I.P. Koronaki et al. / Renewable and Sustainable Energy Reviews 50 (2015) 547–566 555

liquid–film mass transfer coefficients given by Onda et al. [34]provide better predictions than the penetration theory of Higbie[18] and the correlation of Bravo et al. [48].
Kucka et al. [49] introduced a rigorous rate-based model tosimulate CO2 absorption by aqueous MEA solvents. Two types ofreactions are considered, namely the kinetically controlled reac-tions and the instantaneous. In order to consider instantaneousreactions, the mass action law based on species activities isapplied. Chemical equilibrium constants and reaction constantsare obtained from literature via activity based correlations. For-ward and reverse reaction constants lead to the reaction rate
calculation. Contrary to the majority of models using an enhance-ment factor, this model considers mass and heat transfer resis-tances according to the film theory by explicit calculation of theinterfacial fluxes. The influence of electrolytes is also included,correlating the film equations with reaction and diffusion kinetics.The reaction rates are implemented as terms into the masstransfer equations describing film phenomena and into the bal-ances describing liquid and bulk behavior. Bulk and liquid balanceequations are solved as well as correlations for enthalpy balanceand pressure drop in the gas bulk phase. In addition, mass transferphenomena across the interface are described by Maxwell–Stefan
Table 11Ghaemi model correlations.
Ghaemi model
Parameter Correlation Nomenclature
Dynamic mass balance equations ddtUi;j ¼ 1
Δz Lj�1xi;j�1�Ljxi;j� �þ nB
i;jalþRB
Li;jφL
� �A a: specific packing surface
ULi;j ¼ xi;jULt;j ¼ xi;j φLcLt;jA� �
A: cross sectional area
0¼ 1Δz Gj�1ys;j�1�Gjys;jh i
þ nBs;ja
lþRBGi;jφG
� �A E: specific energy holdup
h: molar enthalpyDynamic energy balance equations dEL
dt ¼ � 1Δz Lj�1h
BL;j�1�Ljh
BL;j
h iþ qBL a
lþRBLφLΔΗo
RL
� �A
0¼ � 1Δz Gj�1h
BG;j�1�Ljh
BG;j
h iþ qBGa
lþRBGφGΔΗo
RG
� �A Ha: Hatta number
Heat transfer rateqgf ¼ � λgf
δgfTi�Tgb� �
þ Pmi ¼ 1
ngfi hgfi
N: interfacial molar flux
qlf ¼ � λlf
δlfT lb�Ti� �
þ Pmi ¼ 1
nlfi h
lfi
Molar concentration across the filmC ξ; tð Þ ¼ P1
n ¼ 1e� Qn½ �t sin nπξð Þαnþ
P1n ¼ 1
R t0 e
� Qn½ � t� τð Þf n τð Þdτh i
sin nπξð ÞþCl tð Þþξ CB tð Þ�Cl tð Þh i
q: heat flux
Enhancement factor E¼ffiffiffiffiffiffiffiffiffiffiffiffiffiffiffiffiffiffi1þ Ha2
p; Ha¼
ffiffiffiffiffiffiffiffiffiffiffiffiffiffiffiffiffiffiffiffik2DCO2
NH3½ �p
kL
R: reaction rateU: spedific molar holdup
δ: film thicknessφ: volumetric holdup
Table 10Kvamsdal model correlations.
Kvamsdal model
Parameter Correlation Nomenclature
Mass balance equations εgdCg
idt ¼ �Cg
i∂ug∂z �ug
∂Cgi
∂z �ag=lNiag=l :gas–liquid interfacial area
εldCl
idt ¼ �ul
∂Cli
∂z þag=lNiCn
MEA :liquid concentration of free MEA
Heat balance equations εgdTg
dt ¼ �ug∂Tg∂z þ
ag=lP CiCpi� �
ghg=l T l�Tg� � εg ; εl :gas and liquid holdup
εldTg
dt ¼ �ul∂Tl∂z þ
ag=lP CiCpi� �
l
hg=l T l�Tg� ��ΔHrNCO2 �ΔHvapNH2O�Hout Tl�Tambð Þ� � hg=l : interfacial heat transfer coefficient
Species molar flux Ni ¼ Ktot;i Peq;ni �Pg
i
� �Ktot;i : total mass transfer coefficient
Enhancement factorECO2 ¼
ffiffiffiffiffiffiffiffiffiffiffiffiffiffiffiffiffiffiffiffiffiffiffiffikr;CO2 C
n
MEADCO2
pklCO2
kr;CO2 : reaction rate coefficient for the reaction of CO2 with the aqueous MEA
CO2 equilibrium pressure Peq;nCO2
¼HE;CO2Cltotx
f reeCO2
γCO2Ni : flux of component i
Equilibrium pressure of MEAand H2O
Peq;ni ¼ xiγiPi Peq;n
i : Equilibrium pressure
Pgi : partial pressure of
each component
ug ; ul : gas and liquid velocitiesΔHr : heat of absorption of CO2
ΔHvap : Heat of vapourization of H2OHout : heat transfer coefficient for heat transferred from the absorber to thesurroundings
xf reeCO2: free CO2 mole fraction at equilibrium coefficient
γ: activity coefficient
I.P. Koronaki et al. / Renewable and Sustainable Energy Reviews 50 (2015) 547–566556

equations, assuming local electroneutrality and neglecting diffu-sion interactions. Through these equations the two film compo-nent fluxes and the heat flux are determined. e-NTRL model isused to describe thermodynamic non-idealities in the liquid phaseand for the gas phase the Soave–Redlich–Kwong equation of state[50]. In order to simplify calculations, discretization of the filmregion is performed, dividing it to several balance regions. The
model was validated using two experimental data sets by Tonti-wachwuthikul pilot plant and one data set from an industrialplant. For the first occasion, the influence of the number of axialsegments on the gas composition is calculated, showing that theminimum number of axial segments which provides results ofsufficient accuracy for both data sets is 15. Gas phase compositionand liquid phase temperature profile are presented along the
Table 13Kenig model correlations.
Kenig model
Parameter Correlation Nomenclature
Mass balance equations for liquid and gas phases ∂∂tU
lbi ¼ � ∂
∂z Lxlbi� �þ nlb
i aiþRlb
i φliq
� �Ac
ai: specific gas-liquid interfacial area
0¼ ∂∂z Gygbi� �
þ ngbi aiþRgb
i φgas
� �Ac
Ac: column cross section
Driving force di ¼ xlfiRT
1δlf
dμidη þxlfi zi
FRT
1δlf
dφdη
ni molar flux of component i
Film balance equationsnlft ¼ � clft D
lef f ;i
δ1∂xlf
i∂ηl þxlfi zi
FRGT
∂φ∂ηl
� �þxlfi n
lft
Ri: total component reaction rate
Reaction kineticsr3 ¼ k3ðTÞ cCO2 cNH2 � 1
Keq3cH2NCOO� cH3O
þ
� �RG: gas constantU: specific molar holdupδ: film thicknessη: dimensionless film co-ordinateφ: volumetric hold-up
Table 12Harun model correlations.
Harun model
Parameter Correlation Nomenclature
Molar balance for the twophases
dCi;g
dt ¼ � ∂Ci;gug
∂z �ag=lNiag=l: specific gas-liquid interfacial area
dCi;ldt ¼ �ul
∂Ci;l∂z �ag=lNi
A: cross sectional area
Energy balance for the twophases
∂Tg
∂t ¼ �ug∂Tg
∂z þhglagl Tl �Tgð ÞP Ci;gCp;i
Ci;g ;Ci;l: the molar concentrations of component i in gas and liquid phases
∂Tl∂t ¼ �ul
∂Tl∂z �
aglP Ci;lCp;i
hgl T l�Tg� ��ΔHrxnNCO2 �ΔHvapNH2Oþhout ðTl�TambÞ
� � Cn
CO2: molar concentration of CO2 at the liquid side interface
Rate of mass transfer 1Kg;i
¼ 1kg;i
þ Hikl;iE
Cp;metal : tube metal specific heat capacity
Enhancement factorsEabs ¼
ffiffiffiffiffiffiffiffiffiffiffiffiffiffiffiffiffiffiffik2C
n
MEADCO2
pkl;CO2
Cn
MEA:liquid molar concentration of free MEA
Estr ¼ 1þDMEACOO�
DCO2
ffiffiffiffiffiffiKeq
pCMEA
1þ2DMEACOO�
DCO2
ffiffiffiffiffiffiffiffiffiffiffiffiffiKeqC
n
CO2
p� � ffiffiffiffiffiffiffiffiCn
CO2
pþffiffiffiffiffiffiffiffiCCO2
p� � D: diffusivity
Reboiler balance equations dMi;rebdt ¼ Finxi;in�Fvyi;out�Flxi;out Dc: diameter of the column
dErebdt ¼ FinHin�FvHv�FlHlþQreb
Eh;x: volumetric specific internal energy
Mi;reb ¼ π4d
2c LBρmxi Ereb : energy holdup
Ereb ¼ π4d
2c LBHlρm F: molar flowrate
Heat exchanger equations For tube and shell: hgl:interfacial heat transfer coefficientdEh;xdt ¼ � 1
AL∂Q∂z þQf lux
2r
kg;ikl;i:mass transfer coefficients
QTube;f lux ¼UTube Tmetal�Ttubeð Þ k2: second order reaction orderQShell;f lux ¼ ntubeUShell Tmetal�TShellð Þ L: tube lengthFor tube metal: LB: liquid level of reboiler drum
mmetal ¼ Cp;metaldTmetal
dt ¼ L �QTube;f lux�QShell;f lux
ntube
� �Mi;reb : molar holup
mmetal ¼ Lρmetalπ4 d2o;tube�d2i;tube� �
Ni: molar flux of the component iq: interfacial heat transferQ: energy flow rateQf lux : heat fluxQTube;f lux ; QShell;f lux :heat flux from tube wall to tube and from tube wall to shellTamb: ambient temperatureTmetal; Ttube ; TShell : tube metal temperature, tube fluid temperature and shellfluid temperatureug ;ul: gas and liquid velocitiesUTube; UShell : overall mass transfer coefficient of the tube and shellρm : molar densityρmetal : tube metal density
I.P. Koronaki et al. / Renewable and Sustainable Energy Reviews 50 (2015) 547–566 557

column. The agreement was satisfactory for both parameterscompared with the experimental data. Validating the modelagainst industrial experimental measurements, results are also ina very good agreement compared with methods with enhance-ment factors. Finally, a sensitivity test was conducted, applying3 approaches for reaction kinetics from literature (12, 46 and 51).The first two approaches provide almost identical results for thegas phase composition profile, in comparison with Danckwertsthat leads to an underestimation of the column height of 15%.
Bolhàr-Nordenkampf et al. [52] developed a predictive tool forMDEA gas scrubbing processes, modifying Aspen plus RATEFRACalgorithm. The model is validated compared with a commerciallyoperated selective MDEA plant in Germany. The approach of stagesis adopted as calculations are made tray by tray and two-filmtheory is considered for the mass transfer phenomena. The overallmass and energy transfer coefficient rates are calculated throughKhrishnamurthy equations. Henry’s law is used to calculate themole fraction at the vapour–liquid interface. Mass transfer coeffi-cients for the two phases are determined through Maxwell–Stefanequations. Within the same work a prediction model for deso-rption was developed too. Desorption was simulated through anequilibrium stage model. Equilibrium models are applicable for thestripper as there are high temperatures and therefore high“equilibrium like” reaction rates. Considering the reaction kinetics,certain reactions are considered as very fast and are described byequilibrium constants and others’ reaction rates are taken fromliterature provided in a table in the paper. In order to describe thereaction kinetics, an enhancement factor by Danckwerts equationswas used in order to correlate the physical mass transfer coeffi-cients with the actual reactive transfer coefficients. Predictions forabsorption were obtained for two packing heights using thedeveloped model and an equilibrium commercial tool. The devel-oped model predicts the measured H2S values far better (21 ppmaverage deviation) than the equilibrium approach (88 ppm aver-age deviation) simulation and gives comparable results for the CO2
values (Non-equilibrium: 0.22 vol.%; TSWEET: 0.28 vol.% averagedeviation).
A rate based model studying aqueous solution of 2-amino-2-methyl-1-propanol (AMP) which is a sterically hindered aminewas developed by Gabrielsen et al. [5]. The model aims to predictthe solubility of CO2 in AMP aqueous solutions as well as theabsorption heat a function of loading and temperature. Thefollowing assumptions were considered in order to model thepacked column: two film theory, reactions only within the liquidfilm, constant temperature between the interface and the liquidbulk, neglected axial dispersion and solvent evapouration, adia-batic conditions and ideal phases.
Mass and energy balances are calculated through mass transfercoefficients and an enhancement factor in order to take intoaccount the reaction influence. Mass-transfer coefficients and thespecific gas–liquid interfacial area are calculated using correlationsfrom Billet and Schultes [53]. The enhancement factor is calculatedusing the expression proposed by van Krevelen and Hoftijzer [54].The model assumes a liquid phase ideality and uses one chemicalequilibrium reaction to consider nonidealities combined Henry’sLaw and equilibrium constant. Using chemical equilibrium con-stant, partial pressure of CO2 can be determined through thevapour–liquid equilibrium (VLE) model for aqueous solutions ofalkanolamines, presented in Gabrielsen et al. 2005 [55], as afunction of CO2 loading. This correlation gives satisfactory resultsfor the partial pressure over the loading range and temperaturesconsidered, compared with experimental data from Tontiwach-wuthikul et al. [1992] including concentration and temperatureprofiles along the column. In addition, the heat of absorption ofCO2 in the AMP solution (HCO2) was calculated, using the Gibbs–Helmholtz equation [55]. However, there were no experimentaldata available to verify the model predictions.
Reaction kinetics is modeled assuming the zwitterion mechan-ism and using a correlation for the rate constant by Saha [56].Finally, prediction data are compared with experimental, for
Table 14Jayarathna model correlations.
Jayarathna model
Parameter Correlation Nomenclature
Columns balance equations ∂clj:Col∂t ¼ ul
Colλ
∂clj:Col∂zCol
þ1λn
0″j:Col;trans
U
þn″j0 :Col;gen0
C: specie concentration
∂Cvj:Col
∂t ¼ � uvColð1� λÞ
∂cvj:Col∂zCol
þ 1ð1� λÞn
″j0 :Col;trans0
Ej: enhancement factor
∂TlCol∂t ¼ ul
Colλ
∂TlCol
∂zColþ hovAw Tv
Col �TlCol
� �λC3 l
p:Col
Pn
j ¼ 1clj;Col
þn0″CO2;Col; transð�ΔH
3absÞ
U
λClp;Col
Pnj ¼ 1 c
lj;Col
þ
Pnj ¼ 1 n
0″j;Col; trans �ΔH
3vap:j
� �λCl
p;ColPn
j ¼ 1 clj;Col
∂TvCol∂t ¼ � uv
Colð1� λÞ
∂TvCol
∂zCol�hovAw Tv
Col �TlCol
� �ð1� λÞ
P cvj:ColCvp:j:Col
�
Hj: Henry’s law coefficient
Condenser equations dZlRD
dt ¼ 1ARDρl
_mlRD;In�ρl _V
lRD;Out
� �Kvj : local gas side mass transfer coefficient
dclj:RDdt ¼ 1
ARDZlRD
_nlj:RD:In�
clj:RDρlml
RD;In
� �ml
RD;In :mass flow rate of liquid into the reflux drum
Reboiler equations _QRB ¼mlRB;InC
lpΔΤRBΔHrþ
P_nvj:RBΔ ~Hvap:j
� � QRB: reboiler heat duty
Buffer tank equations dZlBT
dt ¼ 1ABT ρl
_mlBT ;In�ρl _V
lBT ;Out
� �rr: vector with overall reaction rates as elements
dclj:BTdt ¼ 1
ABT ZlBT
_nlj:BT ;InþABTZ
lBT _n
0″j:BT ;gen
� �� clj:BT
ρl_mlBT ;In
u: velocity
dTlBT
dt ¼P
_nlj:BT ;In
~Clj:BT ;In
� �TlBT ;In �Tl
BT
� �P clj:BTABT ZlBT
~Clp;j
� ��Pr
m ¼ 1�Δ ~H
lr;m
� �rm
� �P clj:BT~Clp;j
� � v: is the stoichiometric matrix
Overall mass transfer coefficient KovCO2
¼ 1
1=KvCO2
� �þ HCO2
=ECO2 KlCO2
� �� � ΔHAbs, ΔHVap, ΔHr heat of absorption, vapourization,reaction
Rate of generation of specie j inthe liquid phase
_n0″gen ¼ vT rr λ: liquid hold up c, h cold, hot l,v: liquid, vapour
RD: reflux drum ov: overall value ‘”: per volume gen,trans: generation, transfer
I.P. Koronaki et al. / Renewable and Sustainable Energy Reviews 50 (2015) 547–566558
concentration profiles, liquid temperature profiles and liquidloading in different column heights. The results derived were verygood for the CO2 concentration in both gas and liquid phases,although the liquid temperature is slightly overpredicted at thebottom of the column. Sensitivity analysis was also performed,concluding that the model is most sensitive to the surface tensionof the liquid solution, Henry’s Law constant for CO2, and thediffusivity of CO2 in the liquid solution.
Another steady state model was introduced by Puxty et al. [57]describing CO2 mass transfer in amine/ammonia single systems ortheir mixtures. This model was developed from scratch in Matlab andwas validated against experimental measurements from a wetted-wallapparatus. Model assumptions include neglected axial dispersion andheating effects, constant physical properties, two-film theory. Thesystem of partial differential equations to be solved is defined bysecond Fick’s law considering also reaction rates. The reaction kineticsvary as described in the previous model from fast to kineticallycontrolled reactions. The rate and equilibrium constants were takenfrom published data and corrected through activity coefficients. Thediffusion flux was calculated by the first Fick’s law for different heightsof the column.
The results from single systems are combined in order topredict the mixtures results. Thus, complex reactions are notinvolved. Single systems are solvents of monoethanolamine(MEA) piperazine (PZ) and ammonia (NH3). Mixtures studies arePZ�AMP and PZ�NH3 where PZ is used as a promoter. For singlesolvent systems, agreement between predictions and experimen-tal data for calculated versus measured CO2 absorption flux, is verysatisfactory. In particular for aqueous ammonia the data scatteringincreases with temperature due to the high volatility thatincreases the uncertainty of ammonia concentration in the liquid.For mixtures studied, the excellent agreement of predicted andmeasured values proves that behaviour of these mixtures can berepresented by individual component systems.
Al-Baghli et al. [58] introduced a steady state, rate-based modelapplicable forMEA and DEA solvents. Solubility of both CO2 and H2S isstudied. Two-film theory and stages approach is applied. The modelconsiders that reactions take place entirely within the liquid film andthe phases are ideal. The liquid and the gas leaving a tray have thesame temperature and composition as the liquid and the gas on thetray. Physical equilibrium of the interface is expressed through Henry’slaw. This model also uses the enhancement factor to describe thereaction kinetics. The enhancement factor was calculated through asystem of five nonlinear differential equations governing diffusion andreaction in the liquid film. Moreover, the Kent�Eisenberg equationsare used to calculate the concentrations of the species in the liquidbulk. The reaction rates are determined through the Danckwertsapproach. In addition, the heat of absorption is predicted for the twosolvents, using correlations for enthalpy and different temperatures.Tray hydraulics and to obtain the tower diameter, tray spacing, weirheight, and pressure drop across the trays were obtained by Econo-mopoulos algorithm. It was observed that MEA, as expected, requiresfewer stages than DEA in order to achieve a specific level of separation.In addition, the profile of the enhancement factor for both MEA andDEA is presented showing that for CO2 the factor increases mildly aswe approach the top of the tower, while for H2S the factor increasessharply until its concentration is almost zero and then starts decreas-ing until the top stages of the tower. Finally temperature profile of thegas or liquid along the tower is presented reflecting as expected theabsorption heat transfer phenomena.
5.2.2. Dynamic modelsA respective analysis follows for the dynamic models studied
within this work. At this point, should be noted that sensitivityanalysis mentioned below, refers to a specific analysis taking into
account the impact of many parameters. The following dynamicmodels test different disturbances for the system, but do notperform a ‘sensitivity analysis’ as it is defined.
Kvamsdal et al. [59] developed one of the first dynamicapproaches simulating CO2 absorption by MEA solvents, usinggPROMS tool for model development. The initial tool was firstlyintroduced on 2008 and was validated only against steady statedata from a MEA campaign at the University of Texas at Austin(UT). In a subsequent work [30], the simulation tool was validatedcompared with experimental results both for steady (from thepilot plant at UT) and transient conditions (from a pilot plant atNTNU/SINTEF). In the context of the same work differentparameter-correlations are studied and compared. The developedsimulation tool tests two scenarios for dynamic operation: start-up and load reduction. The model applies the following assump-tions for the wetted column: plug flow, axial differential mass andenergy balances for both gas and liquid phases, linear pressuredrop, ideal gas phase, two film theory, no accumulation in gas andliquid films, thermal equilibrium between the liquid and packingmaterial, condensation of water vapour occurs at gas-liquid inter-face as well as at the walls and effective contact area is equal to thespecific area of the packing material. Heat and mass balances aresolved for the bulk phases. All the mass transfer coefficients aredetermined by correlations given by Onda et al. [34]. An enhance-ment factor is used to describe the reaction influence on masstransfer. The reaction rate coefficient is based on data from Freguiaand Rochelle [40] and is corrected through the activity coefficients.An equilibrium speciation [60] model is used to determine the freeCO2 mole fraction at equilibrium, the activity coefficient and theconcentration of free MEA and Wilson equation for the activitycoefficients of MEA and H2O. The equilibrium pressure of species iscalculated through activity coefficients. The physical propertiesrequires, are obtained by literature.
Firstly, steady state validation of the tool was performed,against experimental measurements by Separation Research Pro-gram (SRP) at the University of Texas at Austin. The temperatureprofile deriving from the model agrees with the measurements,with more satisfactory agreement with specific tests.
In following, a dynamic analysis is performed, testing twoscenarios: the change in liquid and flue gas flow rate during thestart-up and the load reduction cases. For the first case, the liquidtemperature profile during start-up is provided, showing that theT bulge location changed from the bottom of the column to the topas the flue gas flow rate increased and the L/G thereby decreased.Moreover, a decrease of the absorption rate values is observed. Forthe second scenario, the upstream cooling tower and the blowerwere also considered in a very simplified approach. In addition,load reduction considered two cases; a reduction in load orexhaust gas flow rate, without changing the liquid flow rate anda decrease of the liquid flow rate such that the final removal ratewas the same as before the gas flow rate reduction.
Ghaemi et al. [61] developed a rate-based model to simulatecarbon dioxide absorption by partially carbonated ammonia solu-tions. The tool applies the two film theory and assumes 100 stagesand ideal mixtures. Mass and energy balances equations are solvedfor each stage. To describe axial temperature profiles, energybalances are modified including the product of the liquid molarholdup and the specific enthalpy as energy capacity. In addition,heat transfer rate is determined. The species concentration iscalculated through an initial boundary value problem consideringunsteady-state mass and heat transfer. Diffusion in the interface isdescribed by Maxwell-Stefan equations. Within this work theinterfacial compositions are determined through equations basedon the semi-empirical Pitzer equation. Mass transfer coefficientsare taken from Onda [34] and physical properties are obtained byliterature. Reaction kinetics considers reaction between CO2 and
I.P. Koronaki et al. / Renewable and Sustainable Energy Reviews 50 (2015) 547–566 559

water, reaction between CO2 and hydroxyl ions and reactionbetween CO2 and NH3. The overall rate of reaction is the summa-tion of the aforementioned reaction rates. Rate constants as afunction of temperature, are taken from Danckwerts andSharma [51].
The simulation tool was validated against pilot plant experi-mental data deriving from steady state measurements. Dynamicmodel equations are solved both with analytical and numericalmethods. The CO2 concentration was calculated in relation to thefilm coordinates from 0.0001 to 0.1 s. The results vary with timeand justify the need for dynamic simulation. At first some steadystate results are presented. The CO2 concentration in relation tothe film coordinates is presented for steady state conditions,calculated both through the dynamic model and by using anenhancement factor from literature [62]. The use of the enhance-ment factor leads to an important relative error compared withthe numerical solution. In addition gas mole fractions over thecolumn height are presented. CO2 mole fraction decreases alongthe column height due to its absorption, whereas NH3 and H2Oconcentrations increase as a result of mass transfer from liquidphase to the gas. Moreover, temperature profile along the columnis given, showing that temperature increases along the column, asexpected for an exothermal process. In order to determine dyna-mically the overall CO2 concentration in the liquid as a function oftime and stage, both dynamic and enhancement factor approacheswere applied. The same approach is followed for the temperatureprofiles. The researchers use the relative deviation to compare thetwo models. As proved, the enhancement factor leads to higherdeviations almost for all parameters measured.
Another dynamic approach to the CO2 absorption by MEA wasproposed by Harun et al. [63], based on the work by Kvamsdalet al. [59]. The absorption column was discretized in a number ofstages and the two film theory is applied. Mass and energy balanceequations are applied for each stage and each component for thetwo phases. A correlation for the rate of mass transfer is used,including an enhancement factor to consider reaction kinetics.Different equations for the enhancement factor of the absorberand the stripper are provided.
Moreover, the reboiler is modeled using a simple equilibriumstage model. P-T flash calculations were used to determine thecompositions of vapour and liquid phases, at given pressure,temperature and overall compositions. In following, the heatexchanger is simulated developing a mathematical model, con-sidering it as a counter-current shell and tube heat exchanger. Thismodel describes the heat exchanged between the hot lean aminesolution and the cold rich amine solution coming from stripperand absorber, respectively. The simulation tool was validatedagainst steady state data. For the absorber, experimental measure-ments by Lawal et al. [64] were used. By the results it is shownthat the model slightly underpredicts the temperature profilealong the column. The stripper model was validated comparingthe results with simulation data from Aspen plus Radfrac model. Inthis case, temperature for different column heights is overpre-dicted by the developed model. The simulation results for thereboiler and heat exchanger present satisfactory agreement withthose obtained with Aspen Plus.
Dynamic simulations were conducted using a partial loadreduction scenario. The case study assumes a reduction of 50% inthe flue gas flow rate in relation to the initial steady state value.The liquid to gas ratio (L/G) was calculated through time, con-cluding that increased as the flue gas flow rate decreased linearly.This is justified as the lean flow rate remains constant since thestripper heat duty is the same. The CO2 loading decreased withtime. In addition, the percentage of CO2 absorbed significantlyincreased during the test. This is due to the correspondingreduction in CO2 available to react with free amine in the absorber.
Finally, it is observed that gas flow rate of CO2 in the stripper wassignificantly reduced during the ramp test.
Kenig et al. [15] based on the steady state model described in theprevious section [49] developed a dynamic model simulating CO2
absorption by aqueous ammonia solvents. Mass balance equationsfor the bulk phases include molar holdup terms due to dynamicnature of the model. However, gas hold-up is neglected. For the filmregion, mass transfer phenomena are reduced to a steady stateproblem. The effect of electrolytes is described via the electricaldriving force and the diffusion phenomena using Nernst Planckequations and assuming local electroneutrality. The thickness of thefilm region is determined by empirical mass transfer coefficientcorrelations. The model is validated simulating an innovative pur-ification processes called ammonia hydrogen sulphide circulationscrubbing (ASCS). The rate of the direct reaction between carbondioxide and hydroxyl ions (the most important reaction) is given byAstarita, Savage and Bisio [65]. In addition, the reaction kinetics ofNH3 and CO2 has been considered in the model equations. Thedeveloped model was compared with experimental data from ASCSsidestream of the coke plant ‘August Thyssena’ in Duisburg, Germany.Concentration profiles in the discretized liquid film are presented.The interfacial molar fluxes are provided both using Mazwell�Stefanequations without considering the electrical force and using NernstPlanck equations. Fluxes calculated with the effective diffusionapproach differ only slightly from those obtained by the Maxwell�-Stefan equations without the consideration of generalized drivingforces. The optimal height of the absorption columnwas investigatedtesting several discretizations of the packing section of the absorberwith different numbers of segments in relation with the masstransfer and reaction rates. Finally, axial concentration profiles arecompared with experimental measurements.
Dynamic simulations include a sudden ammonia concentrationgrowth in the solvent feed case. Dynamic concentration profilesfor the gas and liquid products are given as a function of time. Theresults show that increasing solvent concentration reduces theselectivity of the chemisorption and much of the ammonia getslost by the CO2 consumption.
Jayarathna et al. [66] developed a general model for aminebased solvents. Separate sub-models are developed for absorber,stripper, condenser and reboiler. The main balance equations areconsidered the same for the main columns, altering the boundaryconditions of the differential equations deriving from the refluxstream enters the top most section of the stripping tower Themodel assumption include constant flow rate, ideal phases,neglected interfacial mass transfer of N2 and O2, reactions onlyin the liquid film, linear pressure drop, adiabatic system, eachphase in a control volume of the spatially discretized modelbehaves as a continuous stirred tank.
The condenser of the stripping tower is modeled as a con-denser block followed by a reflux drum. The re-boiler is modeledusing a fixed vapour-to-feed fraction and the reboiler heat duty iscalculated. The heat exchanger model consists of energy balanceequations for the rich (cold) and lean (hot) amine streams in thecross heat exchanger and cooling water (cold) and lean amine(hot) streams in the lean cooler. Additional correlations are appliedfor the buffer tank model.
Mass transfer is considered as a concentration driven process.The equilibrium concentrations are determined by Henry’s lawcoefficient which is taken from Kent�Eisenberg model. For CO2
the overall mass transfer coefficient is given as a function of thelocal mass transfer coefficients, Henry’s law coefficient and theenhancement factor. The forward reaction rate coefficients arecalculated by correlations by Jamal et al. [67] and Freguia andRochelle [40], while the equilibrium coefficients for the reactionsare found using the Kent–Eisenberg model [68]. Using thesecoefficients the overall reaction rate is calculated.
I.P. Koronaki et al. / Renewable and Sustainable Energy Reviews 50 (2015) 547–566560

The model was validated compared with experimental data[38,59,69]. CO2 loadings, CO2 removal efficiency, re-boiler duty,temperature profile and flow Rates are compared with the measure-ments and are found to be in good agreement. For dynamic simula-tions, a number of cases of operation disturbances are validatedagainst steady state data. These scenarios are namely, increase ofmolar flow rate of the inlet gas stream into the absorption tower,increase of the volume flow rate of the inlet MEA stream into theabsorption tower and increase if V/F fraction of the re-boiler.
Lawal et al. [70] introduced a model investigating the operationof coal-fired power plants with post-combustion capture usingdynamic modeling and simulation. The model is a result ofnumerous amendments of a dynamic model, simulating both theabsorber and the desorber linked together with recycle. Assump-tions for the absorber include adiabatic system, plug flow, linearpressure drop, negligible holdup in the vapour bulk, solventdegradation and reactions are assumed to reach equilibrium. Theregenerator model consists of the Gas–Liquid Contactor model (forthe packed column section) linked with two flash drum modelswhich represent the condenser and reboiler of the unit. Correla-tions for the heat of absorption were obtained from the literature.Mass and energy balance equations are solved for the twocolumns. In specific, for the vapour bulk accumulation of massand energy holdups are negligible. In following, correlations forthe heat loss and desorption heat are applied as a function oftemperature and other parameters. Mass transfer coefficients inthe liquid and vapour films were determined by correlations givenby Onda et al. [34]. Phase equilibrium between liquid and vapourphases is assumed at the interface. The Maxwell�Stefan equationsare solved, considering the two film theory. The equilibrium molarcompositions of the components in the vapour and liquid phases,are estimated based on the vapour and liquid fugacity coefficients.Physical property estimations for viscosities, enthalpies and den-sities were determined using the physical property package Multi-flash, while the fugacity coefficients and flash calculations in thereboiler and condenser were determined using the ElectrolyteNon-random-two-liquid (NRTL) model in Aspen Properties andaccessed through the CAPE-OPEN Thermo interface. The steady-state validation of the chemical absorption plant model wascarried out using data from the Separations Research Program atthe University of Texas at Austin [38]. Validation was performedfor stand-alone columns and for the integrated system. Simulationresults were validated using the temperature profile of theabsorber column measured in the pilot plant, with good agree-ment and higher deviations for the desorber predictions. Thepredictions for the integrated system presented higher deviationfrom the experimental case for the temperature profile especiallyin the regenerator because of certain model limitations. Finally, adynamic analysis is performed, testing the behavior of the systemunder the following scenarios; switching off water balance control,increasing flue gas flow rate to the absorber, reducing reboiler heatduty and increasing CO2 concentration of flue gas to the absorbercolumn. Dynamic analyses showed that the absorber performanceis more sensitive to the molar L/G ratio than the actual flow ratesof the solvent and flue gas. The performance of the regenerator isaffected by the reboiler duty.
5.2.3. Model comparisonsThe current section includes comparisons of key simulated
parameters by models that used the same experimental measure-ments as reference for validation. As mentioned before, there areno dynamic experimental data available. Therefore, both for steadystate and dynamic models, validation was performed againststeady state data. Thus, the comparisons consider the models assteady state. The comparison was made using information
included in the cited articles, thus in some cases the comparisonis graphical and includes a wide range of values and in other casesindividual values are compared. The models to be compared areeither described in detail in the previous section or described inshort in this section.
In following, a short description of the pilot plants where theexperiments were conducted is provided.
5.2.3.1. Tontiwachwuthikul pilot plant. Tontiwachwuthikul et al.[43] carried out a series of experiments in a larger countercurrent pilot-plant absorption column consisting of six packedbeds with a total packing height of 6.6 m and 0.1 m in internaldiameter. The column was packed with 12.7 mm ceramic Berlsaddles. Steady-state gas phase CO2 and MEA concentrations andsolution temperatures were measured along the column height fordifferent gas/liquid ratio, inlet CO2 and MEA concentrations.
Three models were selected for comparison, all of them using aspecific run test’s (T22) measurements of Tontiwachwuthikulplant. Khan model was analyzed in the dynamic models section.The other models are work of McDowell et al. [71] and Liu et al.[72]. McDowell uses a rate based approach and applies SAFT-VRequation of state to describe the thermophysical properties andfluid-phase behaviour of this process instead of using an enhance-ment factor. The dynamic analysis of the model includes evalua-tion of the effect of changing the lean solvent flow rate andthermodynamic state on column behavior. Liu proposes a complexcomputational mass transfer model (CMT). The model consists ofthe differential mass transfer equation with its auxiliary closingequations and the accompanied formulations of computationalfluid dynamics (CFD) and computational heat transfer (CHT).
Two parameters are presented along the column height, theCO2 concentrations % (Fig. 2) and the liquid phase temperature(Fig. 3). As seen by the figures, Khan model slightly underpredictsexperimental measurements while McDowell and Liu predictionsoverpredict Tontiwachwuthikul’s data especially in the areabetween 1 and 3 m height column. At the same area Liu providesmore accurate predictions from McDowell for CO2 concentration.
In Fig. 3, the temperature profile along the column is illustratedfor the three models and the respective experimental data. Thesame remarks are observed for the liquid phase temperaturepredictions as for the CO2 concentration. However, Mc Dowellmodel seems to be the only one predicting the expected tempera-ture bulge. It is known that a temperature bulge can be located inthe bottom of the absorber column [73].
5.2.3.2. Munmorah pilot plant. This pilot plant was jointly constructedby Australia’s Common wealth Scientific and Industrial ResearchOrganization (CSIRO) and Delta Electricity at Munmorah powerstation. The pilot plant mainly includes two absorbers in parallel orseries, one heat exchanger and one stripper. The inner diameter and
Fig. 2. Comparison of the CO2 concentration predictions of Khan and McDowellmodels and experimental data from Tontiwachwuthikul [T22].
I.P. Koronaki et al. / Renewable and Sustainable Energy Reviews 50 (2015) 547–566 561

the packed height of each absorber are 0.6 m and 3.9 m, respectively.The inner diameter and the packed height of the stripper are 0.4 m and3.5 m, respectively. The absorbers and stripper are both packed with25mm Pall rings.
Two models are compared using the same experimentalmeasurements by Munmorah pilot plant. In this case, individualvalues of parameters were provided so the comparison is per-formed via Table 15. In order to compare the two values the
Fig. 3. Comparison of the temperature profile predictions of Khan and McDowell models and experimental data from Tontiwachwuthikul [T22].
Table 15Lawal model correlations.
Lawal model
Parameter Correlation Nomenclature
Mass balance for bulk phases dMidt ¼ � 1
L UA∂FLi∂y þNi USpUMWi Uω
A: cross-sectional area
0¼ � 1L UA
∂FVi∂y þNi USpUMWi Uω
ct: total molar concentration
Energy balance for bulk phases dUdt ¼ �1
L UA∂FLH∂y þ SpUωU Hcond
liq þHconvliq þHabs
� �þHL f: fugacity coefficient
0¼ �1L UA
∂FVH∂y þ SpUωU Hcond
vap þHconvvap
� �Fi: component mass flow rate
Heat Loss (HL) H: heat fluxHeat of absorption habs ¼ RU �14281� 1092554γ2
Τ
� �� 6800882γ
Τ
� �þ32670:01Uγ
� �HL: heat loss to surroundings
Film equations 1δ
∂xMi∂z ¼ 1
ct
Pnck ¼ 1
xMi Nk � xMkNi
χi;k
μR
μT
298:15
� � L: length of column section
1δ∂ λGTð Þ∂z �1
δ∂Hf lux
∂z ¼ 0 M: mass holdup
Interface model f Li xM;Li ¼ f Vi x
M;Vi
MW:molecular weight
N: molar flux nc: number of componentsR: universal gas constantSp: specific areaU: energy holdupγ: CO2 loadingδ: film thicknessλ: thermal conductivityμ: viscosityω: wetted area ratioSuperscriptsConv:convectionI: interfaceL:liquidLb:liquid bulkLf:liquid filmM:molarR:referenceV:vapourVb:vapour bulkVf:vapour filmSubscriptsAbs: absorptionH: enthalpyi: component numberLiq: liquidVap: vapour
I.P. Koronaki et al. / Renewable and Sustainable Energy Reviews 50 (2015) 547–566562

relative deviation is calculated via the following equation:
RD%¼ Xexp:�Xpred:
Xexp:
� 100
The first researcher [74] used the commercial RateFrac model ofAspen plus to simulate the CO2 absorption and regeneration processesof a research scale pilot plant. The effects of lean solvent flow rate, NH3
concentration, CO2 loading, and temperature on the absorptionprocess were analyzed. In addition, optimization analysis for the CO2
regeneration process was carried out. The second model was devel-oped by Qi et al. [75] and also aims to simulate CO2 absorption usingaqueous ammonia. The model is based on the RateSep module, a rate-based absorption and stripping unit operation model in Aspen Plus,and uses the available thermodynamic, kinetic and transport property
models for the NH3–CO2– H2O system to predict the performance ofCO2 capture. The analysis includes the species concentration profile,temperature profile, mass transfer rate and coefficient in the gas andliquid bulk phase along the packing height. Observing the table, it isnot clear which model is more accurate as they are both in goodagreement with the experimental data (Table 16).
5.2.3.3. Pilot plant study at the university of Texas at Austin. Theabsorber column of the pilot plant is a packed column with adiameter of 0.427 m and total packing height of 6.1 m. This columnconsists of two 3.05 m packed bed sections with a collector plateand redistributors between the beds. The models compared are byLawal [76] and Jayarathna [66] described in detail before. As seenby Table 17, in most parameters, Jayarathna model predicts moreefficiently the experimental measurements.
6. Conclusions and scope for future work
It is unquestionable that the need for techniques targeting topolluting emissions reduction, becomes imperative. CCS is as describeda satisfactory solution, especially post-combustion technologies. Che-mical absorption is extensively studied, especially amine and ammoniasystems. Various researchers have studied the thermodynamic andchemical phenomena aiming to the optimization of the system.Literature includes mainly steady state analysis examining parametersas species concentration and temperature profile along the column.Most researchers have mainly dealt with absorption column, whilefewmodels exist for desorption. The papers that include both columnsusually study them separately, not considering their interaction.Supplementary equipment as reboiler, condenser etc. are usuallysimulated with rough simplifications. By this spectrum, the columnsoperations are well understood.
However, there is a necessity to interconnect the system withreal conditions of the power plant. Disturbances that may occur inactual operation conditions are usually not reflected in the existingmodels. In cases that such an analysis is attempted, results cannotbe validated. The target of the developed researches is thecommercialization of the process and this requires a very carefulinvestigation of its real impact. Thus, during the last yearsincreasing modeling attempts are observed, that develop dynamicsimulation tools. Dynamic CO2 capture model simulations haveonly analysed restricted disturbances as start-up or load fluctua-tions. In addition, dynamic models are validated only in a steadystate approach as dynamic experimental measurements are not
Table 16Comparison of Munmorah simulations.
Munmorah pilot plant simulations
Parameter Model
Case 31CO2 absorption rate (kg/h) Qi ZhangModel prediction 77.4 83.49Experimental 80 80Relative deviation (%) 3.25 4.36NH3 concentration in exit gas (ppm)Model prediction 18,589 14,415Experimental 19,463 19,463Relative deviation (%) 4.491 25.936CO2 loading of rich solventModel prediction 0,338 0.36Experimental 0.345 0.345Relative deviation (%) 2.029 4.348Case 31BCO2 absorption rate (kg/h)Model prediction 61.8 66.2Experimental 68.2 68.2Relative deviation (%) 9.384 2.933NH3 concentration in exit gas (ppm)Model prediction 8959 7936Experimental 9173 9173Relative deviation (%) 2.333 13.485CO2 loading of rich solventModel prediction 0.25 0.33Experimental 0.34 0.34Relative deviation (%) 26.471 2.941Case 38CO2 absorption rate (kg/h)Model prediction 80.8 75Experimental 75.44 75.44Relative deviation (%) 7.105 0.583NH3 concentration in exit gas (ppm)Model prediction 3849 5132Experimental 3756 3756Relative deviation (%) 2.476 36.635CO2 loading of rich solventModel prediction 0.22 0.4Experimental 0.42 0.42Relative deviation (%) 47.619 4.762Case 39CO2 absorption rate (kg/h)Model prediction 87.8 87.33Experimental 85.6 85.6Relative deviation (%) 2.570 2.021NH3 concentration in exit gas (ppm)Model prediction 8611 7740Experimental 10,071 10,071Relative deviation (%) 14.497 23.146CO2 loading of rich solventModel prediction 0.284 0.38Experimental 0.38 0.38Relative deviation (%) 25.263 0
Table 17Comparisons of Austin pilot plant simulations.
Parameter Model
CO2 removal efficiency (%) Jayarathna LawalModel prediction 96 99.5Experimental 95 95Relative deviation (%) 1.053 4.737
Rich solvent loading (mol/mol) Jayarathna LawalModel prediction 0.448 0.456Experimental 0.428 0.428Relative deviation (%) 4.673 6.542
Lean solvent loading (mol/mol) Jayarathna LawalModel prediction 0.285 0.279Experimental 0.279 0.279Relative deviation (%) 2.151 0
Absorber inlet liquid temperature (K) Jayarathna LawalModel prediction 314 331Experimental 314 314Relative deviation (%) 0 5.414
I.P. Koronaki et al. / Renewable and Sustainable Energy Reviews 50 (2015) 547–566 563

currently available. Dynamic models mainly deal with MEA as themost applied solvent. Concluding, the future works should:
� Develop dynamic models, including all equipment in an inte-grated way, testing more realistic and complex power plantoperation scenarios.
� Collect dynamic experimental data in order to be able tovalidate simulation tools as verification is necessary to increasethe model reliability and accuracy.
� Investigate alternative solvents or blends that increaseefficiency.
� Perform sensitivity analysis that will examine more parametersand their effect on the optimization process.
The utmost objective is the optimization of the process,providing the optimal solution for each case.
The current review could be extended by encompassing latestfuture models and also by performing more thorough comparisonsbetween comparable simulations. More models could be evaluatedin relation to their efficiency with different solvents or modelsvalidated against the same experimental data could be comparedusing more efficiency indicators.
Acknowledgements
The author acknowledge with appreciation the Laboratory ofApplied Thermodynamics, Thermal Engineering Section, School ofMechanical Engineering, National Technical University of Athens,for the support of the work on which this paper is based.
Appendix A. List with recent models
Researcher Modeltype
Dynamic/Steady
Solvent Simulatedequipment
Evaluation parameter Data for validation
[Pintolaet al.,[44]]
4 S MEA Absorber MEA concentration, enhancement factor,CO2 concentration, temperature alongthe column
Pilot plant
[Aboudheiret al.,[77]]
4 S AMP Absorber Concentration and temperature profilesalong the packed column
Two pilot plants (University ofBritish Columbia andUniversity of Regina)
[Nittayaet al.,[78]]
4 D MEA Absorber/Desorber
The performance of different controlschemes was evaluated under differentscenarios, e.g. changes in flue gas flowrates, set point tracking, and valvestiction
Pilot plant [Dugas, [38]]
[Dugas andRochelle,[79]]
5 S MEA and PZ Absorber Mass transfer coefficients in relation toCO2 loading, temperature and amineconcentrations
Pilot plant [Dugas, [38]]
[Saimpertet al.,[80]]
4 S MEA Absorber/Desorber
CO2 and temperature profiles, CO2
loading, outlet liquid flow rate, waterabsorbed, CO2 desorbed, reflux flow rate,loading for different operating points
CSIRO’s PCC ProcessDevelopment Facility and apilot plant (Tarong PowerStation)
[Gasparet al.,[81]]
4 D Alkanolamines Absorber CO2 molar fraction, liquid phase’stemperature, L/V ratio along the columnheight. CO2 molar fraction through time
Pilot plants Aroonwilas andVeawab [42], Tobiesen andSvendsen [39] andTontiwachwuthikul et al. [43]
[Moioliet al.,[82]]
5 S PZ Absorber Temperature and CO2 vapour molarfraction along the column
Pilot plant [Plaza, [83]]
[Sema et al.,[84]]
4 S DEAB Absorber Liquid phases speciation andconcentration in aqueous DEABsolutions as a function of CO2 loading,absorption rate, second order reactionrate constant k2
Pilot plant [Shi et al. [85]]
I.P. Koronaki et al. / Renewable and Sustainable Energy Reviews 50 (2015) 547–566564

References
[1] Huaman RNE, Jun TX. Energy related CO2 emissions and the progress on CCSprojects: a review. Renew Sustain Energy Rev 2013;31:368–85.
[2] Ming Z, Shaojie O, Yingjie Z. CCS technology development in China: status,problems and countermeasures-based on SWOT analysis. Renew SustainEnergy Rev 2014;39:604–16.
[3] Intergovernmental Panel on Climate Change (IPCC). Special report on carbondioxide capture and storage. Cambridge, UK: Cambridge University press;2005.
[4] Koroneos C, Grigoriadis Th, Kosmidou M. Energy analysis of a lignite powerplant with carbon sequestration. In: Proceedings of the 23rd internationalconference on efficiency, cost, optimization, simulation and environmentalimpact of energy systems. Lausanne: ECOS; 2010.
[5] Gabrielsen J, Michelsen M, Stenby E, Kontogeorgis G. Modeling of CO2 absorberusing an AMP solution. AIChE J 2006;52:3443–51.
[6] Leung DYC, Caramanna G, Maroto-Valer MM. An overview of current status ofcarbon dioxide and storage technologies. Renew Sustain Energy Rev2014;39:426–43.
[7] Sakwattanapong R, Aroonwilas A, Veawab A. Reaction rate of CO2 in aqueousMEA-AMP solution: experiment and modeling. Energy Proc 2009;1:217–24.
[8] Zhao B, Su Y, Tao W, Li L, Peng Y. Post-combustion CO2 capture by aqueousammonia: a state-of-the-art review. Int J Greenh Gas Control 2012;9:355–71.
[9] Kenig EY, Schneider R, Gorak A. Reactive absorption: optimal process designvia optimal modelling. Chem Eng Sci 2001;56:343–50.
[10] Vrachnos A. Absorption of acid gases into aqueous alkanolamine solutions:experimental investigation and thermodynamic modeling. Athens: NationalTechnical University of Athens; 2007 PhD Thesis.
[11] Peng J, Lextrait S, Edgar T, Eldridge RB. A comparison of steady-stateequilibrium and rate-based models for packed reactive distillation columns.Ind Eng Chem Res 2002;41:2735–44.
[12] Kucka L, Richter J, Kenig EY, Gorak A. Determination of gas–liquid reactionkinetics with a stirred cell reactor. Sep Purif Technol 2003;31:163–75.
[13] Kenig EY, Seferlis P. Modeling reactive absorption. Chem Eng Prog2009:65–71.
[14] Park HM. Reduced-order modeling of carbon dioxide absorption and deso-rption with potassium carbonate promoted by piperazine. Int J Heat MassTransf 2014;73:600–15.
[15] Kenig EY, Schneider R, Gorak A. Rigorous dynamic modelling of complexreactive absorption processes. Chem Eng Sci 1999;54:5195–203.
[16] Whitman WG. The two-film theory of absorption. Chem Met Eng 1923;29:147.[17] Astarita G. Mass transfer with chemical reaction. New York: Elsevier; 1967.[18] Higbie R. The rate of absorption of pure gas into a still liquid during short
periods of exposure. Trans Am Inst Chem Eng 1935;31:365.[19] Chen C, Song Y. Generalized electrolyte-NRTL model for mixed-solvent
electrolyte systems. ⟨www.interscience.wiley.com⟩; 2004.[20] Koronaki IP, Christodoulaki RI, Papaefthimiou VD, Rogdakis ED. Critical review
of coupled heat and mass transfer models for a liquid desiccant adiabaticdehumidifier and regenerator. Adv Build Energy Res 2014;8(2):117–36.
[21] Koronaki IP, Christodoulaki RI, Papaefthimiou VD, Rogdakis ED. Thermody-namic analysis of a counter flow adiabatic dehumidifier with different liquiddesiccant materials. Appl Therm Eng 2013;50(1):361–73.
[22] Koronaki IP, Christodoulaki RI, Papaefthimiou VD, Rogdakis ED. Thermody-namic analysis of an internally heated regenerator using three liquid desiccantsolutions. In: Proceedings of the ASME 2012 Heat transfer summer conferencecollocated with the ASME 2012 fluids engineering division. Summer meetingand the ASME 2012 10th international conference on nanochannels, micro-channels and minichannels. HT; 2012.
[23] Chen C, Britt HI, Boston JF, Evans LB. Local composition model for excess gibbsenergy of electrolyte systems. Part I: single solvent, Single CompletelyDissociated Electrolyte Systems. AIChE J 1982;28:588.
[24] Chen C, Evans LB. A local composition model for the excess Gibbs energy ofaqueous electrolyte systems. AIChE J 1986;32:444.
[25] Chunxi L, Furst W. Representations of CO2 solubility in aqueous MDEAsolutions using an electrolyte equation of state. Chem Eng Sci 2000;55:2975.
[26] Falck da Silva E. Modelling of activity coefficients using computationalchemistry. Report in DIK; 2002.
[27] Diamantonis N. Evaluation of statistical associating fluid theory (SAFT) andperturbed chain-SAFT equations of state for the calculation of thermodynamicderivative properties of fluids related to carbon capture and sequestration.Energy Fuels 2011;25(7):3334–43.
[28] Vaidya PD, Kenig EY. CO2-alkanolamine reaction kinetics: a review of recentstudies. Chem Eng Technol 2007;30:1467–74.
[29] Chikukwa A, Enaasen N, Kvamsdal HM, Hillestad M. Dynamic modeling ofpost-combustion CO2 capture using amines – a review. Energy Proc2012;23:82–91.
[30] Kvamsdal HM, Jakobsen JP, Hoff KA. Dynamic modeling and simulation of aCO2 absorber column for post-combustion CO2 capture. Chem Eng Process:Process Intensif 2009;48(1):135–44.
[31] Bui M, Gunawan I, Verheyen V, Feron P, Meuleman E, Adeloju S. Dynamicmodelling and optimisation of flexible operation in post-combustion CO2
capture plants – a review. Comput Chem Eng 2014;61:245–65.[32] Mores P, Scenna N, Mussati S. Post-combustion CO2 capture process: equili-
brium stage mathematical model of the chemical absorption of CO2 intomonoethanolamine (MEA) aqueous solution. Chem Eng Res Des2011;89:1587–99.
[33] Aboudheir A, Tontiwachwuthikul P, Chakma A, Idem R. Kinetic of reactiveabsorption of carbon dioxide in high CO2-loaded, concentrated aqueousmonoethanolamine solutions. Chem Eng Sci 2003;58:5195–210.
[34] Onda K, Takeuchi H, Okumoto Y. Mass transfer coefficients between gas andliquid phases in packed column. J Chem Eng Jpn 1968;1(1):56–61.
[35] Wilson I. Gas liquid contact area of random and structured packing. Texas:University of Texas at Austin; 2004 M.S. Thesis.
[36] Bravo JL, Fair JR. Generalized correlation for mass transfer in packed distilla-tion columns. Ind Eng Chem Process Des Dev 1982;21:162.
[37] Austgen DM, Rochelle GT. Model of vapor–liquid equilibria for aqueous acidgas–alkanolamine systems using the electrolyte-NRTL equation. Ind Eng ChemRes 1989;28:1060–73.
[38] Dugas ER. Pilot plant study of carbon dioxide capture by aqueous mono-ethanolamine. Texas: University of Texas at Austin; 2006 M.S. Thesis.
[39] Tobienssen FA, Juliussen O, Svendsend H. Experimental validation of arigorous desorber model for CO2 post-combustion capture. Chem Eng Sci2008;63:2641–56.
[40] Freguia S, Rochelle GT. Modeling of CO2 capture by aqueous monoethanola-mine. AIChE J 2003;49:1676–86.
[41] Khan FM, Krishnamoorthi V, Mahmud T. Modelling reactive absorption of CO2
in packed columns for post-combustion carbon capture applications. ChemEng Res Des 2011;89:1600–8.
[42] Aroonwilas A, Chakma A, Tontiwachwuthikul P, Veawab A. Mathematicalmodelling of mass transfer and hydrodynamics in CO2 absorbers packed withstructure packings. Chem Eng Sci 2003;58:4039–53.
[43] Tontiwachwuthikul P, Meisen A, Lim J. CO2 absorption by NaOH, monoetha-nolamine and 2-amino-2-methyl-1-propanol solutions in a packed column.Chem Eng Sci 1992;47(2):381–90.
[44] Pintola T, Tontiwachwuthikul P, Meisen A. Simulation of pilot plant andindustrial CO2–MEA absorbers. Gas Sep Purif 1993;7(1):47–52.
[45] Danckwerts PV. Gas–liquid reactions. New York: McGraw-Hill; 1970.[46] Hikita H, Asal S, Ishikawa H, Honda M. The kinetics of reactions of CO2 with
MEA, DEA and TEA by a rapid mixing method. Chem Eng J 1977;13:7–12.[47] Levenspiel O. Chemical reaction engineering. 3rd ed. New York: John Wiley &
Sons; 1999.[48] Bravo JL, Rocha JA, Fair JR. Mass transfer in gauze packings. Hydrocarb Process
1985;64:91–5.[49] Kucka L, Muller I, Kenig EY, Gorak A. On the modeling and simulation of sour
gas absorption by aqueous amine solutions. Chem Eng Sci 2003;58:3571–8.[50] Reid RC, Prausnitz JM, Poling BE. The properties of gases and liquids. 5th ed.
New York: McGraw-Hill; 2000.[51] Danckwerts PV, Sharma MM. The absorption of carbon dioxide into solutions
of alkalis and amines. Chem Eng 1987:CE244–80.[52] Bolhàr-Nordenkampf M, Friedl A, Koss U, Tork T. Modelling selective H2S
absorption and desorption in an aqueous MDEA-solution using a rate-basednon-equilibrium approach. Chem Eng Process 2004;43:701–15.
[53] Billet R, Schultes M. Predicting mass transfer in packed columns. Chem EngTechnol 1993;16:1–9.
[54] Krevelen DW, Hoftijzer PJ. Kinetics of gas–liquid reactions. Part I. Generaltheory. Rec Trav Chim 1948;67:563–86.
[55] Gabrielsen J, Michelsen ML, Stenby EH, Kontogeorgis GM. A model forestimating CO2 solubility in aqueous alkanolamines. Ind Eng Chem Res2005;44:3348–54.
[56] Saha AK, Bandyopadhyay SS, Biswas AK. Solubility and diffusivity of N2O andCO2 in aqueous solutions of 2-amino-2-methyl-1-propanol. J Chem Eng Data1993;38:78–82.
[57] Puxty G, Rowland R, Attalla M. Describing CO2 mass transfer in amine/ammonia mixtures – no shuttle mechanism required. Energy Proc2011;4:1369–76.
[58] Al-Baghli NA, Pruess SA, Yesavage VF, Selim MS. A rate-based model for thedesign of gas absorbers for the removal of CO2 and H2S using aqueoussolutions of MEA and DEA. Fluid Phase Equilibria 2001;185:31–43.
[59] Kvamsdal HM, Zakeri A, Einbu A, Chikukwa A, Hillestad M. A comparison ofdifferent parameter correlation models and the validation of an MEA-basedabsorber model. Energy Proc 2011;4:1526–33.
[60] Hoff KA, Juliussen O, Falk-Pedersen O, Svendsen HF. Modeling and experi-mental study of carbon dioxide absorption in aqueous alkanolamine solutionsusing a membrane contactor. Ind Eng Chem Res 2004;43:4908–21.
[61] Ghaemi A, Shahhosseini S, Maragheh MG. Nonequilibrium dynamic modelingof carbon dioxide absorption by partially carbonated ammonia solutions.Chem Eng J 2009;149:110–7.
[62] Last W, Stichlmair J. Determination of mass transfer parameters by means ofchemical absorption. Chem Eng Technol 2002;25:385–91.
I.P. Koronaki et al. / Renewable and Sustainable Energy Reviews 50 (2015) 547–566 565

[63] Harun N, Douglas PL, Ricardez-Sandoval L, Croiset E. Dynamic simulation ofMEA absorption processes for CO2 capture from fossil fuel power plant. EnergyProc 2011;1(4):1478–85.
[64] Lawal A, Wang M, Stephenson P, Koumpouras G, Yeung H. Dynamic modellingand analysis of post-combustion CO2 chemical absorption process for coal-fired power plants. Fuel 2010;89:2791–801.
[65] Astarita G, Savage DW, Bisio A. Gas treating with chemical solvents. New York:Wiley; 1983.
[66] Jayarathna SA, Lie B, Melaaen MC. Amine based CO2 capture plant: dynamicmodeling and simulations. Int J Greenh Gas Control 2013;4:282–90.
[67] Jamal A, Meisen A, Lim CJ. Kinetics of carbon dioxide absorption anddesorption in aqueous alkanolamine solutions using a novel hemisphericalcontactor. Experimental results and parameter estimation. Chem Eng Sci2006;61:6590–603.
[68] Kent RL, Eisenberg B. Better data for amine treating. Hydrocarb Process1976:87–90.
[69] Zhang Y, Chen H, Chen C, Plaza JM, Dugas R, Rochelle GT. Rate-based processmodeling study of CO2 capture with aqueous monoethanolamine solution. IndEng Chem Res 2009;48:9233–46.
[70] Lawal A, Wang M, Stephenson P, Koumpouras G, Yeung H. Dynamic modellingand analysis of post-combustion CO2 chemical absorption process for coal-fired power plants. Fuel 2010;89:2791–801.
[71] Mac Dowell N, Samsatli NJ, Shah N. Dynamic modelling and analysis of anamine-based post-combustion CO2 capture absorption column. Int J GreenhGas Control 2013;12:247–58.
[72] Liu GB, Yu KT, Yuan XG, Liu CJ, Guo QC. Simulations of chemical absorption inpilot-scale and industrial-scale packed columns by computational masstransfer. Chem Eng Sci 2006;61:6511–29.
[73] Kvamsdal HM, Rochelle GT. Effects of the temperature bulge in CO2 absorptionfrom flue gas by aqueous monoethanolamine. Ind Eng Chem Res2008;47:867–75.
[74] Zhang M, Guo Y. Rate based modeling of absorption and regeneration for CO2
capture by aqueous ammonia solution. Appl Energy 2013;111:142–52.[75] Qi G, Wang S, Yu H, Wardhaugh L, Feron P, Chen C. Development of a rate-
based model for CO2 absorption using aqueous NH3 in a packed column. Int JGreenh Gas Control 2013;17:450–61.
[76] Lawal A, Wang M, Stephenson P, Yeung H. Dynamic modelling of CO2
absorption for post combustion capture in coal-fired power plants. Fuel2009;88:2455–62.
[77] Aboudheir A, Tontiwachwuthikul P, Idem R. Rigorous model for predicting thebehavior of CO2 absorption into AMP in packed-bed absorption columns. IndEng Chem Res 2006;45:2553–7.
[78] Nittaya T, Douglas PL, Croiset E, Ricardez-Sandoval LA. Dynamic modelling andcontrol of MEA absorption processes for CO2 capture from power plants. Fuel2014;116:672–91.
[79] Dugas RE, Rochelle GT. Modeling CO2 absorption into concentrated aqueousmonoethanolamine and piperazine. Chem Eng Sci 2011;66:5212–8.
[80] Saimpert M, Puxty G, Qureshi S, Wardhaugh L, Cousins A. A new rate basedabsorber and desorber modelling tool. Chem Eng Sci 2013;96:10–25.
[81] Gaspar J, Cormos AM. Dynamic modeling and absorption capacity assessmentof CO2 capture process. Int J Greenh Gas Control 2012;8:45–55.
[82] Moioli S, Pellegrini LA. Improved rate-based modeling of the process of CO2
capture with PZ solution. Chem Eng Res Des; 2014.[83] Plaza JM. Modeling of carbon dioxide absorption using aqueous monoetha-
nolamine. piperazine and promoted potassium carbonate [Ph.D. Thesis].Austin: University of Texas; 2012.
[84] Sema T, Naami A, Liang Z, Idem R, Tontiwachwuthikul P, Shi H, et al. Analysisof reaction kinetics of CO2 absorption into a novel reactive 4-diethylamino-2-butanol solvent. Chem Eng Sci 2012;81:251–9.
[85] Shi H, Liang Z, Sema T, Naami A, Usubharatana P, Idem R, Saiwan C,Tontiwachwuthikul P. Solvent chemistry: NMR analysis and studies foramine-CO2-H2O systems with VLE modeling for CO2 capture process. CarbonManage 2012;3:185–200.
I.P. Koronaki et al. / Renewable and Sustainable Energy Reviews 50 (2015) 547–566566