Embed Size (px)
Citation preview

1
GAZIANTEP UNIVERSITY
ENGINEERING FACULTY
ME 416 ENGINEERING LABORATORY
MOTOR SPEED EXPERIMENTATION
SUBMITTED TO: Res.Assist RECEP HALICIOĞLU
SUBMITTED BY: (GROUP 7) (GROUP 6)
HALİL İBRAHİM GÜLMEZ GAZİ FIRAT
ERDİ KARAÇAL İBRAHİM İLKER ERDEM
MESUT GÜNGÖR AHMET GÖDELEK
EMRE KARACA
YAŞAR GÜRBÜZ
FIRAT GÜNYEL
NOVEMBER 2013

2
SPEED CONTROL SYSTEMS EXPERIMENT REPORT
AIM OF EXPERIMENT
Main aim of this experiment is to have a idea about;
- Operation of a potentiometer
- Recognize DC Motor velocity control system
- Understand operation of a tachometer
- Recognize a closed loop system, and perform speed measurement in analog and digital manner in a
reversible speed control system.
KNOWLEDGE LEVEL
- Understand the basic theory and operation of DC motor Speed Control
- Understand operation of a tachometer
EQUIPMENT REQUIRED
Servo amplifier( SA150D), Power supply(PS150E), Attenuator unit (AU150B), Preamplifier unit
(PA150), DC motor (DCM150P) and Reduction gear tacho unit (GT150X), Digital oscilloscope,
Digital multi meter, necessary wiring connections.
PROCEDURE
1) Adjust the reference to zero output before coupling to the preamplifier.
2) Set the preamplifier to ‘’ac compensation’’, this reduces the effect of ripple on the tacho generator
signal, which can cause instability.
3) Set the potentiometer to 5.
4) By rotating the potentiometer CCW and CW you can reverse direction of motor rotation (either side
of the center position 5).
5) Then record the reference voltage that just causes motor to rotate, note the values of minimum
signal needed the motor to rotate, forward and reverse.
6) Set the speed of rotation in CW. Pot settings from 5 to 10, take 10 readings. Having seen results in
both rpm and volts, set CCW rotation from 5 to 0, take 10 readings again. Record your readings in
table 1 and table 2 given below. To measure the error voltages place the voltmeter across both the
PA150C outputs.

3
Figure(1)=Experimental Setup

4
CALCULATIONS
A.)Plot a graph, on a linear graph paper, Pot. setting against tacho reading (in volts) in CW. Pot.Setting (5-10)
Tacho(Volts) Speed(rpm) Ref.Volts (Vin)
Error Volts (Ve)
5 0 0 0,28 0,28
5,5 1,91 700 2,25 0,34
6 3,82 1400 4,17 0,35
6,5 4,42 1630 5,695 1,275
7 5,02 1860 7,22 2,2
7,5 5,02 1860 8,53 3,51
8 5,02 1860 9,84 4,82
8,5 5,02 1860 11,035 6,015
9 5,02 1860 12,23 7,21
9,5 5,02 1860 14,16 9,14
10 5,02 1860 15,99 10,97
Table 1=Experimental Values

5
Figure(2)= Graph of Experimental Values
Figure(3)=Graph of Best Fit Equation
At the figure (3) the red lines refer to best fit line of the experiment result.And also its equation is seen on the figure.If we want to find for example pot setting value of 5.7 we must write 5.7 at the equation.This is our x.We can approximately find the value of Tacho Volts.
00,20,40,60,8
11,21,41,61,8
22,22,42,62,8
33,23,43,63,8
44,24,44,64,8
55,25,4
0 0,5 1 1,5 2 2,5 3 3,5 4 4,5 5 5,5 6 6,5 7 7,5 8 8,5 9 9,5 10 10,5 11
Pot Setting / Tacho (Volts)
y = 0,009x6 - 0,426x5 + 8,113x4 - 81,12x3 + 447,6x2 - 1286,x + 1497
-0,4-0,2
00,20,40,60,8
11,21,41,61,8
22,22,42,62,8
33,23,43,63,8
44,24,44,64,8
55,25,4
0 0,5 1 1,5 2 2,5 3 3,5 4 4,5 5 5,5 6 6,5 7 7,5 8 8,5 9 9,5 10 10,5 11
Pot Setting / Tacho (Volts)
6
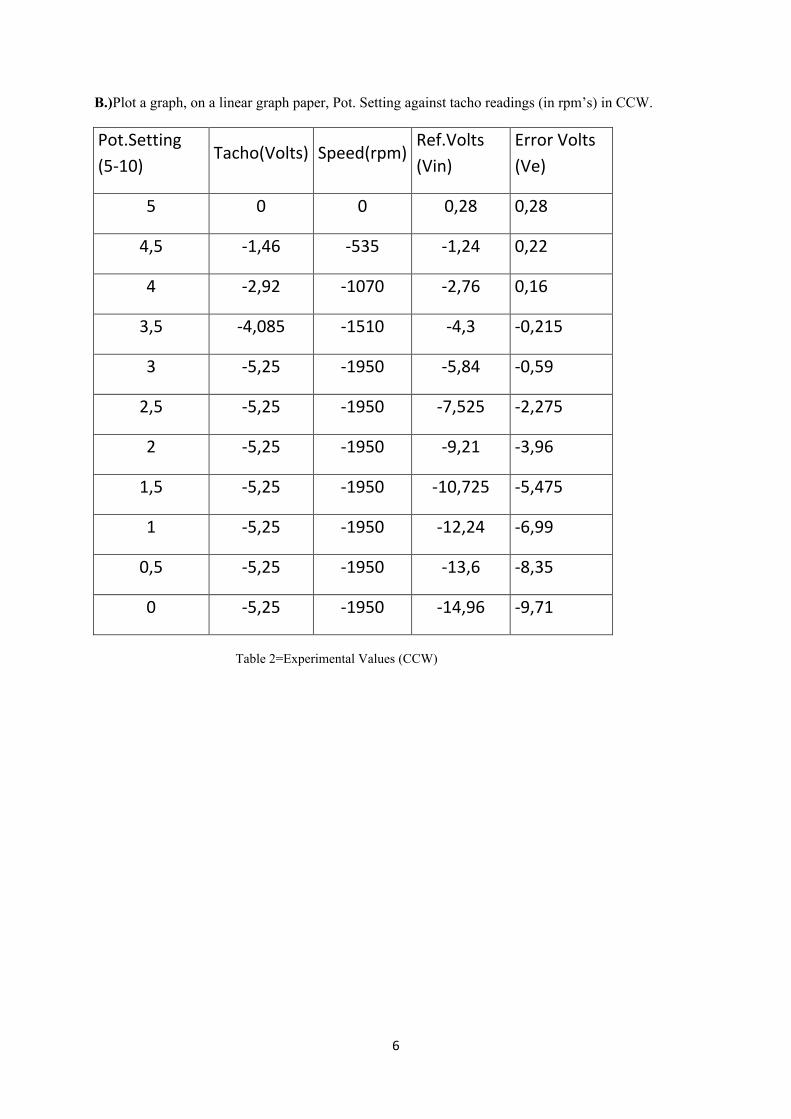
B.)Plot a graph, on a linear graph paper, Pot. Setting against tacho readings (in rpm’s) in CCW. Pot.Setting (5-10)
Tacho(Volts) Speed(rpm) Ref.Volts (Vin)
Error Volts (Ve)
5 0 0 0,28 0,28
4,5 -1,46 -535 -1,24 0,22
4 -2,92 -1070 -2,76 0,16
3,5 -4,085 -1510 -4,3 -0,215
3 -5,25 -1950 -5,84 -0,59
2,5 -5,25 -1950 -7,525 -2,275
2 -5,25 -1950 -9,21 -3,96
1,5 -5,25 -1950 -10,725 -5,475
1 -5,25 -1950 -12,24 -6,99
0,5 -5,25 -1950 -13,6 -8,35
0 -5,25 -1950 -14,96 -9,71
Table 2=Experimental Values (CCW)
7
Figure(4)= Tacho Readings Reverse Direction
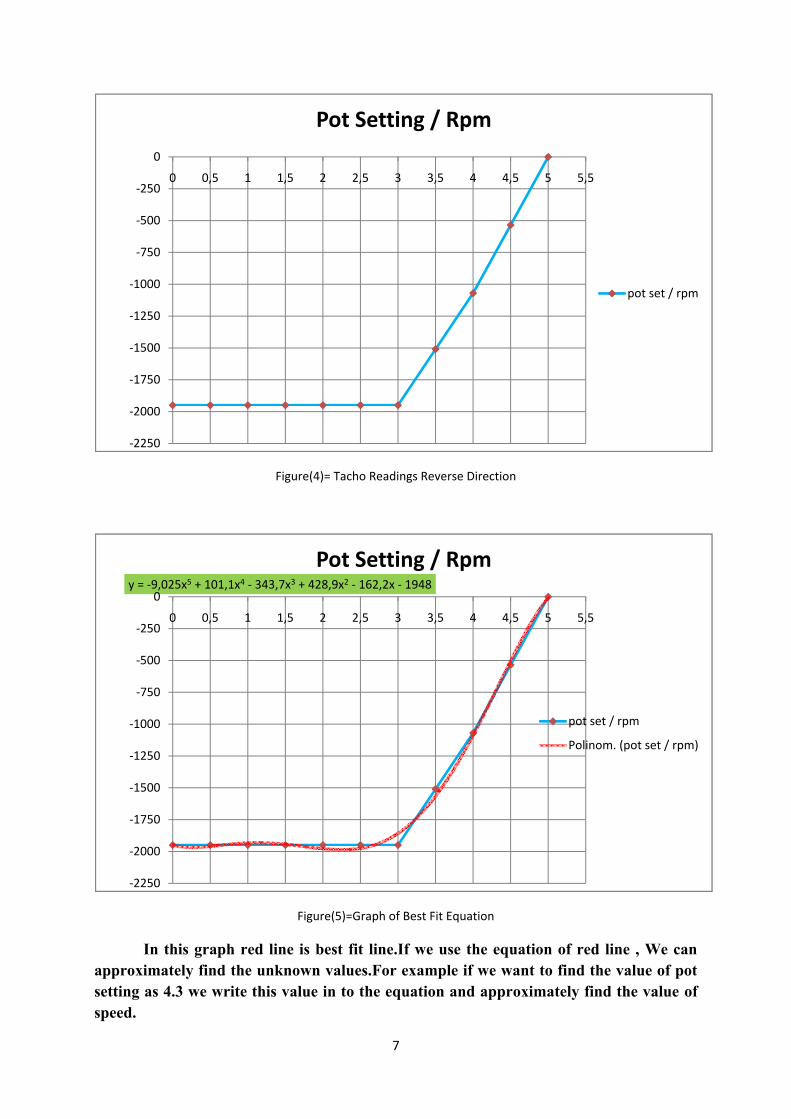
Figure(5)=Graph of Best Fit Equation
In this graph red line is best fit line.If we use the equation of red line , We can approximately find the unknown values.For example if we want to find the value of pot setting as 4.3 we write this value in to the equation and approximately find the value of speed.
-2250
-2000
-1750
-1500
-1250
-1000
-750
-500
-250
0
0 0,5 1 1,5 2 2,5 3 3,5 4 4,5 5 5,5
Pot Setting / Rpm
pot set / rpm
y = -9,025x5 + 101,1x4 - 343,7x3 + 428,9x2 - 162,2x - 1948
-2250
-2000
-1750
-1500
-1250
-1000
-750
-500
-250
0
0 0,5 1 1,5 2 2,5 3 3,5 4 4,5 5 5,5
Pot Setting / Rpm
pot set / rpm
Polinom. (pot set / rpm)
8
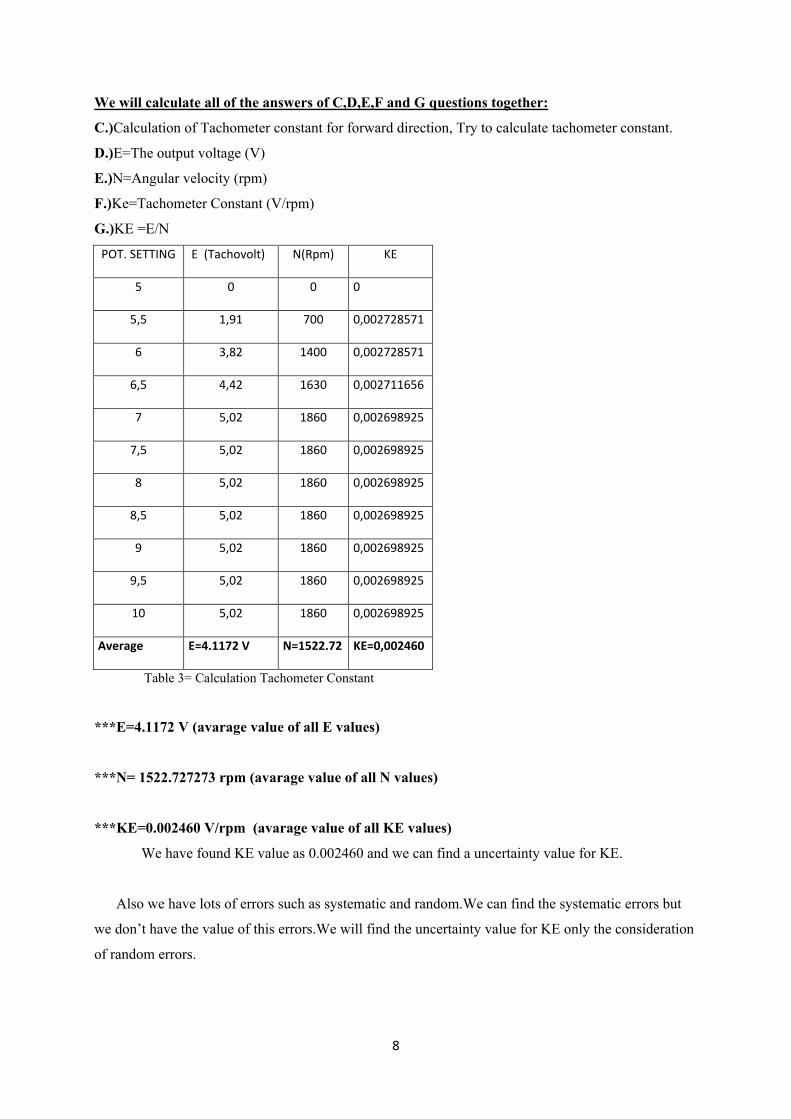
We will calculate all of the answers of C,D,E,F and G questions together:
C.)Calculation of Tachometer constant for forward direction, Try to calculate tachometer constant.
D.)E=The output voltage (V)
E.)N=Angular velocity (rpm)
F.)Ke=Tachometer Constant (V/rpm)
G.)KE =E/N
POT. SETTING E (Tachovolt) N(Rpm) KE
5 0 0 0
5,5 1,91 700 0,002728571
6 3,82 1400 0,002728571
6,5 4,42 1630 0,002711656
7 5,02 1860 0,002698925
7,5 5,02 1860 0,002698925
8 5,02 1860 0,002698925
8,5 5,02 1860 0,002698925
9 5,02 1860 0,002698925
9,5 5,02 1860 0,002698925
10 5,02 1860 0,002698925
Average E=4.1172 V N=1522.72 KE=0,002460
Table 3= Calculation Tachometer Constant
***E=4.1172 V (avarage value of all E values)
***N= 1522.727273 rpm (avarage value of all N values)
***KE=0.002460 V/rpm (avarage value of all KE values)
We have found KE value as 0.002460 and we can find a uncertainty value for KE.
Also we have lots of errors such as systematic and random.We can find the systematic errors but
we don’t have the value of this errors.We will find the uncertainty value for KE only the consideration
of random errors.
9
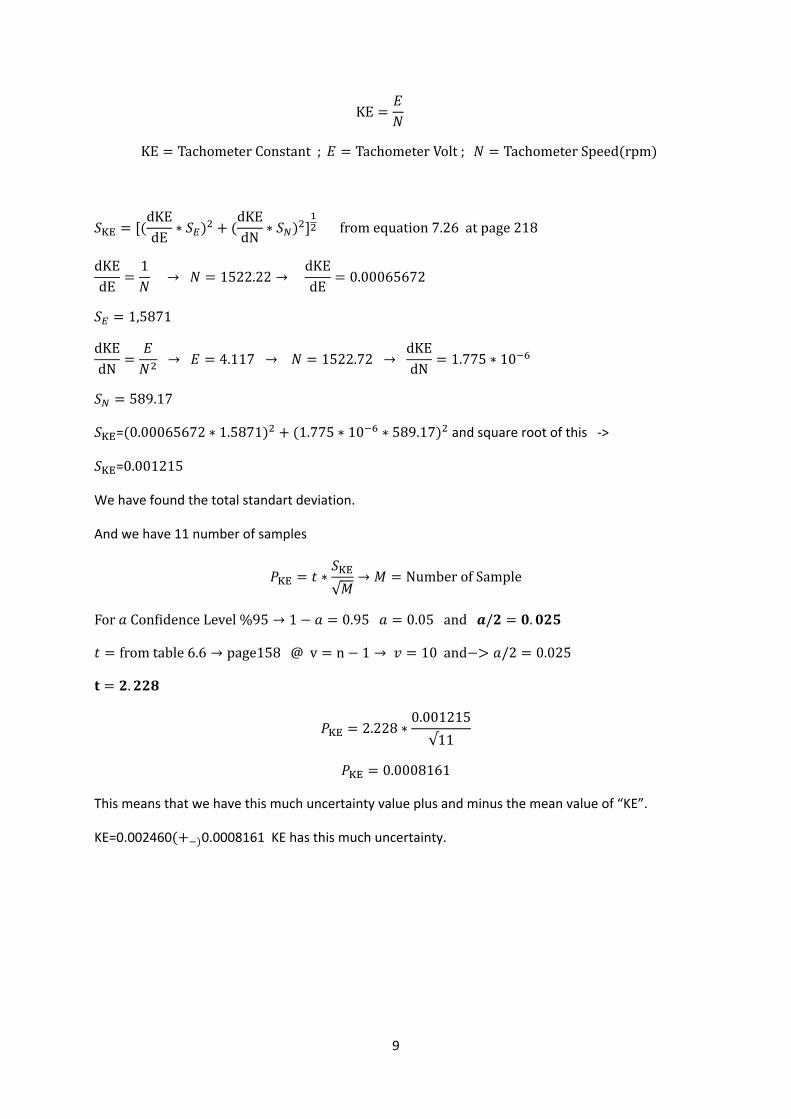
KE =퐸푁
KE = TachometerConstant; 퐸 = TachometerVolt; 푁 = TachometerSpeed(rpm)
푆 = [(dKEdE
∗ 푆 ) + (dKEdN
∗ 푆 ) ] fromequation7.26atpage218
dKEdE
=1푁→ 푁 = 1522.22 →
dKEdE
= 0.00065672
푆 = 1,5871
dKEdN
=퐸푁
→ 퐸 = 4.117 → 푁 = 1522.72 → dKEdN
= 1.775 ∗ 10
푆 = 589.17
푆 =(0.00065672 ∗ 1.5871) + (1.775 ∗ 10 ∗ 589.17) and square root of this ->
푆 =0.001215
We have found the total standart deviation.
And we have 11 number of samples
푃 = 푡 ∗푆√푀
→ 푀 = NumberofSample
For푎Con idenceLevel%95 → 1 − 푎 = 0.95푎 = 0.05and풂/ퟐ = ퟎ. ퟎퟐퟓ
푡 = fromtable6.6 → page158@v = n − 1 → 푣 = 10and−> 푎/2 = 0.025
퐭 = ퟐ. ퟐퟐퟖ
푃 = 2.228 ∗0.001215√11
푃 = 0.0008161
This means that we have this much uncertainty value plus and minus the mean value of “KE”.
KE=0.002460(+ )0.0008161 KE has this much uncertainty.
10
H.)What have you seen in reference voltage in potentiometer in both direction?
-For CW direcetion, the values of voltage in potentiometer has positive values and increases while
pot. setting changes 5,0-10,0 with interval of 0,5.
-For CCW direction, the values of voltage in potentiometer has negative values and decreases while
the pot. setting changes 5,0-0,0 with inverval of 0,5.
QUESTIONS
A.)What can you say for the characteristic of these curves?
For both curves, after 3 or 4 measuments, the tacho (volts) and speed (rpm) becomes constant,no
change in both tacho and speed but the ref. volts(Vin) is changing also the error volts (Ve) is
changing.For both curves, the absolute value error volts (|Ve|) increasing.
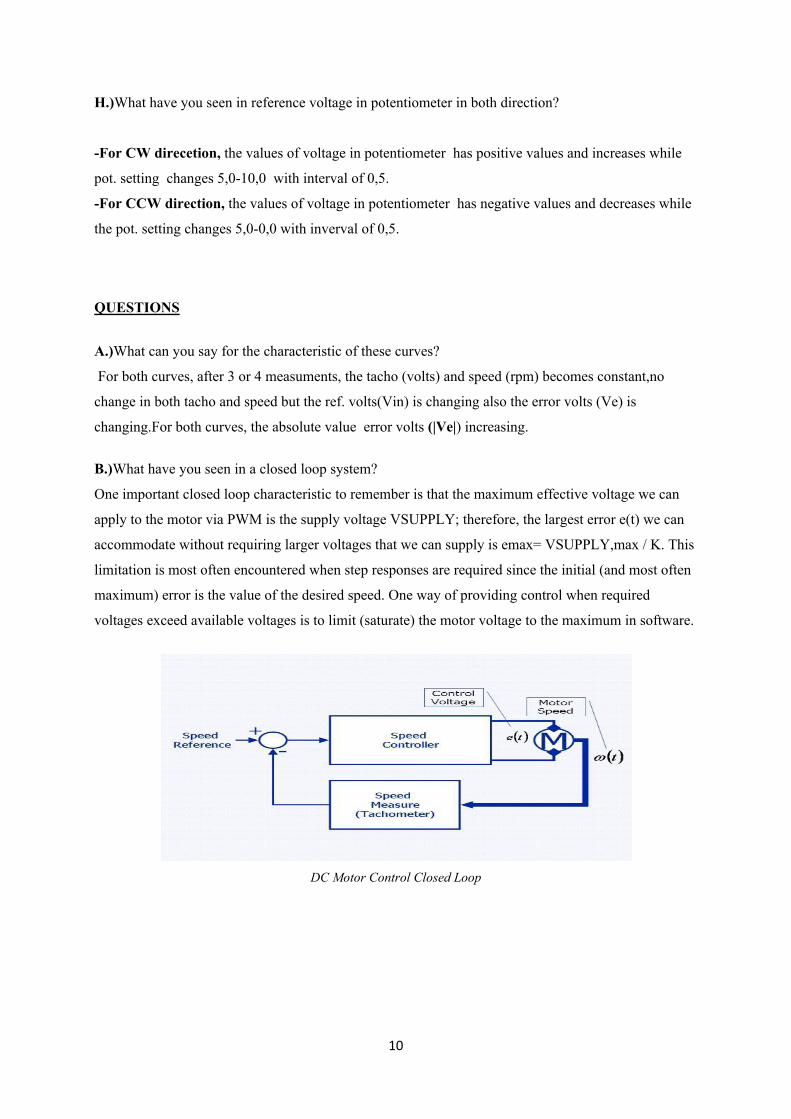
B.)What have you seen in a closed loop system?
One important closed loop characteristic to remember is that the maximum effective voltage we can
apply to the motor via PWM is the supply voltage VSUPPLY; therefore, the largest error e(t) we can
accommodate without requiring larger voltages that we can supply is emax= VSUPPLY,max / K. This
limitation is most often encountered when step responses are required since the initial (and most often
maximum) error is the value of the desired speed. One way of providing control when required
voltages exceed available voltages is to limit (saturate) the motor voltage to the maximum in software.
DC Motor Control Closed Loop
11
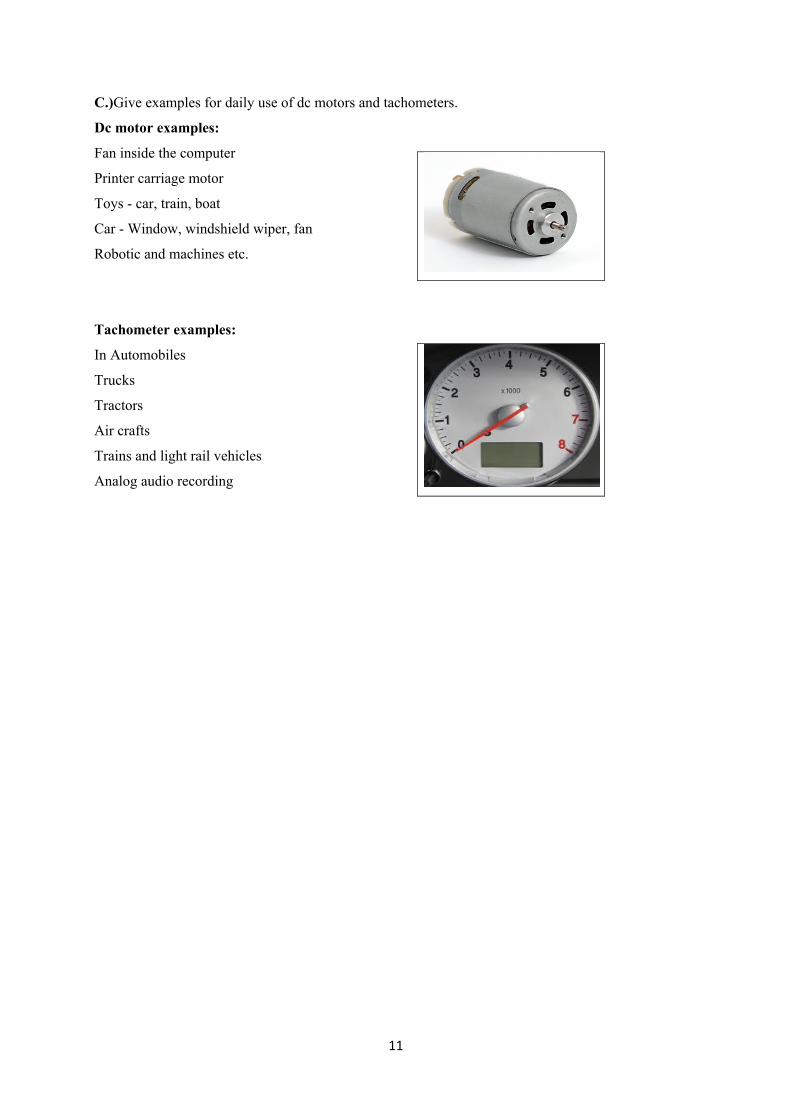
C.)Give examples for daily use of dc motors and tachometers.
Dc motor examples: Fan inside the computer
Printer carriage motor
Toys - car, train, boat
Car - Window, windshield wiper, fan
Robotic and machines etc.
Tachometer examples:
In Automobiles
Trucks
Tractors
Air crafts
Trains and light rail vehicles
Analog audio recording


![SELECTION GUIDE 2007 - kdhyd.com CATALOGUE.pdf · MS wheel motor MG motor MK motor MD motor ES axle ML motor MZ motor MF motor ... Max.pressure bar [PSI] 450 [6 350] 400 [5 800] [6](https://img.pdfslide.net/doc/110x75/5babf46109d3f2ca018cf468/selection-guide-2007-kdhyd-cataloguepdf-ms-wheel-motor-mg-motor-mk-motor.jpg)


![AC/DC Geared Motor and Gearhead - raveo.czkatalog]_DKM_A... · DKM Products Overview Induction Motor 2 Pole Motor Reversible Motor E.M. Brake Motor Clutch & Brake Motor Torque Motor](https://img.pdfslide.net/doc/110x75/5ca5afa988c9930a6e8c9362/acdc-geared-motor-and-gearhead-raveocz-katalogdkma-dkm-products-overview.jpg)