Embed Size (px)
Citation preview
APPLICATION OF REMOTE SENSING AND
GEOGRAPHICAL INFORMATION SYSTEM IN
CIVIL ENGINEERING
Date:
INSTRUCTOR
DR. MOHSIN SIDDIQUE
ASSIST. PROFESSOR
DEPARTMENT OF CIVIL ENGINEERING
Optical Remote Sensing
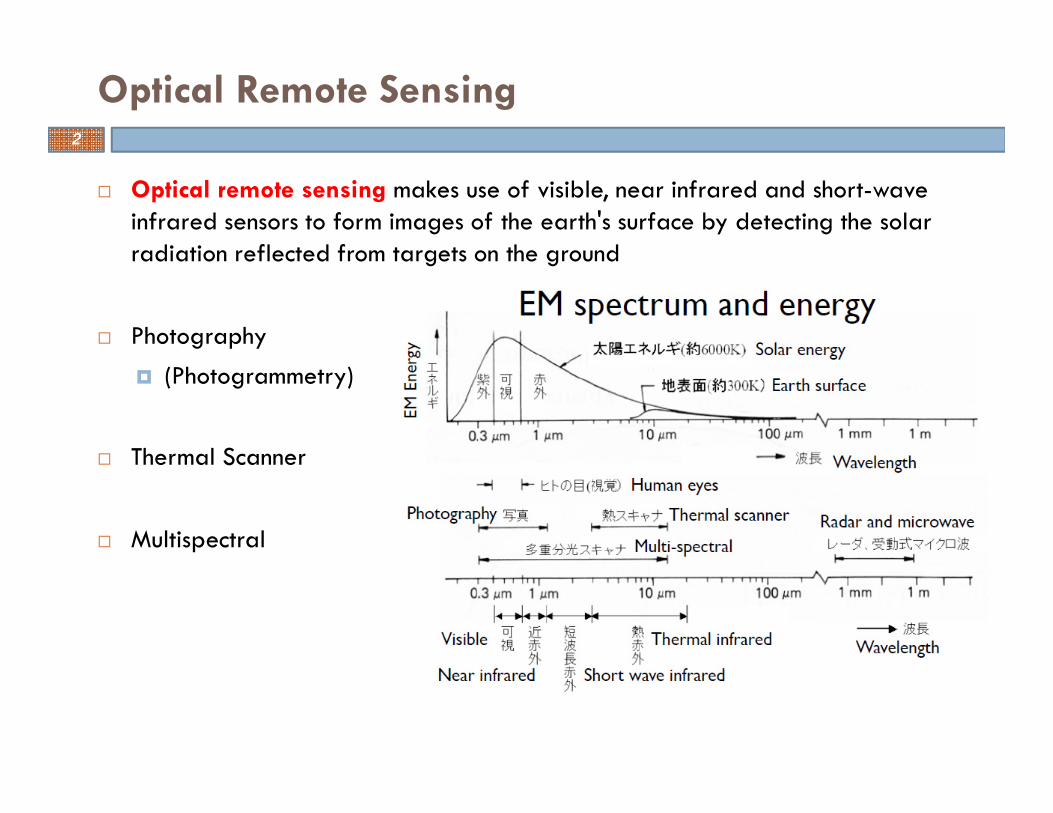
� Optical remote sensing makes use of visible, near infrared and short-wave infrared sensors to form images of the earth's surface by detecting the solar radiation reflected from targets on the ground
� Photography
� (Photogrammetry)
� Thermal Scanner
� Multispectral
2
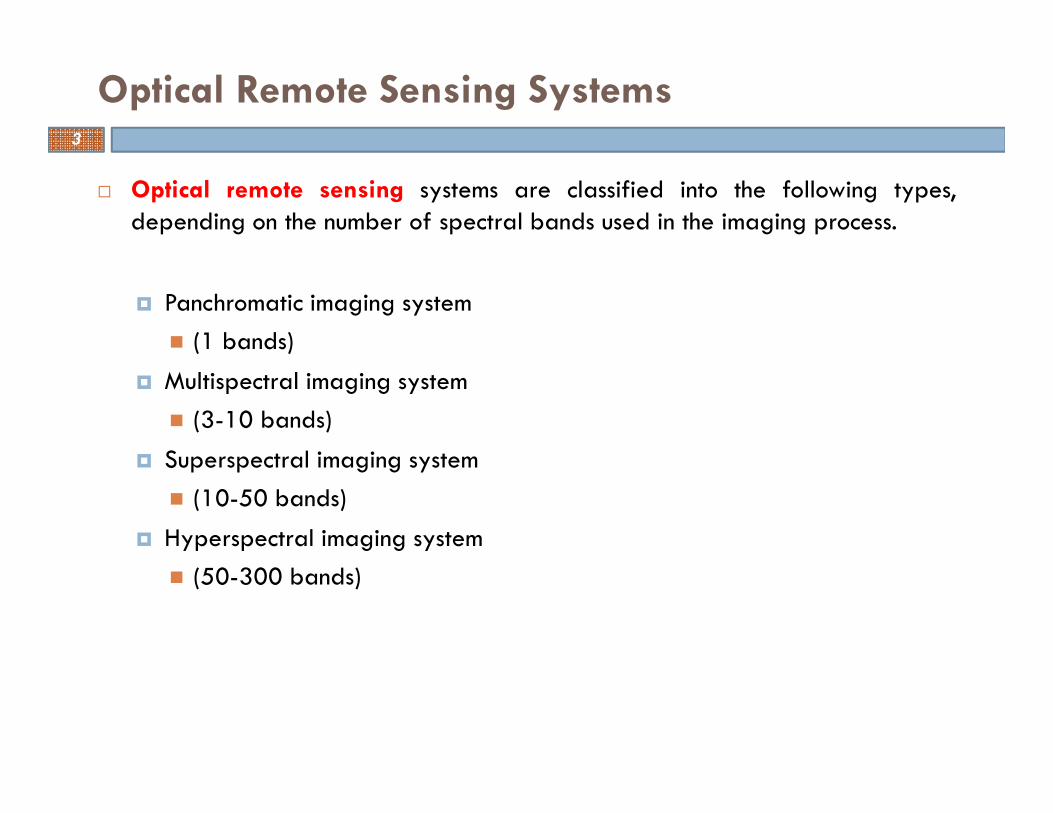
� Optical remote sensing systems are classified into the following types,depending on the number of spectral bands used in the imaging process.
� Panchromatic imaging system
� (1 bands)
� Multispectral imaging system
� (3-10 bands)
� Superspectral imaging system
� (10-50 bands)
� Hyperspectral imaging system
� (50-300 bands)
Optical Remote Sensing Systems3
� The sensor is a single channel detector sensitive to radiation within a broadwavelength range.
� If the wavelength range coincide with the visible range, then the resultingimage resembles a "black-and-white“ photograph taken from space.
� The physical quantity being measured is the apparent brightness of thetargets and the spectral information or "colour" of the targets is lost.
� Examples of panchromatic imaging systems are:
� Worldview-1
� IKONOS PAN
� SPOT HRV-PAN
Panchromatic Imaging System4
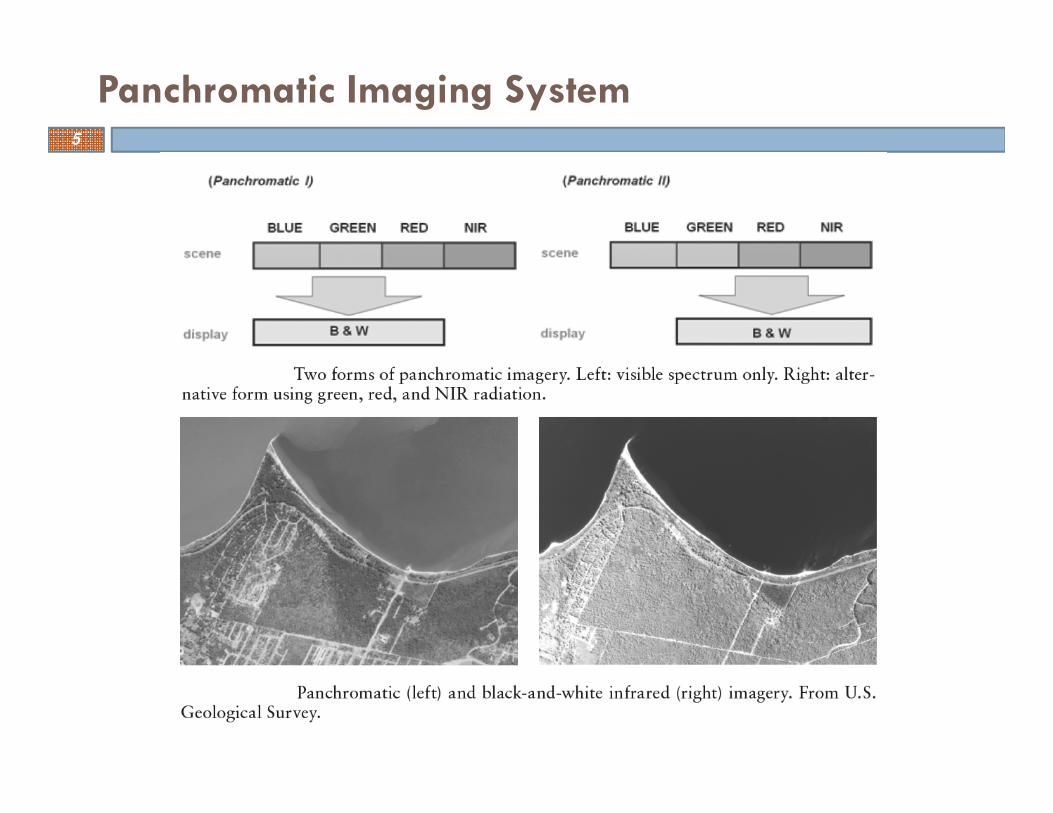
Panchromatic Imaging System5
� The sensor is a multichannel detector with a few spectral bands.
� Each channel is sensitive to radiation within a narrow wavelength band.
� The resulting image is a multilayer image which contains both the brightnessand spectral (colour) information of the targets being observed.
� Examples of multispectral systems are;
� ALOS AVNIR-2
� Landsat MSS/TM/ETM
� SPOT HRV-XS
� IKONOS MS
Multispectral Imaging System6
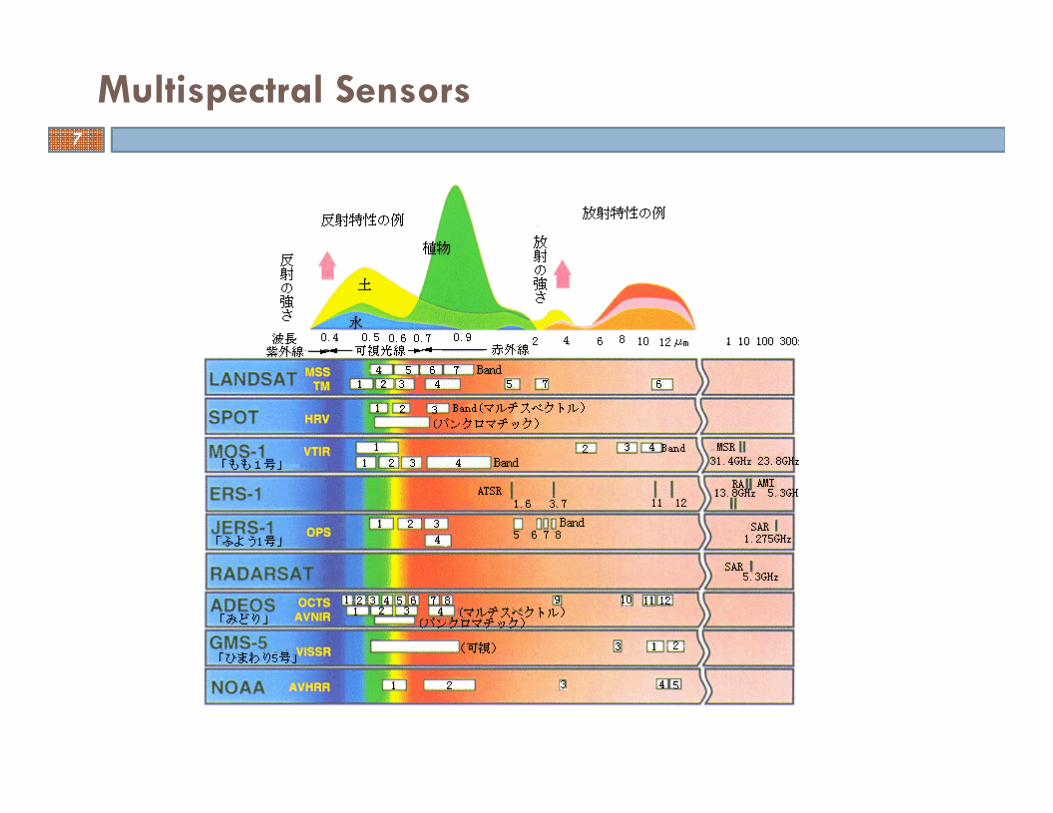
Multispectral Sensors7
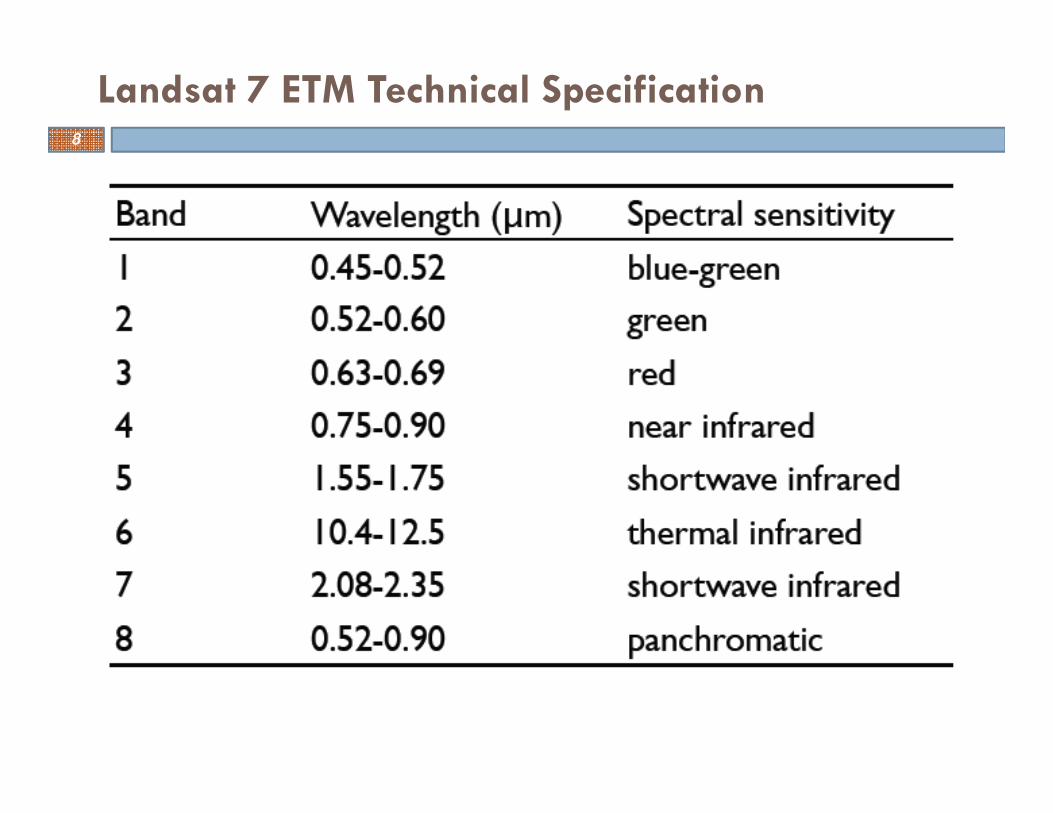
Landsat 7 ETM Technical Specification8
� A superspectral imaging sensor has many more spectral channels (typically>10) than a multispectral sensor.
� The bands have narrower bandwidths, enabling the finer spectralcharacteristics of the targets to be captured by the sensor.
� Examples of superspectral systems are:
� MODIS
� MERIS
Superspectral Imaging Systems9
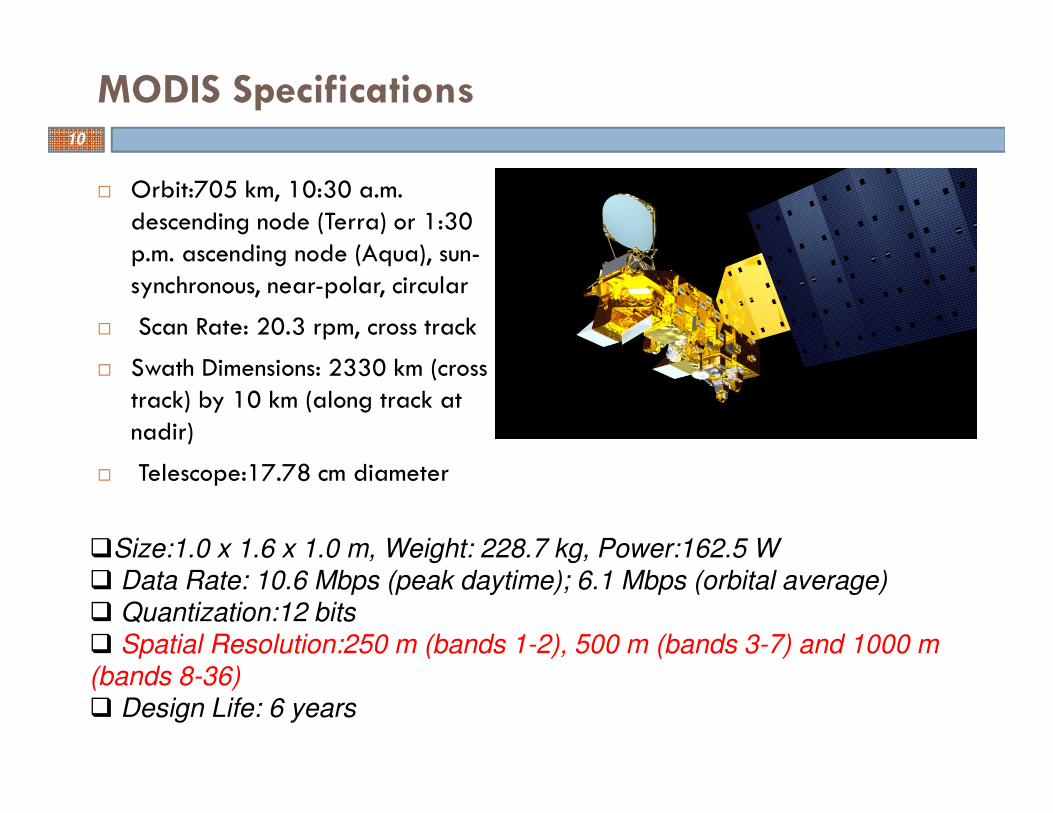
� Orbit:705 km, 10:30 a.m. descending node (Terra) or 1:30 p.m. ascending node (Aqua), sun-synchronous, near-polar, circular
� Scan Rate: 20.3 rpm, cross track
� Swath Dimensions: 2330 km (cross track) by 10 km (along track at nadir)
� Telescope:17.78 cm diameter
MODIS Specifications
�Size:1.0 x 1.6 x 1.0 m, Weight: 228.7 kg, Power:162.5 W� Data Rate: 10.6 Mbps (peak daytime); 6.1 Mbps (orbital average)� Quantization:12 bits� Spatial Resolution:250 m (bands 1-2), 500 m (bands 3-7) and 1000 m (bands 8-36)� Design Life: 6 years
10
BandWavelength
(nm)Resolution
(m)Primary
Use
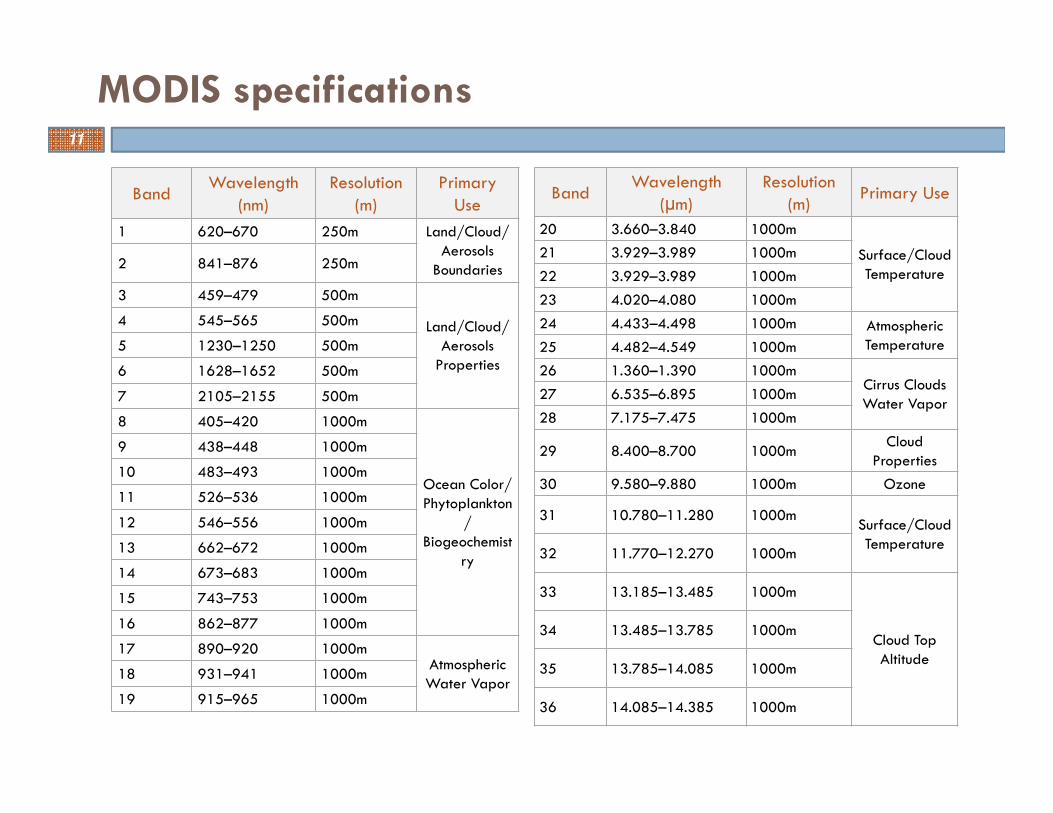
1 620–670 250m Land/Cloud/Aerosols
Boundaries2 841–876 250m
3 459–479 500m
Land/Cloud/Aerosols
Properties
4 545–565 500m
5 1230–1250 500m
6 1628–1652 500m
7 2105–2155 500m
8 405–420 1000m
Ocean Color/Phytoplankton
/Biogeochemist
ry
9 438–448 1000m
10 483–493 1000m
11 526–536 1000m
12 546–556 1000m
13 662–672 1000m
14 673–683 1000m
15 743–753 1000m
16 862–877 1000m
17 890–920 1000mAtmosphericWater Vapor
18 931–941 1000m
19 915–965 1000m
MODIS specifications
BandWavelength
(µm)Resolution
(m)Primary Use
20 3.660–3.840 1000m
Surface/CloudTemperature
21 3.929–3.989 1000m
22 3.929–3.989 1000m
23 4.020–4.080 1000m
24 4.433–4.498 1000m AtmosphericTemperature25 4.482–4.549 1000m
26 1.360–1.390 1000mCirrus CloudsWater Vapor
27 6.535–6.895 1000m
28 7.175–7.475 1000m
29 8.400–8.700 1000mCloud
Properties
30 9.580–9.880 1000m Ozone
31 10.780–11.280 1000mSurface/CloudTemperature
32 11.770–12.270 1000m
33 13.185–13.485 1000m
Cloud TopAltitude
34 13.485–13.785 1000m
35 13.785–14.085 1000m
36 14.085–14.385 1000m
11
� It is also known as an "imaging spectrometer". it acquires images in about ahundred or more contiguous spectral bands.
� The precise spectral information contained in a hyperspectral image enablesbetter characterisation and identification of targets.
� Hyperspectral images have potential applications in such fields as precisionagriculture (e.g. monitoring the types, health, moisture status and maturity ofcrops), coastal management (e.g. monitoring of phytoplanktons, pollution,bathymetry changes).
� Examples of a hyperspectral system are:
� Hyperion on EO1 satellite
� AVIRIS (Airborne Visible and Infrared Spectrometer)
Hyperspectral Imaging Systems12
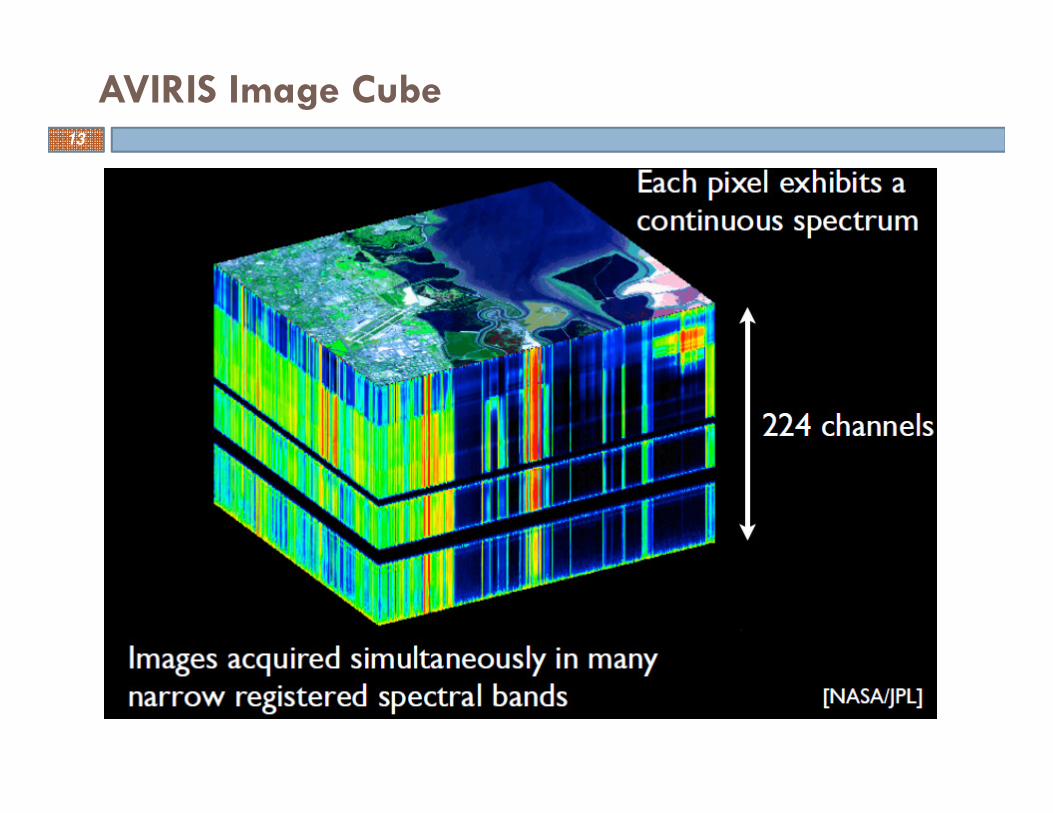
AVIRIS Image Cube13
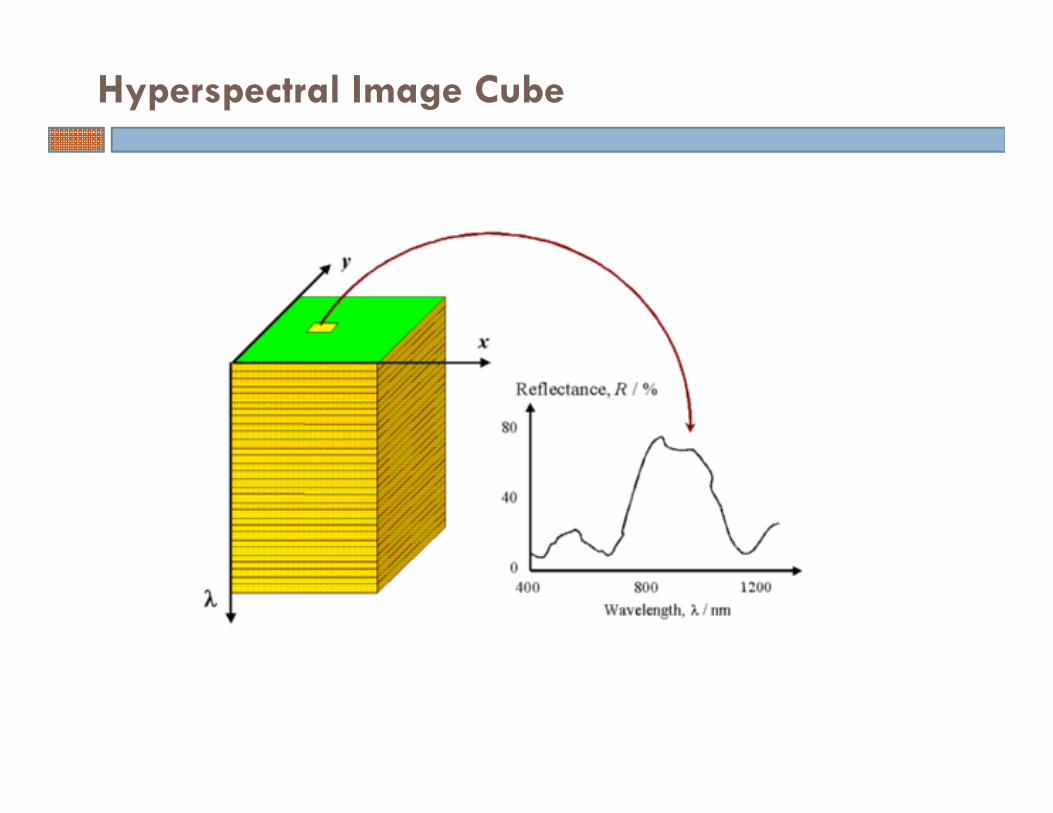
Hyperspectral Image Cube
� The science of making measurements from photographs is calledphotogrammetry
� Evolution of photography
� Development of new photographic techniques and equipment
� Development of new platforms for collection of imagery Black and whitephotography
� Color photography
� Color infrared photography
Photogrammetry15
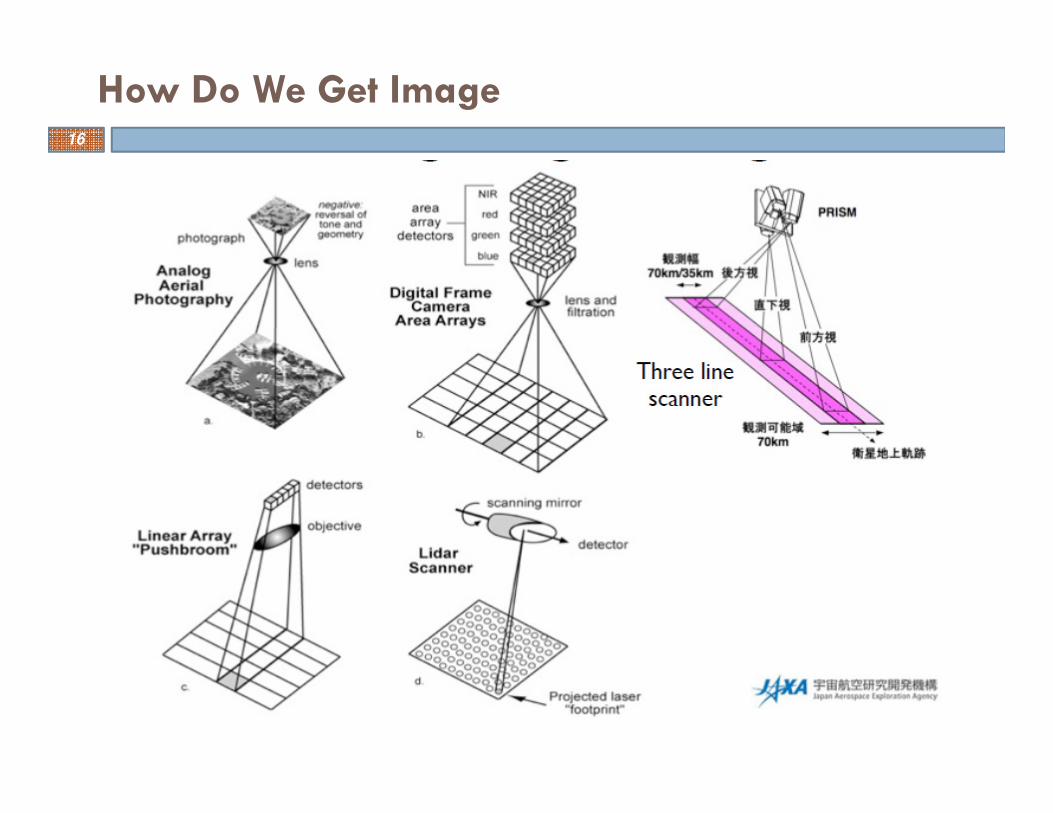
How Do We Get Image16
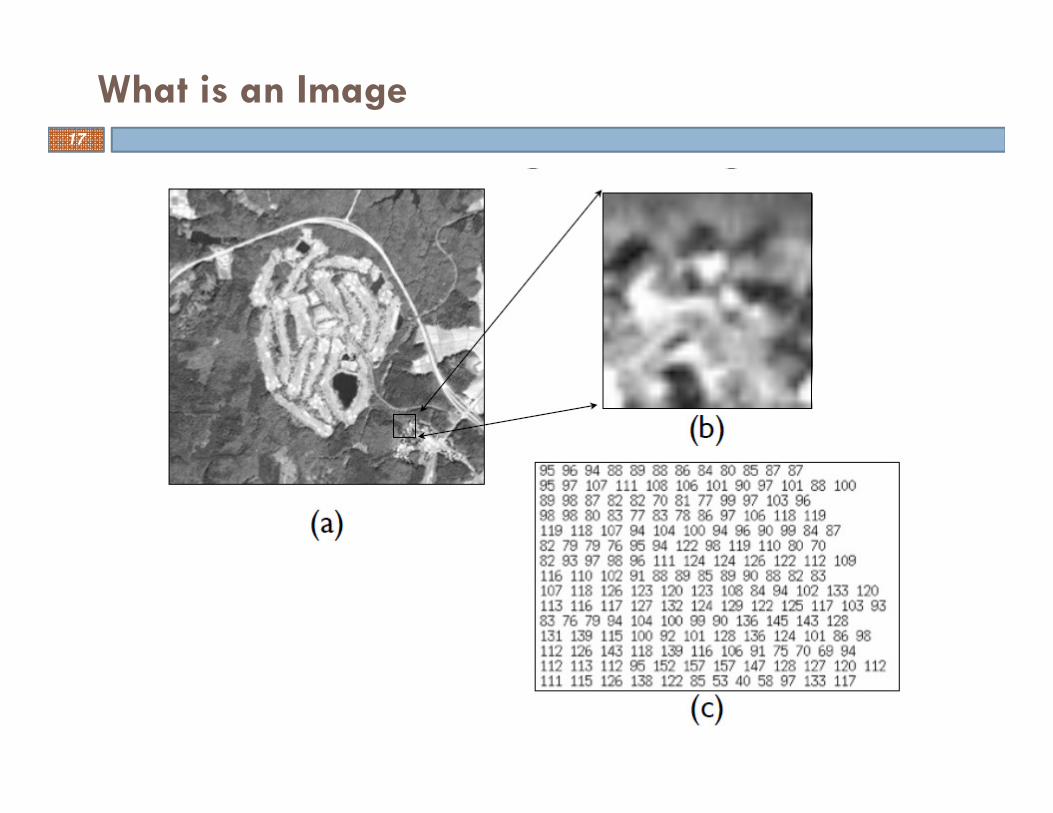
What is an Image17
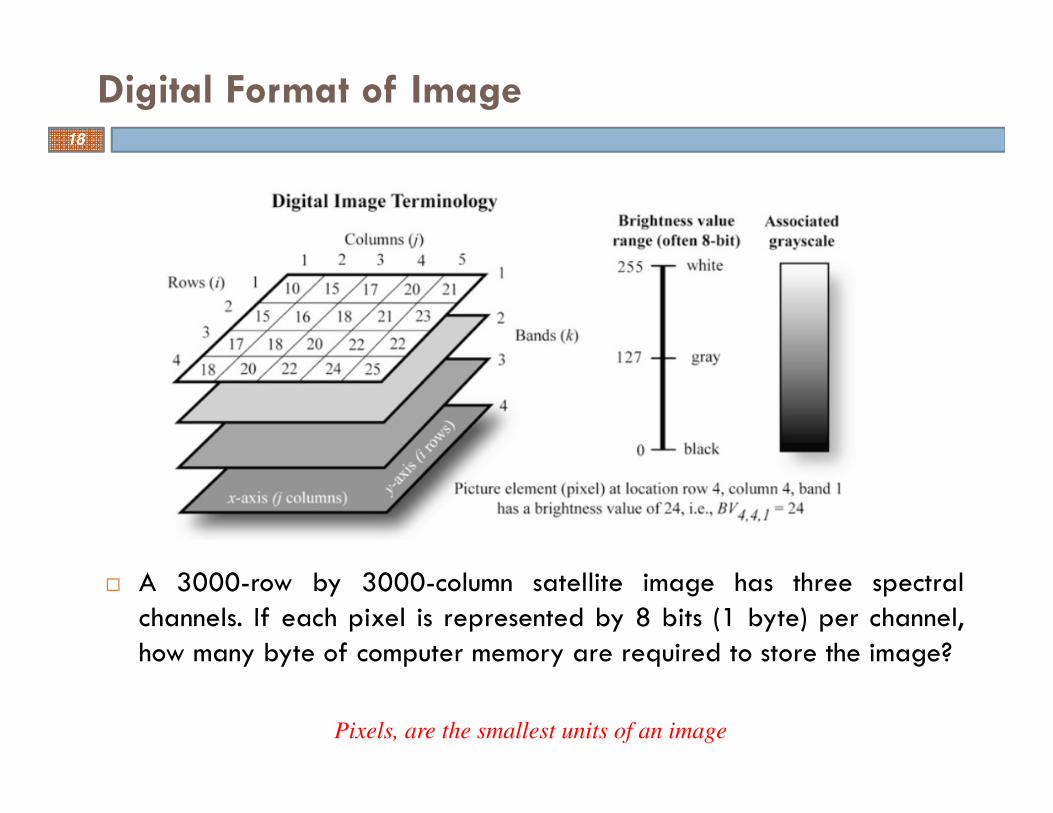
� A 3000-row by 3000-column satellite image has three spectralchannels. If each pixel is represented by 8 bits (1 byte) per channel,how many byte of computer memory are required to store the image?
Digital Format of Image
Pixels, are the smallest units of an image
18
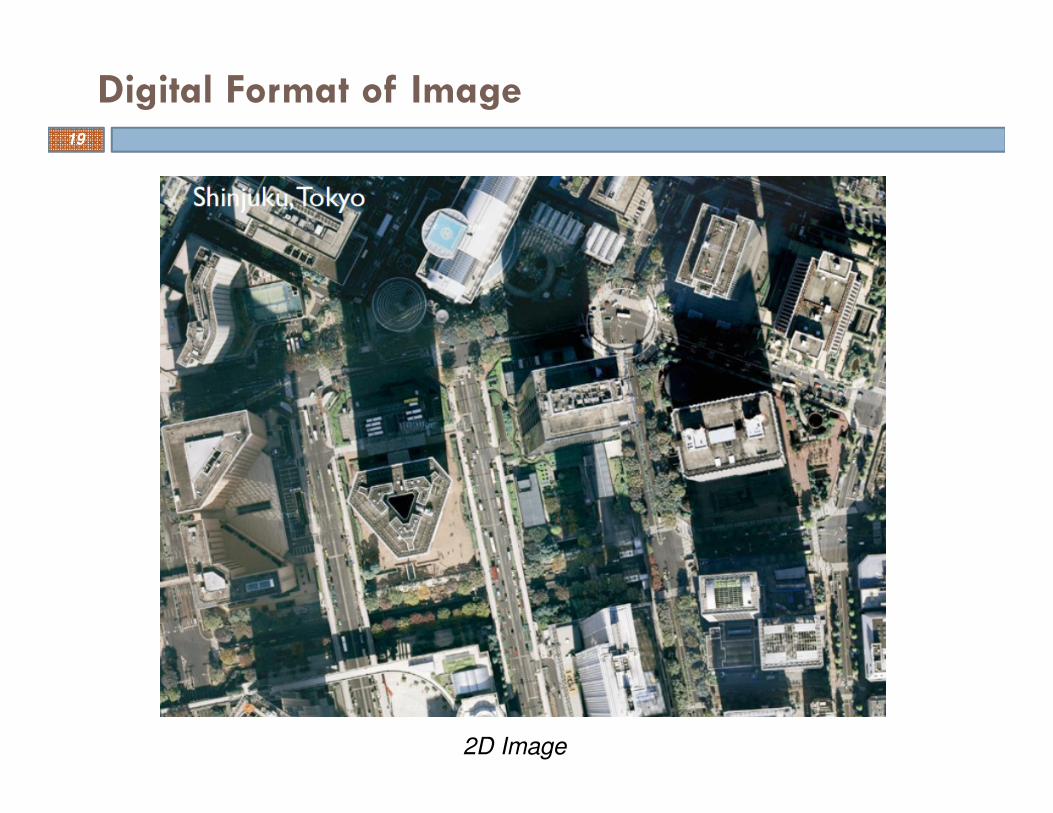
Digital Format of Image
2D Image
19
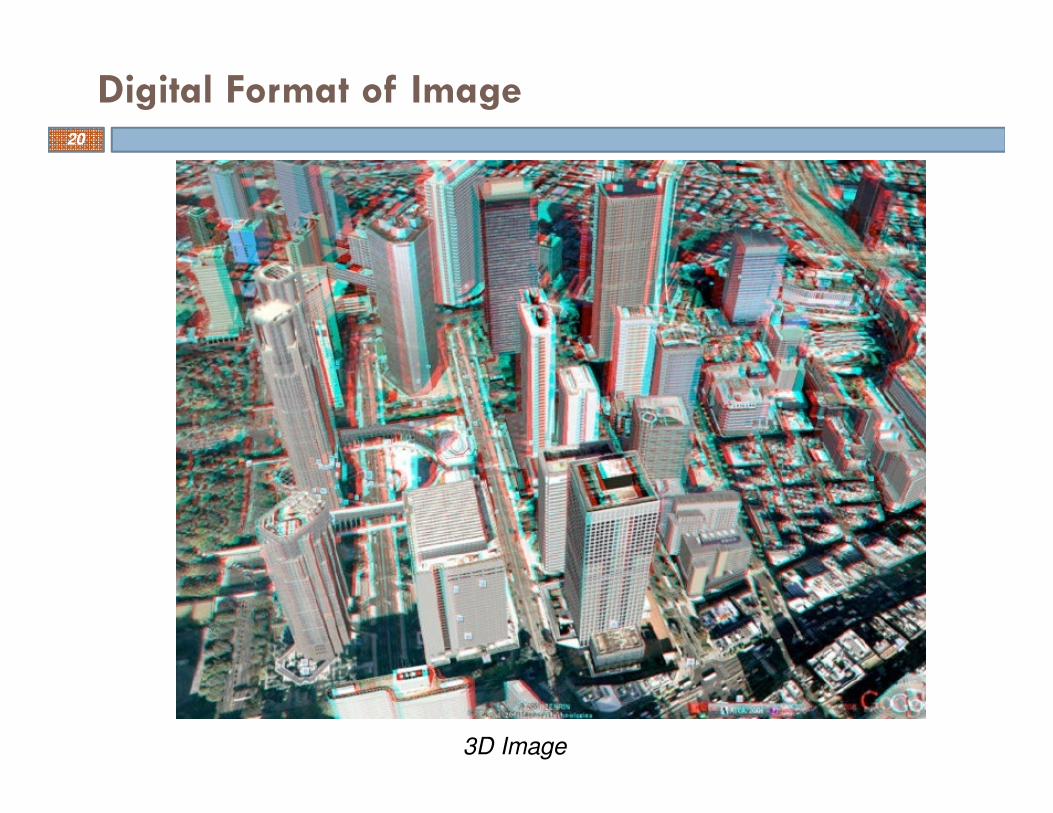
Digital Format of Image
3D Image
20
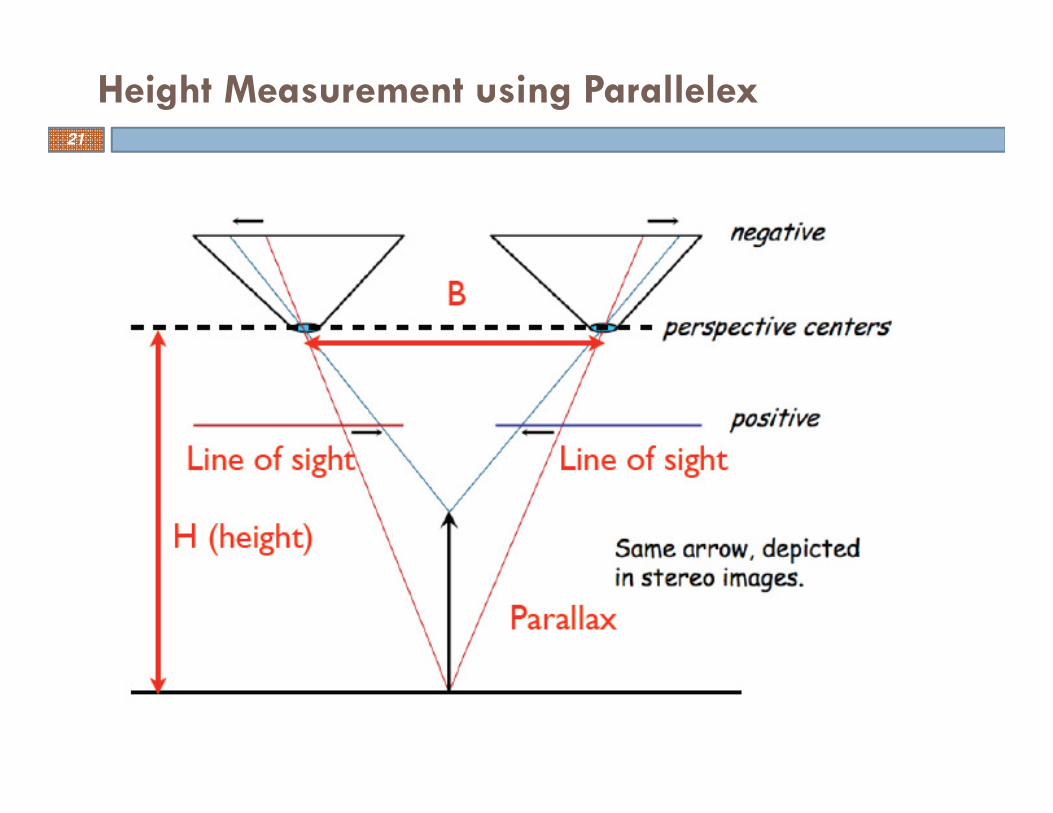
Height Measurement using Parallelex21
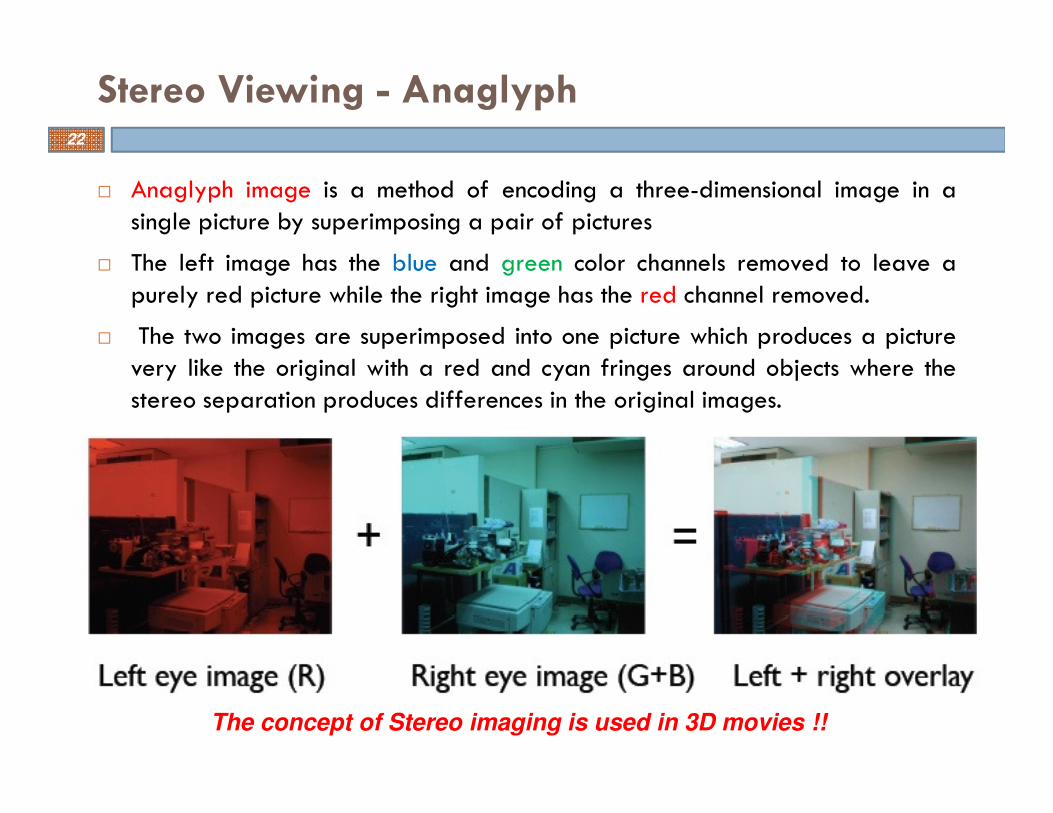
� Anaglyph image is a method of encoding a three-dimensional image in asingle picture by superimposing a pair of pictures
� The left image has the blue and green color channels removed to leave apurely red picture while the right image has the red channel removed.
� The two images are superimposed into one picture which produces a picturevery like the original with a red and cyan fringes around objects where thestereo separation produces differences in the original images.
Stereo Viewing - Anaglyph
The concept of Stereo imaging is used in 3D movies !!
22
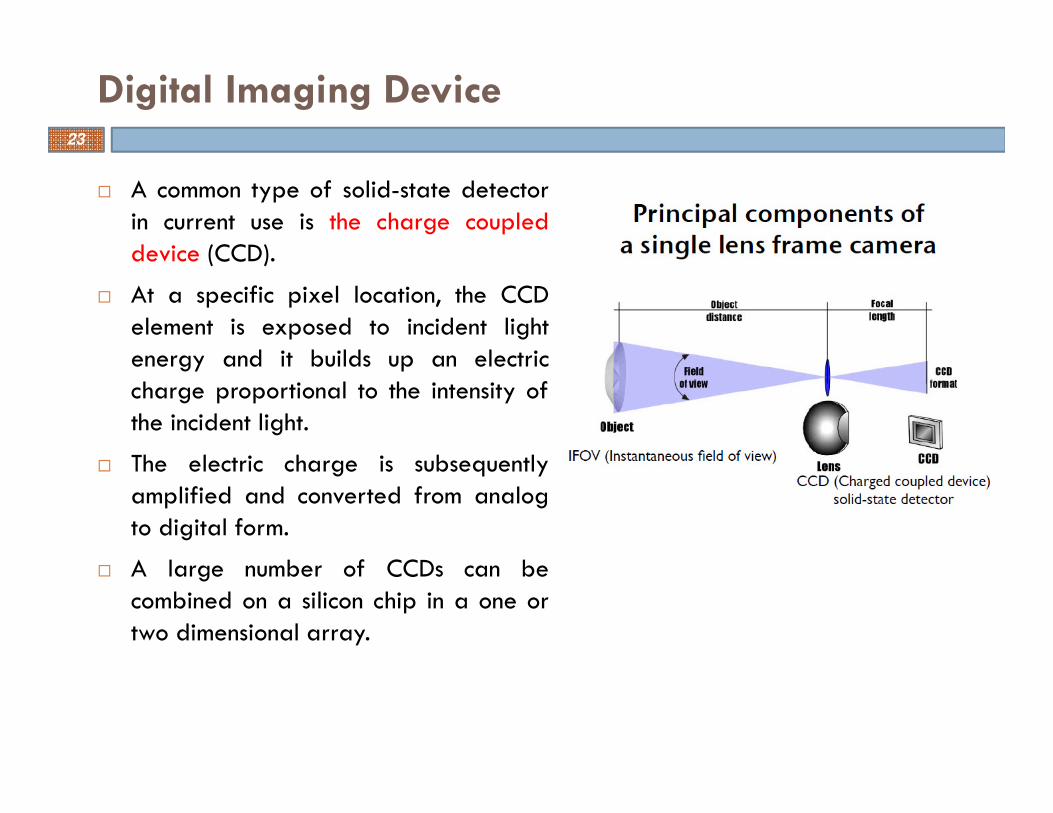
� A common type of solid-state detectorin current use is the charge coupleddevice (CCD).
� At a specific pixel location, the CCDelement is exposed to incident lightenergy and it builds up an electriccharge proportional to the intensity ofthe incident light.
� The electric charge is subsequentlyamplified and converted from analogto digital form.
� A large number of CCDs can becombined on a silicon chip in a one ortwo dimensional array.
Digital Imaging Device23
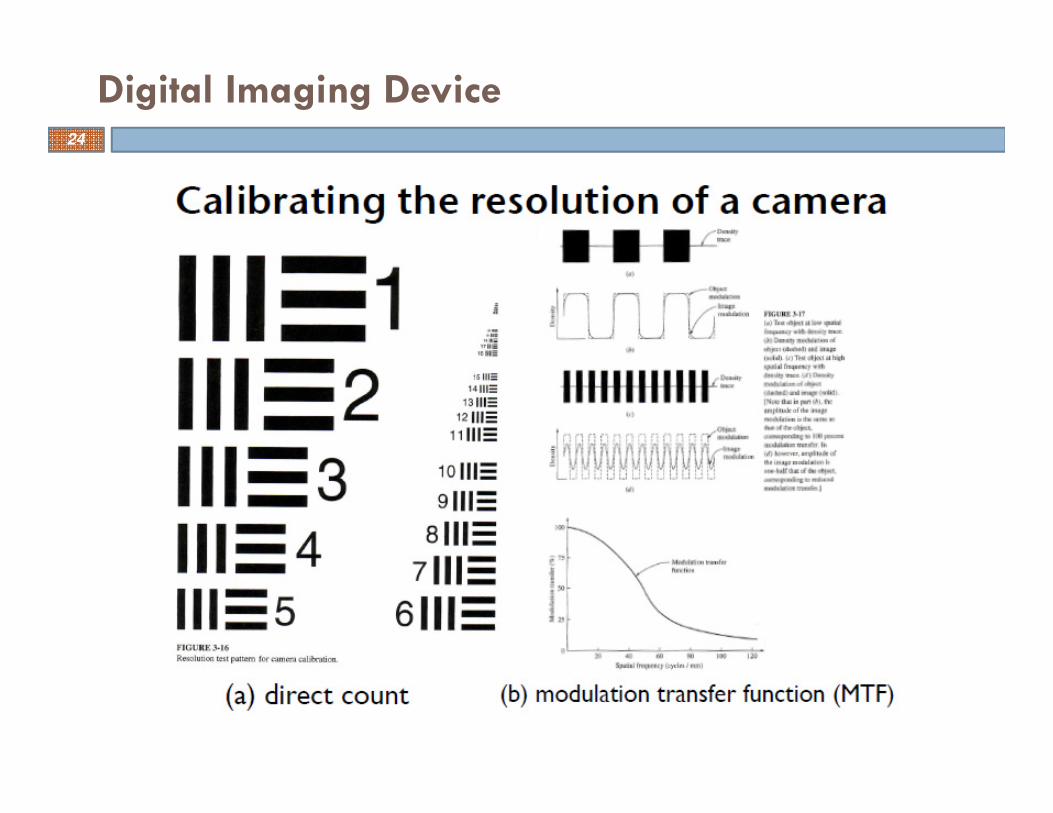
Digital Imaging Device24
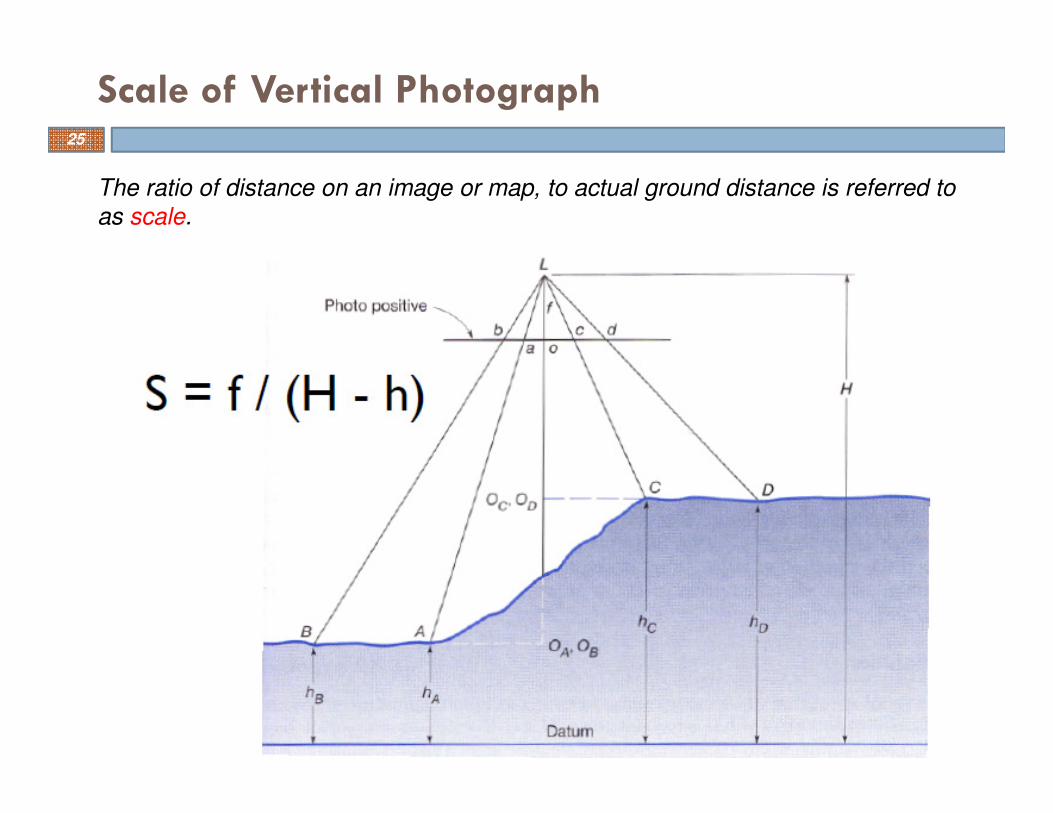
Scale of Vertical Photograph
The ratio of distance on an image or map, to actual ground distance is referred to
as scale.
25
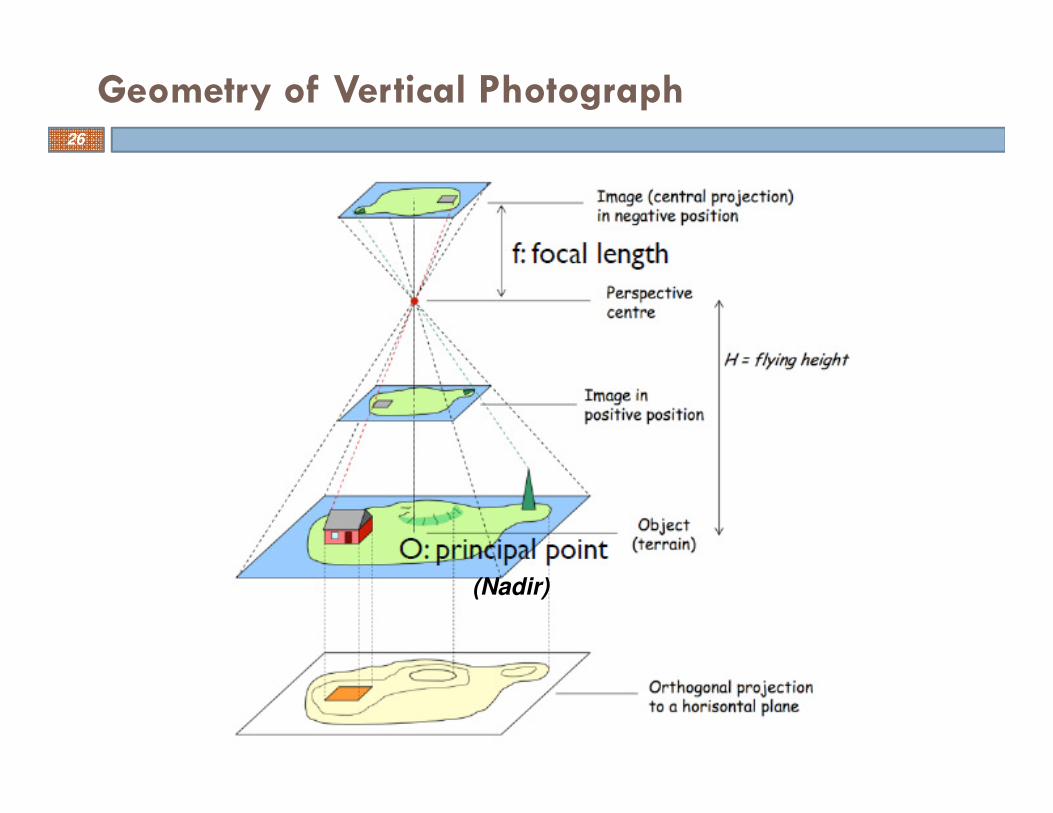
Geometry of Vertical Photograph
(Nadir)
26
� Types of distortion include:
� Atmospheric refraction of light rays
� Image motion or camera shake
� Lens distortion (interior orientation)
� Types of displacement include:
� Curvature of the Earth
� Tilt (exterior orientation)
� Topographic or relief (including object height)
Types of Distortion and Displacement27
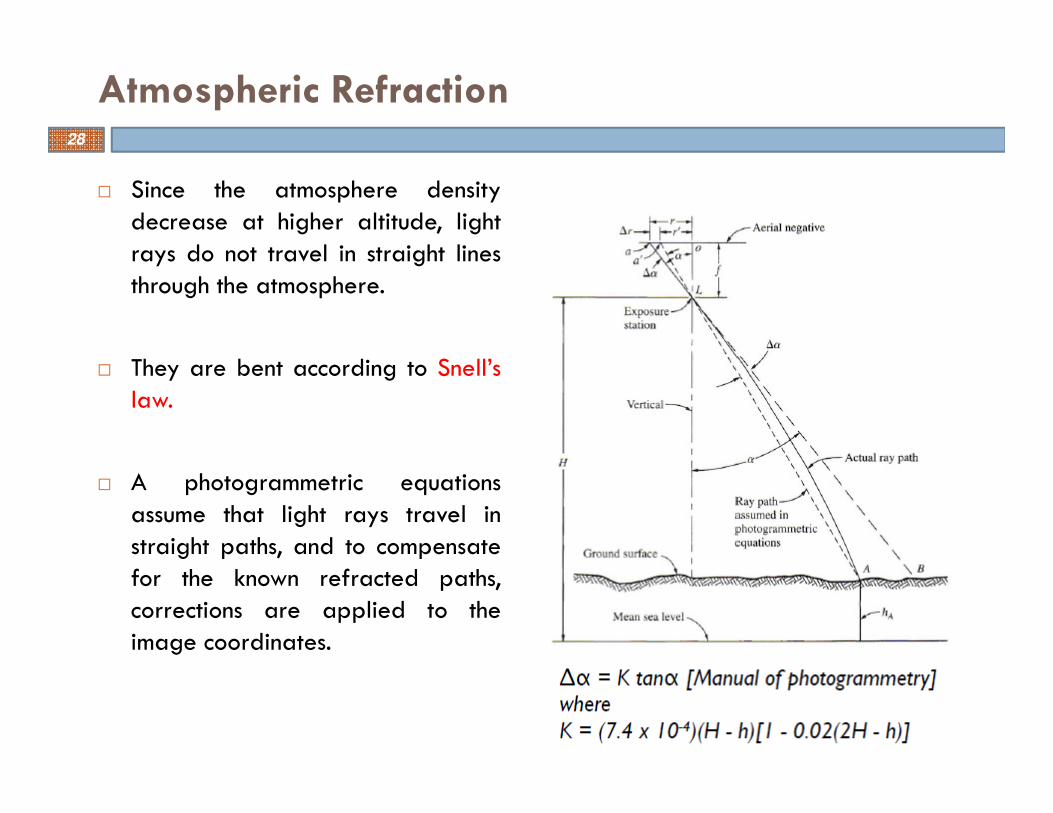
� Since the atmosphere densitydecrease at higher altitude, lightrays do not travel in straight linesthrough the atmosphere.
� They are bent according to Snell’slaw.
� A photogrammetric equationsassume that light rays travel instraight paths, and to compensatefor the known refracted paths,corrections are applied to theimage coordinates.
Atmospheric Refraction28
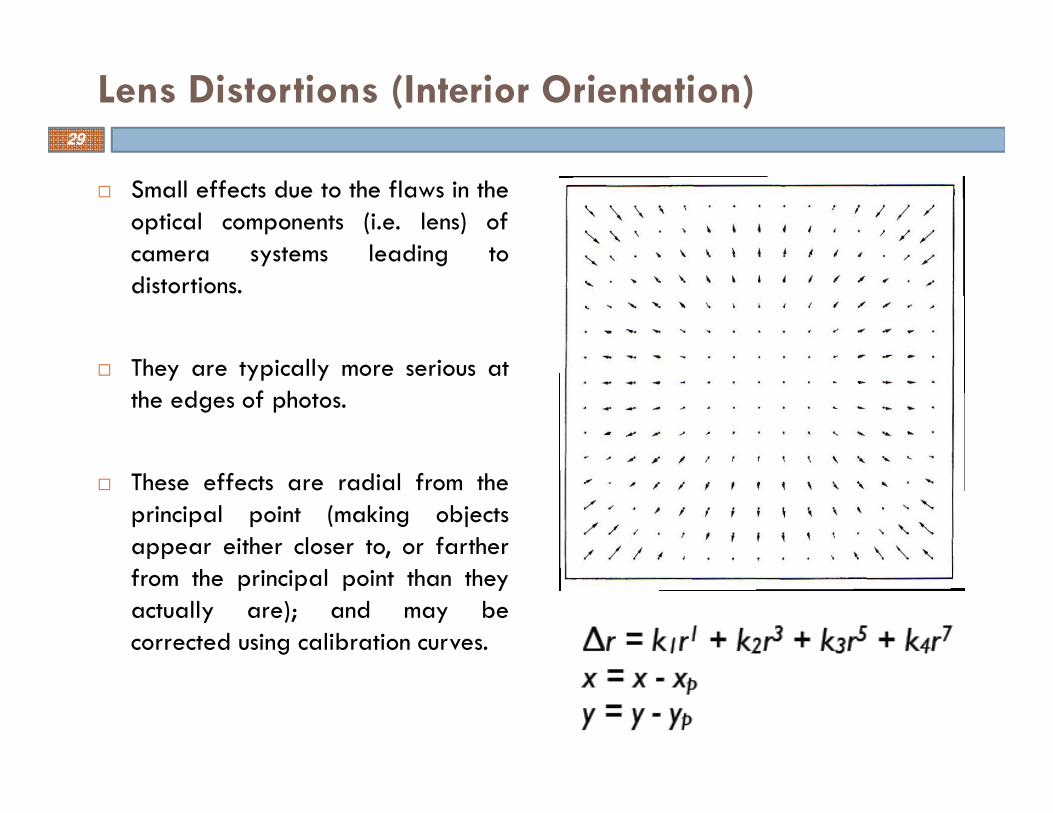
� Small effects due to the flaws in theoptical components (i.e. lens) ofcamera systems leading todistortions.
� They are typically more serious atthe edges of photos.
� These effects are radial from theprincipal point (making objectsappear either closer to, or fartherfrom the principal point than theyactually are); and may becorrected using calibration curves.
Lens Distortions (Interior Orientation)29
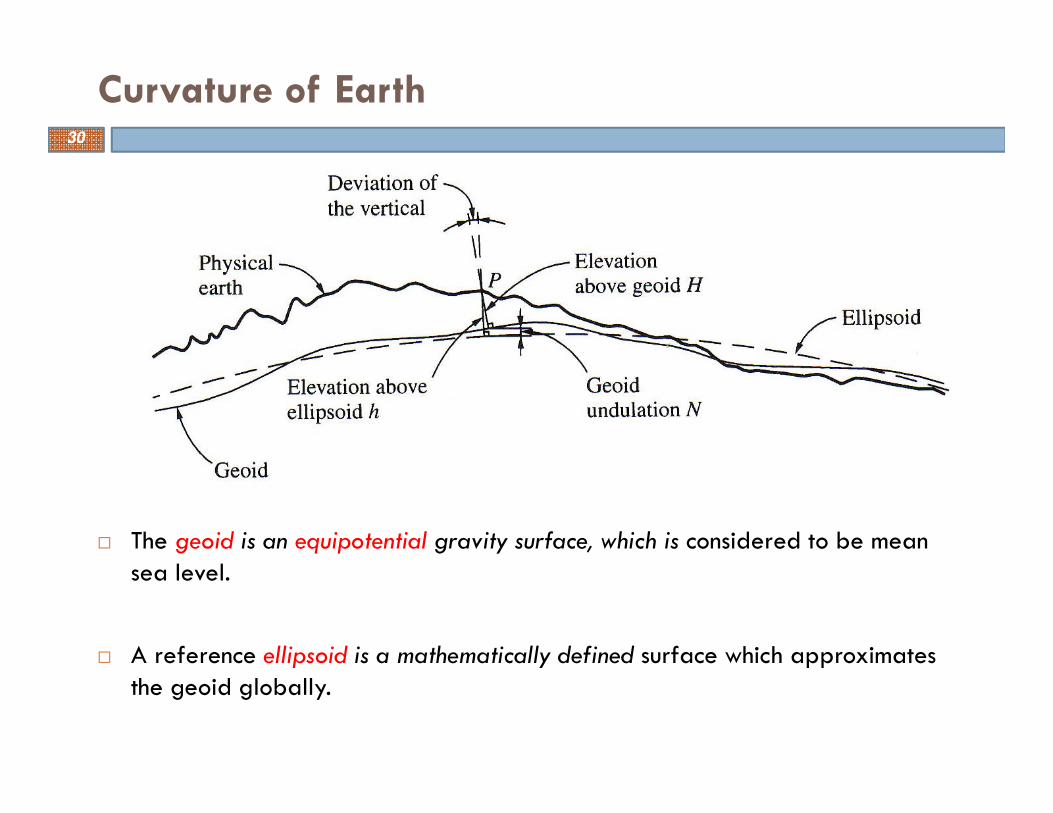
� The geoid is an equipotential gravity surface, which is considered to be mean sea level.
� A reference ellipsoid is a mathematically defined surface which approximates the geoid globally.
Curvature of Earth30
Definition of a Reference Ellipsoid31
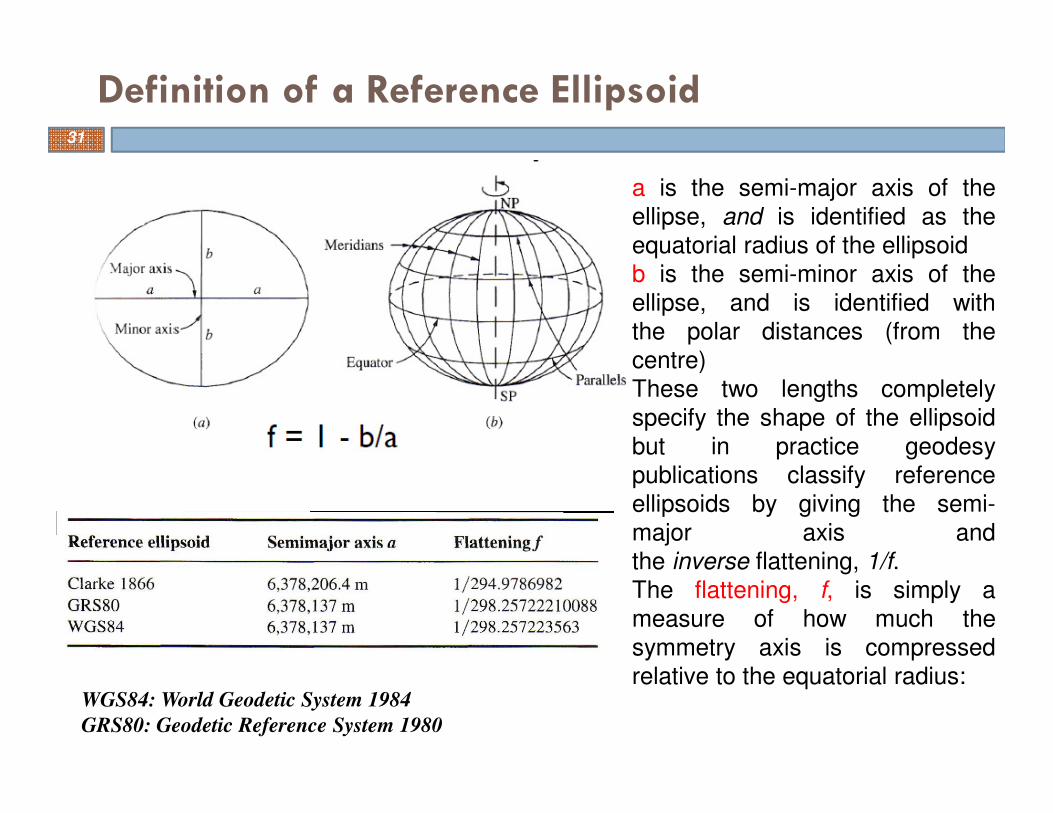
a is the semi-major axis of the
ellipse, and is identified as the
equatorial radius of the ellipsoid
b is the semi-minor axis of the
ellipse, and is identified with
the polar distances (from the
centre)
These two lengths completely
specify the shape of the ellipsoid
but in practice geodesy
publications classify reference
ellipsoids by giving the semi-
major axis and
the inverse flattening, 1/f.
The flattening, f, is simply a
measure of how much the
symmetry axis is compressed
relative to the equatorial radius:WGS84: World Geodetic System 1984
GRS80: Geodetic Reference System 1980
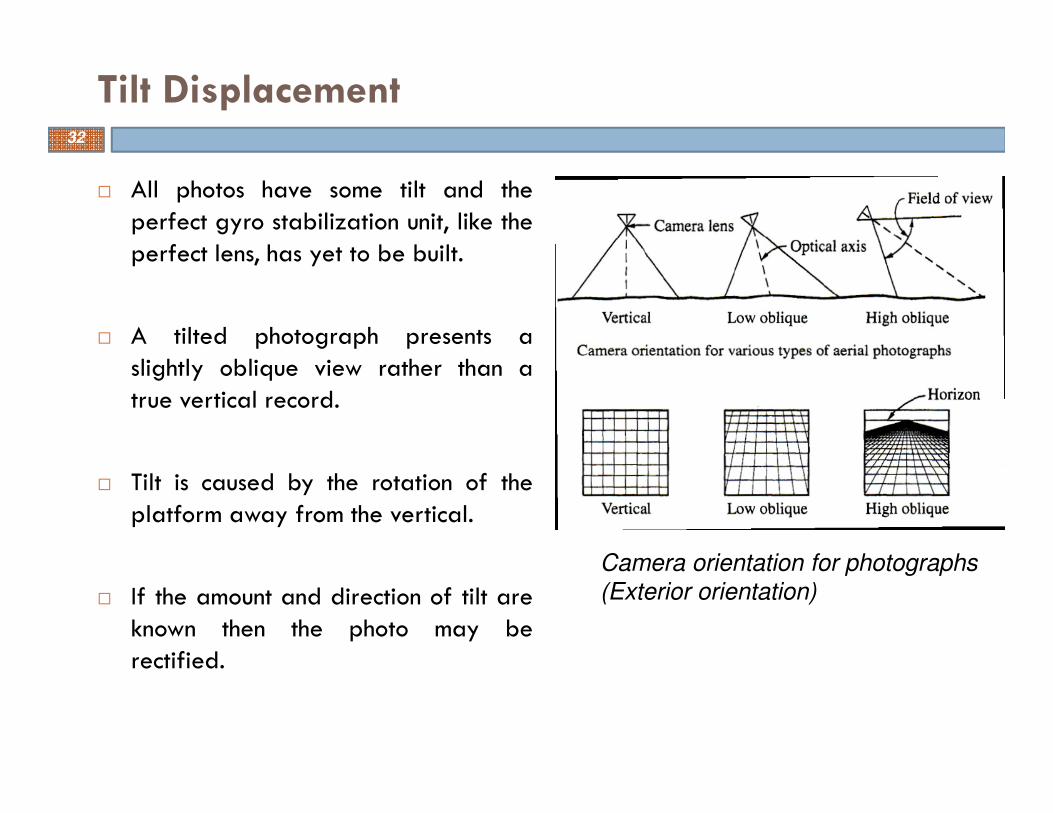
� All photos have some tilt and theperfect gyro stabilization unit, like theperfect lens, has yet to be built.
� A tilted photograph presents aslightly oblique view rather than atrue vertical record.
� Tilt is caused by the rotation of theplatform away from the vertical.
� If the amount and direction of tilt areknown then the photo may berectified.
Tilt Displacement
Camera orientation for photographs
(Exterior orientation)
32
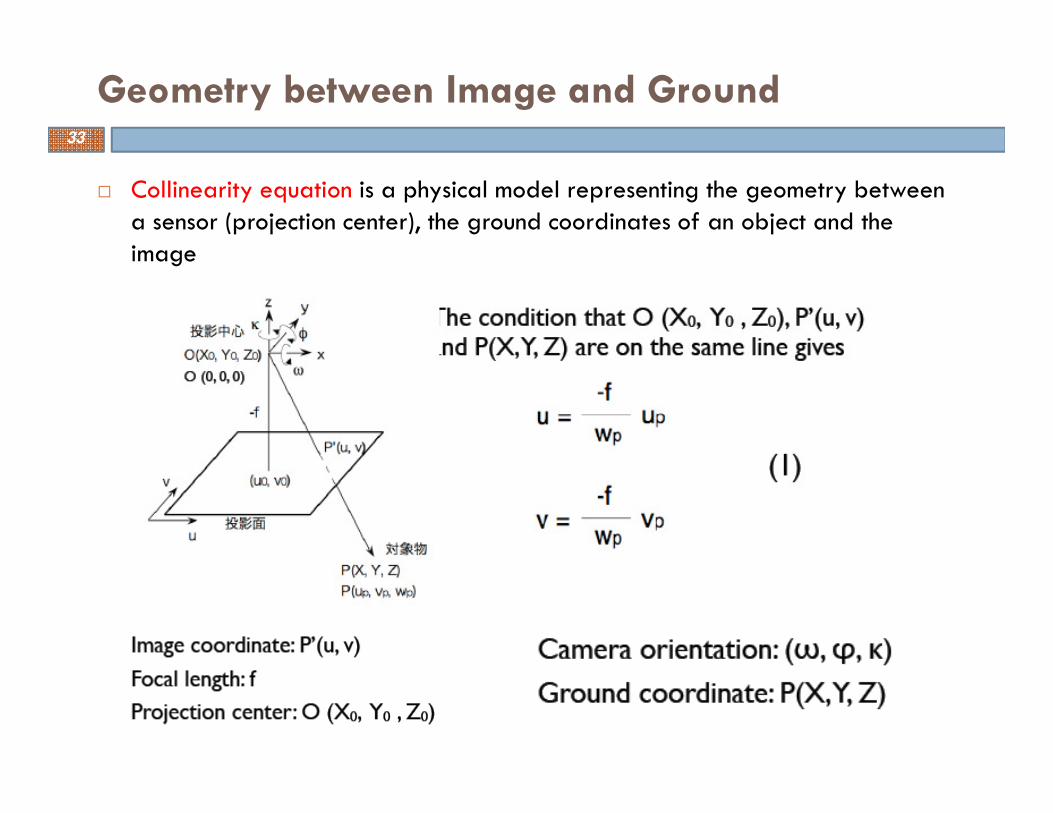
� Collinearity equation is a physical model representing the geometry between a sensor (projection center), the ground coordinates of an object and the image
Geometry between Image and Ground33
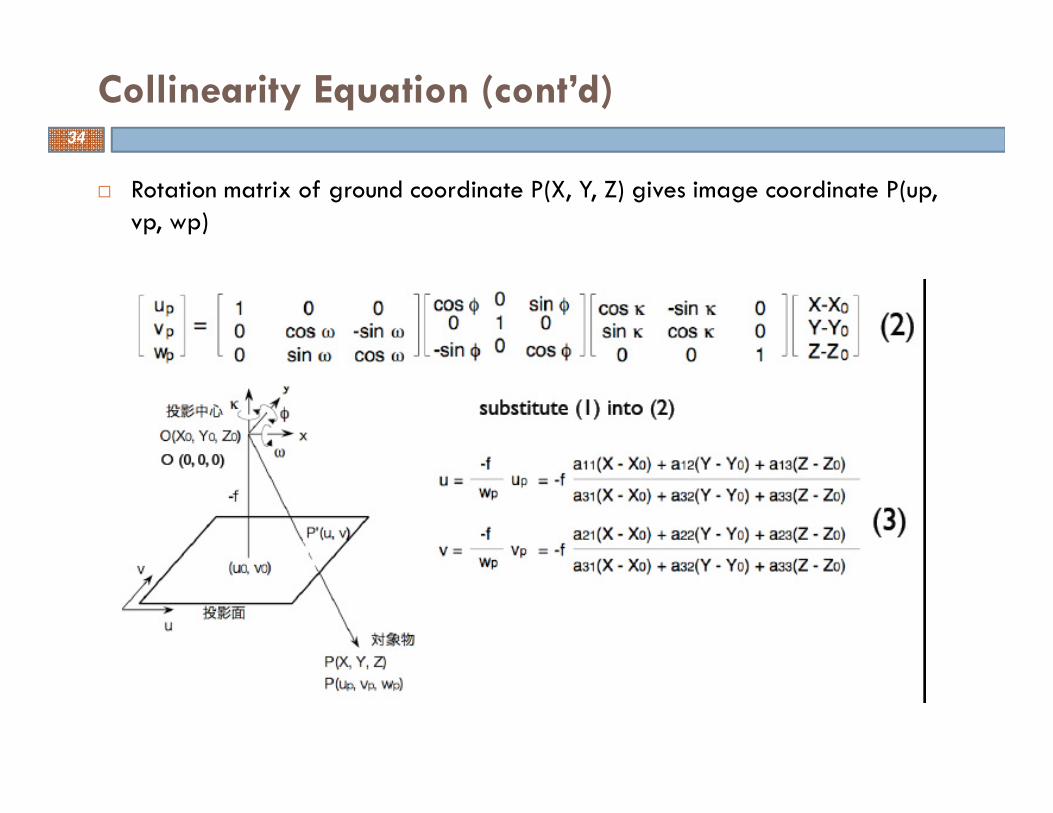
� Rotation matrix of ground coordinate P(X, Y, Z) gives image coordinate P(up, vp, wp)
Collinearity Equation (cont’d)34
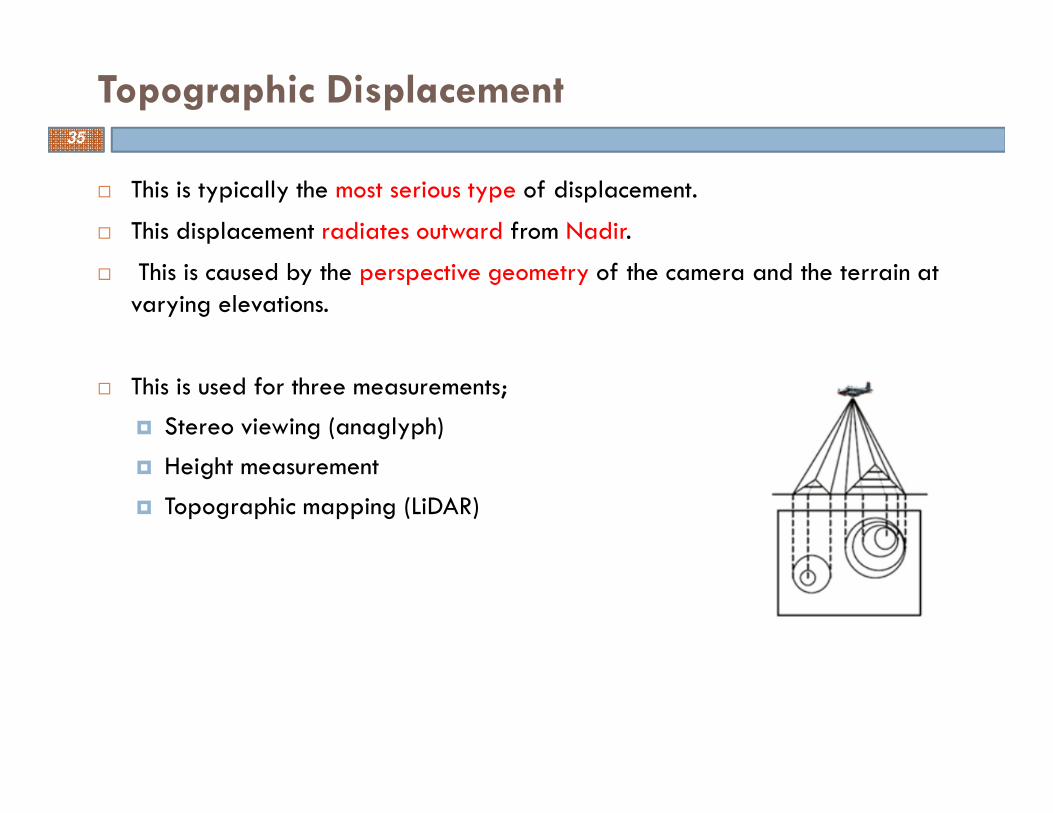
� This is typically the most serious type of displacement.
� This displacement radiates outward from Nadir.
� This is caused by the perspective geometry of the camera and the terrain at varying elevations.
� This is used for three measurements;
� Stereo viewing (anaglyph)
� Height measurement
� Topographic mapping (LiDAR)
Topographic Displacement35
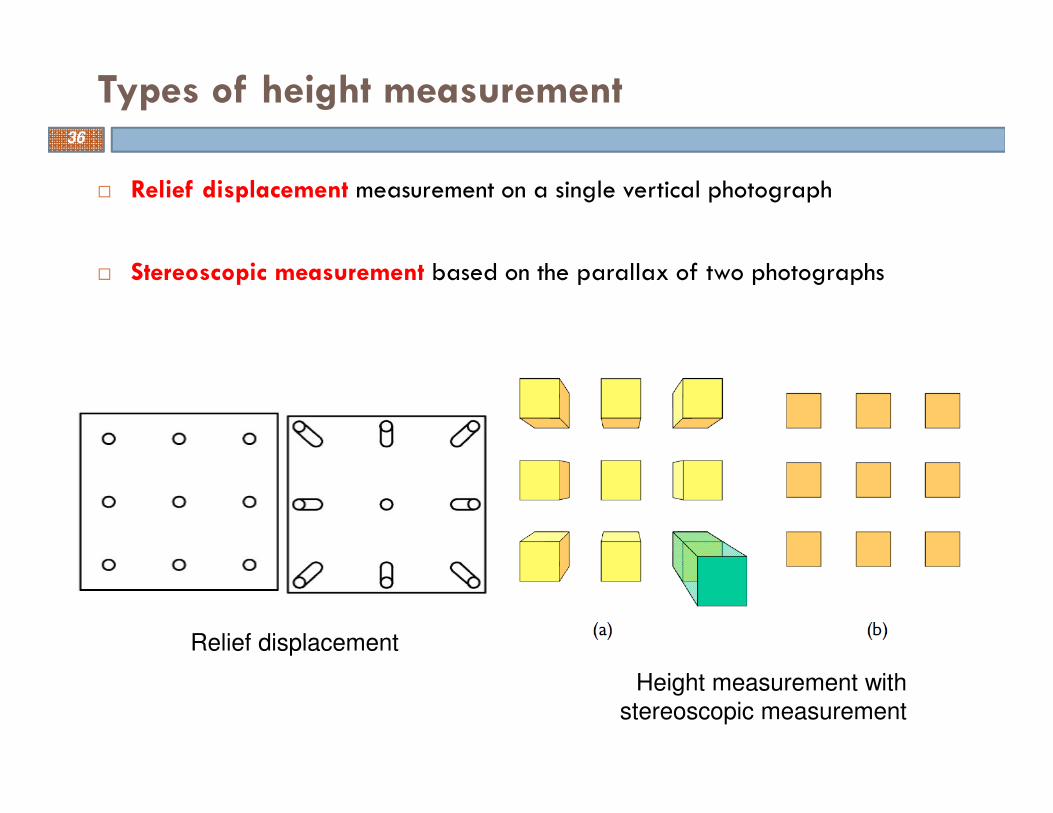
� Relief displacement measurement on a single vertical photograph
� Stereoscopic measurement based on the parallax of two photographs
Types of height measurement
Height measurement with
stereoscopic measurement
Relief displacement
36
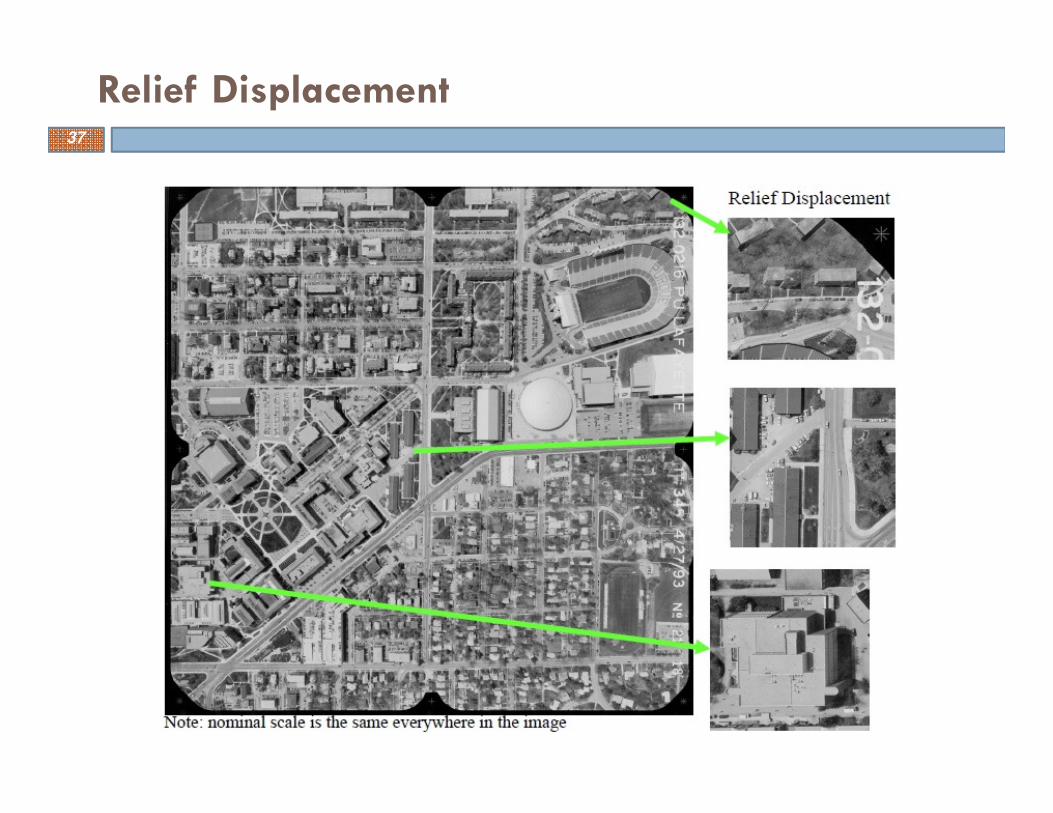
Relief Displacement37
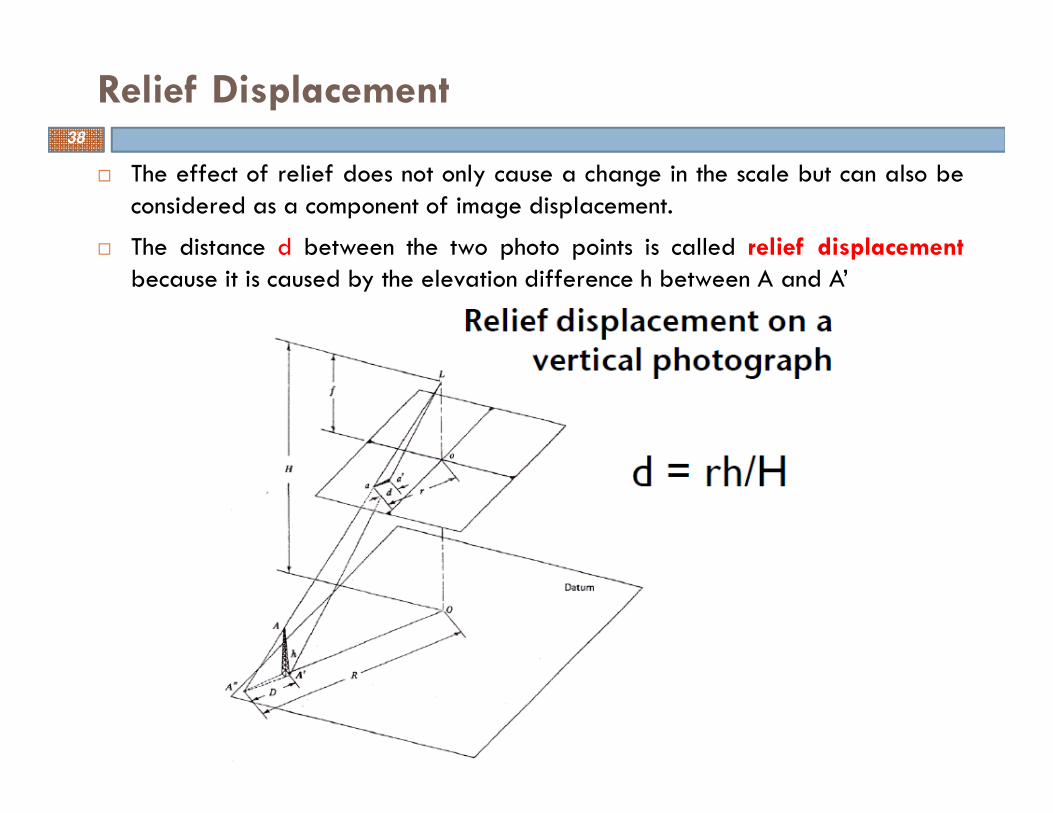
Relief Displacement
� The effect of relief does not only cause a change in the scale but can also beconsidered as a component of image displacement.
� The distance d between the two photo points is called relief displacement
because it is caused by the elevation difference h between A and A’
38
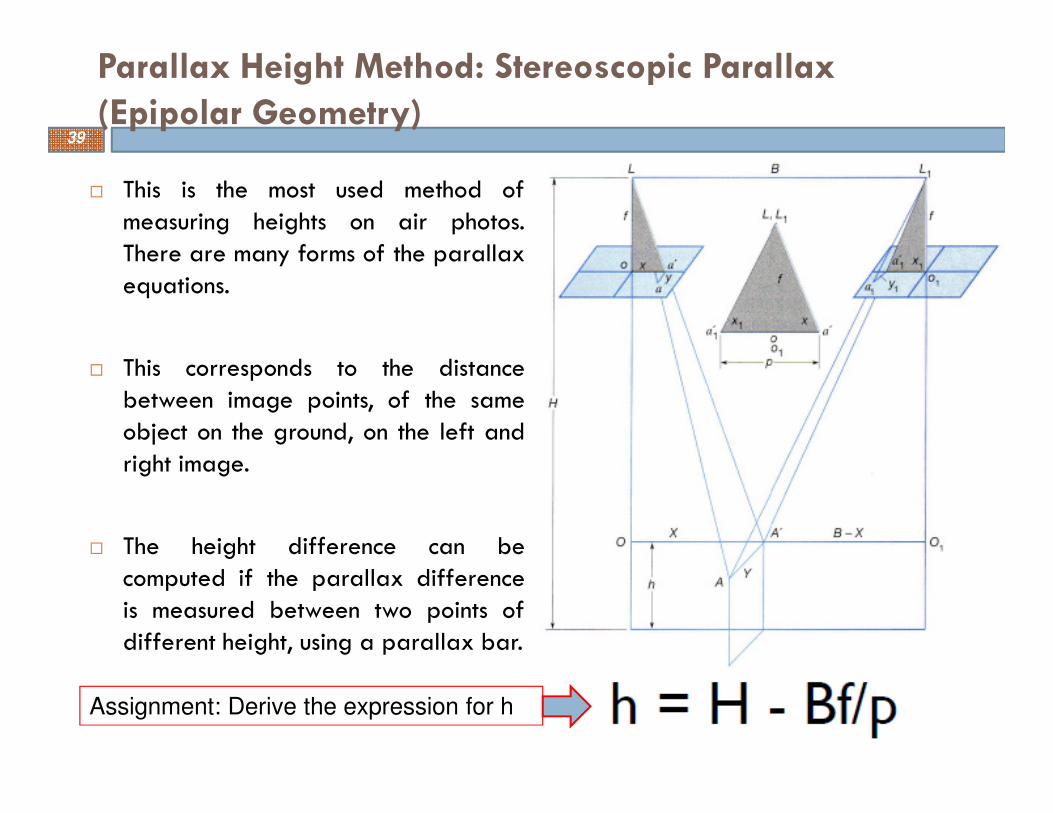
� This is the most used method ofmeasuring heights on air photos.There are many forms of the parallaxequations.
� This corresponds to the distancebetween image points, of the sameobject on the ground, on the left andright image.
� The height difference can becomputed if the parallax differenceis measured between two points ofdifferent height, using a parallax bar.
Parallax Height Method: Stereoscopic Parallax
(Epipolar Geometry)39
Assignment: Derive the expression for h
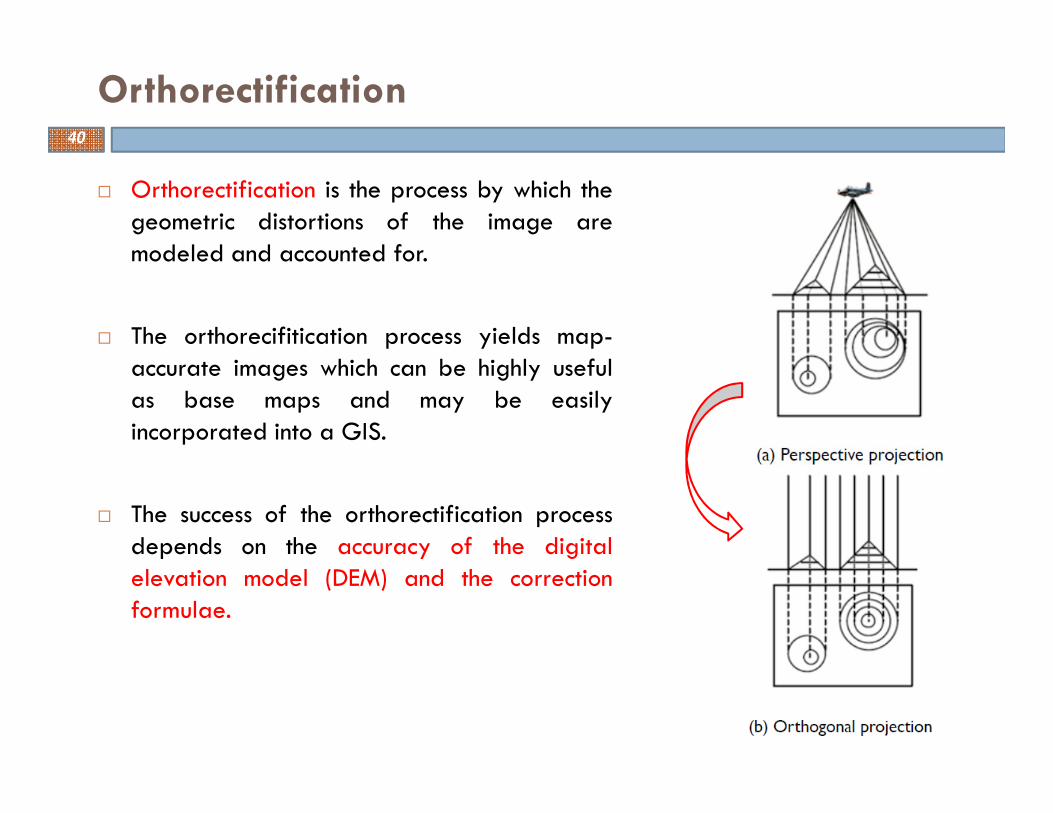
� Orthorectification is the process by which thegeometric distortions of the image aremodeled and accounted for.
� The orthorecifitication process yields map-accurate images which can be highly usefulas base maps and may be easilyincorporated into a GIS.
� The success of the orthorectification processdepends on the accuracy of the digitalelevation model (DEM) and the correctionformulae.
Orthorectification40
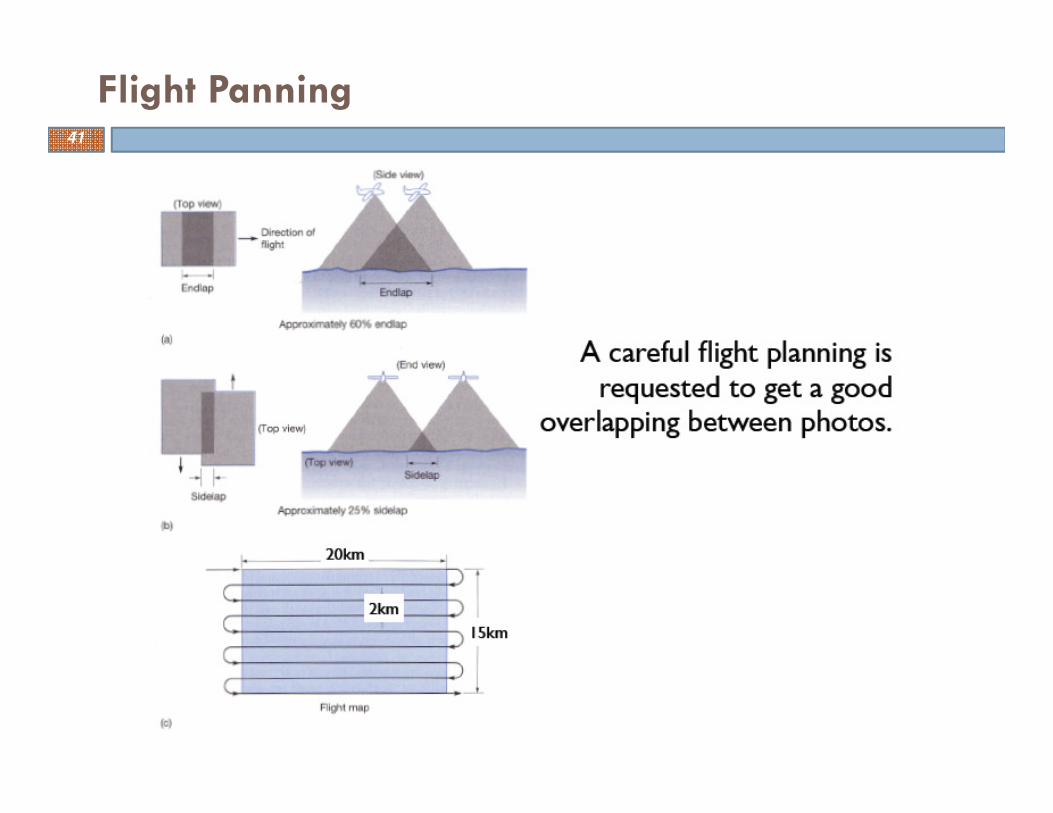
Flight Panning41
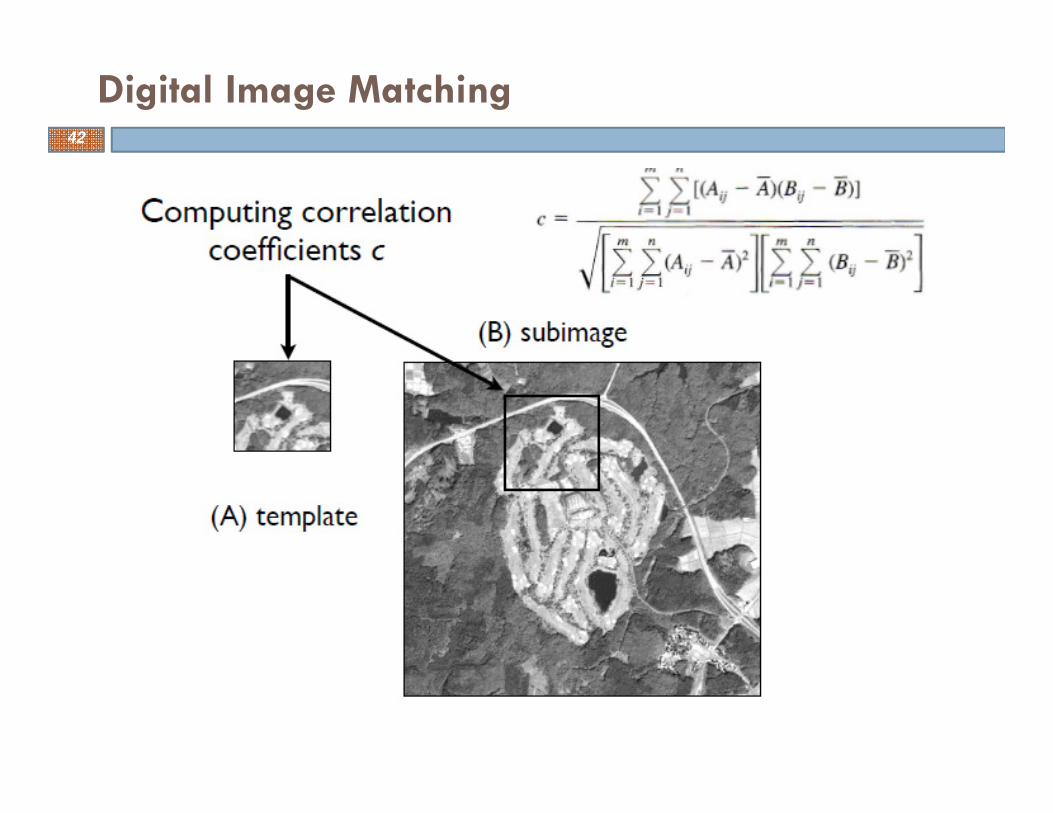
Digital Image Matching42
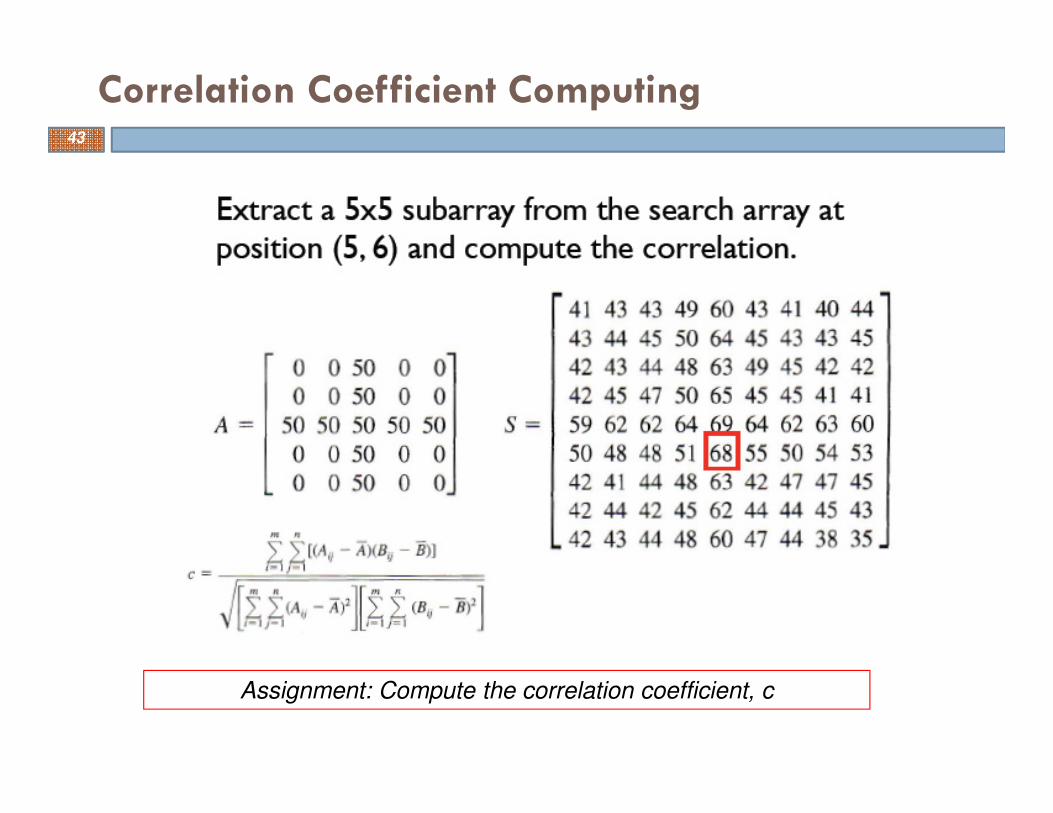
Correlation Coefficient Computing43
Assignment: Compute the correlation coefficient, c
� A digital elevation model (DEM) is defined as a file or database containingelevation points over a contiguous area.
� DEMs may be subdivided into:
� Digital surface models (DSM) that contain elevation information about allfeatures in the landscape, such as vegetation, buildings, and otherstructures;
� Digital terrain models (DTM) that contain elevation information about thebare-Earth surface without the influence of vegetation or man-madestructures.
� Four major technologies are used to obtain elevation information
� In situ surveying
� Photogrammetry
� Interferometric Synthetic Aperture Radar (IFSAR)
� Light Detection and Ranging (LiDAR)
Digital Elevation Models44
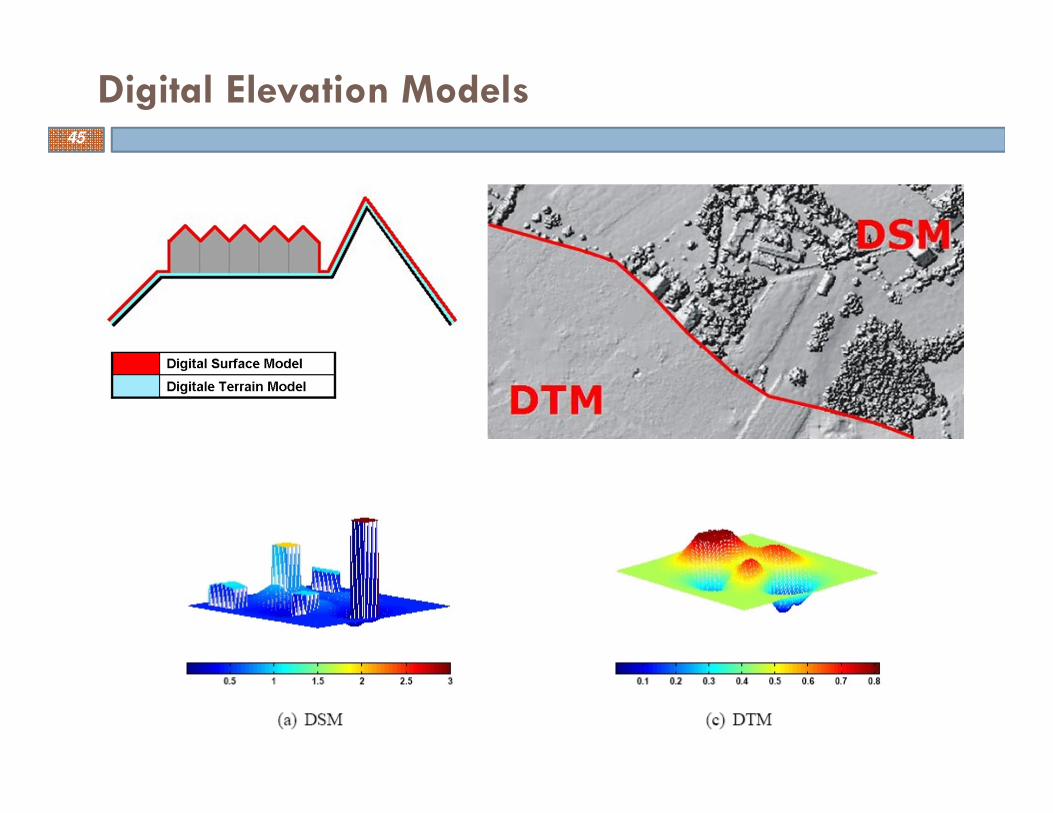
Digital Elevation Models45
� Extracting terrain parameters
� Modeling water flow or mass movement (e.g., avalanches and landslides)
� Creation of relief maps
� Rendering of 3D visualizations.
� 3d flight planning
� Creation of physical models (including raised-relief maps)
� Rectification of aerial photography or satellite imagery.
� Reduction (terrain correction) of gravity measurements (gravimetry, physical geodesy).
� Terrain analyses in geomorphology and physical geography
Uses of Digital Elevation Models
� Geographic Information Systems (GIS)Engineering and infrastructure design
� Global positioning systems (GPS)
� Line-of-sight analysis
� Base mapping
� Flight simulation
� Precision farming and forestry
� Surface analysis
� Intelligent transportation systems (ITS)
� Auto safety / Advanced DriverAssistance Systems (ADAS)
� Archaeology
46
Comments….
Questions….
Suggestions….
47
I am greatly thankful to all the information sources(regarding remote sensing and GIS) on internet that Iaccessed and utilized for the preparation of presentlecture.
Thank you !
Feel free to contact