Embed Size (px)
Citation preview

IJRET: International Journal of Research in Engineering and Technology eISSN: 2319-1163 | pISSN: 2321-7308
__________________________________________________________________________________________
Volume: 02 Issue: 09 | Sep-2013, Available @ http://www.ijret.org 501
OPTIMIZATION OF PROCESS PARAMETERS FOR VINEGAR
PRODUCTION USING BANANA FERMENTATION
Pooja Saha1, Soumitra Banerjee2
1, 2Department of Food Technology, Under TIFAC-CORE Activity, Techno India Salt Lake, Kolkata – 700091, India
[email protected], [email protected]
Abstract Vinegar fermentation was essentially a two-step process comprising the anaerobic conversion of sugars to ethanol (C2H5OH) and the
aerobic oxidation of ethanol to acetic acid (CH3CO2H). It was to be found that vinegar could be successfully produced from the juice
extracted from banana using yeast and Acetobacter. Banana fruit pulp was a suitable raw material for ethanol production by
fermentation and for vinegar production by this ethanol.
The present study indicates that a relatively good yield of ethanol and acetic acid can be obtained after optimization of certain
physical conditions for fermentation. For Banana Alcohol, the highest alcohol level was 7.77% at 10% sugar level, 8% yeast cell
concentration for 48 hrs. at 280C. For Banana Vinegar, the maximum acidity was obtained 4.67 % at 7.77% of alcohol level, 15% of
A. aceti cell concentration for 72 hrs. at 37 oC.
The Response Surface Methodology (RSM) was adopted to optimize the process parameters like Alcohol content, A.aceti cell
concentration and time for the vinegar fermentation using Acetobactor aceti (MTCC 2623) using statistical software , Design Expert
(version 8.0.7.1., StatEase, Inc., Minneapolis, USA). The statistical analyses and the closeness of the experimental results and model
predictions highlight the reliability of the regression model.
Keywords: Fermentation, Vinegar, Ethanol, Acetobactor aceti, Response Surface Methodology.
---------------------------------------------------------------------***-------------------------------------------------------------------------
1. INTRODUCTION
Vinegar was known worldwide as a seasoning or food
preserving agent. Vinegar is defined as ― a liquid fit for human
consumption, produced from a suitable raw material of
agricultural origin, containing starch, sugars, or starch and
sugars by the process of double fermentation, alcoholic and
acetous, and contains a specified amount of acetic acid‖ (Joint
FAO/ WHO Food Standards Programme, 1987).
Vinegar, a traditional acidic condiment, is widely produced
from rice, malt, apples, wine and various other agricultural
material (Ciani, 1998; Horiuchi et. al., 1999). Vinegar
production ranges from traditional methods employing wood
casks and surface culture to submerged fermentation in
acetators (Morales et al 2001).Vinegar fermentation is
essentially a two stage process, being the first one the
anaerobic conversion of fermentable sugars to ethanol by
yeasts, usually Saccharomyces species, and the second the
aerobic oxidation of ethanol to acetic acid by bacteria, usually
Acetobacter species (Adams, 1998; Horiuchi et. al., 2000).
Acetic acid yield from fermented sugar is approximately 40%,
with the remaining sugar metabolites either lost to
volatilization or converted into other compounds. Acid yield
improvements can be achieved using high rates aeration
during continuous production (Ghommidh et al 1986).
Vinegar bacteria, also called Acetic Acid Bacteria (AAB), are
members of the genus Acetobacter and characterized by their
ability to convert ethyl alcohol, C2H5OH, into acetic acid,
CH3CO2H, by oxidation as shown below:
Anaerobic Aerobic
2C2H5OH 2CH3CHO 2CH3CO2H + 2H2O
Vinegar traditionally has been used as a food preservative.
Whether naturally produced during fermentation or
intentionally added, vinegar retards microbial growth and
contributes sensory properties to a number of foods. The wide
diversity of products containing vinegar (sauces, ketchup,
mayonnaise, etc.) and the current fall in wine consumption
have favored an increase in vinegar production (De Ory et al
2002).
According to FDA (Food and Drug Administration, USA),
vinegar as a sour solution, contains not less than 4 grams of
acetic acid in 100 cubic centimeters at 20°C that is produced
through alcoholic and successively acetic fermentation of
sugary and starchy substrates. Earlier processes used for
making vinegar were the Orleans process (which is also
known as the slow process), the quick process (which is also
called the generator process), and the submerged culture

IJRET: International Journal of Research in Engineering and Technology eISSN: 2319-1163 | pISSN: 2321-7308
__________________________________________________________________________________________
Volume: 02 Issue: 09 | Sep-2013, Available @ http://www.ijret.org 502
process. The quick process and submerged culture process
were developed and are used for commercial vinegar
production today. Further processing of vinegar, following
substrate conversion to acetic acid may include filtration,
clarification distillation and pasteurization at 165.2°F (74°C)
before it is bottled. Acetic acid concentration in vinegar may
be expressed using the term ―grain‖.
India is leading the world in the production of bananas. Mostly
in India, Tamil nadu is the state produces the highest quantity
of bananas. Due to a high rate of productivity of bananas in
India they are easily available and available at low prices in
the market. As bananas have a short shelf-life , there is a rapid
rate of deterioration of this fruit (Akubor et al.,2003). Banana
(Musa sp.) is a large perennial herb with leaf sheaths that form
trunk-like pseudostem. It is rich in vitamin B6, which helps
fight infection and is essential for the synthesis of heme—the
iron containing part of haemoglobin. Banana is also rich in
potassium and is a great source of fibre. A good quality
alcoholic base for producing vinegar containing 5-6% acetic
acid was obtained. Simmonds (1966) reported that vinegar has
been prepared by fermenting a mash of banana pulp and peel.
Vinegar production from banana may enhance minimize cost
of production and eco-friendly.
Traditionally ethanol has been produced by batch
fermentation; employing Saccharomyces cerevesiae the name
first applied by Meyen (1838) to distinguish beer yeasts from
those isolated from other alcoholic beverages is still a major
concern of all the researchers in the field. Yeasts are the only
organisms currently used for large scale industrial ethanol
production. Many of these newly developed bioprocesses for
ethanol are mainly aimed at to enhance the productivity by
employing high cell densities in the fermentor. It has been
well recognized that alcoholic fermentation are limited due to
the inhibitory effects of both substrate and product.
An efficient ethanol production requires four components:
fermentable carbohydrates, anefficient yeast strain, a few
nutrients and simple culture conditions. In this experiment,
Saccharomyces cerevisiae yeast is used to convert glucose
into ethyl alcohol. The yeast cell contains enzyme catalysts
that provide an energetically favorable pathway for the
reaction. Acetic fermentation is the next step in alcoholic
fermentation, where alcohol molecules are oxidized into acetic
acid molecules by the action of Acetobacter aceti bacteria,
giving it the characteristic vinegar taste.
Response surface methodology (RSM) has been successfully
used to model and optimize biochemical and biotechnological
processes related to food systems. This methodology is
employed to optimize media for Acetic acid fermentation.
1.1. OBJECTIVE OF THE PROJECT
To produce vinegar from banana which provides
more practical feasibility due to its low cost
To optimize the conditions of fermentation for the
production of banana juice vinegar.
to verify the effects of the initial concentrations of
ethanol and acetic acid as two independent variables
on process yield and productivity
to process optimization by the statistical design of
experiments
To optimize of the different factors that play an
important role in banana juice vinegar production.
2. MATERIALS AND METHODS
2.1. BANANA ALCOHOL PRODUCTION
2.1.1. SOURCE OF BANANAS
The bananas used in this study were variety ‗Singhapuri‘
(Musa cavendishi) obtained from local markets in Kolkata,
West Bengal, India. The bananas were selected according to
the required degree of ripeness needed at a time of purchase.
Occasionally, the bananas continued to ripen at a room
temperature until the proper degree of ripeness was obtained.
2.1.2. PREPARATION OF BANANA JUICE
Several bananas were selected at random to be analyzed. The
whole fruits were weighed and peeled. The fruits were then
weighed. The components were hand chopped, crushed,
sampled and immediately frozen until analyzed. However, the
stored samples were utilized within 24 h of collection.
2.1.3. PRE-TREATMENT OF BANANA SAMPLES
Moisture content in the raw banana samples and banana pulp
of was determined by drying in oven at 105°C for 2 h. The
titration method of Lane and Eynonl is used to determine the
sugars content of banana juice and after pectinase addition, the
total sugar content of banana juice. The bananas were crushed
in mixer and the pulp was adjusted to 15° Brix (concentration
of soluble solids) by the addition of distillated water. The pH
content of the raw banana samples and the banana pulp was
estimated by the pH paper.
2.1.4. DEPECTINISE THE PECTINASE
MATERIAL (PECTIN SUBSTANCES) OF
BANANA PULP BY THE USE OF PECTINASE
ENZYME
A sequential working was done on the activity of the pectinase
enzyme on the banana pulp which was very much bulky. To
obtain a clear juice from that bulky material, pectinase enzyme
was treated in very minute quantity (0.0003 %) w/v and the
banana pulp was then incubated for about 6 hours at a

IJRET: International Journal of Research in Engineering and Technology eISSN: 2319-1163 | pISSN: 2321-7308
__________________________________________________________________________________________
Volume: 02 Issue: 09 | Sep-2013, Available @ http://www.ijret.org 503
temperature of 38 degree centigrade with occasional stirring.
A work had been done by taking of 0.0001 % (w/v), 0.0002%
(w/v), 0.0003% (w/v), 0.0004 % (w/v),0.0005 % (w/v). The
best result was obtained at 0.0003 % (w/v) and maximum
juice was extracted using this percentage of the pectinase
enzyme. The 0.0001% and 0.0002% (w/v) showed a result
with incomplete breakdown of the pectin substances in banana
pulp and hence the juice remained as partially bulky and the
juice extracted was less and more residues were obtained
which showed that the deficiency of the enzyme for the
breakdown of the pectinaceous material. And 0.004 % and
0.0005 % (w/v) showed no difference in the volume of juice
that was extracted by using the 0.0003 % (w/v) pectinase
enzyme and also in no difference in the weight of the banana
residue. The experiment showed that the pectinase enzyme
remained unused in case of 0.004 % & 0.005 % (w/v). Hence,
we lead to a conclusion that the exact amount of pectinase
enzyme required to breakdown the pectic substances or the
pectinaceous materials present in the banana pulp is 0.0003 %
(w/v). Enzyme activity of the pectinase enzyme is 14 IU per
gram.
2.1.5. CULTURE MEDIUM PREPARATION AND
INOCULUM & INOCULATION
In culture medium preparation, a pinch of active dry yeast
(Saccharomyces cerevisiae) was added to the sterile luke
warm water. Then it was kept for 10 mins. The yeast inoculum
was used at 10% to inoculate sterilized YEPD broth (DW
1000ml, Peptone 5gm, Yeast Extract 5gm, Dextrose 10gm, pH
5). Then these growth medium was kept for aeration at 28ºC
on a rotary shaker (200rpm) for 24 hrs before performing the
fermentaion.
2.1.6. LABOTORY SCALE OF BANANA
ALCOHOL PRODUCTION
Chart-1: FLOW CHART OF ALCOHOL FERMENTATION
FERMENTATION MEDIUM PREPARED WITH BANANA JUICE
AUTOCLAVED (1210C, 15psi)
YEAST GROWTH MEDIUM
8% & 10% addition
STERILE MEDIUM
SET A SET B SET C
SUGAR = 10% SUGAR = 10% SUGAR = 12%
YEAST INOCULATE = 8% YEAST = 10% YEAST = 10%
KEPT FOR AERATION
(TO CONTINUOUS SHAKING WITH COTTON PLUGGED, 2HRS.,280C)
MEDIUM COVERED BY AL. FOIL
ANAEROBIC CONDITION MAINTAINED,
KEEP IN DARK CONDITION FOR 48 HRS. OR LONGER
DISTILLATION
CHECK ALCOHOL% OF THE FERMENTATION BROTH
AND KEPT AT REFRIGERATED CONDITION

IJRET: International Journal of Research in Engineering and Technology eISSN: 2319-1163 | pISSN: 2321-7308
__________________________________________________________________________________________
Volume: 02 Issue: 09 | Sep-2013, Available @ http://www.ijret.org 504
2.1.7. DETERMINATION OF ALCOHOL
CONTENT OF BANANA FERMENTATION
BROTH
The ethanol concentrations were estimated using the
potassium dichromate redox titrations with Sodium
Thiosulphate (this method was determined by College of
Science, University of Canterbury, Christchurch, New Zealand
(www.outreach.canterbury.ac.nz).
(1) (2)
Fig- (1): After yeast cell inoculation and after 2 hrs. Shaking,
(2) Alcohol fermentation broth to allow anaerobic
fermentation
2.2. VINEGAR PRODUCTION
2.2.1. MICROORGANISMS, CULTURE MEDIA
AND CULTIVATION
Lyophilized culture of Acetobacter aceti (MTCC 2623) was
obtained from the Microbial Type Culture Collection and
Gene Bank (MTCC), Chandigarh, India. The strain was
maintained on YPM agar medium (Distilled Water 1000ml,
Yeast Extract 5gm, Peptone 3gm, Manitol 25gm, Agar 12gm,
pH is Not adjusted) slant at 370C for 24 - 48hrs. Then one loop
of cells from the slant was inoculated into YPM medium
(Distilled Water 100 ml, Yeast Extract 0.5gm, Peptone 0.3gm,
Manitol 2.5gm, pH is not adjusted) and incubated on
continuous shaking for 24-48 h at 370C, and then Acetobactor
aceti growth medium was prepared and ready for inoculated to
fermentation broth samples (SET A, SET B, SET C) to
produce vinegar.
Chart-2: FLOW CHART OF PRODUCTION OF VINEGAR
ALCOHOL FERMENTATION BROTH
SET A, SET B, SET C
CENTRIFUE FOR 15 MINS
COLLECTING SUPERNATENT USINE ICE BATH
SET A, SET B, SET C FERMENTATION BROTH
ADDITION OF 5%, 10%, 15% EACH
A.aceti GROWTH MEDIUM
CONTINUOUS SHAKING AT 37 0C FOR 24 HRS., 48HRS.,72HRS.
VINEGAR PRODUCED
& STORE IN REFRIGERATED CONDITION
CHECK pH, TOTAL ACIDITY %, OD IN EVERY 24 HRS, 48 HRS. & 72 HRS.

IJRET: International Journal of Research in Engineering and Technology eISSN: 2319-1163 | pISSN: 2321-7308
__________________________________________________________________________________________
Volume: 02 Issue: 09 | Sep-2013, Available @ http://www.ijret.org 505
2.2.2. ESTIMATION OF TOTAL ACIDITY % OF
VINEGAR
Total acidity was evaluated by acid – base titration with
standardized solution of 0.1 N sodium hydroxide, using
phenolphthalein as a indicator and the results were expressed
as acetic acid content (AOAC, 1990).
The stochiometry of the titration is given by:
CH3COOH + NaOH = CH3COONa + H2O
The formula to calculate %TA as acetic is as below:
%TA = (ml of NaOH) x (N of NaOH) x (60.05)\ 10 x
Sample Weight
The (w/v) % acetic acid content was determined using the
standard method for determination of acetic acid by Nielsen
(1994).
2.2.3. ESTIMATION OPTICAL DENSITY OF
VINEGAR FERMENTATION BROTH
Optical density (OD) measurement of bacterial cultures is a
common technique used in microbiology. Using a
spectrophotometer to measure the optical density at 600 nm
(OD600) of a bacterial culture to monitor bacterial growth has
always been a central technique in microbiology. The OD of a
bacterial culture is not a direct measure of bacterial growth
number, but increase in turbidity does indicate bacterial
growth.
2.3. STATISTICAL DESIGN OF EXPERIMENTS
2.3.1. EXPERIMENTAL DESIGN
The response surface methodology was applied to understand
the interaction of various variables and then used to find the
optimum concentration of the main medium components that
affect the response.
A statistical program package, Design Expert (version 8.0.7.1.,
Stat-Ease Inc., Minneapolis, MN) was used for regression
analysis of the data obtained and to estimate the coefficient of
multivariate equation. This software was also used for the
experimental design, data analysis and quadratic model
building. Response surface and contour plots were generated
to understand the interaction of different variables.
2.3.2. CENTRAL COMPOSITE DESIGN (CCD)
The first experimental CCD was carried out in order to
identify and optimize the total acidity % and optical density of
the production medium that have a significant effect on the
vinegar production. The variables are coded according to the
equation:
Xi = (xi – xo ) / ∆ xi
Where Xi, xi and x0 are the coded value, uncoded value and the
value at the center point respectively of the its test variable
and ∆ xi is the step change value. The full experimental design
in coded and uncoded form is given in Table 1.
Table-1: Experimental Range And Levels Of The
Independent Variables For Vinegar Production
INDEPENDENT
VARIABLES
-1 0 +1
ALCOHOL
CONTENT , %
6.29 7.47 7.77
INOCULUM
VOLUME , %
5 10 15
TIME, HRS. 24 48 72
The Behavior of this system was explained by the following
second-degree polynomial equation:
Y = ß 0 + ξ ß i Xi + ξ ß ii Xi2 + ξ ß ij Xi Xj
Where ß0, ßi (i = 1, 2, 3), ßii (i = 1, 2, 3) and ßij (i = 1, 2, 3; j
= 1, 2, 3 and i _ j) are constants for the offset term, linear
effects, quadratic effects and interactions effects, respectively.
Xi (i = 1, 2, 3) and Xj (j = 1, 2, 3) (i _ j) are the process
parameters and Y is the response variable.
The graphical representation of these equations are called
response surfaces, which was used to describe the individual
and cumulative effects of the test variables on the response
and to determine the mutual interactions between the test
variables and their subsequent effect on the response. The
correlation measures for the estimation of the regression
equation are the multiple correlation coefficient R and the
determination coefficient R2. ANOVA (Analysis of Variance)
was used to test the significance and adequacy of the model.
The F value (Fisher's variance ratio, Sr2/Se2) was calculated
from ANOVA. F values much higher than unity indicate that
the factors explain adequately the variation in the data about
its mean and effects of estimated factors are true. The Student-
t-distribution and the corresponding probability values (P
values) indicate the significance of each of the coefficient,
which in turn governs the patterns of interactions between the
variables. The smaller the value of P, the more significant is
the corresponding coefficient.
Using statistical software , Design Expert (version 8.0.7.1.,
Start-Ease Inc ) , CCD and RSM were used in the design of
experiment and in the analysis of the results.

IJRET: International Journal of Research in Engineering and Technology eISSN: 2319-1163 | pISSN: 2321-7308
__________________________________________________________________________________________
Volume: 02 Issue: 09 | Sep-2013, Available @ http://www.ijret.org 506
3. RESULTS AND DISCUSSION
3.1. BANANA ALCOHOL PRODUCTION
Table-2: Physicochemical Analysis of Banana Samples
SAMPLES
pH
MOISTURE
BRIX
TOTAL
SUGAR
PECTINASE
ADDITION
TOTAL SUGAR ,
AFTER PECTINASE
ADDITION
RAW
BANANA
5 72.7% - - - -
BANANA
PULP
6 73.2% 150 18.23% 0.0003% 24.68%
Table-3: Analysis of Banana Sample Broth
Sample pH Before
Fermentation
pH After
Fermentation
Alcohol % Of
Fermentation
Broth
Residual Sugar %
Of Fermentation
Broth
SET A 4 4 7.77 0
SET B 4.5 4 7.47 0
SET C 4 4 6.29 0
7.77 % alcohol was produced by 8 % yeast cell concentration
at 28OC, pH 4.0 and 10% sugar concentration for 48 hrs. But
under the same time of 48 hrs., 10% yeastcell concentration
produced 7.47% of alcohol. Alcohol production was gradually
decreased with sugar concentration from 10% to 12%. Though
alcohol production takes place under resting condition,
decrease in yeast cell concentration, more amount of sugar
was utilized by yeast to be converted to alcohol. The
distillation process was the most troublesome since it required
the combination of many equipments which led to some
malfunctions. From the above observations, we can conclude
that the above process was highly suitable for industrial
production of alcohol from banana fruits because the alcohol
yield was low cost technology and also ecofriendly.
3.2. VINEGAR PRODUCTION
3.2.1. PHYSICOCHEMICAL ANALYSIS
The pH, titratable acidity and optical density are very
important parameters in the vinegar fermentation process.
Table-4: pH In Vinegar Fermentation Broth Measuring By pH Paper
SAMPLE NAME
Acetobacter aceti
GROWTH
MEDIUM
INOCULATION
AFTER 24 HRS.
AFTER 48 HRS.
AFTER 72 HRS.
SET A
5% 5 4 4
10% 4 4 3
15% 4 3 2
SET B
5% 5 4 4
10% 4 3 4
15% 5 4 4
SET C
5% 4 3 4
10% 4 4 3
15% 6 3 4

IJRET: International Journal of Research in Engineering and Technology eISSN: 2319-1163 | pISSN: 2321-7308
__________________________________________________________________________________________
Volume: 02 Issue: 09 | Sep-2013, Available @ http://www.ijret.org 507
Table-5: Titrable Acidity % in Vinegar Fermentation Broth
SAMPLE NAME Acetobacter aceti
GROWTH MEDIUM
INOCULATION
AFTER 24 HRS.
%
AFTER 48 HRS.
%
AFTER 72 HRS.
%
SET A
5% 3.66 4.23 4.52
10% 3.70 4.25 4.62
15% 3.79 4.27 4.67
SET B
5% 3.28 4.13 4.40
10% 3.39 4.17 4.48
15% 3.48 4.20 4.43
SET C
5% 2.73 4.07 4.30
10% 2.91 4.11 4.32
15% 3.19 4.15 4.37
Table-6: Optical Density in Vinegar Fermentation Broth
SAMPLE NAME Acetobacter aceti
GROWTH MEDIUM
INOCULATION
ABSORBANCE AT 600 nm
AFTER 24 HRS. AFTER 48 HRS AFTER 72 HRS
SET A
5% 0.389 0.449 0.569
10% 0.519 0.579 0.699
15% 1.065 1.128 1.245
SET B
5% 0.992 1.005 1/026
10% 1.308 1.316 1.342
15% 1.318 1.326 1.352
SET C
5% 1.001 1.012 1.026
10% 1.434 1.445 1.459
15% 1.426 1.441 1.459
SET Ay = 0.065x + 3.586
R² = 0.953 SET By = 0.1x + 3.183
R² = 0.996
0
1
2
3
4
5
5% 10% 15%
TITR
AB
LE A
CID
IDY
%
A.aceti CELL CONC.
AFTER 24 hrs.
SET A - TA %
SET B - TA%
SET C - TA%
Chart-3: Effect Of Different A.aceti Cell Concentration On Titrable Acidity % Of
Samples Set A, Set B, Set C After 24 Hrs.
IJRET: International Journal of Research in Engineering and Technology eISSN: 2319-1163 | pISSN: 2321-7308
__________________________________________________________________________________________
Volume: 02 Issue: 09 | Sep-2013, Available @ http://www.ijret.org 508
Chart-4: Effect of Different A.aceti Cell Concentration on Titrable Acidity % of Samples
Set A, Set B, Set C After 48 Hrs.
Chart-5: Effect Of Different A. aceti Cell Concentration on Titrable Acidity % Of
Samples Set A, Set B, Set C After 72 Hrs
Chart-6: Effect Of Different A. aceti Cell Concentration On Optical Density Of Samples Set A, Set B, Set C After 24 Hrs.
Chart-7: Effect Of Different A. aceti Cell Concentration on Optical Density of Samples Set A, Set B, Set C After 48 Hrs
IJRET: International Journal of Research in Engineering and Technology eISSN: 2319-1163 | pISSN: 2321-7308
__________________________________________________________________________________________
Volume: 02 Issue: 09 | Sep-2013, Available @ http://www.ijret.org 509
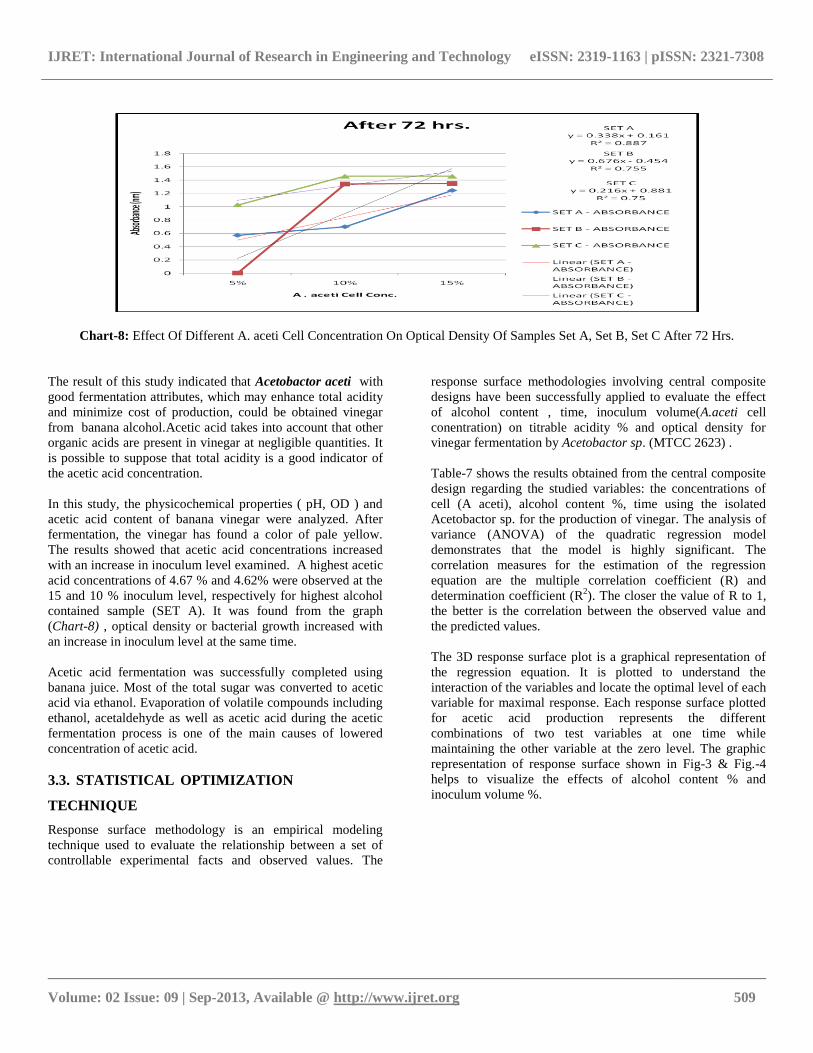
Chart-8: Effect Of Different A. aceti Cell Concentration On Optical Density Of Samples Set A, Set B, Set C After 72 Hrs.
The result of this study indicated that Acetobactor aceti with
good fermentation attributes, which may enhance total acidity
and minimize cost of production, could be obtained vinegar
from banana alcohol.Acetic acid takes into account that other
organic acids are present in vinegar at negligible quantities. It
is possible to suppose that total acidity is a good indicator of
the acetic acid concentration.
In this study, the physicochemical properties ( pH, OD ) and
acetic acid content of banana vinegar were analyzed. After
fermentation, the vinegar has found a color of pale yellow.
The results showed that acetic acid concentrations increased
with an increase in inoculum level examined. A highest acetic
acid concentrations of 4.67 % and 4.62% were observed at the
15 and 10 % inoculum level, respectively for highest alcohol
contained sample (SET A). It was found from the graph
(Chart-8) , optical density or bacterial growth increased with
an increase in inoculum level at the same time.
Acetic acid fermentation was successfully completed using
banana juice. Most of the total sugar was converted to acetic
acid via ethanol. Evaporation of volatile compounds including
ethanol, acetaldehyde as well as acetic acid during the acetic
fermentation process is one of the main causes of lowered
concentration of acetic acid.
3.3. STATISTICAL OPTIMIZATION
TECHNIQUE
Response surface methodology is an empirical modeling
technique used to evaluate the relationship between a set of
controllable experimental facts and observed values. The
response surface methodologies involving central composite
designs have been successfully applied to evaluate the effect
of alcohol content , time, inoculum volume(A.aceti cell
conentration) on titrable acidity % and optical density for
vinegar fermentation by Acetobactor sp. (MTCC 2623) .
Table-7 shows the results obtained from the central composite
design regarding the studied variables: the concentrations of
cell (A aceti), alcohol content %, time using the isolated
Acetobactor sp. for the production of vinegar. The analysis of
variance (ANOVA) of the quadratic regression model
demonstrates that the model is highly significant. The
correlation measures for the estimation of the regression
equation are the multiple correlation coefficient (R) and
determination coefficient (R2). The closer the value of R to 1,
the better is the correlation between the observed value and
the predicted values.
The 3D response surface plot is a graphical representation of
the regression equation. It is plotted to understand the
interaction of the variables and locate the optimal level of each
variable for maximal response. Each response surface plotted
for acetic acid production represents the different
combinations of two test variables at one time while
maintaining the other variable at the zero level. The graphic
representation of response surface shown in Fig-3 & Fig.-4
helps to visualize the effects of alcohol content % and
inoculum volume %.

IJRET: International Journal of Research in Engineering and Technology eISSN: 2319-1163 | pISSN: 2321-7308
__________________________________________________________________________________________
Volume: 02 Issue: 09 | Sep-2013, Available @ http://www.ijret.org 510
Design-Expert® Software
Factor Coding: Actual
Titrable Acidity
Design points above predicted value
5.16
2.71
X1 = A: Alcohol Content
X2 = B: Inoculum Volumn
Actual Factor
C: Time = 0.00
-1.00
-0.50
0.00
0.50
1.00
-1.00
-0.50
0.00
0.50
1.00
3.4
3.6
3.8
4
4.2
4.4
4.6
4.8
T
itra
ble
Ac
idity
A: Alcohol Content B: Inoculum Volumn
Fig-3: Response Surface Plot For Titrable Acidity %
Table-7 Coded and Uncoded Full Factorial Central Composite Design
Table- 8 shows the results of the second-order response
surface models for titrable acidity in the form of analysis of
variance (ANOVA). The regression equation demonstrated
that titrable acidity was an empirical function of test variables
in coded units.
The Model F-value of 13.05 implies the model is significant.
There is only a 0.02% chance that a"Model F-Value" this large
could occur due to noise.Values of "Prob > F" less than 0.0500
indicate model terms are significant.In this case A, B, C are
significant model terms.Values greater than 0.1000 indicate
the model terms are not significant. If there are many
insignificant model terms (not counting those required to
support hierarchy), model reduction may improve the model.
Here the value of R indicates a high degree of correlation
between the observed and the predicted values. The value of
RUN ALCOHOL CONTENT
%
INOCULUM
VOLUME %
TIME IN HRS. RESPONSE
1:
TITRABLE
ACIDITY %
RESPONSE 2 :
OPTICAL
DENSITY CODED
VALUE
ACTUAL
VALUE
CODED
VALUE
ACTUAL
VALUE
CODED
VALUE
ACTUAL
VALUE
1 1.00 7.77 -1.00 5 1 72 4.52 0.569
2 0.00 7.47 0.00 10 0 48 4.17 1.316
3 1.00 7.77 0.00 10 -1 24 3.79 1.065
4 0.00 7.47 0.00 10 0 48 4.17 1.316
5 -1.00 6.29 -1.00 5 -1 24 2.73 1.001
6 0.00 7.47 0.00 10 1.68 72 5.16 2.022
7 1.00 7.77 -1.00 5 -1 24 3.66 0.384
8 1.00 7.77 1.00 15 1 72 4.67 1.245
9 0.00 7.47 0.00 10 0 48 4.17 1.316
10 1.68 7.77 0.00 10 0 48 4.93 1.259
11 0.00 7.47 0.00 10 0 48 4.17 1.316
12 0.00 7.47 0.00 10 0 48 4.17 1.316
13 -1.00 6.29 -1.00 5 1 72 4.3 1.026
14 0.00 7.47 0.00 10 0 48 4.17 1.316
15 -1.00 6.29 1.00 15 1 72 4.37 1.459
16 -1.68 6.29 0.00 10 0 48 3.43 0.765
17 -1.00 6.29 1.00 15 -1 24 3.19 1.426
18 0.00 7.47 1.68 15 0 48 4.88 2.006
19 0.00 7.47 0.00 10 -1.68 24 2.71 0.628
20 0.00 7.47 -1.68 5 0 48 3.45 0.325

IJRET: International Journal of Research in Engineering and Technology eISSN: 2319-1163 | pISSN: 2321-7308
__________________________________________________________________________________________
Volume: 02 Issue: 09 | Sep-2013, Available @ http://www.ijret.org 511
the determination coefficient (R2 =0.9216) being a measure of
goodness of fit to the model, indicates that 7.84% of the total
variations are not explained by the model. The adjusted R2
value (0.8510) is also high, making the model very significant.
The coefficient of variation (CV) indicates the degree of
precision with which the treatment is compared. Usually, the
higher the value of CV, the lower is the reliability of the
experiment. Here the low value of CV % ( 6.50 ) indicates a
greater reliability of the experiments performed.
The "Pred R-Squared" of 0.4009 is not as close to the "Adj R-
Squared" of 0.8510 as one might normally expect. This may
indicate a large block effect or a possible problem with model
and/or data. Things to consider are model reduction, response
transformation, outliers, etc."Adeq Precision" measures the
signal to noise ratio. A ratio greater than 4 is desirable. The
ratio of 12.932 indicates an adequate signal. This model can
be used to navigate the design space.
Table-8: ANOVA for Response Surface Quadratic Model On TA%
SOURCE SUM OF
SQUARES
DEGREE OF
FREEDOM
MEAN
SQUARE
F VALUE P-VALUE
PROB > F
MODEL 8.10 9 0.90 13.05 <0.0002
SIGNIFICANT
A-ALCOHOL
CONTENT
1.53 1 1.53 22.20 0.0008
B-INOCULUM
VOLUMN
0.76 1 0.76 10.97 0.0078
C-TIME 5.43 1 5.43 78.71 <0.0001
AB 7.813E-003 1 7.813E-003 0.11 0.7434
AC 0.13 1 0.13 1.85 0.2038
BC 0.017 1 0.017 0.25 0.6292
A2 0.018 1 0.018 0.26 0.6191
B2 0.024 1 0.024 0.35 0.5685
C2 0.21 1 0.21 3.12 0.1080
RESIDUAL 0. 69
10 0.069
LACK OF FIT 0.69 5 0.14
PURE ERROR 0.000 5 0.000
CORRECTED
TOTAL
8.79 19
Table-9: R value for model
Std. Dev.
Mean
C.V. %
PRESS
0.26
4.04
6.50
5.27
R-Squared
Adj R-Squared
Pred R-Squared
Adeq Precision
0.9216
0.8510
0.4009
12.932
Table-10: Coefficients in Terms of Actual
COEFFICIENT FACTOR ESTIMATE
Intercept 4.18
A- Alcohol Content 0.33
B- Inoculum Volumn 0.24
C- Time 0.63
AB -0.031
AC -0.13
BC -0.046
A2 -0.035
B2 -0.041
C2 -0.12

IJRET: International Journal of Research in Engineering and Technology eISSN: 2319-1163 | pISSN: 2321-7308
__________________________________________________________________________________________
Volume: 02 Issue: 09 | Sep-2013, Available @ http://www.ijret.org 512
Final Equation in Terms of Coded Factors:
Titrable Acidity = + 4.18 + 0.33 x A + 0.24 x B + 0.63 x
C - 0.031 x AB - 0.13 x AC - 0.046 x B - 0.035 x A2 - 0.041
x B2 - 0.12 x C2
Final Equation in Terms of Actual Factors:
Titrable Acidity = + 4.17597 + 0.33483 x Alcohol Content +
0.23541 x Inoculum Volumn + 0.63048 x Time - 0.031250
x Alcohol Content x Inoculum Volumn - 0.12625 x Alcohol
Content x Time - 0.046250 x Inoculum Volumn x Time -
0.035490 x Alcohol Content2 - 0.040793 x Inoculum
Volumn2 - 0.12211 x Time2
Response surface study was made between Titrable Acidity %
of acetic acid fermentation against inoculum volume and
alcohol content keeping time of fermentation at ― 0 ‖ coded
level , i.e. , 48 hrs.
Now the 3D response surface study showed that alcohol
content and inoculum level had a positive effect on TA % of
fermentation broth. But no clear experimental zone of
optimum could be obtained. So the optimun was a suddle
point within our experimental zone. Maximun value of
Titrable Acidity % was obtained at 4.67 % for 72 hrs. with
alcohol content 7.77 %and yeast cell inoculation level 15 % .
From this study , we can conclude that the TA% was
independent of alcohol concentration , but inoculum volume
had a positive effect both on the TA % and the final cell
growth.
The result of second – order response surface model (same for
coded and uncoded test variables) fitting in the form of
analysis of variance (ANOVA) is shown in Table- 11. The
regression equation demonstrated that optical density was an
empirical function of test variables in coded units.
Table-11: ANOVA for Response Surface Quadratic Model On OD
SOURCE SUM OF
SQUARES
DEGREE OF
FREEDOM
MEAN
SQUARE
F VALUE P-VALUE PROB
> F
MODEL 2.84 9 0.32 2.95 0.0536 not
SIGNIFICANT
A-ALCOHOL
CONTENT
0.048 1 0.048 0.45 0.5165
B-INOCULUM
VOLUMN
1.86 1 1.86 17.35 0.0019
C-TIME 0.56 1 0.56 5.22 0.0454
AB 0.031 1 0.031 0.28 0.6052
AC 0.011 1 0.011 0.11 0.7509
BC 8.000E-006 1 8.000E-006 7.471E-005 0.9933
A2 0.27 1 0.27 2.50 0.1452
B2 0.097 1 0.097 0.90 0.3644
C2 9.382E-003 1 9.382E-003 0.088 0.7733
RESIDUAL 1.07 10 0.11
LACK OF FIT 1.07 5 0.21
PURE ERROR 0.000 5 0.000
CORRECTED
TOTAL
3.91
The Model F-value of 2.95 implies there is a 5.36% chance
that a "Model F-Value" this large could occur due to
noise.Values of "Prob > F" less than 0.0500 indicate model
terms are significant. In this case B, C are significant model
terms. Values greater than 0.1000 indicate the model terms are
not significant.If there are many insignificant model terms (not
counting those required to support hierarchy), model reduction
may improve the model.
Table-12 : R value for model
Std. Dev 0.33 R-
Squared
0.7264
Mean 1.15 Adj R-
Squared
0.4802
C.V. % 28.35 Pred R-
Squared
-1.0778
PRESS 8.13 Adeq
Precision
5.884

IJRET: International Journal of Research in Engineering and Technology eISSN: 2319-1163 | pISSN: 2321-7308
__________________________________________________________________________________________
Volume: 02 Issue: 09 | Sep-2013, Available @ http://www.ijret.org 513
A negative "Pred R-Squared" implies that the overall mean is
a better predictor of the response than the current
model."Adeq Precision" measures the signal to noise ratio. A
ratio greater than 4 is desirable. The ratio of 5.884 indicates
an adequate signal. This model can be used to navigate the
design space.The coefficient of determination (R2) was
0.7264, indicating that 72.64 % of the variability in the
response could be explained by the model. The adjusted
determination coefficient (adj. R2=0. 4802) was also not
satisfactory for confirming the significance of the model.
Fig-4 displays the surface response plot of the model equation.
Table-13 : Coefficients in Terms of Actual
Design-Expert® Software
Factor Coding: Actual
Optical Density
Design points below predicted value
2.022
0.325
X1 = A: Alcohol Content
X2 = B: Inoculum Volumn
Actual Factor
C: Time = 0.00
-1.00
-0.50
0.00
0.50
1.00
-1.00
-0.50
0.00
0.50
1.00
0.6
0.8
1
1.2
1.4
1.6
1.8
O
ptic
al D
en
sity
A: Alcohol Content B: Inoculum Volumn
Fig-4: Response surface plot showing the effect of alcohol
content and inoculum volume on optical density
The observed values are the experimentally obtained values
and the predicted values were calculated based on the
respective model equation for each experimental run. There
was a good coordination between the observed and the
predicted values in models. Regression equation of the linear
model was analyzed using 3D response surface plots, which
help to understand the effect of alcohol content and their
range of optimum concentrations required for optical density
in vinegar fermentation. 3D response surface plots were
obtained by plotting the response (OPTICAL DENSITY) on
the Y-axis against two variables (alcohol content and A.aceti
cell concentration level) while keeping other variable time at
‗0‘ level.
Response surface study was made between optical density of
acetic acid fermentation against inoculum volume and alcohol
content keeping time of fermentation at ―0‖ coded level, i.e.,
48 hrs. It was clear that at a particular alcohol content level,
the optical density of fermentation increased with increase in
inoculum level.
Now the 3D response surface study showed that no clear
experimental zone of optimum could be obtained. So the
optimun was a suddle point within our experimental zone. The
optimization of the analyzed responses demonstrated that
Maximun value of optical density was obtained at 1.459 for 72
hrs. with alcohol content 6.29 %and A.aceti cell inoculation
level 15 %. The goodness of fit of the model was verified by
the determination coefficient (R2). In this study, bacterial
growth had been increased significantly using statistical
optimization techniques.
4. CONCLUSIONS
As a result, this study recommended that the vinegar must be
subjected to sensory analysis, descriptive and consumer
acceptance, for further evaluation and to investigate the
amount of toxic compounds in banana vinegar and to report of
isolation and identification of an Acetobacter strain.
Moreover, this study encouraged that the further development
of this study by addition of some spices and food additives and
by application of new principles discovered, aside from
extending the fermentation time and also looking for strains
with high vinegar production as well as suitable tolerance
against high ethanol concentrations and production
temperature.
REFERENCES
[1] Adams, M.R..1980. The small-scale production of
vinegar from bananas.Tropical Product Institute, 56/62
Grays Inn Road, London
[2] Frazier, W.C. & D.C. Westhoff.(1988).Food
Microbiology.4th ed. New York: McGraw-Hill Book,
Co.
COEFFICIENT FACTOR ESTIMATE
Intercept 1.32
A- Alcohol Content -0.060
B- Inoculum Volumn 0.37
C- Time 0.20
AB 0.062
AC 0.038
BC 1.000E-003
A2 -0.14
B2 -0.082
C2 -0.026

IJRET: International Journal of Research in Engineering and Technology eISSN: 2319-1163 | pISSN: 2321-7308
__________________________________________________________________________________________
Volume: 02 Issue: 09 | Sep-2013, Available @ http://www.ijret.org 514
[3] Rumpai Gaensakoo, Busaba Tharasena and Charunee
Thipayamart, Vinegar Production from Yam Bean
Using Yeast and Acetobacter aceti 102 World Academy
of Science, Engineering and Technology 71 2010
African Journal of Biotechnology Vol. 10(18), pp.
3608-3615, 2 May, 2011 Banana Breeding: Progress
and Challenges,By Michael Pillay, Abdou Tenkouano,
Abdou Tenkouano
[4] C.J.B. DE LIMA et al.: Lactic Acid Production
Optimization, Food Technol. Biotechnol. 48 (2) 175–
181 (2010)
[5] S. GHOSH and T. SWAMINATHAN, Optimization of
Extractive Fermentation, Chem. Biochem. Eng. Q. 17
(4) 319–325 (2003)
[6] Box, E.P. George, Hunter, J. Stuart, and Hunter, G.
William. 2005. Statistics for Experiments. New Jersey:
John Willey and Sons, Inc. Oehlert, Gary W. 2000.
Design and analysis of experiments: Response surface
design. New York: W.H. Freeman and Company
[7] Allgeier RJ, Hildebrandt FM. 1960. Newer
developments in vinegar manufacture.Adv. Appl.
Microbiol 11:163-181. Agnez-Lima LF, Di Mascio P,
Napolitano RL, Fuchs RPP, Menck CFM. 1999.
Mutation spectrum induced by singlet oxygen in
Escherichia coli deficient in exonuclease III.
Photochem. Photobiol 70:505–511.
[8] uchanan RE, Gibbons NE. 1974. Family III: Bergey‘s
manual of determinativebacteriology. 8th ed.
Baltimore: Williams and Wilkins Co. p 251-253.
[9] Canning A. 1985. Vinegar Brewing. Journal of Food
Sci Sept/ Oct: 20-21.
[10] Carnacini A, Gerbi V, Zeppa G. 1992. Rapid extraction
of volatile compounds inwine and vinegar using
extrelut resin. Italian Journal of Food Science 4:259-
267.
[11] Chukwu U, Cheryan M. 1996. Concentration of vinegar
by electrodialysis. Journal ofFood Science 61: 1223-
1226.
[12] Conner HA, Allgeier RJ. 1976. Vinegar: its history and
development. Adv. Appl. Microbiol 20: 81-133.
[13] Crisco Company. 1 Strawberry Lane Orrville, Ohio
44667 .2005.
http://www.crisco.com/basics/all_about/vinegar.asp.
[14] Cruess WV. 1958. Commercial fruit and vegetable
products: Chapter 21 – Vinegarmanufacture. 1st ed.
New York: McGraw-Hill Book Company, Inc. p 681-
707.
[15] M. FORSTER et al.: Distribution of Nutrients in Edible
Banana Pulp, Food Technol. Biotechnol. 41 (2) 167-
171 2003
[16] Beheshti Maal Keivan, hafiei Rasoul and Kabiri
Noushin Production of Apricot Vinegar Using an
Isolated Strain from IranianApricot Acetobacter ,
World Academy of Science, Engineering and
Technology 71 2010
[17] Ndoye, B., L. Cleenwerck, K. Engelbeen, R. Dubois-
Dauphin, A.T. Guiro, S.V. Trappen, A. Willems and P.
Thonart, 2007. Acetobacter senegalensis sp. nov., a
thermotolerant acetic acid bacterium isolated in Senegal
(sub-Saharan Africa) from mango fruit (Mangifera
indica L.).Int. J. Syst. Evol. Microbiol., 57: 1576-1581.
[18] Beheshti Maal, K. and R. Shafiei, 2010. Isolation and
characterization of an Acetobacter strain from Iranian
white-red cherry as a potential strain for cherry vinegar
production in microbial biotechnology. Asian J.
Biotechnol., 1: 53-59.
[19] A statistical program package, Design Expert (version
8.0.7.1., Start-Ease Inc., Minneapolis, MN)


![Botanitas [APPETIZERS] ALITAS [ONE IN HIKEN WINGS ...menu… · Slow cooked in a banana leafs pork marinated in vinegar & orange / pickled red onion / rice / beans / G& / chile arbol](https://img.pdfslide.net/doc/110x75/5f44850a2af8d336c0689c2e/botanitas-appetizers-alitas-one-in-hiken-wings-menu-slow-cooked-in-a-banana.jpg)