Embed Size (px)
Citation preview
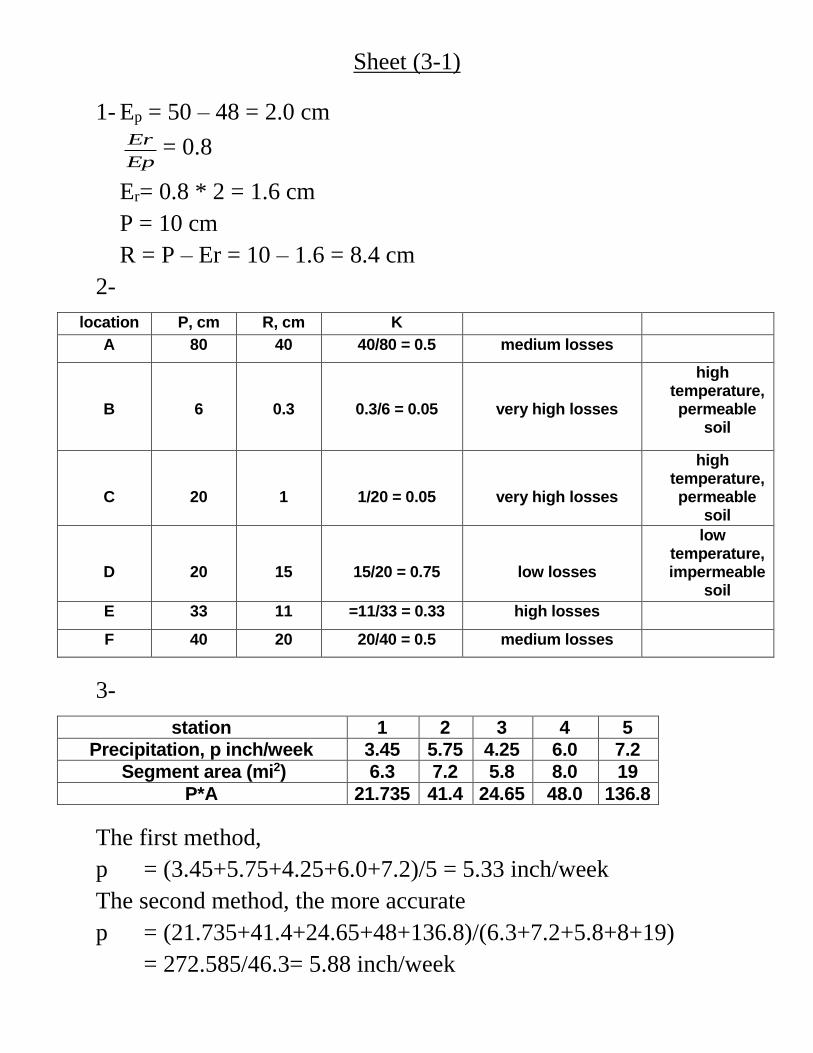
Sheet (3-1)
1- Ep = 50 – 48 = 2.0 cm
Ep
Er = 0.8
Er= 0.8 * 2 = 1.6 cm
P = 10 cm
R = P – Er = 10 – 1.6 = 8.4 cm
2-
location
P, cm R, cm
, inch
K
A 80 40
40/80 = 0.5 medium losses
B
6
0.3
0.3/6 = 0.05
very high losses
high temperature, permeable
soil
C
20
1
1/20 = 0.05
very high losses
high temperature, permeable
soil
D
20
15
15/20 = 0.75
low losses
low temperature, impermeable
soil
E 33 11 =11/33 = 0.33 high losses
F 40 20 20/40 = 0.5 medium losses
3-
station 1 2 3 4 5
Precipitation, p inch/week 3.45 5.75 4.25 6.0 7.2
Segment area (mi2) 6.3 7.2 5.8 8.0 19
P*A 21.735 41.4 24.65 48.0 136.8
The first method,
p = (3.45+5.75+4.25+6.0+7.2)/5 = 5.33 inch/week
The second method, the more accurate
p = (21.735+41.4+24.65+48+136.8)/(6.3+7.2+5.8+8+19)
= 272.585/46.3= 5.88 inch/week
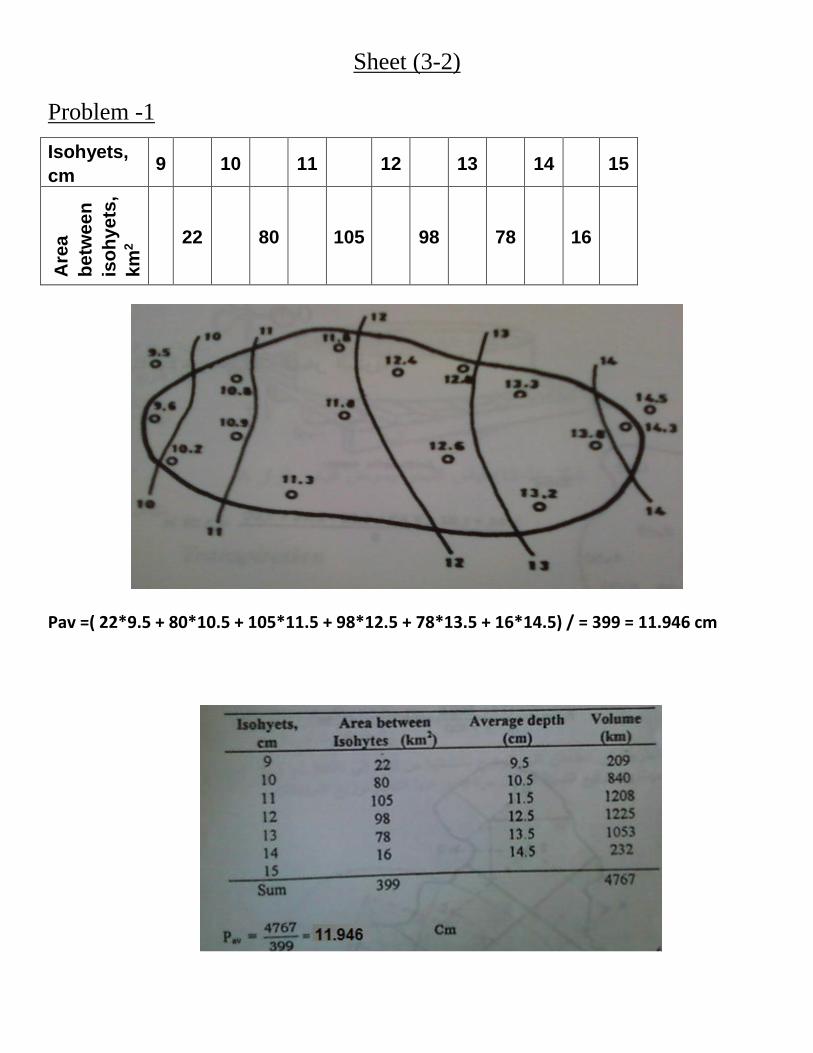
Sheet (3-2)
Problem -1
Isohyets,
cm 9 10 11 12 13 14 15
Are
a
be
twe
en
iso
hy
ets
,
km
2
22 80 105 98 78 16
Pav =( 22*9.5 + 80*10.5 + 105*11.5 + 98*12.5 + 78*13.5 + 16*14.5) / = 399 = 11.946 cm

Problem -2, Horton's Equation
= c + (o – c)e-kt
= infiltration rate at any time & o = initial infiltration rate
c = final infiltration rate & t = certain time in hours
K = constant depends on type of soil and surface
For a certain basin, o = 4.5 in/hr , c = 0.4 in/hr, k = 0.35 hr-1, Find the following:
1- the infiltration rate at times 0.0 hr, 1/2 hr , 1.0 hr, 2 hr, 10 hr.
2- draw a sketch to show the relation between: t & .
3- Convert the given relation to a linear relation: = a + bt
Assume = o at t = 0.0, = c at t = 10 hr, find values of a and b.
4- the total height of infiltration during 10 hr over the catchment area.
5- If volume of infiltration is 6*107 ft3, find the catchment area in mile2.
Solution
Substituting in Horton equation
= 0.4 + 4.1 e -0.35 t
t, hr 1/6 3/6 1 2 6
, in/hr 4.27 3.84 3.39 2.44 0.9

The total height of infiltration is estimated by integration
Total height of infiltration during 6 hr = ʃ f dt = ʃ [0.4 + 4.1 e-0.35t]dt
=[0.4t + (4.1/-0.35)e -0.35t ]06 = 12.68 in
The volume of infiltration over the catchment area =(12.68/12)*2*(1760*3)2= 58916352 ft3
To Convert the given relation to a linear relation: = a + bt
Assume = o at t = 0.0, = c at t = 10 hr, find values of a and b.
= a + bt
for the first condition o = a + b(0), So a = o
for the second condition,c = o + b(10), So b = c - o) / 10
the equation will be: = o + c - o) t / 10
= - t
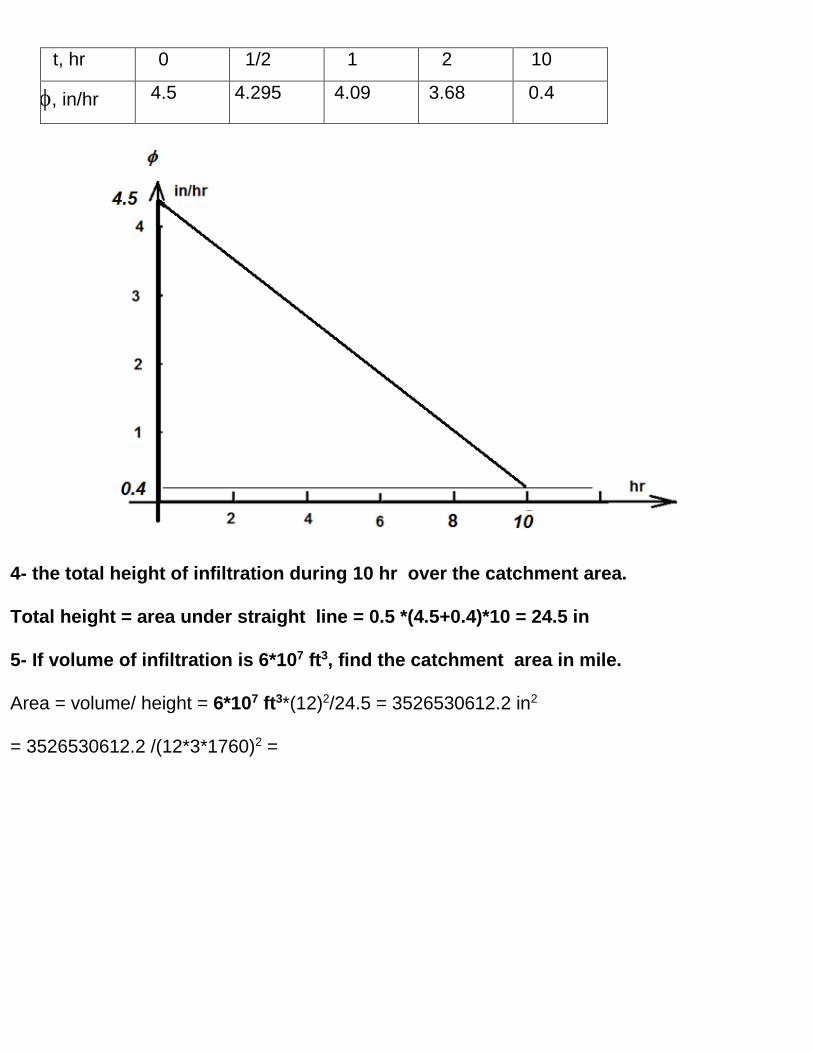
t, hr 0 1/2 1 2 10
, in/hr 4.5 4.295 4.09 3.68 0.4
4- the total height of infiltration during 10 hr over the catchment area.
Total height = area under straight line = 0.5 *(4.5+0.4)*10 = 24.5 in
5- If volume of infiltration is 6*107 ft3, find the catchment area in mile.
Area = volume/ height = 6*107 ft3*(12)2/24.5 = 3526530612.2 in2
= 3526530612.2 /(12*3*1760)2 =

Assignment (3-3)
For the given catchment areas, A, B, C, D as shown below, the time required to
reach the entrance of a stream at G. The rain fall intensity was 2 cm/hr
distributed all over the catchment area during 4 hr. Draw the hydrograph.
Consider solved problem in Hydrology Book with the following:
R1= R2 = R3 = R4 = 2 cm/hr
Sub catchment A B C D
Area, km2 10 20 30 10
Time to G, hr 1 2 3 4
Fig. Sub catchment areas
Q1 = R1 A = 0.02*10*106 = 2 *105 m3/hr
Q2 = R2 A +R1 B = 0.02 *10*106 + 0.02*20*106 = 6 *105 m3/hr
Q3= R3 A +R2 B + R1 C

= 0.02 *10*106 + 0.02*20*106 + 0.02 *30*106 = 12 *105 m3/hr
Q4 = R4 A +R3 B + R2 C + R1 D
=0.02 *10*106 + 0.02*20*106 + 0.02 *30*106 + 0.02 *10*106
= 14 *105 m3/hr
Q5 = R4 B + R3 C + R2 D
= 0.02*20*106 + 0.02 *30*106 + 0.02 *10*106 = 12 *105 m3/hr
Q6 = R4 C + R3 D
= 0.02 *30*106 + 0.02 *10*106 = 8 *105 m3/hr
Q7 = R4 D = 0.02 *10*106 = 2 *105 m3/hr
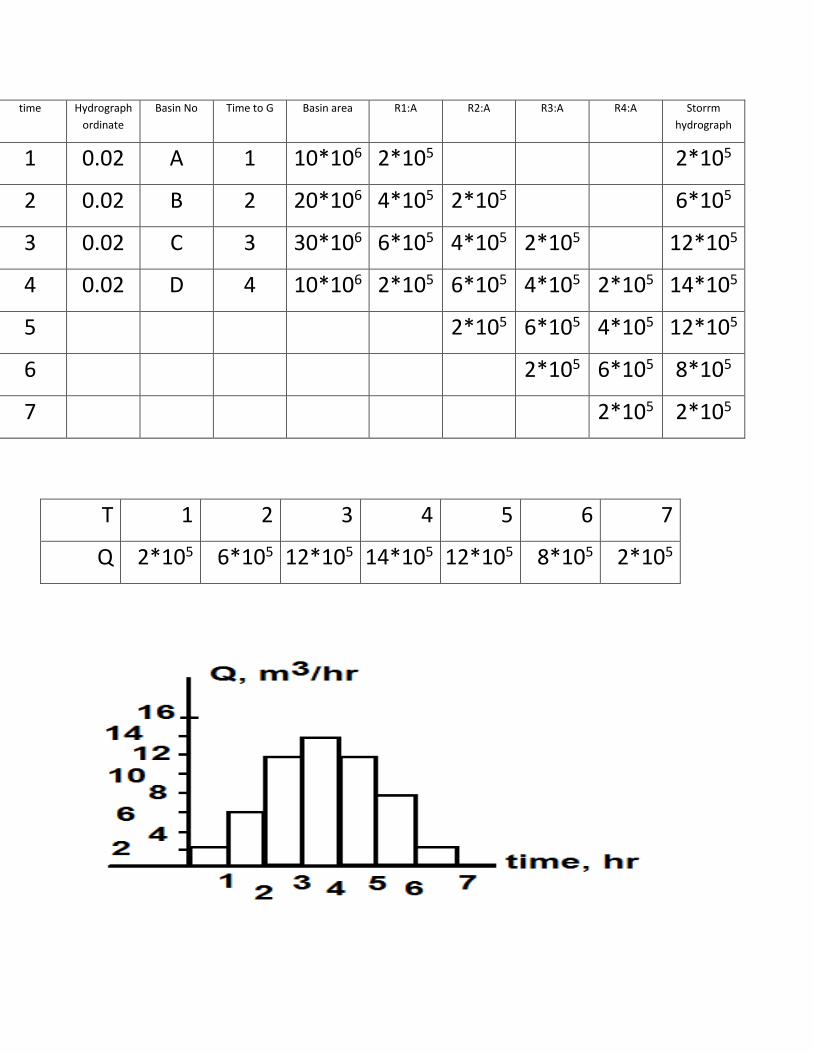
time Hydrograph
ordinate
Basin No Time to G Basin area R1:A R2:A R3:A R4:A Storrm
hydrograph
1 0.02 A 1 10*106 2*105 2*105
2 0.02 B 2 20*106 4*105 2*105 6*105
3 0.02 C 3 30*106 6*105 4*105 2*105 12*105
4 0.02 D 4 10*106 2*105 6*105 4*105 2*105 14*105
5 2*105 6*105 4*105 12*105
6 2*105 6*105 8*105
7 2*105 2*105
T 1 2 3 4 5 6 7
Q 2*105 6*105 12*105 14*105 12*105 8*105 2*105

General Case Analysis
Excel Spreadsheet Calculation
1 2 3 4 5 6 7 8 9 10 11
time Hydrograph
ordinate
Basin No Time
to G
Basin
area
R1:A R2:A R3:A R4:A R4:A Storrm
hydrograph
1 R1 A1 or A 1
Val
ues
of
bas
in a
rea R1 A Col 6
2 R2 A2 or B 2 R1 B R2 A Col 6:7
3 R3 A3 or C 3 R1 C R2 B R3 A Col 6:8
4 R4 A4 or D 4 R1 D R2 C R3 B R4 A Col 6:9
5 R5 A5 or E 5 R1 E R2 D R3 C R4 B R5 A Col 6:10
6 R2 E R3 D R4 C R5 B Col 7:10
7 R3 E R4 D R5 C Col 8:10
8 R4 E R5 D Col 9:10
9 R5 E Col 10