Embed Size (px)
Citation preview

Division of Energy and Building DesignDepartment of Architecture and Built EnvironmentLund UniversityFaculty of Engineering LTH, 2008Report EBD-T--08/10
Helena Gajbert
Solar thermal energy systems for building integration

Lund UniversityLund University, with eight faculties and a number of research centres and specialized institutes, is the largest establishment for research and higher education in Scandinavia. The main part of the University is situated in the small city of Lund which has about 105 000 inhabitants. A number of departments for research and education are, however, located in Malmö. Lund University was founded in 1666 and has today a total staff of 6 000 employees and 42 500 students attending 90 degree programmes and 1 000 subject courses offered by 74 departments.
Division of Energy and Building DesignReducing environmental effects of construction and facility management is a central aim of society. Minimising the energy use is an important aspect of this aim. The recently established division of Energy and Building Design belongs to the department of Architecture and Built Environment at the Lund University, Faculty of Engineering LTH in Sweden. The division has a focus on research in the fi elds of energy use, passive and active solar design, daylight utilisation and shading of buildings. Effects and requi-rements of occupants on thermal and visual comfort are an essential part of this work. Energy and Building Design also develops guidelines and methods for the planning process.

xxxxx
1
Solar thermal energy systems for building
integration
Helena Gajbert
Licentiate thesis

Solar thermal energy systems for building integration
2
Keywordsbuilding integration, concentrating collector, incidence angle dependence, optical effi ciency, parabolic refl ector, photovoltaic-thermal system, solar collector, solar simulator, solar thermal energy, solar thermal system, thermal performance.
© copyright Helena Gajbert and Division of Energy and Building Design. Lund University, Lund Institute of Technology, Lund 2008.The English language corrected by L. J. Gruber BSc(Eng) MICE MIStructE.Layout: Hans Follin, LTH, Lund.Cover photo: Helena Gajbert, Bengt Perers and Martin Råberg
Printed by KFS AB, Lund 2008
Report No EBD-T--08/10Solar thermal energy systems for building integration.Department of Architecture and Built Environment, Division of Energy and Building Design, Lund University, Lund
ISSN 1651-8136ISBN 978-91-85147-29-8
Lund University, Lund Institute of TechnologyDepartment of Architecture and Built EnvironmentDivision of Energy and Building Design Telephone: +46 46 - 222 73 52P.O. Box 118 Telefax: +46 46 - 222 47 19SE-221 00 LUND E-mail: [email protected] Home page: www.ebd.lth.se

Abstract
3
Abstract
Solar thermal energy has the potential to make a signifi cant contribution to the energy supply for space heating and hot water production, even in locations at higher latitudes, and in this way to reduce the use of fossil fuels. It is therefore very important to increase the use of this technology.
By integrating solar collectors into building envelopes, the cost ef-fectiveness of the collectors can be increased, as building material and labour costs can be reduced. By also using concentrating refl ectors the cost effectiveness can be further increased.
The aim of this work is to identify cost effective design criteria for building integrated solar collectors and solar thermal systems. It is hoped that the outcome will give guidance and inspiration to product develop-ers, architects, designers and constructors and thereby help boost the solar thermal market and increase the use of solar thermal systems.
The presented work includes an investigation of solar thermal systems for highly insulated buildings, performed for the International Energy Agency, Solar Heating and Cooling Programme, Task 28, in which solar thermal systems are designed for apartment buildings at high latitudes. Design advice is given based on Polysun simulations and parametric studies of various design parameters. Special attention was paid to dimensioning of the collector area to avoid overheating.
The thermal performance of three designs of collectors for non-insulated roofs with cold attics underneath has been evaluated from measurments. The idea is to produce a thin, cheep and fl exible roof-integrated collector for easy installation. The results show that the annual thermal energy yield would be 320, 330 and 280 kWh/m2 respectively for the three collectors A, B and C, at 50°C operating temperature. The corresponding yield per absorber area is 360, 680 and 1140 kWh/m2 respectively. As the material costs should be low, there is a potential for the production of these solar collectors, Collector B in particular, as cost effective building elements. However, further investigations for improved effi ciency are suggested.
The characteristics of a solar simulator have been investigated in order to show how suitable it is for use as a light source for indoor measure-ments of concentrating collectors for evaluation of their incidence angle

Solar thermal energy systems for building integration
4
dependence. It is here concluded that accurate results can be achieved for lower angles of incidence but for higher angles, above 35°-40°, outdoor measurements are more reliable.
A large solar thermal system, with façade-integrated collectors in sev-eral directions, connected to the fl ow side of the district heating grid in Malmö, Sweden, has been studied, e.g. from measured data, and described. WINSUN simulations were performed to validate that the plant works as expected, which was confi rmed by the results. The simulated annual output of 174 kWh/m²a from the system agreed well with the measured output, 180 kWh/m2a. The results from each of the collectors are also described and a small parametric study is given. The good accuracy of these results implies that WINSUN and Meteonorm data can be used for relatively good estimations of a complex system design when climate data is unavailable.
The geometrical design of a concentrating PV/thermal hybrid collector for integration in a wall element is optimised for maximal energy output by short circuit current measurements of thin fi lm photovoltaic cells and MINSUN simulations. The results show that the annual energy output could increase from 70 kWh/m2 for a vertical reference cell to 120 kWh/m2 absorber area. Results for a number of geometries are presented.

Table of contents
5
Table of contents
Keywords 2
Abstract 3
Table of contents 5
Preface 9
List of symbols 11
List of papers 15
1 Introduction 17
1.1 Background 171.2 Objectives 181.3 Outline 19
2 Theoretical background 21
2.1 Solar thermal market development 212.1.1 Historic development 212.1.2 Recent development 22
2.2 Solar irradiation 242.3 Solar angles 272.4 Heat transfer and thermal performance of solar collectors 322.4.1 Irradiance 332.4.2 Optical losses 342.4.3 Thermal heat losses from the collector 362.4.4 Evaluation of thermal performance from measured data 37
2.5 Optical concentration of light 382.5.1 Parabolic refl ectors 392.5.2 The involute 432.5.3 Incidence angle dependence for concentrating collectors 452.5.4 Refl ector material 47
2.6 Concentrating hybrid PV/thermal collectors 472.7 Building integration of solar collectors 483 Measurement techniques 51
3.1 Measurement set-up 513.1.1 Outdoor measurements using the test rig 513.1.2 Long-term outdoor measurements at the Älvkarleby test facility 553.1.3 Early measurements 56

Solar thermal energy systems for building integration
6
3.2 Measuring equipment 593.2.1 The solar simulator 593.2.2 Measurements of irradiance 613.2.3 The solar collector test rig 623.2.4 Temperature measurements 653.2.5 Flow rate 683.2.6 Data logger system 68
3.3 Computer programs 693.3.1 The MINSUN simulation tool 693.3.2 WINSUN 703.3.3 Polysun 70
4 Solar thermal systems in high performance houses 73
4.1 Introduction 734.2 Active use of solar thermal energy 744.2.1 Solar thermal system designs 744.2.2 Collector types 784.2.3 Tank location 794.2.4 Regional design differences 80
4.3 Design of solar heating systems 814.3.1 Introduction 814.3.2 The cold climate apartment reference building 844.3.3 Design solution 1a – Conservation strategy: A solar DHW system for an extremely well insulated building 844.3.4 Design solution 2 - Renewable energy strategy: A solar thermal system for DHW and space heating, 864.3.5 Sensitivity analysis of the solar system for Solution 2 914.3.6 Comparison between the different solutions 105
4.4 Conclusions 107
5 Solar collectors for integration on non-insulated roofs 111
5.1 Introduction 1115.2 The collector designs 1125.2.1 Collector A 1125.2.2 Collector B 1135.2.3 Collector C 1145.2.4 Orientation 116
5.3 Experimental work and evaluations 1175.3.1 Long-term measurements and MLR 1175.3.2 Model accuracy 1185.3.3 Thermal inertia of the collectors 1225.3.4 Monitoring of effi ciency graphs 1245.3.5 Longitudinal incidence angle dependence 1265.3.6 Incidence angle dependence in the transverse plane 1295.3.7 Ray tracing simulations 1325.3.8 MINSUN simulations of annual energy output 137
5.4 Conclusions 138

Table of contents
7
6 Evaluation of solar simulator performance 141
6.1 Introduction 1416.2 The solar simulator light distribution 1426.3 The photodiode array 1436.4 Measurements of concentrating collectors 1446.4.1 The roof collector of corrugated steel 1446.4.2 The roof MaReCo 144
6.5 Conclusions 148
7 Building integrated solar collectors for district heating systems 149
7.1 Introduction 1497.2 System description 1507.2.1 System design 1507.2.2 The fl ows in the collector circuits 1527.2.3 Start up and shut down control of the solar circuit 1527.2.4 The control of the district heating circuit 1527.2.5 Overheat protection by partial evaporation 1537.2.6 The importance of location 153
7.3 Evaluation of the system 1547.3.1 Methodology 1547.3.2 The overall energy yield 1557.3.3 The cooperation of the collectors 1557.3.4 Parametric studies 1567.3.5 Comparison of measured and simulated data 159
7.4 Conclusions 161
8 Optimisation of module geometries for concentrating façade integrated collectors 163
8.1 Introduction 1638.2 Collector design 1648.3 Measurements and calculations of optical effi ciency 1668.4 Analysis of long term outdoor measurements 1698.5 Simulations of annual energy yield 1708.6 MINSUN results and annual electricity production 1718.7 Conclusions 173
9 Summary and discussion 177
9.1 Collector designs 1779.1.1 Roof integrated designs 1779.1.2 Façade integrated designs 1789.1.3 Future development 179
9.2 Solar thermal system designs 1799.2.1 Solar systems for houses with low energy demand 1809.2.2 Solar system design features 1819.2.3 Benefi cial circumstances for investments 1819.2.4 Important design features of automated systems 182

Solar thermal energy systems for building integration
8
9.3 Future outlook 182
References 185
Appendix A Equations of the involute and the semi parabola 191
Appendix B Design parameters used in the work for IEA, Task 28 – Sustainable solar housing 193
Paper I Using active solar energy (in Sustainable Solar Housing, Vol.1, Strategies and Solutions) * 199
Paper II Apartment buildings in the cold climate, renewable energy strategy (in Sustainable Solar Housing, Vol. 1, Strategies and Solutions) * 207
Paper III Apartment buildings in the cold climate, conservation strategy (in Sustainable Solar Housing, Vol. 1, Strategies and Solutions) * 225
Paper IV Design and evaluation of solar collectors for integration on non-insulated roofs 235
Paper V Measurement of concentrating solar collectors using a solar simulator with parallel light 249
Paper VI Design and performance of a large solar thermal system with façade-integrated collectors in several directions, connected to the district heating system 259
Paper VII Optimisation of refl ector and module geometries for static, low-concentrating, façade-integrated photovoltaic systems 271
Paper VIII Design, building integration and performance of a hybrid solar wall element 285
Paper IX Competitive solar heating systems for residential buildings 297
* Papers I, II and III were published in Sustainable Solar Housing, Vol.1, Strategies and Solutions, by Earthscan (an imprint of James & James Ltd), 8-12 Camden high street, London NW1 0JH, UK, www.earthscan.co.uk.

Preface
9
Preface
This work was mainly fi nanced by the Swedish Energy Agency. Other sponsors are NCC Construction Sweden, who fi nanced part of the work on Paper IV, and Nordic Energy Research, who supported my partici-pation in the REBUS project (Competitive Solar Heating Systems for Residential Buildings).
I want to thank everyone who has helped me with this work.First of all I want to thank my supervisors, Prof. Björn Karlsson, Dr.
Håkan Håkansson and Dr. Bengt Perers, who have given me great sup-port in my work and from whom I have learned very much. Björn has given me good ideas and valuable feedback throughout the project. Håkan has helped me with the experimental work and often given me technical advice. Bengt has been a great support, especially in my work on Paper VI and with the installation of the test rig. I also want to thank Dr. Bengt Hellström who has often given me useful advice.
I have enjoyed working with, Johan Nilsson, Maria Hall, Tobias Rosen-crantz and Andreas Fieber in co-authoring different papers.
I want to thank Johan Smeds, Robert Hastings, Maria Wall, and all the participants of the IEA-SHC project Task 28 – Sustainable solar housing, for good collaboration and interesting meetings.
Most of the measurements for this work were carried out at Energy and Building Design but some data was obtained from measurements performed at the test laboratory of Vattenfall Utveckling at Älvkarleby, in which Peter Krohn has been very helpful. Stefan Larsson is acknowledged for his dedicated work with the development of the test rig.
My participation in the REBUS project has taught me a lot about the solar energy research of our neighbour countries and I want to thank the participants of this group.
Martin Råberg, Per Rosén, Elsa Anderson and Simon Furbo have given me valuable information and technical data of different kinds.
I also want to thank all my colleagues at Energy and building design who have given me very good company during this time.

Solar thermal energy systems for building integration
10
Last but not least, I want to thank my family and my friends, especially Mattias, for their fantastic support and for putting up with my long work-ing hours. You are wonderful!

List of Symbols
11
List of symbols
Latin symbolsA Area (m2)a Absorber width (m)b0 Incidence angle modifi er coeffi cient (-)Cg Geometrical concentration ration (-)cp Specifi c heat capacity (J/kg, K)F’ Collector effi ciency factor (-)F’U Over all heat loss coeffi cient of a solar collector (W/m2K)F’U0 First heat loss coeffi cient of a solar collector (W/m2K)F’U1 Second heat loss coeffi cient of a solar collector (W/m2K2)G Global irradiance (W/m2) Gb Beam irradiance (W/m2)Gd Diffuse irradiance (W/m2)Gsc Solar constant (W/m2a)h Height (m)I Current (A)Isc Short circuit current (A)Imp Current at maximal power (A)K Optical effi ciency (infl uenced by refl ector and glazing) (-)Kb Incidence angle modifi er for beam irradiance (-)Kd Incidence angle modifi er for diffuse irradiance (-)Ll Local meridian (°)Lst Standard meridian (°)m& Mass fl ow rate (kg/s)(mC)e Effective thermal capacity for a solar collector (J/m2K)n Day number (-)q Power (W/m2)R Resistance (Ω)RT Optical effi ciency in the transverse plane - infl uenced by the
refl ector only (-)S Absorbed energy in a solar collector (W/m2)T Temperature (ºC)Ta Ambient temperature (°C)

Solar thermal energy systems for building integration
12
Tf Mean temperature of the absorber fi n (°C)Tin Temperature at the inlet to the collector (°C)Tm Mean fl uid temperature in the collector (°C)Tout Temperature at the outlet from the collector (°C)t Time (s)U Heat loss coeffi cient (W/m2K)V Voltage (V)Voc Open circuit voltage (V)Vmp Voltage at maximal power (V)
Greek symbolsα Solar altitude angle, angle between solar vector and the hori-
zontal plane (°)αNS The solar altitude angle projected in the north-south-vertical
plane (°)β Slope (°)γ Azimuth angel (°)γs Solar azimuth angel (°)ΔT Temperature difference between the collector and the ambient
air (°C)δ Declination (°)η Effi ciency (-)η0 Optical effi ciency (-)η0b Optical effi ciency for beam irradiation (-)η0d Optical effi ciency for diffuse irradiation (-)θ Angle of incidence (°)θa/2 Acceptance half angleθL Angle of incidence in the longitudinal plane (°)θNS Angle of incidence in the north-south-vertical plane (°)θT Angle of incidence in the transverse plane (°)θZ Zenit angle (º)λ Latitude (°)ν Tilt angle of optical axis (°) ρ Density (kg/m3)(τα)n Optical losses at normal incidence (-) φ Flow rate (m3/s)ω Time angle (°)

List of Symbols
13
AcronymnsAG Analog groundCIGS Copper-indium-gallium-diselenide, CuInGaSe2CPC Compound parabolic concentratorDHW Domestic hot waterEPS Expanded polystyreneFF Fill factor (-)HEX Heat exchangerSF Solar fraction (-)VOC Volatile organic compound

Solar thermal energy systems for building integration
14

List of Papers
15
List of papers
I. Gajbert, H. (2007) Using active solar energy in Sustainable Solar Housing, Vol.1, Strategies and Solutions, Hastings, R. & Wall, M. (editors) pp 28-32, ISBN 978-1-84407-325-2, Earthscan, Lon-don.
II. Gajbert, H. & Smeds, J. (2007) Apartment buildings in the cold climate, renewable energy strategy in Sustainable Solar Housing, Vol. 1, Strategies and Solutions, Hastings, R. & Wall, M. (editors) pp 156-170, ISBN 978-1-84407-325-2, Earthscan, London.
III. Smeds, J. & Gajbert, H. (2007) Apartment buildings in the cold climate, conservation strategy in Sustainable Solar Housing, Vol. 1, Strategies and Solutions. Hastings, R. & Wall, M. (editors) pp 150-156, ISBN 978-1-84407-325-2, Earthscan, London.
IV. Gajbert, H., Karlsson, B. & Nilsson J. (2006) Design and evaluation of solar collectors for integration on non-insulated roofs. Submitted to Solar Energy Materials & Solar Cells.
V. Gajbert, H., Håkansson, H. & Karlsson, B. (2004) Measurement of concentrating solar collectors using a solar simulator with parallel light. Proceedings of Eurosun 2004, Freiburg, Germany.
VI. Gajbert, H., Perers, B. & Karlsson, B. (2005) Design and perform-ance of a large solar thermal system with façade-integrated collec-tors in several directions, connected to the district heating system. Proceedings of Northsun 2005, Vilnius, Lithuania.
VII. Gajbert H., Hall, M. & Karlsson, B. (2007) Optimisation of refl ector and module geometries for static, low-concentrating, façade-integrated photovoltaic systems. Published in Solar Energy Materials & Solar Cells 91 (19), pp 1788-1799.
VIII. Fieber, A., Gajbert, H., Håkansson, H., Nilsson, J., Rosencrantz, T. & Karlsson, B. (2004) Design, building integration and perform-ance of a hybrid solar wall element. Proceedings of Eurosun 2004, Freiburg, Germany.

Solar thermal energy systems for building integration
16
IX. Furbo, S., Thür, A., Fiedler, F., Bales, C., Rekstad, J., Meir, M., Blumberga, D., Rochas, C., Karlsson, B. & Gajbert, H., Competi-tive solar heating systems for residential buildings, Proceedings of Northsun 2005, Vilnius, Lithuania.
Introduction
17
1 Introduction
1.1 BackgroundThe ongoing climate changes, caused by the resource consuming life style in our modern society, put us and future generations at great risk and we are given an enormous problem to deal with. It is of the highest importance that the problem is addressed urgently and effectively. The use of fossil fuels must be signifi cantly reduced and renewable energy sources must be implemented on a large scale throughout our society.
Today approximately 80% of the primary energy use in the world is provided by fossil fuels and only about 13% by renewable energy sources. The energy use within the building and service sector accounts for a large share of the total energy use, approximately 40% both in Sweden and in the European Union (Swedish Energy Agency, 2006). This energy demand can be lowered signifi cantly by using improved building construction techniques and a great part of the energy used for space heating and domestic hot water can be supplied by solar thermal energy, which is not only renewable, but also clean in the sense that the conversion phase does not give rise to any green house gas emissions.
The solar thermal market has an immense potential for growth (ESTIF, 2007). The solar energy received by the earth during one hour is more than the total annual energy demand worldwide. It is obvious that we could profi t from solar energy to a far greater extent than what is done today. The biggest problem has been that the cost of solar thermal systems has not been low enough to make these systems competitive on the market. This trend is starting to change with rising energy prices, but it is not changing fast enough.
In order to widen and increase the use of solar thermal energy there are several ways to deal with the issue. Legislation is one way, already practised in some European countries. Governmental subsidies are another way, in which continuity is very important.
Although the collectors of today are already highly developed it is also important to continue the development of collectors and system designs in order to improve their effi ciency, quality, life expectancy, profi tability etc.
Solar thermal energy systems for building integration
18
A higher market growth could be achieved by the introduction of more cost-effective solar collectors. By integrating solar collectors into building elements, both building materials and the time for installation work can be saved, making the collectors more cost-effective. It can also make the collectors more attractive.
The cost-effectiveness of solar collectors can also be increased by using concentrating collectors. By replacing some of the expensive absorber by cheaper metallic refl ectors to concentrate the irradiation onto the absorber, there is a potential to lower the production cost for the collectors. A reduced absorber surface also means lower heat losses.
Sun-tracking collectors with a high concentration ratio would collect the most irradiation per absorber area. However, for building integrated elements, all moving parts should be avoided. Therefore a static system with lower concentration is more suitable for building integration.
1.2 ObjectivesThe purpose of this work is to fi nd good design characteristics for cost-ef-fective solar thermal systems, with the focus on the design of concentrating building-integrated solar thermal collectors. The work has been divided between studies of solar system designs and the design and evaluation of solar collectors. The objective is to fi nd a collector design that can be developed into a cost-effective product. It is mainly the technical char-acteristics that are investigated, while the economic aspects are given less attention.
A couple of previously studied collector designs are further investi-gated and three new collector designs are developed for integration on non-insulated roofs. The collectors are evaluated by indoor and outdoor measurements, with the aim to create cheap, fl exible collectors implying simple production and mounting methods.
The geometry of a concentrating façade-integrated solar collector, which could be used either for photovoltaic cells, thermal absorbers or as a photovoltaic/thermal hybrid, has been optimised by measurements and simulations for maximal annual energy output in the Swedish climate.
A necessary part of the work has been to study the characteristics of the solar simulator at Energy and Building Design, Lund University, in order to fi nd how suitable it is to use for evaluations of the incidence angle dependence of concentrating collectors.
Another important part of the work has been to construct a solar col-lector test rig in order to facilitate and improve the repetitiveness of the collector measurements performed.

Introduction
19
Design features of solar thermal systems for houses with very low energy demand have been investigated by simulations and analyses within the framework of the International Energy Agency and the Solar Heating and Cooling programme (IEA-SHC), Task 28 - Sustainable Solar Housing.
The design and performance of a large solar thermal system with façade-integrated collectors, producing heat for the district heating grid in Malmö, has been studied. Important design features of the system have been described and simulations and analyses have been performed to verify the system performance.
1.3 OutlineA theoretical background with facts and formulas concerning solar ir-radiation, solar angles, heat transfer, optical concentration of light etc. is presented in Chapter 2.
The measurement techniques, tools and experimental methods are described in Chapter 3.
The work performed for IEA-SHC, Task 28 - Sustainable Solar Hous-ing - is presented in Chapter 4, starting with an introduction to the work within Task 28. Section 4.2 presents the content of Section 2.5 in the handbook, Sustainable Solar Housing, Vol 1, Strategies and Solutions, an outcome of the project. This is basically an introduction to how active solar thermal energy can be utilised within buildings, focusing on build-ings with very low energy demand. Section 4.3 is the simulation work performed to design solar thermal systems for buildings with limited energy use (presented in Sections 8.6 and 8.7 in the handbook). This contains simulation results of the energy performance of solar thermal systems for apartment buildings in the Stockholm climate. Design advice is given for this type of buildings in the end of this chapter. The chapters from the handbook are also presented as Papers I, II and III.
Chapter 5 is about the evaluation of three slightly different solar col-lectors designed for integration in non-insulated roofs, also presented in Paper IV. Commonly used corrugated steel makes up the frame of these collectors, two of which have concentrating refl ectors to enhance the ir-radiation on the absorbers during the heating season and thereby achieve a better balance of the energy yield over the year. The design, evaluations and results are presented.
Chapter 6 presents the work performed to investigate how suitable a solar simulator is for applications concerning the evaluation of the inci-dence angle dependence of concentrating collectors. Some issues that were noted about the accuracy of measurements at high angles of incidence

Solar thermal energy systems for building integration
20
have been investigated by using a photodiode array. The results are also presented in Paper V.
Chapter 7 is a summary of Paper VI - a study and evaluation of a solar thermal system connected to the district heating system in Malmö. These solar collectors are integrated in the façade in fi ve different directions as they were installed to replace the old façade material. Simulations of the collector output have been performed as well as analyses of data from the plant. The control features of the system are discussed as well as the simulation results.
Chapter 8 presents the work of Paper VII, which is an optimisation of the refl ector and module geometry of a façade-integrated photovoltaic/thermal hybrid solar collector. The work contains experimental measure-ments and results which have also been used in simulations performed to fi nd the maximal annual energy yield.
Chapter 9 contains a summary and discussion of the work.

Theoretical backgrund
21
2 Theoretical background
2.1 Solar thermal market development
2.1.1 Historic developmentThe basic theory of solar heating is simple and has been known and used for a very long time. The ancient Greeks used passive solar energy to heat their homes in the 4th century BC and there were ideas of how to actively convert solar energy to heat already in the 18th century, when scientists tested the highest temperature they could achieve in a “hot box”, an insulated box with a glass lid. In the 19th century people began to use solar water heaters consisting of black painted metal tanks that were put on the roofs. However, with this technique it took a long time to heat the water and as soon as the sun went down the water would cool down again. Eventually, the technique with the “hot box” and the water tanks were combined in the world’s fi rst commercial solar water heater, which was patented in 1891 by Clarence Kemp from Baltimore, USA. This col-lector was made of black painted metal tanks that were put in boxes with glass lids, capturing the sunlight. It sold very well and the technique was further developed by several actors. In 1909 William J. Bailey developed a system similar to the solar systems used today, where the tank and the solar collector were separated into two units and the insulated storage tank could be placed inside the house, keeping the water hot much longer than previously used systems. (Butti & Perlin, 1980)
In the following years, the market for solar thermal energy started to grow in the USA, but collapsed as gas and electricity became availably at low price. In the 1950:s, 1960:s and 1970:s more attention was paid to solar thermal energy in countries all around the world. The technology was introduced in Japan, where the market increased very quickly. Also in Australia and in countries around the Mediterranean Sea, e.g. Israel, Turkey, Cyprus and Greece, people started to use solar water heaters. These are areas where the market has been strong for a long period (ESTIF, 2006). In 1973, when the oil embargo took place and the price of oil increased dramatically the solar water heater industry was revived in many places.

Solar thermal energy systems for building integration
22
After the price of oil had stabilized in the mid 1980s the sales of solar col-lectors decreased. (Butti and Perlin, 1980; Dessus & Pharabod, 2000).
2.1.2 Recent developmentSince 1990 there has been a favourable development in the solar thermal market in many countries, mainly in China and Europe (Swedish Ministry of Enterprise, Energy and Communications, 2007). In 2004 over 140 million m2 collectors were installed worldwide, of which 76% were glazed collectors (fl at plate and evacuated tube collectors). This corresponds to 99 GWth1 installed capacity, an annual energy yield of 58 MWh, replacing 9.3 billion litres of oil and thereby saving 25 million tons of CO2 annually. China is completely dominating the world market, both in annual sales – with impressively 78 % of the world market (ESTIF, 2006) – and in terms of installed capacity. 44% of the total capacity world wide is installed in China, followed by USA (20%), Japan (5.5%), Turkey (5.2%), Germany (4.6%), Australia (3.4%), Greece (2.1%) and Austria (2.0%). In China the dominating collector type is evacuated tube collectors in thermo siphon systems, whereas unglazed collectors heating swimming pools are those most commonly used in USA and Australia. In Europe, Japan, Turkey and Israel the glazed fl at plate collectors are dominating. The countries with the highest installed collector capacity per capita are Cyprus (with 63 MWth per 100 000 inhabitants), Israel (52 MWth), Greece, Austria and Barbados (19 MWth) (Figures from 2004). (Weiss et al., 20062)
The European market is now growing extremely fast. It increased by 44% from 2005 to 2006, when 3 million m2 glazed collectors were sold (Eur’ObservER, 2007). This can be compared to the European collector sales of 0.3 million m² annually at the end of the 1980s (Dalenbäck, 2005). The installed capacity of glazed solar thermal collectors exceeded 20 million m2 (14 MWth) at the end of 2006 (Eur’ObservER, 2007).
It seems unlikely that the target of 100 000 000 m2 installed collector capacity in the EU by 2010, which was presented in the European Com-mission’s White Paper from 1997, will be reached. The aim is to reach 12% renewable energy in the EU by 2010, a target which was then considered ambitious but realistic (European Commission, 1997). However, some
1Experts from seven countries have agreed on a factor of 0.7 kWth/m² collector area to derive the nominal capacity from solar collectors. The decision was based on tests results and operating conditions specifi ed in the European Code EN 12975-2. More information on www.iea-shc.org and www.estif.org.
2These fi gures are based on a survey conducted in 41 countries estimated to represent 85-90% of the solar thermal market worldwide and 57% of the world’s population.

Theoretical backgrund
23
European countries are excellent role models. If every European country followed the Austrian model, where 15% of all detached houses have solar thermal systems, the target would have been reached already. In fact, two new objectives for installed solar thermal collectors, to be accomplished by 2020, have been defi ned by ESTIF (European Solar Thermal Industry Federation) and published in January 2007 in their “Solar Thermal Ac-tion Plan”. The minimum objective of reaching an installed capacity of 91 GWth (130 million m2) in Europe is based on the Austrian collector density of 199 kWth per 1000 inhabitants and the ambitious objective of reaching 320 GWth (457 million m2) is based on having 1 m2 installed collector per inhabitant (ESTIF, 2007).
As the problems with global warming and limited oil resources have attracted more and more attention, a growing number of municipalities, regions and countries are starting to take action by introducing legisla-tion on fi nancial support systems. Germany has for long been the leading European country in annual sales, followed by Greece and Austria. These are countries were governmental economic support systems have been generous, continuous and reliable. The high energy prices have created a favourable market climate and encouraged many small scale production units to act and to grow. In Austria, for example, private initiatives and campaigns have also played an important role for this development. (Thür and Weiss, 2005; Dalenbäck, 2005; Eur’ObservER, 2007).
The markets in France and Spain are now growing very fast, mainly due to investment programmes and legislation. In France a simple tax deduction system, which enables 50% of the investment costs to be recovered, has recently been introduced and the new Spanish building code, introduced in 2006 (CTE – Código Técnico de la Edifi catión), makes it obligatory to use solar thermal energy to cover 30-70% of the hot water demand in all new constructions or completely renovated buildings. Portugal and India have also introduced legislation similar to that in Spain, something that has been applied in Israel since 1980. The Chinese government has set up a target that 20-30% of the population shall have access to solar heated hot water in 2015, which would require the installation of about 250 million m2 solar collectors. (Eur’ObservER, 2007; Swedish Ministry of Enterprise, Energy and Communications, 2007)
In Sweden the total area of installed solar thermal collectors is ap-proximately 200 000 m2 (0,15 GWth,) and also here the market is grow-ing. The sales of glazed collectors increased by 26% between 2005 and 2006 (ESTIF, 2006; Eur’ObservER, 2007). Here is also a large potential for solar installations on the existing buildings. If solar thermal systems were to be installed in all buildings in Sweden, the potential for replacing bought energy by solar thermal energy has been estimated to 12 TWh,

Solar thermal energy systems for building integration
24
which would require approximately 40 million m2 of solar collectors (Kjellsson, 2004).
The growing market for solar collectors does not only reduce the green house gas emissions, but it also creates jobs and increases industrial growth. (Eur’ObservER, 2007)
The solar thermal collectors sold today are signifi cantly improved in comparison to those introduced in the late 1970s, mainly due to interna-tional cooperation in testing and certifi cation (Solar Keymark) (Swedish Ministry of Enterprise, Energy and Communications, 2007). Today’s collectors are highly developed with only low heat losses, enabling heat generation even at lower irradiation. The use of absorbers with selective surfaces have signifi cantly improved the effi ciency of solar collectors as they offer high solar absorbance and yet a very low thermal emittance. This is achieved by double layers of coatings on the absorbers giving high refl ectance and low emittance for radiation of longer wave lengths and low refl ectance and high absorbance for solar radiation. The glazing is often low in iron content and antirefl ective treated, which gives higher transmittance.
There is also a wide variety of designs of the solar thermal systems that are in operation. The system design developments have led to increased effi ciency of the solar thermal energy systems. Pumps of suitable dimen-sions and characteristics have for long been hard to fi nd, but now the increased market demand has given incentives for development of better suited components.
2.2 Solar irradiationBy fusion in the sun, hydrogen atoms are combined to helium while energy is liberated and radiated as electromagnetic radiation. The spectrum of the sun’s radiation is very similar to that of a blackbody at approximately 5780 K, and its emissivity can be regarded as equal to 1. The radiation is distributed in all directions from the sun and the radiation that falls on the earth outside the atmosphere is 1367 W/m2 (Duffi e & Beckman, 1991), also referred to as the solar constant, Gsc. This is a yearly average, as the irradiance varies slightly over the year (from 1322 in July to 1412 W/m² in December), due to the earth’s slightly elliptic orbit around the sun and to changes in solar activity (Duffi e & Beckman, 1991). As dif-ferent atmospheric gases, e.g. CO2 and water vapour, absorb and scatter solar radiation of different wave lengths, the irradiance that reaches the earth after passing through the atmosphere is reduced to approximately 1000 W/m2. The solar spectrum extends from 0.3 µm to 3.0 µm and

Theoretical backgrund
25
includes near infrared radiation, visible light and ultraviolet radiation and the highest intensity is in the area of visible light, at approximately 0.5 µm. The solar spectrum in Figure 2.1 shows the radiation from the sun before and after it passes through the atmosphere. It also shows the absorption of solar radiation by atmospheric gases.
Figur 2.1 The solar spectrum before (AM0) and after (AM1) passing through the atmosphere.
At higher latitudes, the angle of incidence of the solar irradiance on the earth’s surface is higher, which results in lower irradiance to the ground. The distance through which solar radiation has to travel in the atmos-phere is also longer at higher latitudes, which means that more energy is absorbed and refl ected before reaching the earth. Because of these two ef-fects, average irradiance and annual irradiation are lower at high latitudes. The irradiance is also reduced depending on cloudiness, humidity and the concentration of particles in the air. As the total annual global irradiation (on a horizontal surface) varies from 640 to over 2300 kWh/m² depending on the location, there are naturally very different opportunities of using solar energy. In Sweden, the annual irradiation measured on a horizontal surface is between 950 and 1000 kWh/m2. In the Mediterranean area the global annual irradiation is 1400-1800 kWh/m² and in some areas it can

Solar thermal energy systems for building integration
26
be over 2300 kWh/m², as can be seen in Figures 2.2 and 2.3 (Meteotest, 2006).
Figure 2.2 The annual global irradiation throughout the world, measured on a horizontal surface. (Figure from Meterotest 2006).
Figure 2.3 The annual global irradiation in Europe, measured on a horizontal surface. Figure from Meteotest (2006).

Theoretical backgrund
27
2.3 Solar anglesAs the apparent location of the sun varies over the day and over the year, the angle of incidence of solar irradiance on a specifi c surface varies. To the right in Figure 2.4 the incoming irradiance on a horizontal surface can be seen in relation to the cardinal points, east (E), west (W), south (S), north (N) and to the zenith axis (Z). The solar irradiance is here imagined as a vector, the solar vector. The angle of incidence to a surface is denoted θ and if a horizontal surface is considered, this angle can also be referred to as the zenith angle, θz, as shown to the right in the fi gure. α is the solar altitude angle or the solar height. The azimuth angle of a surface, γ, is the angle between the normal to the surface projected in the horizontal plane and the south axis. The solar azimuth angle, γs, describes the location of the sun relative to the south axis (i.e. the angle between the solar vector projected in the horizontal plane and the south axis).
Figure 2.4 The slope of a surface, β, the surface’s azimuth angle, γ, and the sun’s angle of incidence to the surface, θ, are shown in the left fi gure. To the right, the azimuth angle of the sun, γs, the solar altitude angle (or the solar height), α, and the zenith angle, θz, i.e. the sun’s angle of incidence to the horizontal, are shown.
The sun’s angle of incidence, altitude angle and azimuth angle can be calcu-lated according to the following equations (Duffi e & Beckman, 1991).
The declination, δ, i.e. the angle between the direction of the solar irradiation and the equatorial plane, varies between -23.45° and 23.45° according to Equation 1. The inclination of the earth’s axis is 23.45°. The time of year is here expressed by the day number, n.
⎟⎠⎞
⎜⎝⎛ +⋅
⋅=365
)284(360sin45,23 nδ
Eq. (1)

Solar thermal energy systems for building integration
28
The solar time is a way of expressing time based on the assumption that the sun is in the south at 12.00 o’clock.
Solar time – standard time = 4(Lst-Ll) + E (time difference in minutes) Eq. (2)
The equation of time, E, is used to compensate for the difference between solar time and standard time that is caused by the earth´s elliptic orbit around the sun and by the tilt of the axis of the earth. Lst is the standard time meridian (positive in west, Lst = -15o in Sweden) and Ll is the local meridian.
))2sin(04089.0
)2cos(014615.0)sin(032077.0
)cos(001868.0000075.0(2.229
B
BB
BE
⋅−−⋅−⋅−
−⋅+⋅=
Eq. (3)
B = 360(n-1)/365 (in degrees) Eq. (4)
The time angle, ω, describes the sun’s position east or west of the local meridian (positive angles west of the meridian) and can be calculated as in Equation 5, where hh stands for hours and mm for minutes, in normal time.
lst LLEmm
hh −++
+−⋅=4
)12(15ω Eq. (5)
Knowing the declination and the time angle, the solar altitude angle, α, and the solar azimuth angle, γs, can be calculated by Equations 6 and 7, for which the latitude, λ, must be known.
))sin()sin()cos()cos()(arcsin(cos λδλωδα ⋅+⋅⋅= Eq. (6)
))cos()sin()sin()cos()(cos(
)sin()cos()tan(
λδλωδωδ
γ⋅−⋅⋅
⋅=s Eq. (7)
For calculation of the angle of incidence, θ, on a tilted surface, with the tilt angle β, and surface azimuth angle γ, Equation 8 or 9 can be used.

Theoretical backgrund
29
))cos()sin()sin(
)cos()cos()cos()cos(
)cos()sin()cos()sin(
)cos()sin()sin()cos()cos(
)sin()sin()sin()(arccos(cos
βλδβλωδ
γβλδγβλωδ
γβωδθ
+++
+−−+
+=
Eq. (8)
))cos()sin()cos()sin()(arccos(cos βαγγβαθ +−= s Eq. (9)
When static concentrators for solar collectors are designed, it is important to consider the variation in the solar altitude and the angles of incidence on the surface in question. It is often useful to use αNS, the projection of the solar altitude angle in the meridian plane (the north-south vertical plane). In order to calculate this angle, a coordinate system with the axes X, Y and Z is imagined (X representing south, Y east and Z the zenith axis). The coordinates are transformed from spherical to Cartesian according to Equations 10-12. These angles and coordinate systems are illustrated in Figure 2.5. The projected solar altitude angle is then derived according to Equation 13.
)cos()cos( sX γα ⋅= Eq. (10)
)sin()cos( sY γα ⋅= Eq. (11)
)sin(α=Z Eq. (12)
)cos(
)tan(
)cos()cos(
)sin()tan(
ssNS γ
αγα
αα =
⋅=
Eq. (13)

Solar thermal energy systems for building integration
30
Figure 2.5 The solar altitude angle, α, the solar altitude angle projected in the north-south vertical plane, αNS, the solar azimuth angle, γs, and the zenith angle,θz, in relation to the cardinal points and the zenith axis.
The projected solar altitude angle, αNS, varies over the day as shown in Figure 2.6, showing data from Stockholm (60° latitude). The curves rep-resent different months. At the equinox, αNS in Stockholm is constant 30° during the whole day. In summer this angle is highest in the morning and in the evening, and in winter the highest angle is at noon.
-60
-40
-20
0
20
40
60
80
100
120
600 800 1000 1200 1400 1600 1800
Time of day (hhmm)
Proj
ecte
d so
lar
alti
tude
ang
le, α
NS
[°] 21/6
17/7
15/5
16/8
15/4
23/9
21/3
15/10
16/2
14/11
17/1
22/12
Figure 2.6 The projected solar altitude angle, αNS, shown over the day for dif-ferent months of the year for a location at latitude 60°.

Theoretical backgrund
31
At high latitudes the irradiation from low solar altitude angles gives a relatively high contribution to the annual irradiation. In Stockholm, Sweden (latitude 59.4°N), the highest amount of irradiation on a vertical south-facing surface is from projected solar altitude angles, αNS, between 50° and 55° according to Rönnelid (1998) from 1983-1991, shown in Figure 2.7a. In Figure 2.7b, the irradiation on a south-facing surface tracking around an east-west axis is shown. The irradiation is considerably reduced during the winter due to the cloudy climate and absorption of the radiation in the atmosphere (Rönnelid et al., 1999). This explains the low irradiation for αNS =7°.
0
20
40
60
80
100
120
140
0-5
5-10
10-1
515
-20
20-2
525
-30
30-3
535
-40
40-4
545
-50
50-5
555
-60
60-6
565
-70
70-7
575
-80
80-8
585
-90
South-projected solar altitude angle, α NS (°)
Ann
ual i
rrad
iati
on o
n a
vert
ical
sou
th-
faci
ng s
urfa
ce (
kWh/
m2 a)
Direct irradiation
Diffuse irradiation
Figure 2.7a The annual solar irradiation from different projected solar altitude angles, αNS, on a vertical south-facing surface. Data collected in Stockholm 1983-1991 (Rönnelid, 1998).

Solar thermal energy systems for building integration
32
0
20
40
60
80
100
120
140
0-5
5-10
10-1
515
-20
20-2
525
-30
30-3
535
-40
40-4
545
-50
50-5
555
-60
60-6
565
-70
70-7
575
-80
80-8
585
-90
South-projected solar altitude angle, α NS (°)
Ann
ual i
rrad
iati
on o
n a
sunt
rack
ing
surf
ace
(γ=0
°) (
kWh/
m2 a)
Direct irradiation
Diffuse irradiation
Figure 2.7b The annual solar irradiation from different projected solar altitude angles, αNS, on a surface tracking around an east-west axis. Data collected in Stockholm 1983-1991 (Rönnelid, 1998).
2.4 Heat transfer and thermal performance of solar collectors
The thermal performance of a solar thermal collector is determined based on its optical properties and its insulating capacity. When irradiation falls on the collector, a part of it is lost through optical losses, e.g. refl ection in the glazing, absorption in the glazing and also refl ections in the absorber. There are also multiple refl exes between the glazing and the absorber. The remaining irradiation is absorbed in the absorber, from where the heat is transported, mainly through conduction and convection, to the heat transfer medium. Thereafter the heated liquid is pumped to a heat storage tank. The absorber loses heat, mainly through convection and radiation, but also due to conductive heat losses, and the insulation of both the col-lector and the piping is very important.

Theoretical backgrund
33
Direct irradiation
Diffuse irradiation
Convection losses
Radiant heat from the glazing
Reflection
Convection lossesfrom the absorber
Heat transportationto the tank
Convective heat losses
Piping heat losses
Absorber
Glazing
Insulation
Radiant heat from the glazing
Figure 2.8 The heat transfer processes in a solar collector.
The power, q, from a solar collector is the solar radiation absorbed by the absorber, reduced by the heat losses. This is described by Equation 14, where S is the absorbed radiation, Tf is the temperature of the absorber fi n and Ta is the temperature of the ambient air. U is the heat loss coeffi cient (W/m²K) describing the collector’s insulation capacity.
)( af TTUSq −⋅−= Eq. (14)
2.4.1 IrradianceThe global solar irradiation, G, is the sum of the direct irradiation from the sun, also referred to as beam irradiation, Gb, and the diffuse irradiation, Gd. The ground refl ected irradiation, Gg, which is often small enough to be neglected, is sometimes separated from the diffuse irradiation but it is often included in the diffuse irradiation model, as in this case also.
The momentary effi ciency of a solar collector is calculated by the ratio of the power to the irradiance.
G
q=η Eq. (15)

Solar thermal energy systems for building integration
34
2.4.2 Optical lossesThe optical effi ciency of the collector describes the losses of irradiation in the collector due to refl ection and absorption in the glass cover and the absorber. For a concentrating collector there are optical losses also in the refl ector. The optical effi ciency can also be referred to as the zero-loss effi ciency, i.e. the effi ciency in an ideal case, when the temperature dif-ference between the absorber and the ambient air is zero, so that the heat losses are eliminated leaving only the optical losses.
Optical losses in the glass coverThe glass covering the absorber reduces the irradiation on the absorber since part of the irradiation is refl ected on the glass surfaces and part of it is absorbed in the glass, while the rest of the light is transmitted. Flat clear 4 mm glass panes have a transmittance of approximately 83% at normal incidence. The development of glass material by anti-refl ection treatment and by reduction of the iron content has resulted in increased transmittance. Glass panes with reduced iron content have a transmittance of approximately 90% at normal incidence. It is also becoming more com-mon to use antirefl ection treated glass, which has transmittances of up to 95% (Brogren et al., 2000).
Optical losses in refl ectors The refl ectance of metals is high and weakly angle dependent. The opti-cal losses in refl ectors of various materials, e.g. steel or aluminium, has been investigated in several studies. The steel refl ectors have been found to have refl ectances of around 65% and to be very durable. Aluminium refl ectors have refl ectances of up to 90% but are less durable outdoors. Below a glass the anodised aluminium refl ectors have been shown to be long-term stable (Brogren et al., 2000).
Absorbed energy from solar radiationThe absorbed energy in the collector, S, in Equation 16, is the total ir-radiance reduced by the optical losses in the collector. In order to describe the incidence angle dependence of the absorbed energy, there are different models, which are attempts to describe the transmittance of the glazing for different angles of incidence. The parameters Kb and Kd are the incidence angle modifi ers for beam and diffuse irradiance. The term (τα)n describes the optical losses at normal incidence. Multiple refl exes between the glazing and the absorber are also included in this term.

Theoretical backgrund
35
)()( ddbbn GKGKS ⋅+⋅= τα Eq. (16)
The most commonly used model of the incidence angle modifi er for beam irradiance, Kb, is expressed in Equation 17, which is valid for incidence angles below 60°. For incidence angles over 60°, the curve declines linearly to 90°. The incidence angle modifi er coeffi cient, b0, is characteristic for the glazing.
⎟⎠⎞
⎜⎝⎛ −⋅−= 1
cos1
1 0 θbKb Eq. (17)
The collector effi ciency factor, F’, is used to compensate for the heat losses that arise because the temperature of the absorber fl ange is higher than the temperature of the fl uid in the absorber. F’ is a temperature depend-ent parameter which includes various heat resistances in the absorber and infl uences both the absorbed energy and the heat losses, due to the collector characteristics. If F’ is taken into account, the power, q, can be expressed as in Equation 18, where the difference between the mean liquid tempera-ture, Tm, and the temperature of the surrounding air, Ta, is used instead of (Tf-Ta). This is the more commonly used expression. Tm is also easy to establish by measurements of the inlet and outlet liquid temperatures, Tin and Tout , of the collector. The power can therefore be developed into Equation 20. The term (Tm-Ta) is often referred to as ΔT.
)('' am TTUFSFq −⋅−= Eq. (18)
⎟⎠⎞
⎜⎝⎛ +
=2
outinm
TTT
Eq. (19)
)(')(')(' amddnbbn TTUFGKFGKFq −−+= τατα Eq. (20)
By less detailed expression of the irradiation, the power can be written as in Equation 21.
TUFGq Δη ⋅−⋅= '0 Eq. (21)
The incidence angle dependent term, Kb, and the term F’(τα)n are put together and are referred as η0b, the optical effi ciency or the “zero-loss ef-fi ciency” for beam irradiation. Sometimes it is also referred to as F´(τα)e, where e denotes effective.

Solar thermal energy systems for building integration
36
bneb KFF ⋅⋅=⋅= )(')('0 ταταη Eq. (22)
In the same way the incidence angle modifi er for diffuse irradiance, Kb, and F’(τα)n are often written together as η0d. The power can then be expressed as in Equation 23.
)('00 amddbb TTUFGGq −⋅−⋅+⋅= ηη Eq. (23)
2.4.3 Thermal heat losses from the collectorHeat is lost from the solar collector through the top, the back and the edges of the collector and can thus be described as in Equation 24 (subscripts b for back, t for top and e for edges).
etb UUUU ++= Eq. (24)
The overall temperature dependent heat loss coeffi cient, F’U, can also be written as:
( )am TTUFUFUF −⋅+= 10 ''' Eq. (25)
The term describing the heat losses can thus be written as:
( )210 ')(')(' amamam TTUFTTUFTTUF −⋅+−⋅=−⋅ Eq. (26)
There are also cumulative temperature changes in the collector that affect the power. The term (mC)e dT/dt is the heat capacity of the collector, mul-tiplied by the temperature increase of the collector. By adding this term, the expression of the collector power can be developed into Equation 27.
( ) ( )dt
dTmCTTUFTTUFGGq m
eamamddbb −−−−−+= 21000 )(''ηη
Eq. (27)

Theoretical backgrund
37
2.4.4 Evaluation of thermal performance from measured data
Evaluations of the thermal performance of solar collectors are performed by measurements of the liquid temperatures at the inlet and outlet, the ambient temperature, the fl ow rate and the diffuse and global irradiance in the collector plane, according to standard procedures (in Sweden ac-cording to SS-EN 12975-2). The overall effi ciency of the collector can then be determined from Equation 28, where m& is the mass fl ow rate, cp is the specifi c heat capacity and A is the collector area. As the density of the liquid is temperature dependent it should be determined for the temperature in the fl ow meter. The value of cp should be determined at the mean temperature of the liquid in the collector.
AG
TTcm inoutp
⋅
−⋅⋅=
)(&η Eq. (28)
The total optical effi ciency, η0, can be calculated from measurements of thermal performance by rearranging Equation 21 into Equation 29.
G
TTUFq am )('0
−+=η Eq. (29)
A more specifi c evaluation of the measured data can be performed by multilinear regression, MLR, according to the model described by Perers (1993). The model is based on Equation 27, which for a fl at plate collector can be written as in Equation 30. From the monitored parameters, the collector power, q, the diffuse and direct irradiance, Gb and Gd, the mean collector temperature, Tm, and the ambient temperature, Ta, the parameters F’(τα)n, b0, Kd, F’U0, F’U1 and (mC)e are derived by MLR.
( ) ( ) ( )dt
dTmCTTUFTTUF
GKFGbFq
meamam
ddnbn
⋅−−⋅−−⋅−
−⋅⋅+⋅⎟⎟⎠
⎞⎜⎜⎝
⎛⎟⎠
⎞⎜⎝
⎛ −⋅−⋅=
210
0
''
)('1)cos(
11)(' τα
θτα
Eq. (30)
For concentrating collectors (non-tracking), the optical effi ciency for beam irradiation is strongly dependent on the angle of incidence of the ir-radiation in the transverse plane. This means that Equation 23 and Kb cannot be applied to describe the angular dependence. A detailed angular

Solar thermal energy systems for building integration
38
dependence of the optical effi ciency should therefore be calculated and established from measurements in order to set up a model for predicting the collector power. The optical effi ciency for beam irradiation can be calculated from Equation 31.
( )( ) ( ) ( )
b
meamamdd
b Gdt
dTmCTTUFTTUFGq ⎟
⎠⎞
⎜⎝⎛ −−−−−−
=
2100
0
''ηθη Eq. (31)
Optical effi ciency of concentrating photovoltaic systemsFor concentrating photovoltaic systems, the optical effi ciency can also be calculated from measurements of the short-circuit current from the photovoltaic cells in the concentrating system, Isc, conc, and from a refer-ence cell of equal type and size that is placed in the same direction as the glazing of the concentrating system, Isc, ref. As the short-circuit current is proportional to the irradiance on the cell, the relation between these currents gives a measure of the infl uence of the refl ector. Knowing the geometric concentration ratio, C, the optical effi ciency can be calculated according to Equation 32.
refsc
concsc
IC
I
,
,0 ⋅
=η Eq. (32)
2.5 Optical concentration of lightLight can be concentrated by non-imaging or imaging optics. Imaging optics is used to transform light in an ordered way whereas non-imag-ing optics is about transforming light from one area to another without concerns regarding the paths of the rays. Either lenses or refl ectors can be used for concentration of light. (Welford and Winston, 1989)
Optical concentration of irradiation by mirrors can be used to increase the irradiation on a solar absorber and thereby increase the energy out-put.
The technique to concentrate sunlight by using mirrors has been known for a long time, and was e.g. used at the world exhibition in Paris in 1878 (Dessus, 2000). Since then, many types of concentrators have been developed. Parabolic mirrors are often used in solar energy applications (Winston, 2001), either as two-dimensional troughs, often extended in the east-west direction, or as three-dimensional sun-tracking dishes, which are often used for power generation in combination with a conventional steam turbine.

Theoretical backgrund
39
The geometric concentration ratio of a concentrator is the ratio between the aperture area, A1 and the area of the receiver, A2, i.e. the absorber (see Figure 2.10).
2
1
A
AC = Eq. (33)
The concentration can also be described by the ratio between the irradiance on the receiver, G2, and the irradiation on the aperture, G1.
1
2
G
GC = Eq. (34)
The maximum concentration of an ideal two-dimensional concentrator is given by Equation 35 (Welford and Winston, 1989), where θa/2 is the half-acceptance angle that is illustrated in Figure 2.10.
2/
2max, sin1
aDC
θ= Eq. (35)
2.5.1 Parabolic refl ectorsThe parabolic shape is suitable for the design of refl ectors for concentrat-ing collectors as all irradiation that is parallel to the optical axis (the y-axis in Figure 2.9), will be refl ected to the focal point, F (case a). Irradiation coming from the right hand side of the optical axis in Figure 2.9 (case b) will be refl ected to a point along the focal length, P, which is the distance between Origo and F. Irradiation from the left hand of the optical axis will be refl ected back out (case c). The parabola is mathematically described by Equation 36 the distance between the focal point and a certain point on the parabola, r, is calculated by Equation 37 and φ denotes the angle between r and the optical axis.
px
y4
2
= Eq. (36)
⎟⎠⎞
⎜⎝⎛
=
2cos2 φ
Pr
Eq. (37)

Solar thermal energy systems for building integration
40
φ
Figure 2.9 The parabola. The y-axis is the optical axis of the parabola, F is the focal point, p is the focal length, and r is a vector from F to a point on the parabola. φ denotes the angle between r and the optical axis.
The Compound Parabolic Concentrator (CPC) is based on two parabolic refl ectors with the focal points at the edges of the absorber as shown to the left in Figure 2.10. The concentration ratio of an ideal CPC is given by Equation 35. The geometry of the CPC can be modifi ed to enhance concentration from certain solar angles while suppressing the irradiation from others. This is the purpose of the MaReCo (Maximum Refl ector Collector) (Karlsson and Wilson, 2000), which is shown to the right in Figure 2.10. This collector is designed for static conditions and well adapted for the Swedish climate where most of the annual irradiation comes from projected solar altitude angles (αNS) of 50-55° (Figure 2.7). The angles of the optical axes and the slope of the truncation of the two parabolas give the specifi c acceptance interval. The stand-alone-MaReCo refl ects all irradiation from solar altitude angles between 20° and 65° onto the bifacial absorber.
θa /2
A1
A2
Figure 2.10 A CPC and a stand-alone MaReCo (Maximum Refl ector Collec-tor).

Theoretical backgrund
41
Another collector is designed for integration in a 30° tilted roof. A single refl ector is used to refl ect light to a bifacial absorber. The lower part of the refl ector is parabolic up to the optical axis and the upper part is circular. The inclination of the optical axis sets the limits of the acceptance interval of the collector. The design to the left in Figure 2.11 refl ects light from solar altitude angles between 0° and 60°. From higher altitude angles, the light will fall directly on the absorber but no light will be refl ected to the back side of the absorber.
Figure 2.11 Two concentrating collectors designed for tilted roofs. The right col-lector is optimised for spring and autumn performance.
The design to the right in the fi gure has a lower inclination of the optical axis and thus a smaller acceptance interval, only from 0° to 45°, which implies that the refl ector will mainly be in use from autumn to spring. This evens out the seasonal variations in the collector output.
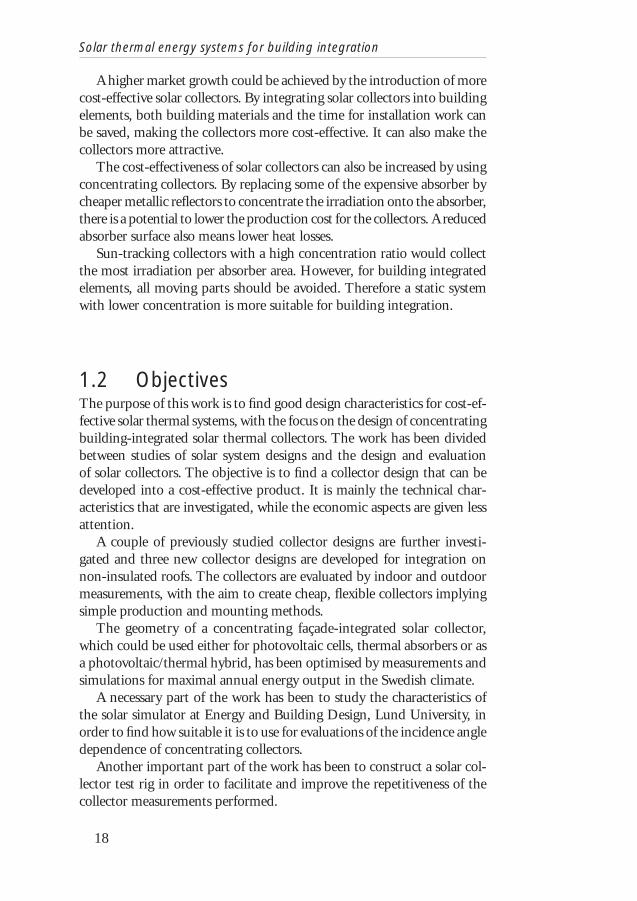
A façade integrated concentrating collectorConcentrating collectors can also be integrated in façade elements. An example of a wall element including façade and insulation is illustrated in Figure 2.12. The geometry for this refl ector is a parabola where the tilt angle of the optical axis, ν, here is 25° and a vertical glass surface truncates the parabola from the focal point. The absorber tilt angle β is 20°.
Solar thermal energy systems for building integration
42
Optical axis
Horizontal
φ
P
Module
Reflector
F
ν
h
βa
Figure 2.12 A concentrating solar collector, integrated in an insulated façade element. The geometry of the refl ector is a tilted parabola with the optical axis tilted 25°.
The concentration ratio can be calculated from the expressions of the absorber width, a, and the height of the refl ector, h, which are described by Equations 38 and 39, both derived from Equation 37. The geometrical concentration ratio is here 2.96.
⎟⎠⎞
⎜⎝⎛ +
=
2cos2 βν
Pa
Eq. (38)
⎟⎠⎞
⎜⎝⎛ +
=
290
cos2 νP
h
Eq. (39)
⎟⎠⎞
⎜⎝⎛ +
⎟⎠⎞
⎜⎝⎛ +
==
290
cos
2cos
2
2
ν
βν
ah
C Eq. (40)
The collector can concentrate light from angles of incidence between 25° and 65°. At lower angles, a small part will fall directly on the absorber and the rest is refl ected back out. At angles of incidence higher than 65° the incoming irradiance will fall directly onto the absorber.

Theoretical backgrund
43
2.5.2 The involuteThe involute curve can be described as the shape drawn when unwinding a string that has been wound around a circular object, if a pen is attached to the outer end of the string, as shown in Figure 2.13. (The string is here unwound counter clockwise.) Thus, each point on the circle gives a corresponding point on the involute at the end of a line tangent to the point on the circle. Each line has the length of the circular arc reaching to the starting point of the circle (at σ=0°). r is the radius of the circle. The coordinates of the involute are given by Equations 41 and 42. (The equations are derived from the fi gure in Appendix A.I). The involute is further described by Welford and Winston (1989).
All irradiation falling on an involute-shaped refl ector with a tubular absorber at the location of the circle will be refl ected on to the absorber.
x
y
s
r
σ=0°
σ=180°
σ=90°σ=360°
I nvolute
Figure 2.13 The involute curve.
σσσ cossin rrx −= Eq. (41)
σσσ sincos rry −−= Eq. (42)
In order to create a suitable refl ector shape for a pipe absorber for a roof-integrated solar collector the shape of an involute has been used in com-bination with a semi-parabola (see Figure 2.14 and also Paper IV). The semi parabola is described in Appendix A.II. The parabolic part of the refl ector is heavily truncated to decrease the height of the collector. This

Solar thermal energy systems for building integration
44
means that the concentration is decreased but also that irradiance from outside the original acceptance interval will reach the absorber.
θa / 2
X
Y
Involute
2L
Semi parabola
X
Y
Invo lu te
Sem i parabo la
Figure 2.14. A geometrical shape made up of an involute and a semi parabola. The refl ector is truncated to get the opening width 2L. All irradiation from angles of incidence up to the half-acceptance angle, θa/2, will be refl ected onto the pipe absorber.
The optical acceptance of the truncated concentrator is one (i.e. all irra-diation will be refl ected onto the tubular absorber) when the beam comes from inside the acceptance interval, i.e. from angles of incidence up to θa/2. (See Figure 2.15 to the left.) The maximum geometrical concentration ratio is then equal to 1/sin (θa/2) (Equation 35).
When irradiation from outside the acceptance interval falls on the col-lector surface, it is only the irradiation that falls on the half of the aperture area, L, minus the area S in Figure 2.15 that will be refl ected onto the absorber. The rest of the irradiation is refl ected back out. This means that the maximal optical acceptance is equal to (L-S)/2L.

Theoretical backgrund
45
0°< < 40° θ
L
S θ> 40°
Figure 2.15 The geometrical acceptance of the concentrating pipe collector with a refl ector made up of an involute and a semi parabola. All irradia-tion from within the acceptance interval between 0° and 40° will be refl ected onto the pipe - the acceptance is 1. When irradiation from outside the acceptance interval falls on the collector, a part falls directly onto the pipe absorber and a part of it is refl ected back out, reducing the acceptance to (L-S)/2L.
2.5.3 Incidence angle dependence for concentrating collectors
For asymmetric 2D concentrating collectors, the optical effi ciency is dependent on the angles of incidence in both the transverse and the lon-gitudinal planes, as illustrated in Figure 2.16. Here θL is the longitudinal angle and θT is the transverse projected angle of incidence. The optical effi ciency of such collectors can be modelled by a biaxial model (Equation 43) that accounts for the different angular dependencies.
qL qT
Figure 2.16 The longitudinal incidence angle, θL, and the transversal incidence angle, θT, of a 2D concentrating collector.
),0()0,(),( TTLLTL KKK θθθθ = Eq. (43)

Solar thermal energy systems for building integration
46
This model was presented by McIntire (1982) and it estimates the optical effi ciency K by measurements of the optical effi ciency in the longitudinal and transverse directions. However, this model does not calculate the angular dependence of the glazing in a correct way as the effect of the glazing can be included twice using this model.
A modifi cation of the model has been proposed by Nilsson et al. (2006) (Equation 44). This model is based on separate measurements of the opti-cal effi ciency of the refl ector and the glazing.
)()(),( TTLTL RfK θθθθ ⋅= Eq. (44)
K(θL, θT) is the optical effi ciency for any given angle of incidence, depend-ing on the angles of incidence in the longitudinal and transverse planes.
fL(θ) gives the infl uence of the glazing for varying angles of incidence. fL(θ) is obtained by measuring the angular optical effi ciency in the longi-tudinal plane at a given θT, when the effect of the refl ector is equal for all angles θT. fL(θ) can also be estimated from the Kb function (Equation 17) which gives the infl uence of the glazing if its b0 value is known.
RT (θT) gives the infl uence of the refl ector (in the transverse plane) and is obtained by measuring the optical effi ciency of the collector for varying angles in the transverse plane when θL = 0°, and without glazing. If a glass cover is used to protect the collector, the resulting function is K(θL= 0, θT), which is infl uenced by both the glazing and the refl ector, as shown in Equation 45. Then, RT(θT) will be obtained by division by fL(θT), as shown in Equation 46.
)()(),0( TTTLT RfK θθθ ⋅= Eq. (45)
( ) ( )TL
TTT f
) K(0,R
θθ
θ = Eq. (46)
This means that the ratio between the measured dependencies in the θT and θL directions gives the infl uence of the refl ector only. The complete expression for the angular dependence is shown in Equation 47, which also explains Equation 44.
( ) ( ) ( )( ) ( ) ( )TTL
TL
TLTL Rf
f
KfK θθ
θθ
θθθ ⋅=⋅=,0
, Eq. (47)

Theoretical backgrund
47
2.5.4 Refl ector materialMirrors based on anodised or coated sheet aluminium are often used as refl ectors because of their good solar refl ectance, manufacturing fl exibility and low cost. Aluminium refl ectors offer specular solar refl ectance of up to 87 % initially, while their refl ectance later on depends on exposure to climatic conditions and on the possible use of a protective coating. This type of refl ector also has good mechanical properties. However, their corro-sion resistance is limited, which may cause problems. There are several other booster refl ector materials available on the market, which give considerably higher solar refl ectance than anodised aluminium. For example, Miro sheets from Alanod have a solar refl ectance of 90 % at normal incidence. (Brogren et al., 2000)
2.6 Concentrating hybrid PV/thermal collectors
The combination of a photovoltaic absorber and a thermal absorber is interesting as the energy that cannot be used by the solar cell can be uti-lised for heat production.
In concentrating systems the concentration ratio varies over the cell surface and can be very high at the focus, resulting in high temperatures. The effi ciency of photovoltaic cells decreases with increasing cell tempera-ture as the voltage and the fi ll factor, FF, of the cell (given by Equation 48) decreases. The effi ciency of the cell is proportional to Isc · Voc · FF and the reduction in effi ciency with temperature is -0.4%/K (Nilsson, 2005). Too high temperatures can also result in damage to the module. Cooling is therefore necessary in concentrating photovoltaic systems.
There are several cooling methods available, but work by Edenburn (1980) and Rönnelid et al. (1999) indicate that active water cooling is the most cost-effective method for low-concentrating line-focusing systems. A hybrid absorber can thus have a positive effect as it provides cooling for the solar cell and makes use of the thermal energy.
The fi ll factor describes how well the cell’s I-V (current-voltage) curve (Figure 2.17) coincides with the ideal curve. For an ideal I-V curve, Isc is constant until Voc is reached and then it drops to zero.
ocsc
mpmp
VI
VIFF
⋅
⋅= Eq. (48)

Solar thermal energy systems for building integration
48
V (V)
I (A) P (W)
I(A)
P(W)
I sc
I mp
P max
V ocV mp
ideal I-V curve
Figure 2.17 The current-voltage (I-V) curve of a photovoltaic cell. Isc is the short-circuit current, Voc is the open circuit voltage, Imp and Vmp are the current and voltage at the maximum power. The fi ll factor, FF, is dependent on the shape of this curve. For an ideal I-V curve, Isc is constant until Voc is reached and then it drops to zero.
2.7 Building integration of solar collectorsThe designs of solar collectors should be adapted with regard to the interests of the building industry and the private users.
For new buildings it is preferable to integrate the collector as much as possible in the building element, in order to save building material and reduce the labour cost for mounting the collectors. Prefabrication of the collectors integrated in wall or roof building elements is desirable as series production increases the economic benefi ts. The mounting of the building elements, including collectors, can then be performed easily and quickly.
Service and replacement of components are diffi cult for building inte-grated materials and a guaranteed long durability of the optical properties is desirable. It is therefore important to perform lifetime tests on a mate-rial intended for use in building-integrated systems, preferably including outdoor tests and tests of accelerated ageing, to prove the optical durability of the refl ector materials (Nostell et al., 1998).
It is also important to ensure that the building envelope is of high in-sulation quality, which means that the collector must be well insulated.
When a solar collector is to be mounted on an existing building, is it important that the installation can be performed quickly and safely, but correctly.

Theoretical backgrund
49
Regardless of the integration level, it is important to keep the main-tenance requirements as low as possible in order for the collectors to be attractive to customers. It is also crucial that the airtightness and load-bearing capacity of the construction are not impaired by the integration of the collector.
Leakage from the collectors and the attachments must be avoided. Leakage occurs most frequently at the attachments or where the roof is penetrated. The durability of the collector should preferably be as high as that of the rest of the building envelope. It must also withstand tempera-ture changes and ageing. If it is necessary to replace parts of the collector, it must be possible for this to be done easily.
The safety of operation is very important and design features that could cause operational problems must be avoided. An example is glycol free drain back systems, which can give rise to freezing problems.
Prefabrication, simple transportation and mounting are desirable fea-tures of the collectors. Loose details on the elements should be avoided and general solutions for the attachment of the collectors should prefer-ably be part of the design in order to avoid the specifi cation of special solutions for each project. Ease of connection of the coupling of the solar system components to the building’s heating system and control system is desirable.
Another issue concerning the system’s integration in the building is the location of the tank. It should preferably be placed as close to the collectors as possible. Thermosyphon systems, where the tank is connected directly above the collectors, are widely used in warmer climates.
As for all solar systems, it is important to avoiding shading. Roofs are in this respect generally better than walls on moderately high buildings. The orientation of the collectors is of course very important. In Sweden the optimal tilt angle is 35-50°. A higher angle will reduce the seasonal changes over the year and a larger collector will be required if fl at plate collectors are used. A concentrating collector can be designed to reduce the seasonal changes even if placed on a fl at roof.
An attractive collector design or a design that makes the collector harmo-nize with the building design is also an important issue on the market.
Today the market for building integrated solar collectors is on the in-crease, mainly in countries such as Germany and Austria. Large companies are using solar cells, solar thermal collectors and solar windows that are integrated into highly fl exible and attractive building elements that are easily adapted to any building type. A few examples of building integration of solar collectors are shown in Figures 2.18 and 2.19.

Solar thermal energy systems for building integration
50
Figure 2.18 Building integration of solar thermal collectors in façades (to the left and in the middle) and of photovoltaics in solar screens (to the right). (Photo: Schüco Internation KG).
Figure 2.19 Building integrated photovoltaics in Bunkefl ostrand in Malmö, Sweden. (Photo: Schüco Internation KG).

Measurement techniques
51
3 Measurement techniques
This chapter describes the measurement set-ups, the techniques and equip-ment used for the experimental measurements performed for this work. The simulation programs used are also described in this chapter. Further information is presented in the other chapters. The measurements were partly made outdoors and partly indoors in the laboratory using a solar simulator. Measurements have also been carried out at the Älvkarleby test facility.
3.1 Measurement set-up
3.1.1 Outdoor measurements using the test rigConcentrating collectors have been evaluated from outdoor measurements using a test rig (described in Section 3.2.3). These measurements were carried out on the roof of the EBD laboratory. During the measurements the collector to be evaluated was mounted on a south-facing stand, ad-justable for different tilt angles. Two pyranometers for global and diffuse irradiation were mounted in the collector plane and a static shading ring was mounted in front of the pyranometer measuring diffuse inradiation so that the sensor was constantly shaded regardless of the collector tilt, as shown in Figure 3.1.

Solar thermal energy systems for building integration
52
Figure 3.1 The two pyranometers for measurements of the hemispherical and diffuse irradiation, mounted in the collector plane.
The inlet temperature of the collector was measured with a Pt 100 sensor and the temperature difference between the inlet and outlet temperature was measured by two Pt 100 sensors and a resistance bridge (as described in Section 3.2.4). This technique gives a more accurate output when dif-ferences between inlet and outlet are measured at low temperature. The logger on the test rig was programmed to control the inlet temperature so that it is kept constant. Air vents were placed on the collector outlet and inlet as shown in Figure 3.2.
Figure 3.2 Insulated air vents and Pt 100 sensors on the collector inlet and outlet.

Measurement techniques
53
Evaluation of incidence angle dependence Measurements of the transverse incidence angle dependence of a concen-trating collector were performed with the collector mounted so that the absorbers are directed in the north-south vertical plane, tilted so that the normal of the glazing is oriented towards south, as shown in Figures 3.3 and 3.4.
W E
N orm alθΤ
N
S
Figure 3.3 The set-up for measurements of the transverse incidence angle depend-ence.
The collector tilt was then constantly adjusted during the measurement (basically by rotation around an east-west oriented axis) so that the sun was in an east-west plane perpendicular to the front of the solar collector. This means that the incidence angle in the longitudinal plane, θL, is zero. Also, the incidence angle is minimised and equals the transverse incidence angle θT (for this collector in the east-west direction) at all times. The transverse incidence angle can therefore be calculated from Equation 49, which gives the incidence angle as a function of the declination and the time angle for a tracking surface in a plane rotated about a horizontal east-west oriented axis that is continuously adjusted to minimize the incidence angle (Duffy & Beckman, 1991).
2
122 )sincos1()cos( ωδθ ⋅−= Eq. (49)

Solar thermal energy systems for building integration
54
Figure 3.4 A solar collector mounted on the roof of the EBD Laboratory and adjusted to different tilt angles.
The results were verifi ed by checking an incidence angle indicator. The calculated and measured angles showed good correspondence and this method appears to work well, which is benefi cial as data from a high number of incidence angles can be collected in a short time.
The incidence angle indicatorIn order to read the incidence angles during outdoor measurements, an aluminium plate with a pin that gives a shadow from the sunlight on a marked scale of angular intervals was designed and carefully mounted on the collector frame (see Figure 3.5). The reading on the scale gives a good indication of the incidence angle. This device was always mounted with the pin oriented in the collector plane, regardless of the orientation of the collectors.
Figure 3.5 The device for measuring the transverse incidence angle on the glazing of the collector.

Measurement techniques
55
3.1.2 Long-term outdoor measurements at the Älvkarleby test facility
For the roof integrated collectors of corrugated steel described in Chapter 5, the evaluations were partly performed from long-term outdoor measure-ments at a test facility for solar collectors at Älvkarleby, Sweden (60.5°N, 17.4°E). The collectors were then mounted on a 45° tilted stand directed towards south, as shown in Figure 3.6, with the absorbers in the east-west direction, which means that the transverse incidence angles are in the north-south vertical plane. The temperatures of the ambient air and the collector inlet and outlet, the fl ow rates and the global and diffuse irradia-tion were measured and monitored at ten minute intervals. The global and diffuse irradiance were measured in the collector plane, as shown in Figure 3.7, which also shows the air vents at the inlet and after the outlet of the collectors.
Figure 3.6 The collectors mounted outdoors at the Älvkarleby test facility.

Solar thermal energy systems for building integration
56
Figure 3.7 The pyranometer mounted in the collector plane (to the left) and the inlet piping with an air trap and a vent (to the right).
The tilts of the collectors were constant during these measurements. The temperatures were measured by Pt 100 sensors and the fl ow rates were measured by inductive fl ow meters. An advanced data logger system col-lects the data at all hours during the evaluation period.
3.1.3 Early measurements
Experimental set-up In the beginning of the project, before the test-rig was designed and built, measurements were performed using the set-up illustrated in Figure 3.8. This set-up has been used for both indoor and outdoor measurements.
During these measurements, small (0.6×1.0 m) collector prototypes of the Collectors A, B and C, described in Chapter 5, were used. In these measurements the collectors were however equipped with insulation on the back. The prototype of the concentrating Collector C used in these meas-urements was later replaced by a prototype with a smoother refl ector.
The global irradiance was measured with a pyranometer in the collector plane. The collector is connected to a pump and to an expansion vessel that also serves as fi lter and device for refi lling the collector circuit with water. A Campbell logger, model CR10X, was used for data collection. A

Measurement techniques
57
PID-regulator and an amplifi er were used to maintain the inlet temperature constant during the measurements.
The inlet temperature was measured with a Copper/Constantan ther-mocouple and the low temperature difference between Tout and Tin was measured with a thermopile. The outlet temperature was then calculated from these two registered values.
If the registered inlet temperature is too high the regulator gives a signal to the pump in the cooling circuit to operate and if it is too low it gives a signal to the electric heater to operate. The cooling works by circula-tion through a branched circuit in which an air-cooled heat exchanger is connected. A fan is used to enhance the cooling process. An inductive fl ow meter connected to a fl ow display measures the fl ow rate. As cooling below ΔT = 0°C (Tm-Ta) is not necessary for these measurements, this type of passive cooling was adequate. The regulation to keep a constant inlet temperature was found to work best when a temperature sensor was placed close to the mixing zone after the cooling circuit.
The measured irradiance, the fl ow rate, Tin, Tout and Ta were registered and the mean zero-loss effi ciency, η0, was calculated for each measured transverse incidence angle, giving the transverse incidence angle depend-ence of the collector.
Flowm ete r
E lectric hea ter
C ooler - a ir heat exchang er
Vesse l for expan sionand refilling w ith a filter inc luded
C ircu la tionpum p
P ID regulator
C ontro lpum p
A m plifier
Logger
C om puter
P yranom eter
S olar co lle ctor
Ti n
To u t
Tem perature se nsors
M ix ing zone
Figure 3.8 System set-up for the early indoor measurements.

Solar thermal energy systems for building integration
58
Outdoor measurements for determining the optical effi ciency This measurement set-up was applied for outdoor measurements intended to determine the optical effi ciency at various transverse incidence angles and to verify the results from indoor measurements.
An adjustable stand, shown in Figure 3.9, was used to change the tilt of the collector during the measurements. The collector and the pyranom-eter were directed towards the solar azimuth, which means that the solar altitude angles represented the transverse incidence angles. An indicator of the incidence angles similar to the one shown in Figure 3.5 was mounted on the side of the collector.
As it is important to keep the heat losses minimal, to get an accurate value of the zero-loss effi ciency, the fl ow was circulated through the heat exchanger providing passive cooling to the ambient air. The collected data was relatively stable and ΔT was kept as low as possible. The average value of ΔT was 2.5°C and the maximum value was 6.5°C at an average operating temperature of 7.5°C.
Figure 3.9 An outdoor measurement outside the laboratory in Lund.
The results from these measurements were used together with results from the dark-hour evaluations of the F’U value to derive the value of optical effi ciency. As ΔT is already very close to 0°C, good accuracy is achieved.

Measurement techniques
59
Indoor measurements with the solar simulator Indoor measurements of the thermal performance were carried out with the same measurement set up. Both the transverse incidence angle depend-ence and the F’U value were evaluated. During the indoor measurements, the collector to be tested was mounted on an adjustable stand at the pivot point in front of the solar simulator (see Figure 3.10). The simulator was raised to different heights (0°-70°), often in 5° or 10° intervals, so as to simulate different solar altitude angles. Occasionally the collectors were placed vertically on a rotating stand in front of the simulator. The inci-dence angles were then simulated by rotating the collectors. The irradi-ance was measured with pyranometers placed both in the collector plane and perpendicularly in front of the solar simulator. During some of these measurements, a photo diode array was placed on the collector surfaces in order to get more accurate values of the total irradiance on the test area (described in Section 3.2.2).
Evaluations of the U-value The value of F’U was derived from both indoor and outdoor measurements. The operating temperature of the water in the collector was varied and the results of effi ciency for different values of ΔT (i.e. Tm-Ta) were used to estimate F’U. This evaluation was also performed in the dark, giving the “dark hour F’U-value” of the collector. During these measurements, an electric heater was used to heat the water to a constant temperature. The negative power from the cooling of the collector, i.e. the heat losses achieved at different operating temperatures, was monitored and used to determine F’U.
This is a stable repeatable method which however gives a slightly dif-ferent result of the F’U-values compared with the results of F’U-values measured with irradiation. This difference is due to the opposite heat fl ow direction between the fl uid and the absorber surface. This effect is explained by Hellström (2005).
3.2 Measuring equipment
3.2.1 The solar simulatorA large solar simulator which provides parallel light - which is an almost unique characteristic for a solar simulator - and is adjustable for solar al-

Solar thermal energy systems for building integration
60
titude angles has been used for some measurements in this work (Figure 3.10).
The simulator can be raised to simulate different solar altitude angles between 0° and 73.5°. Simultaneously, the platform in front of the lamps can be rotated, which makes it possible to simulate the sun’s course during the day.
Figure 3.10 The solar simulator in a horizontal position and raised to the maxi-mum elevation of 73.5°.
The seven metal-halide lamps use large refl ectors, formed in the shape of paraboloids, that render the light nearly parallel. The lamps used are 2.5 kW Philips discharge lamps. This model is called MSR by the manu-facturer, which denotes Metal halide Short arch Rare earth. The lamps provide radiation with spectral characteristics similar to those of sunlight (see Figure 3.11) in the range that is visible to the human eye – 400-700 nm. The UV radiation as well as most of the long wave radiation is fi ltered off in the glass in front of the lamps. (Håkansson 2003 a)

Measurement techniques
61
0
200
400
600
800
1000
1200
1400
0 0,2 0,4 0,6 0,8 1 1,2 1,4
Wavelength [μm]
Irra
dian
ce [
W/(
m2 · μ
m)]
UV-ANear
infrared Middle infrared
IR-A
Philips M SR M etal halide Short arch R are earth
WithoutUV-filter
Solarspectrum
IR-B
Figure 3.11 The spectral distribution of the lamps of the solar simulator (Philips discharge lamps, 2.5 kW).
The simulator was originally designed for simulation of solar irradiance for evaluations of solar shadings, but as the parallel light is an important characteristic when the incidence angle dependence of concentrating collectors is evaluated, it is desirable to use it also for this purpose. The facility to evaluate solar collectors indoors makes the measurements in-dependent of unwanted climate changes and facilitates the repetitiveness of the experiments.
3.2.2 Measurements of irradianceHemispherical and diffuse solar irradiance has been measured with two pyranometers, including a shading ring on the pyranometer measuring diffuse irradiance. The direct irradiance was calculated from these data. The pyranometers were calibrated based on two new and calibrated pyranometers. Basically, the same techniques were used during indoor and outdoor measurements. During the measurements the pyranometers were placed in the collector plane. For indoor measurements a second pyranometer was placed directly in front of the simulator measuring the hemispherical irradiance. As the diffuse irradiance is very low this gives mainly the direct irradiance.

Solar thermal energy systems for building integration
62
Photodiode arrayAn alternative way of measuring the irradiance during indoor measure-ments has been developed in order to compensate for the slightly non-uniform light distribution from the solar simulator. This method is based on using an array consisting of six photodiodes connected in parallel. It was placed on the glazed surface of the collectors during the measurement. The placing of the photodiodes divides the front area of the solar collector into smaller areas of approximately equal size with one photodiode placed in the centre of each area. With this arrangement, the average current from the photodiode array should be a relatively good representation of the average irradiance on the collector surface. The spectrum of the silicon photodiodes (S1337-66BR) is between 300-1100 nm, with the peak at 950 nm.
3.2.3 The solar collector test rigA rig for testing solar collectors has been designed and built within the project. The rig facilitates both stationary and dynamic collector testing with good reproducibility of the measurements. The system components are set up as shown in Figures 3.12 and 3.13.
Figure 3.12 The solar collector test rig.

Measurement techniques
63
Figure 3.13 The test rig for solar collectors includes a heat exchanger for cooling, an electric heater, a buffer tank, expansion vessel, a fl ow meter, pumps and control units including a MELACS logger. A motorized valve is used for the control of the cooling circuit.
The main purpose of the system design is to provide good temperature control. The temperature to the solar collector should be kept as constant as possible during measurements. The rig is also constructed so that it is easy to connect different solar collectors to the inlet and outlet pipes.
A heat exchanger for cooling the hot water from the collector outlet is connected to the rig. A motor driven valve controls the fl ow of cold water to the heat exchanger, which has been fi tted with two water hoses (the inlet is from the tap to the heat exchanger and the outlet is connected to the fl oor drain). After the water has passed the cooler, it is passed through a 9 kW electric heater, where the temperature can be further adjusted. An air vent is also connected to the heater as this is the highest point of the water fl ow in the test rig. The temperature sensor controlling the cooling and heating of the water is placed after the heater, just before the buffer tank of 8 litres. The purpose of using a tank is to mix the water and add an extra thermal capacitance to keep the inlet temperature to the collector constant. An inductive fl ow meter with a fl ow rate display for manual fl ow adjustments is placed on the test rig, just before the outlet to the collector. The rig is also equipped with two circulation pumps, an expansion ves-sel, a pressure safety valve and a temperature control sensor of microchip
HEX
Expansion vessel
Flowmeter
Control unit
Electrical heater (9 kW)
Buffer tank (8 l)
Pump
Pump
Temp.Sensor
Voltage supply
To collectors
From collectors
Cooling outlet
Cooling inlet
Air vent
Flowdisplay
Motorized valve
Pressure gaugeOutlet
Refilling
MELACS
Manual flowregulator
Safety valve

Solar thermal energy systems for building integration
64
type (LM35). A three-phase 400V AC voltage is connected to the voltage supply. The test rig is designed for a pressure of 1.5 bar.
Two control units are placed on the test rig, see Figure 3.14. The MELACS (the Micro Energy Logger And Control System) control unit contains the main control functions - the processor, a multiplexer, an AD-converter etc. The left control unit receives the information from the MELACS to manage the control of the motorized valve, the electric heater and the pumps. It contains three drive units for each of the three phases of the 400V AC voltage, an I/O module that controls the pumps and two voltage buffer circuits that control the motorized valve and the heater. Three-phase voltage is delivered from this unit to the pumps and to the electric heater.
Figure 3.14 The control board for the cooling and heating applications is at the left in the picture and the smaller MELACS microcontroller is shown at the right.
The control system MELACS is a microcomputer system including a data logger with an independent battery backup system. The MELACS, which can operate independently of the PC, uses the Basic Stamp micro-computer from Parallax and is programmed in picbasic. The MELACS Microcontroller is developed by Stefan Larsson at the Älvkarleby labora-tory (Larsson, 2006).

Measurement techniques
65
3.2.4 Temperature measurementsThe stability of the inlet temperature to the solar collector must be very high if disturbances from the collector thermal capacitance to the meas-ured thermal output and effi ciency are to be eliminated. This is even more important since most of the evaluated collectors are small prototypes, which require relatively low fl ow rates. Copper/Constantan thermocou-ples, Pt 100 sensors, a thermopile and temperature sensor of microchip type (LM35) have been used for measuring temperature during different measurements. Two methods that have been used to achieve higher accu-racy in the measurements of the critical temperature difference, Tout-Tin, are described below.
Resistance bridge measurements Low temperature differences can be very diffi cult to measure accurately. At high incidence angles the temperature difference is often very small. An error of less than 0.1 K is desirable. In order to measure the low temperature difference between the inlet (Tin) and the outlet (Tout) of a solar collector, a resistance bridge was set up, according to the illustration in Figure 3.15. A voltage is given over C and D. The resistances R1 and R2 are equal (and in the range of 2.4 kΩ when Uin= 5V) and the two Pt 100 temperature sensors must be calibrated to give equal resistance for various temperatures. The difference in voltage is measured over A and B. As long as the temperatures of the two Pt 100 sensors are equal, there is no voltage difference between A and B. As these Platinum sensors show extremely linear temperature dependence (they give a resistance of 100 Ω at 0°C) a change in Tout alters the resistance R3 proportionally and changes the voltage potential at point A (and vice versa for Tin and point B), which gives the difference in voltage potential over A and B. This way the temperature difference between the Pt 100 sensors is represented by the output signal from the voltage meter. A trim potentiometer is used to balance the resistances before the measurement in case the resistances of the Pt 100 sensors R3 and R4 are not exactly equal at 0ºC. (The meth-odology is further described by Frank (1959) and Doebelin (1990)). The two Pt 100 sensors used for a bridge measurement were calibrated in a calorimeter bath between 20°C and 60°C. The zero temperature deviation after 24 hours was 0.0006 °C.

Solar thermal energy systems for building integration
66
B
Vin
C
VbOut signal
R4
Pt 100 (Tin)
R2R1
R3
Pt 100 (Tout)
0 Volt
Trimpotentiometer, R
A
D
Figure 3.15 The resistance bridge set up to measure the temperature difference between two Pt 100 sensors.
Temperature difference from thermopilesAnother way to achieve good accuracy of the measured data when the temperature difference between the inlet and outlet of the collector is low is to use a thermopile, which gives good relative accuracy (shown in Figure 3.16). In some of the measurements a thermocouple was placed in the inlet and thermopiles were mounted at the inlet and outlet, measuring the temperature difference between the inlet and the outlet. The outlet temperature was then calculated from these two registered values.

Measurement techniques
67
Figure 3.16 The thermopile used for measurements of the temperature difference (Tout-Tin) of solar collectors. The thermopile is protected from the fl uid with a thin silicon rubber hose.
Absolute temperature In order to get an accurate value of the inlet temperature of the collector, the absolute temperature was measured with a Pt 100 sensor that was set up according to the illustration in Figure 3.17.
Prec. 100 Ω
AG
V1
V0
Pt 100
10 kΩ
Exitation 2.2 V
Figure 3.17 The four-wire measurement set up for measurements of the absolute temperature using a Pt 100 temperature sensor.

Solar thermal energy systems for building integration
68
An excitation voltage of 2.2 V is given to the resistor of 10 kΩ. The use of this very large resistance reduces the infl uence of the Pt 100 sensor´s resistance on the current, which becomes very low. The low current means that errors due to internal heating are avoided. The resistance of the Pt 100 sensor is 100 Ω at 0°C and increases as temperature rises above 0°C, as shown in Equation 50. A precision resistor of 100 Ω is also connected to the circuit and to ground. The current can thereby be calculated by Equation 51. T is here measured in °C.
TRPt100 ⋅+= 385.0100 Eq. (50)
TI
⋅+++=
385.010010010000
2.2 Eq. (51)
The voltages over the Pt 100 resistor and the 100 Ω precision resistor are measured and the relation between them equals the relation of their resist-ances, which means that the temperature is given by Equation 52.
100
385.0100
.
100
.
100 TRI
RI
V
V
prec
Pt
prec
Pt ⋅+=
⋅⋅
= Eq. (52)
3.2.5 Flow rateInductive fl ow meters from Enermet/Kamstrup MP115 have been used for all measurements. These fl ow sensors give a high pulse frequency already at low fl ow rates and therefore a high resolution in the data.
3.2.6 Data logger systemA logger CR10X from Campbell has been used in all measurements in combination with the software PC208W. The accurate logger measure-ment sampling interval is 10 seconds. Two minute averages are stored in the logger.

Measurement techniques
69
3.3 Computer programs
3.3.1 The MINSUN simulation toolMINSUN is a simulation tool for calculation of the solar irradiation on surfaces and the energy output from solar collectors (Adsten, 2002; Chant and Håkansson, 1985; Perers, 1993; Perers and Karlsson, 1993). It is spe-cially developed for simulating solar collectors with a complicated angular dependence. The program considers the characteristic parameters of solar collectors and the longitudinal and transverse incidence angle dependence can be included as input data, which makes it suitable for simulations of concentrating collectors.
The program uses climate data for a typical reference year of the Stock-holm climate from 1983 to 1992, provided by the Swedish Meteorological and Hydrological Institute Stockholm (SMHI). MINSUN calculates the monthly and annual irradiation on any given surface. It also gives the energy output of the solar collector in question in kWh/m2 per month and year.
Hourly climate data of direct and diffuse irradiation is used to calculate the total annual irradiation on a specifi ed surface. The total absorbed ir-radiance, S, is obtained by multiplying the direct and diffuse irradiance by incidence angle modifi ers for beam and diffuse irradiance. MINSUN can calculate the incidence angle modifi er for direct irradiance as a product of the functions RT(θT) and f(θ). The optical losses (τα)n are here included in the expression RT(θT). The functions are given numerically at angular intervals of 5°. The incidence angle modifi er for diffuse irradiance, Kd, is given as a constant value or obtained by integrating RT(θT) fL(θ) over an isotropic sky. This means that Equation 53 gives the useful irradiance S on the cell. For concentrating collectors this expression is then multiplied by the concentration ratio, C.
Eq. (53)
The function RT , which represents the angular dependence of the refl ector, is obtained from measurements of the optical effi ciency in the transverse plane with θL=0. The function fL , which represents the angular depend-ence of the glazing, is obtained from measurements of the optical effi ciency in a plane where θL is constant. This means that fL can be conveniently modelled as a conventional Kb function (Equation 17).
S (θT ,θL) = (RT(θT) fL(θ) Ib +KdId)

Solar thermal energy systems for building integration
70
3.3.2 WINSUNWINSUN is a simulation program based on TRNSYS/TRNSED/PRESIM that calculates the theoretical monthly and annual energy output from solar collectors using a dynamic collector model. Synthetic weather data based on long-term average data is used in the program. The collector performance parameters, the orientation of the collectors etc. are used as input data. The monthly average operating temperatures of the collector throughout the year can also be used. The energy output for the period is returned as monthly and annual values.
TRNSYS, the basis of the program, is a dynamic systems simulation tool where complex energy systems can be set up and simulated. TRN-SYS is used internationally by researchers within several different fi elds of work.
3.3.3 PolysunPolysun 3.3 is a simulation program for solar thermal energy systems developed by Institut für Solartechnik, SPF, in Rapperswil, Switzerland (Polysun, 2002). There are eight main types of solar system designs to choose from, including hot water systems and systems including space heating. The program uses climate data from Meteonorm 95, which is available from locations all over Europe and for a few other locations as well. It is possible to vary a number of parameters from pipe dimensions, hot water consumption (including circulation and habits of energy use), heat exchanger parameters, pump characteristics, tank dimensions for a tank with 12 layers (for which the heat transfer and mixing by temperature inversion are considered), furnace dimensions, features of the control sys-tems etc. The program holds a library of solar collectors that are available on the market, which can be used in the simulations, and it is possible to insert own collector characteristics (for symmetric collectors). The heat demand of the building can be calculated roughly by the program from choices of the construction type of the building, the indoor and design temperatures and the temperatures at the inlet and outlet of the radiant heating system. However, when Polysun was used in this work it was adapted to use Excel input fi les containing hourly data for a year of the heat demand of the building and of the outdoor temperature. Output fi les from DEROB-LTH containing these data were then used to simulate the energy demand of very specifi cally defi ned building constructions.
Polysun 3.3 is a convenient tool as it has a user-friendly graphical in-terface and short calculation time. The results given by Polysun are energy balances for the entire system and also for the tank and the collector loop

Measurement techniques
71
separately. These data are available as annual or monthly values for the period of one year. Also time related graphs of different temperatures and powers are shown, which makes it possible to estimate whether or not the system will reach stagnation.

Solar thermal energy systems for building integration
72

Solar thermal systems i high performance houses
73
4 Solar thermal systems in high performance houses
4.1 IntroductionThis chapter presents the work performed by the author for the Interna-tional Energy Agency, IEA, Task 28 – Sustainable Solar Housing. The work is also presented in the handbook of Task 28, “Sustainable Solar Housing, Vol 1: Strategies and solutions” (Hastings & Wall, 2007). The objective of Task 28 has been to spread information about energy effective housing design. The buildings presented in the book are designed with the focus on minimising energy use by constructing the building envelope for very low transmission losses, using effi cient mechanical systems and heat re-covery systems and fi nally by using renewable energy to cover the small remaining energy demand. The main objective of the handbook is to give inspiration and guidance to architects, constructors, consultants and students in these fi elds, with the hope that it will help to turn the trends in the building sector towards lower energy use, particularly lower use of energy from fossil fuels.
Here presented are the contents of the author’s work within Task 28, also presented in the following sections in Sustainable Solar Housing, Vol 1: Strategies and Solutions.
- Section 2.5. Using active solar energy (Gajbert, 2007). A presentation of different aspects of solar thermal energy use in high performance build-ings. Here presented in Section 4.2.
- Section 8.6 Apartment Building in the Cold Climate, Conservation Strategy (Smeds & Gajbert, 2007). Simulations of the solar thermal domestic hot water system for an extremely well insulated building were performed by the author. Here presented in Section 4.3.3.
- Section 8.7 Apartment building in the cold climate, Renewable energy strategy (Gajbert & Smeds, 2007). A design solution of a solar thermal

Solar thermal energy systems for building integration
74
system for a high performance building is presented as well as a parametric study of several features of the system. Here presented in Sections 4.3.4 and 4.3.5.
In order to put the separate chapters into context for the reader, some brief summaries of other parts of the handbook are also included, such as the design and the energy demand of the reference apartment building for the cold climate, which was designed within the project. The other building solutions discussed here were designed by Johan Smeds.
4.2 Active use of solar thermal energyFrom Section 2.5 in Sustainable Solar Housing, Vol 1, Strategies and Solu-tions
Heat captured by an active solar heating system can cover a signifi cant part of the energy demand of high-performance (h.p.) houses, i.e. buildings with very low energy demand. Because the space heating demand of such buildings is very low, the year-round energy demand for domestic hot water (DHW) becomes relatively important. An active solar system can cover a large part of this energy demand, often more than 50%, since the demand also occurs in summer. The question is whether or not to design the solar system as a combi system that also contributes to the space heat-ing, which means that a water-based heat distribution system is required. A key issue then is estimating the space heating contribution realistically, given the shorter heating period of high performance housing.
4.2.1 Solar thermal system designsIf a water-based heating system is preferred, a solar combi system is a good option. It provides fl exibility to the heating system as it is built up around a joint storage tank, serving both the DHW and space heating systems and it can be heated by both the solar collectors and auxiliary energy sources connected to the tank, depending on conditions. There are many interesting combi system designs on the market, varying by region and the locally used auxiliary energy sources (Weiss, 2003). The system illustrated in Figure 4.1 uses a wood pellet boiler and an electric resistance heater as auxiliary energy sources to back up the solar circuit. The tank is equipped with a device to enhance thermal stratifi cation. The domestic hot water is heated by an external heat exchanger.

Solar thermal systems i high performance houses
75
Figure 4.1 A solar combi system with a joint storage tank for the DHW and space heating systems.
A critical design condition for solar thermal systems is the case of minimum heat demand and maximum solar gains, as often occurs in summer. To minimize the system overheating in such instances the solar system should be designed to just cover the summer energy demand, accepting a small solar coverage in winter. An important advantage is that the combustion backup heating can be shut down during the summer. Thereby, short cycling of the backup system in summer can be eliminated, increasing the life expectancy of the system.
The shorter heating season of a high performance building results in a more pronounced seasonal mismatch between solar gains and space heat-ing demand than is the case for conventional houses. This is illustrated in Figure 4.2, which shows a typical picture of the energy demand of a high performance house and a standard house in a cold (Stockholm) climate. The DHW demand is here assumed constant over the year although it is often slightly lower in summer, e.g. due to vacations.
As shown by the fi gure, it is often only a small part of the heating demand of h.p. houses that can be supplied directly by solar energy from a solar thermal system as the small solar gains during the heating season are also needed for hot water production. As it is not only the heating demand but also the peak power requirement of h.p. houses that is very low, it might be suffi cient to heat the house simply by an electric heater or a water-to-air heat exchanger of low power in the supply air duct. An expensive water-based radiant heating system can then be avoided. A solar

Solar thermal energy systems for building integration
76
thermal system would then be suitable for heating the hot water. It could also be connected to a heat exchanger for supply air.
Jan Feb Mar Apr May Jun Jul Aug Sep Oct Nov Dec
Ene
rgy
dem
and
and
sola
r ga
ins
(kW
h/m
onth
)
Total energy demand (DHW+ space heat) for a standard house
Domestic hot water energy demand
Solar gains (for smaller and larger collector areas)
Total energy demand (DHW+ space heat) for a high performance house
Figure 4.2 Seasonal variations in solar gains and space heating demand in standard housing versus high performance housing.
Because of the seasonal mismatch between solar gains and heating demand, it is common to over dimension the solar collectors used in combi systems to increase the solar gains in the heating season. This means that the col-lectors risk being overheated. This can be avoided by installing a larger storage tank than the system design would otherwise require. However, this approach is expensive, takes up more space and leads to higher tank heat losses.
There are also good control solutions available, for example the use of partial evaporation to empty the collector during stagnation. Active removal of energy transported via the steam during stagnation is also pos-sible with a small-volume heat sink. Alternatively, the tank can be cooled down by circulating the heat transfer medium through the collectors at night or by using an air cooler. (Weiss, 2003; Hausner and Fink, 2002). However, the more cautious design strategy is not to over dimension the collector area.
An advantage of a combi system is that during the heating season, when energy for space heating is withdrawn from the tank, the operating temperature in the collectors can be lowered, increasing the collector ef-fi ciency. This typically occurs in autumn and spring.
This gain in effi ciency can be maximized if the system includes an option to deliver solar energy directly to low temperature surface heat-ing, e.g. fl oor heating. When there is a heating demand and the collector

Solar thermal systems i high performance houses
77
temperature is suffi cient, as often in spring or autumn, the fl ow from the collectors can be directed to the low temperature surface heating system, which means that the collectors can be operated at low temperature and thus be more effi cient. This requires a good control strategy. Figure 4.3 shows an example of the design of such systems, which are common in France, Denmark and Germany (Weiss, 2003).
Figure 4.3 A solar combi system with the option to deliver solar heat directly to the heating system without passing through the tank fi rst.
One way to better balance the solar gains against the heating demand is to mount the collectors vertically on the façade or to mount them with a high tilt. This positioning makes better use of low winter sun angles and suppresses summer overheating. This results in a more even distribution of the solar gains over the year, but a larger collector area is required to cover the summer domestic hot water demand. Figure 4.4 shows how the solar fraction (the part of the heating demand which is supplied by solar energy) increases with increased collector area for collectors tilted 40° and 90°. It shows that with a vertical collector the solar fraction can be increased if the collector area is increased. However, a larger collector will be necessary in order to get the same solar fraction as with a 40º tilted collector.

Solar thermal energy systems for building integration
78
0 .0
5 .0
1 0 .0
1 5 .0
2 0 .0
2 5 .0
3 0 .0
3 5 .0
4 0 .0
4 5 .0
5 7 .5 1 0 1 2 .5 1 5
Collector area (m 2)
Solar
frac
tion (
%)
40º t ilt90º t ilt
Figure 4.4 Effect of collector tilt and area on solar fraction. Results from Polysun simulations of a combi system for a single family house in the cold climate. (T. Boström).
A larger collector area is possible without risking overheating if the col-lector tilt angle is increased in relation to the optimal tilt angle, which approximately lies between 35° in southern latitudes (latitudes around 45°) and 45° in northern latitudes (latitudes around 60°). The suitable collector area and collector tilt angle are further discussed in Section 4.3.5.
Where buildings are closely spaced, a micro heating grid with a central solar system may be plausible. Collectors on the buildings can then share a large, semi-seasonal solar storage tank enabling some summer solar gain excess to be stored for the autumn. The large tank volume has an advan-tageous surface to volume ratio reducing tank heat loss. Also, a shared system can even out peak demands or supply excesses, resulting from the inhabitants’ different habits of energy use. Disadvantages are the relatively high heat losses of the pipe network relative to the very small space heating demand, and the investment and administrative costs for meeting such a small demand. Such micro heat distribution grids for row-houses have proven effective in demonstration projects in Germany (Russ, 2005).
4.2.2 Collector typesThere are many reliable and effi cient collectors of different types on the market today:
Flat plate collectors have been highly optimized with selective coated absorbers, low-iron, anti-refl ective coated glazing, durable frames and gaskets and effective back insulation.

Solar thermal systems i high performance houses
79
Evacuated tube collectors, with their extremely good insulation, can operate at higher temperatures with only very small heat losses. Because the losses are so small, evacuated tube collectors can deliver heat even at very low irradiance levels occurring in winter and during overcast periods. They are thus very suitable for high performance houses with their short-ened heating season. The individual tubes can be rotated to an optimal absorber tilt angle, allowing great fl exibility in their placing. However, the separation between tubes must avoid one shadowing the next. Heat pipe collectors need to be mounted with a slight tilt to allow for gravity fl ow. A critical issue is snow retention on the tubes. A façade-mounted system minimizes this problem (Kovacs and Pettersson, 2002).
Concentrating collectors can also be envisioned, though such systems are not commercially available for housing. Prototype systems have been built and tested e.g. in Sweden, Great Britain and Australia. A low-cost refl ector increases the irradiance on the absorber. The system geometry can be optimized for spring and autumn solar angles. While this suppresses the summer performance, the solar gains are better balanced against the heating demand over the year. Using an evacuated tube collector as the target of the refl ector is a promising solution.
Solar air collectors, while interesting for conventional buildings or renovations, are diffi cult to justify economically for high performance houses. The heat exchanger of the ventilation system competes with the solar air collectors. One system or the other must operate with decreased effi ciency. A plausible confi guration would be an entire roof slope covered with a low cost, sheet-metal, solar air collector. During summer an air-to-water heat exchanger should easily cover all or most of the energy demand for water heating. In the autumn and spring the system could supply much of the space heating. Precast hollow-core concrete fl oor planks or large core masonry walls can also serve for heat storage and distribution (Morhenne, 2000).
4.2.3 Tank locationThe tank location is an important design decision. On the one hand, it is sensible to locate it inside the insulated envelope of the building. Heat losses from even a very well insulated tank are therefore not lost to the ambient air but remain within the building (though this is a disadvantage in summer). Short pipe runs keep circulation heat losses small. A good location for the tank could be in or next to the bathroom. The warm tank surface improves the comfort in the bathroom. Comfort here is critical, because this is often where exhaust air for the whole living space is ex-tracted, and the occupant may feel cold after showering. Also, the pipe run

Solar thermal energy systems for building integration
80
is minimized between the tank and one of the largest points of demand. This decreases pipe heat losses and offers the convenience of hot water being quickly available at the tap. An upper fl oor bathroom is ideal, as the pipe run to roof collectors is also minimized. However, the insulated building interior is a very expensive volume to sacrifi ce for a tank, so the basement may be the preferred location. This otherwise cold space can then be slightly heated, improving comfort for the many uses found for a basement. Pipe runs from the tank should be within the heated building envelope as much as possible.
4.2.4 Regional design differencesIt is easiest to market a solar combi system in regions where home owners prefer hot water radiant heating, particularly low temperature systems. Regions where oil or wood pellet heating is preferred have proved to be good markets for combi systems, often even large systems. Solar combi systems have been widely sold in Germany, Austria, Switzerland, Sweden, Denmark and Norway. It seems more diffi cult to market combi systems in regions where mainly direct electricity or gas is used for heating, in the Netherlands for example (Weiss, 2003).
In warmer climates, the space heating demand of h.p. houses is even lower but the solar energy can also be used a little bit longer in spring and autumn, as the general illustration in Figure 4.5 shows.
Solar gains
Space heatingDHW
Cold climate Mild climate
Figure 4.5 The general differences between colder and milder climates; the solar gains are better balanced against the space heating demand in the milder climate.

Solar thermal systems i high performance houses
81
4.3 Design of solar heating systems
4.3.1 Introduction
The work within Task 28 - Subtask B Within the framework of IEA, Task 28, subtask B, high performance houses have been designed and analysed. The results of all the buildings are presented in the handbook.
Designs of three house types - single family houses, row houses and apartment buildings - in three different climates - “the cold climate” (Stockholm), “the temperate climate” (Zurich) and “the mild climate” (Milan) - have been investigated. Reference buildings with standard in-sulation quality were set up for each of the nine building types. Targets to meet were set up after thorough discussions and investigations. Thereafter the design process of the high performance houses for the different cases began. (Wall, 2007)
The applied design approaches - energy conservation and renewable energy supplyA general advice for building designers who want to reduce the energy demand of a building is to start by designing a well insulated building envelope and to ensure good heat recovery systems, so that the heating demand of the building is reduced as much as possible, and secondly to ensure that renewable energy is used for the remaining energy supply. As there may be limitations of different kinds, e.g. in the budget for the building materials or the heating systems, the feasibility of grid connection etc., it is useful to know how the use of primary energy can be reduced to a low level in different cases. Therefore two design approaches are differentiated and applied in this work - the conservation strategy and the renewable energy strategy.
When the conservation strategy is applied, the main focus is to reduce the thermal losses from the building by investing most resources in the building envelope. Thick insulation, building materials with low thermal conductivity, low-e-coated windows and effi cient heat recovery systems are used, all in order to reduce the energy demand. Another means of reduc-ing the energy demand is to choose low-consuming household appliances. With these measures, large energy savings can be accomplished, without reducing comfort or quality.
When the renewable energy strategy is applied, the focus is set on supplying the required energy with renewable energy, here with the focus on solar thermal energy and bio fuel, which lowers the non-renewable

Solar thermal energy systems for building integration
82
primary energy demand signifi cantly. In comparison with the conservation strategy, a slightly lower insulation level of the building envelope may be acceptable, as the target of non-renewable primary energy use (discussed below) can still be reached.
The targets to meetTwo targets were set for the buildings before the design process. The main target is that the annual use of non-renewable primary energy for space heating and hot water production and the electricity for mechanical systems must not exceed 60 kWh/m2a. Targets for the maximum space heating demand were then set up and different buildings were designed to meet these targets. For the conservation strategy the maximum space heating demand is 15 kWh/m2a. However, an extremely well insulated apartment building requiring only 6 kWh/m2a is also designed for the cold climate. For the renewable energy strategy, the maximum space heating demand was set higher, to 20 kWh/m2a.
The author’s assignmentsThe author was assigned to work on the design of the solar heating systems for two apartment buildings in the cold (Stockholm) climate, one for the conservation strategy and one for the renewable energy strategy. These building constructions (including mechanical ventilation systems) had previously been designed by Johan Smeds, using the simulation program DEROB-LTH (Kvist, 2005). The results of space heating demand from these simulations were used by the author in the simulations of the solar thermal heating system, using Polysun 3.3 (Polysun, 2002), which had been slightly adapted so that output data of space heating demand from DEROB-LTH could be used as input data. Hourly Stockholm climate data from Meteonorm (Meteotest, 2004) were used for both the Polysun and the DEROB-LTH simulations. For general assumptions and parameters used in the DEROB-LTH and Polysun simulations, see Appendix B.
Most of the simulation work performed by the author was carried out for the design of a solar combi system for the building in Solution 2, the renewable energy strategy. A sensitivity analysis of different parameters of the solar system, such as the type, size and orientation of the collectors, the tank size, fl ow rates etc., was performed for this system. A solar ther-mal hot water system was also designed for the extremely well insulated building in Solution 1a.
Defi nitions and design assumptionsAll the buildings presented in this chapter have the same basic structure based on reinforced concrete and wooden frame facades with mineral

Solar thermal systems i high performance houses
83
wool. It is mainly the insulation thickness that is varied. The apartment buildings were all designed with a fl oor area of 1600 m2, which is divided into 16 apartments of 100 m2 each. The average number of occupants in each apartment is 3 people (two adults and one child). The domestic hot water demand is assumed to be 40 litres per day and person.
The energy terms presented in the result tables are defi ned as follows: The net energy is the energy required for services such as maintaining
the building at the specifi ed internal temperature, lighting or ventilating a space etc. Internal gains from inhabitants, electric appliances and circu-lation losses were taken into account in the simulations of space heating demand in DEROB-LTH. The presented fi gure of space heating demand is thus the remaining heating demand. The tank losses and losses from the collector loop on the other hand have not been considered as internal gains since the tank and boiler are assumed to be placed in the basement outside the thermal envelope of the building.
The total energy use of the building includes the net energy and the system heat losses. It can also be described as the sum of the delivered energy and the energy produced and used on site, including renewable forms, but excluding passive gains. Energy delivered back to the market is not included.
The delivered energy is the energy supplied to the building from the last market agent.
Both the emissions of CO2 equivalents and the non-renewable primary energy use are directly related to the total energy use. Primary energy is the energy used on site, for which losses from the extraction, distribution and conversion to heat are taken into account. The presented results of non-renewable primary energy include only the share of the primary en-ergy that is based on non-renewable energy sources. Energy required for space heating, water heating and for the mechanical systems is included. Circulation heat losses and losses from the boiler are also included. The conversion losses of an electric heater in the tank are assumed to be zero. (Petersdorf & Primas, 2007)
The conversion factors to calculate the primary energy and the CO2 equivalents from different energy sources were set up by a group within the project which has studied LCA reports agreement. The factors used are based on the GEMIS tool (GEMIS, 2004) where average values for 17 European countries are used. These factors are related to the lower heating value (LHV) for which condensation energy is not included. This means that the theoretical effi ciency of a heating system with a condensing gas furnace can be higher than 100%. However, the effi ciencies set here are 100% for a gas furnace, 98% for an oil furnace and 85 % for a pellet boiler. The factor used for calculating the non-renewable primary energy is 2.35

Solar thermal energy systems for building integration
84
for electricity and 0.14 for bio pellets (Petersdorf & Primas, 2007). These conversion factors are also presented in Appendix B.III.
4.3.2 The cold climate apartment reference buildingThe reference apartment building for the cold Stockholm climate has reinforced concrete structure and wooden frame facades with mineral wool, as the other apartment buildings designed for the cold climate. Air-fi lled triple glazed windows with a frame ratio of 30% are used and the U-value of the whole building envelope is 0.35. There is no heat recovery in the exhaust air ventilation system, which provides 0.5 ach (air changes per hour). District heating is used for heating DHW and space heating. (Smeds, 2007)
Calculations of the space heating demand of the reference house were performed using the Bilanz program and according to EN832 (Heidt, 1999). The annual space heating demand is 70000 kWh/a or 44 kWh/m2a and the maximum power requirement is 46 kW or 29 W/m2. The total energy use (for space heating, DHW, system losses and mechanical systems) is 81 kWh/m2a. The use of non-renewable primary energy is 70 kWh/m2a (112600 kWh/a) and the corresponding emissions of CO2 equivalents are 20 kg/m2a. (Smeds, 2007)
4.3.3 Design solution 1a – Conservation strategy: A solar DHW system for an extremely well insulated building
From Section 8.6 in Sustainable Solar Housing, Vol 1, Strategies and Solu-tions.
A solar domestic hot water system was designed for an extremely well insulated apartment building in the cold climate. This building has a space heating demand of only 6.5 kWh/m2a, which is even lower than the target of the conservation strategy, and the peak power for space heat-ing is limited to 10 W/m². The energy for space heating is supplied by electric resistance heating.
The building design A similar building but with extremely high insulation level was also de-signed for the project. The U-value of the whole building envelope is only 0.21 (to be compared with 0.41 for the building of the renewable energy strategy). The U-value of the windows is 0.92 for frame and glass. The

Solar thermal systems i high performance houses
85
windows have a frame ratio of 30%, triple glazing, one low-e coating and they are fi lled with krypton. The U-value of the walls is 0.13, the roof, 0.09 and the fl oor, 0.12 (excluding ground). More detailed U-values and construction data are shown in Appendix B.I.I. Also for this building, a balanced mechanical ventilation system with 80% heat recovery and a bypass for summer ventilation is used. The only heat distribution system is the supply air duct, where electric heating is installed.
Solar thermal system design A solar domestic hot water system is designed for this building. The solar system consists of 60 m² collectors, a storage tank of 6 m³ and an electric heater of 8 kW in the tank. The collector is an advanced fl at plate collector and the same collector parameters as in Solution 2 are used (see Table 4.4 – collector no 3.) The heat from the solar circuit is delivered to the storage tank via an external heat exchanger. A stratifi cation device is placed in the tank to improve stratifi cation. The hot water is taken directly from the top of the tank and a three-way-valve is used to mix it with cold water. Daily peaks in hot water consumption are taken into consideration.
Energy PerformanceThe space heating demand of this building is 10300 kWh/a (6.5 kWh/m²a) according to simulation results from DEROB-LTH. The space heating demand for each month of the year is shown in Figure 4.6. The highest heat load occurs in January and is 16 kW (10 W/m²). The net heat demand for domestic hot water is approximately 37800 kWh/a (23.6 kWh/m²a) which means that the DHW demand is much larger than the space heating demand.
0
2000
4000
6000
8000
10000
12000
14000
16000
18000
Janu
ary
Febr
uary
Mar
ch
Apr
il
May
June
July
Aug
ust
Sept
embe
r
Oct
ober
Nov
embe
r
Dec
embe
r
Spac
e he
atin
g de
man
d (k
Wh/
mon
th)
solution 1a reference case
Figure 4.6 Monthly values of the space heating demand for the building of

Solar thermal energy systems for building integration
86
solution 1a and of the reference building.The total energy use for DHW and space heating, system losses and mechanical systems is 63200 kWh/a (39.5 kWh/m2a). The system losses consist mainly of losses from the hot water storage tank (1.5 kWh/m²a), but also of pipe heat losses in the distribution system. After taking the solar contribution for DHW into account the delivered energy is 34200 kWh/a (21.4 kWh/m2a), which is provided by electricity. This results in a total use of non-renewable primary energy of 80300 kWh/a (55 kWh/m²a) and CO2 equivalent emissions of 10 kg/m²a, see Table 4.1.
Table 4.1 Total energy demand, non-renewable primary energy demand and CO2 equivalent emissions for the apartment building with electric resistance space heating and solar DHW system with electrical backup. The energy terms are defi ned in 4.3.1.
facto r ( - ) (kW h/m ²a) facto r
(kg /kW h) (kg /m ²a)
M echan ica l sys tem s 5.0 M echan ica l
sys tem s 5.0 E lec tric ity 5 .0 E lec tric ity 5 .0 2 .35 11.8 0 .43 2.2
S pace heating 6 .5 S pace
heating 6 .5 E lec tric ity 6 .5
C onvers ion losses 0.0
T ota l 35.1 40.6 40.6 23.3 54.8 10.0
N on renew ab le p rim ary energy
C O 2 equ ivalen t em issions
E lec tric ity 11 .82 .35 43.0 0 .43 7.9
N et E nergy (kW h/m ²a)
T o ta l E nergy U se (kW h/m ²a) D elivered energy
(kW h/m ²a)
E lec tric ity 18 .3
Energy use E nergy source
D H W 23.6 D H W 23.6
T ank and c ircu la tion losses
5.5
S o lar 17 .3
4.3.4 Design solution 2 - Renewable energy strategy: A solar thermal system for DHW and space heating,
From Section 8.7 in Sustainable Solar Housing, Vol 1, Strategies and Solu-tions.
This section presents a design solution of an apartment building in the cold climate (Stockholm) and the solar and bio fuel based heating system designed for this building. The solution is based on the renewable energy strategy, for which the maximum space heating demand of the building was 20 kWh/m2a. The use of renewable energy should make it possible to reach the target of non-renewable energy use of 60 kWh/m2a. For this solution a solar combi system with a bio fuel boiler is used for the thermal energy supply of both DHW and space heating. The design of

Solar thermal systems i high performance houses
87
the solar thermal heating system was performed primarily with regard to low auxiliary energy use in summer, avoidance of overheating and economic aspects.
The building design
This apartment building is similar to the reference building, with reinforced concrete structure and wooden frame facades with mineral wool. The U-value of the whole building envelope is 0.41, which is even higher than the reference building. However, the building has a balanced mechanical ventilation system with heat recovery of 80%, which reduces the ventilation losses, and a bypass for summer ventilation is installed. The ventilation rate is 0.45 ach and the infi ltration rate is 0.05. The double glazed windows, with U-value of 1.34 for frame and glass, have a frame ratio of 30%, one low-e coating and are fi lled with air. The U-value of the walls is 0.27, the roof, 0.29 and the fl oor, 0.30 (excluding ground). The heating set point is 20ºC, the maximum room temperatures: 23°C during winter and 26°C during summer (assumes use of shading devices and window ventilation) (See more details in Appendix B.I.III).
The solar and bio fuel heating system
A solar combi system is designed for this building, i.e. a solar thermal sys-tem where the space heating system and the domestic hot water (DHW) system are combined, here by a joint storage tank, to which both solar collectors and auxiliary energy sources are connected. The solar thermal heating system consists of 50 m² collectors placed on a south-facing roof, tilted 40°. The collector is an advanced fl at plate collector. (The collector parameters are shown in Table 4.4, for collector number 3.) The storage tank is 4 m³, there is a 35 kW pellet boiler and an electric heater of 5 kW connected to the tank for increased operational fl exibility. The heat from the collector circuit is delivered to the tank via an external heat exchanger coupled to a stratifying device, which improves the important thermal stratifi cation in the tank. Another external heat exchanger is used for heat-ing the DHW, taking water from the top of the tank and returning it at the bottom. The heat transfer medium in the collector circuit is a mixture of 50% water and 50% glycol. Water from the tank is used for the radiant heating system in the building. The system is illustrated in Figure 4.7.
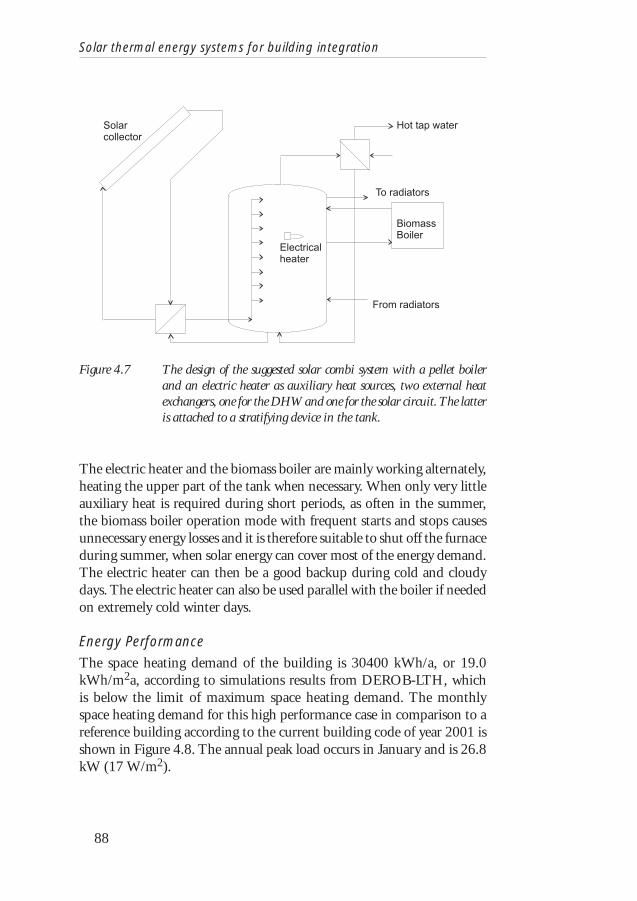
Solar thermal energy systems for building integration
88
Figure 4.7 The design of the suggested solar combi system with a pellet boiler and an electric heater as auxiliary heat sources, two external heat exchangers, one for the DHW and one for the solar circuit. The latter is attached to a stratifying device in the tank.
The electric heater and the biomass boiler are mainly working alternately, heating the upper part of the tank when necessary. When only very little auxiliary heat is required during short periods, as often in the summer, the biomass boiler operation mode with frequent starts and stops causes unnecessary energy losses and it is therefore suitable to shut off the furnace during summer, when solar energy can cover most of the energy demand. The electric heater can then be a good backup during cold and cloudy days. The electric heater can also be used parallel with the boiler if needed on extremely cold winter days.
Energy PerformanceThe space heating demand of the building is 30400 kWh/a, or 19.0 kWh/m2a, according to simulations results from DEROB-LTH, which is below the limit of maximum space heating demand. The monthly space heating demand for this high performance case in comparison to a reference building according to the current building code of year 2001 is shown in Figure 4.8. The annual peak load occurs in January and is 26.8 kW (17 W/m2).

Solar thermal systems i high performance houses
89
02000400060008000
1000012000140001600018000
Janu
ary
Febr
uary
Mar
ch
Apr
il
May
June
July
Aug
ust
Sept
embe
r
Oct
ober
Nov
embe
r
Dec
embe
r
Spac
e he
atin
g de
man
d (k
Wh) Reference building
High performance building
Figure 4.8 Monthly values of the space heating demand during one year. The annual total space heating demand is 30400 and 70000 kWh/a respectively for the high performance building and the reference building.
The net energy demand for domestic hot water is assumed to be 37800 kWh/a (23.6 kWh/m²a). The DHW demand is thus larger than the space heating demand.
The system losses consist mainly of losses from the hot water storage tank, but also from circulation losses in the distribution system for DHW. The tank and circulation losses are 1.2 and 4.4 kWh/m2a respectively. The effi ciency of the biomass boiler is set to 85%, resulting in conversion losses of 5.5 kWh/m2a.
As shown in Table 4.2, the net energy required for DHW, space heat-ing and mechanical systems is 47.6 kWh/m2a (76200 kWh/a). Adding tank, boiler and system losses gives a total energy use of 58.7 kWh/m²a (93900 kWh/a).The total auxiliary energy demand (electricity and pel-lets), including the conversion losses in the pellet boiler, is 36.4 kWh/m2a (58300 kWh/a), of which 36.2 kWh/m2a (57900 kWh/a) are provided by biomass in the pellet boiler and approximately 0.3 kWh/m2a (400 kWh/a) by the electric heater.
The active solar gains are 17.3 kWh/m²a (27600 kWh/a) and the solar fraction of the heating system is 35%, since the simulation result of the same building, but without solar collectors, would require 77400 kWh/a (described in section 4.3.5 ).The electricity use for mechanical systems is 5.0 kWh/m²a (8000 kWh/a).

Solar thermal energy systems for building integration
90
Due to the solar contribution, the delivered energy is reduced to 41.4 kWh/m2a (66200 kWh/a). The total use of non-renewable primary energy is approximately 17 kWh/m2a (27900 kWh/a) and the CO2 equivalent emissions are 3.8 kg/m2a (6100 kg/a). Compared to the reference build-ing, the non-renewable energy use and CO2 equivalent emissions are considerably lower; see Table 4.3 and Figure 4.9.
Table 4.2 Total energy demand, non-renewable primary energy demand and CO2 equivalent emissions for the apartment building. The energy terms are defi ned in 4.3.1.
facto r ( - ) (kW h/m ²a) (kg /m ²a)
M echan ica l sys tem s 5.0 M echan ica l
sys tem s 5.0 E lec tric ity 5 .0 E lec tric ity 5 .0 2 .35 11.8 2 .2
E lec tric ity 0 .3 E lec tric ity 0 .3 2 .35 0.6 0 .1
B o ile r convers ion losses 5.5
T ota l 47.6 58.7 58.7 41.4 17.4 3 .8
17.3
D elivered energy (kW h/m ²a)
T ank and c ircu la tion losses 5.6
D H W 23.6 D H W 23.6
B io pe lle ts 36.2
S o lar
Energy use E nergy source
N et E nergy (kW h/m ²a)
T o ta l E nergy U se (kW h/m ²a)
0.0
N on renew ab le p rim ary energy
C O 2 equ ivalen t em issions
facto r (kg /kW h)
0.43
0.43
S o lar 0 .0
B io pe lle ts 36.2
0 .000.00 0.0
S pace heating 19 .0 S pace heating 19 .0
1 .60 .14 5.1 0 .04
Table 4.3 A comparison between the high performance house and the reference house regarding energy use and CO2-equivalent emis-sions.
Building Net energy Total energy use Delivered energy CO2 equivalent (kWh/m²a) (kWh/m²a) (kWh/m²a) emissions (kWh/m²a)
High performance 47.6 58.7 41.4 3.8buildingReference 72.4 81.2 81.2 20.5building

Solar thermal systems i high performance houses
91
0
10
20
30
40
50
60
70
80
90
100
Net energy Total energy use Delivered energy
Ene
rgy
dem
and
(kW
h/m
²a) High performance building Reference building
Figure 4.9 An overview of the net energy, the total energy use and the delivered energy for the high performance building and the reference build-ing.
4.3.5 Sensitivity analysis of the solar system for Solution 2
As the performance of the solar energy system is strongly affected by the system design parameters, e.g. collector area, tank volume, slope and direc-tion of the collectors and collector type of the solar heating system, some of the most important results from the Polysun simulations performed during the design of the system are presented here. Unless otherwise stated, the parameters of the simulated systems are the same as for the system solution described above. The “auxiliary energy”, which is shown in many of the fi gures, is the heat output from the auxiliary energy system, thus including heat for DHW heating, space heating and also heat losses from the piping and the tank. It does not include the conversion losses from the heat production (i.e. combustion and heat exchanger losses in a wood pellet furnace).
Collector areaWhen a solar thermal system is designed, the collector area and tank volume should preferably be considered both individually and as a unit. The collector area is however the more important feature to optimise in order to minimise the auxiliary energy use.

Solar thermal energy systems for building integration
92
Polysun simulations of a solar combi system have been performed with varying collector areas and with a constant storage tank volume. The aim was to fi nd a collector size that is large enough to almost cover the sum-mer heating demand, i.e. the DHW demand, while still maintaining a relatively low risk of stagnation in the collectors.
The solar fraction, SF, is calculated according to Equation 54. The parameters Aux and Aux0 represent the auxiliary energy required with (Aux) and without (Aux0) the solar system. In Polysun, the value of Aux0 was obtained by setting the collector area to zero, which resulted in an annual auxiliary energy demand of 77400 kWh per year and 11600 kWh during the summer months (June, July and August).
0
1AuxAux
SF −= Eq. (54)
In Figure 4.10 it is shown how the calculated solar fractions for the whole year and also for the summer months, June, July and August, increase with increasing collector area.
0102030405060708090
100110
0 10 20 30 40 50 60 70 80 90 100 110 120 130 140 150 160 170 180
Collector area (m²)
Sola
r Fr
acti
on (
%) Summer months
Year
Figure 4.10 The solar fraction of the system for the whole year and for the summer months.
In order to lower the risk of stagnation and overheating, 50 m² seems a suitable collector size. The pellet boiler can still be turned off during summer, although a small amount of electricity may be needed during a few colder days. The solar fraction during the three summer months will

Solar thermal systems i high performance houses
93
then be 95%. If a solar fraction of 100% in the summer were to be at-tained, the risk of overheating and stagnation would be large. Even though good control strategies can mitigate these problems, it is still desirable to avoid the problem completely. If a solar heated swimming pool for sum-mer use were connected to the system, the problems of overheating and stagnation could be reduced and a larger collector area could be used, giving higher solar gains over the whole year. Figure 4.11 shows monthly values of the auxiliary energy demand during summer for different system dimensions.
0
200
400
600
800
1000
1200
30 m²; 3,0 m³ 50 m²; 4,0 m³ 70 m²; 5,0 m³ 90 m²; 6,0 m³
Collector area; Tank volume
Aux
iliar
y en
ergy
dem
and
(kW
h/m
onth
)
June July August
Figure 4.11 Monthly values of auxiliary energy demand for solar systems of dif-ferent dimensions.
In Figure 4.12, the energy saved due to the installation of the collectors is shown for the marginal collector area, i.e. the extra savings made with an increase in collector area by 10 m².
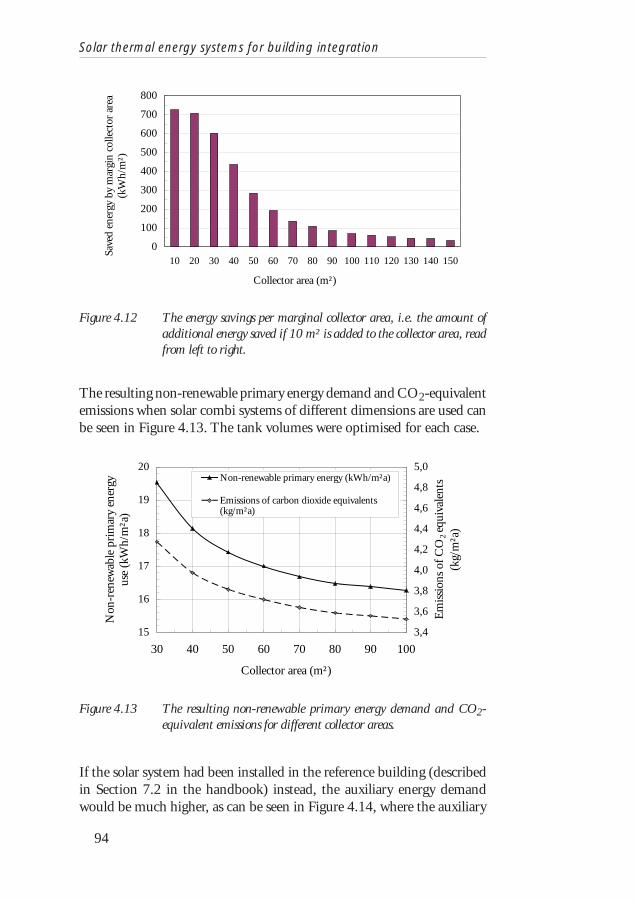
Solar thermal energy systems for building integration
94
0
100
200
300
400
500
600
700
800
10 20 30 40 50 60 70 80 90 100 110 120 130 140 150
Collector area (m²)
Save
d en
ergy
by
mar
gin
colle
ctor
are
a (k
Wh/
m²)
Figure 4.12 The energy savings per marginal collector area, i.e. the amount of additional energy saved if 10 m² is added to the collector area, read from left to right.
The resulting non-renewable primary energy demand and CO2-equivalent emissions when solar combi systems of different dimensions are used can be seen in Figure 4.13. The tank volumes were optimised for each case.
15
16
17
18
19
20
30 40 50 60 70 80 90 100
Collector area (m²)
Non
-ren
ewab
le p
rim
ary
ener
gy
use
(kW
h/m
²a)
3,4
3,6
3,8
4,0
4,2
4,4
4,6
4,8
5,0
Em
issi
ons
of C
O2 eq
uiva
lent
s (k
g/m
²a)
Non-renewable primary energy (kWh/m²a)
Emissions of carbon dioxide equivalents(kg/m²a)
Figure 4.13 The resulting non-renewable primary energy demand and CO2-equivalent emissions for different collector areas.
If the solar system had been installed in the reference building (described in Section 7.2 in the handbook) instead, the auxiliary energy demand would be much higher, as can be seen in Figure 4.14, where the auxiliary

Solar thermal systems i high performance houses
95
energy demands of the two buildings are shown for different solar system dimensions. Again the tank volumes were optimised for each case.
0
20000
40000
60000
80000
100000
120000
140000
0 20 40 60 80 100 120 140
Collector area (m²)
Aux
iliar
y en
ergy
dem
and
(kW
h/m
²)
Reference buildingHigh performance building
Figure 4.14 Annual auxiliary energy demand per fl oor area for different system dimensions based on Polysun simulations.
In Figure 4.15 the overview of the energy demands of the high perform-ance building and the reference building are shown as well as the solar gains of collectors of 30, 50 and 70 m2. Note that the heat for DHW, circulation losses and tank losses is valid for 50 m2 collector area. For a larger collector, the tank losses will be slightly higher.
0
2000
4000
6000
8000
10000
12000
14000
16000
18000
20000
22000
Jan Feb Mar Apr May June July Aug Sep Oct Nov DecEne
rgy
dem
and
and
sola
r ga
ins
(kW
h/m
onth
)
Heating, reference building
Domestic hot water
Solar gains (for 30, 50 and 70 m² collector)
Heating, high performance building
Figure 4.15 The energy demands and solar gains of the high performance building and the reference building. The solar gains are shown for different collector areas.

Solar thermal energy systems for building integration
96
Storage tank volumeFor economic reasons it is important to consider the storage tank volume. A larger tank is much more expensive though the impact on the auxiliary energy use is rather small, as shown in Figure 4.16. The tank could pref-erably be designed based on the daily energy demand, due to the limited storage time capacity. The tank should not be too small in view of the risk of overheating and because of lowered storage capacity. On the other hand, an oversized tank might give rise to a higher auxiliary energy demand in order to heat the tank and also because of the higher heat losses. A high insulation level is therefore important and it becomes more important, the larger the tank is.
30
31
32
33
34
35
0 1 2 3 4 5 6 7 8 9 10 11 12
Tank volume (m³)
Aux
iliar
y en
ergy
per
livi
ng a
rea
(kW
h/m
²)
50 mm insulation100 mm insulation150 mm insulation
Figure 4.16 The infl uence of tank volume and tank insulation level. The fi gure shows the auxiliary energy demand per living area for different tank volumes.
Simulation results for collector areas between 50 and 100 m², with varying tank volumes, are shown in Figure 4.17 where the chosen system is marked with a circle. These results too show that the collector area has a much larger infl uence on the auxiliary energy use than the tank volume. For the larger collectors, some energy can be saved by choosing a larger tank. The suggested system with 50 m² collector area and a storage volume of 4 m³ would entail neither overheating nor excessive tank losses, according to the simulation results.

Solar thermal systems i high performance houses
97
0
5
10
15
20
25
30
35
40
45
50
1 2 3 4 5 6 7 8
Storage tank volume (m3)
Aux
iliar
y en
ergy
dem
and
per
livin
g ar
ea (
kWh/
m²a
)
0 m²
10 m²
30 m²
50 m²
70 m²
90 m²
Collector area
Figure 4.17 Annual auxiliary energy per living area for different system dimen-sions based on Polysun simulations.
Collector tiltThe tilt of the collector determines how large the collector should be in order to cover the summer demand. In order to maintain a solar fraction of 95% during the summer months, the required collector size increases as the collector tilt is increased or decreased from 30- 40°, which is the tilt where the smallest collector area (50 m2) is needed. This is illustrated in Figure 4.18.

Solar thermal energy systems for building integration
98
020406080
100120140160180200220
0 10 20 30 40 50 60 70 80 90
Collector tilt (°)
Col
lect
or a
rea
(m²)
0102030405060708090100
Sola
r fr
acti
on (
%)
Collector area (m²)SF - summer months (%)SF - annual (%)
Figure 4.18 The graph shows the collector area required for differently tilted col-lectors in order to get a solar fraction of 95% during summer, i.e. an appropriate area which does not imply boiling in the tank. The solar fraction for the whole year and the constant solar fraction in summer are shown.
When highly tilted or vertical collectors are used, the solar gains will be better balanced against the seasonal heating demand as more of the win-ter space heating demand will be covered. However, this requires a larger collector area in order to cover the summer demand. For a very large collector with a high tilt angle, energy can be saved in total over the year, thus implying a higher annual solar fraction. A good, yet very expensive, solution would therefore be to use a vertical wall mounted collector of very large size. The benefi ts of this are naturally much higher for combi systems than for DHW systems. There are generally no benefi ts in using a horizontal collector, or a collector with a very low tilt.Looking further at two mounting options for good building integration; either to mount the collectors on the 40° tilted roof or vertically on the wall, tilted 90°, it can be seen in Figure 4.19 how the auxiliary energy demand decreases with increasing system size. The 40° tilt gives rise to a lower demand of auxiliary energy on an annual basis and the difference is more signifi cant in smaller systems. Furthermore, the risk of snow cover should be considered if a very low tilt angle is used. The risk of snow cover is even larger for evacuated tube collectors.

Solar thermal systems i high performance houses
99
0
5
10
15
20
25
30
35
40
45
30 m²; 3,0 m³ 50 m²; 4,0 m³ 70 m²; 5,0 m³ 90 m²; 6,0 m³
Collector area; Tank volume
Ann
ual a
uxili
ary
ener
gy p
er li
ving
ar
ea (
kWh/
m²a
)
40° 90°
Collector tilt
Figure 4.19 Results from simulations of systems with differently tilted collectors, 40° for the roof mounted and 90° for the wall mounted collectors.
Azimuth angle
If the deviation from south, i.e. the azimuth angle, is varied, the auxiliary energy demand and solar fraction change according to Figure 4.20.
0
5
10
15
20
25
30
35
40
90 60 30 0 -30 -60 -90Azimuth angle (°)
Aux
iliar
y en
ergy
dem
and
(kW
h/m
²a)
0102030405060708090100
Sola
r fr
acti
on (
%)
Aux. energy - 40° tilt Aux. energy - 90° tilt
SF - 40° tilt SF - 90° tilt
Figure 4.20 The auxiliary energy demand and solar fractions of systems with different azimuth angles.

Solar thermal energy systems for building integration
100
Collector performanceThe choice of collector is very important for the system performance. Simulations have been performed with collectors of different types, from older collector types without a selective surface to the most advanced evacuated tube collectors available, with characteristics and simulation results listed in Table 4.4. The results are also shown in Figure 4.21. In the suggested system an advanced fl at plate collector with a selective surface, antirefl ection treated glass and highly effi cient thermal insulation (number 3 in Table 4.4) is used. When compared to an older collector type without selective surface, the chosen collector increases the solar fraction from 26.4% to 35.1%. If an evacuated tube collector is used, the solar fraction increases even more. For the suggested solar heating system an evacuated tube collector of 35 m² would be suffi cient. Evacuated tube collectors are very effi cient, but also often very expensive.
Table 4.4 Collector parameters and corresponding solar fraction and aux-iliary energy.
η0 c1 c2 KCH1 KCH2 Specific heat
capacity
Solar fraction
(-) (W/m2K) (W/m²K²) (-) (-) (kJ/m2K) (%) (kWh/a) (kWh/m²a)
1. Advanced evacuated tube collector
0.88 1.41 0.013 0.92 1.15 7.84 40,5 46053 28.8
2. Evacuated tube collector
0.77 1.85 0.004 0.9 1.00 5.71 36.7 49004 30.6
3. Advanced flat plate collector
0.85 3.7 0.007 0.91 0.91 6.32 35.1 50232 31.4
4. Flat plate collector 0.8 3.5 0.015 0.9 0.9 6.32 33.1 51767 32.4
5. Flat plate collector - no selective surface
0.75 6,00 0.03 0.9 0.9 7,00 26.4 56976 35.6
Collector type
Auxiliary energy

Solar thermal systems i high performance houses
101
05
10152025303540
1. Advancedevacuated
tube
2. Evacuatedtube
3. Advancedflat plate
4. Flat plate 5. Flat plate -no sel. surface
Collector type
Aux
iliar
y en
ergy
(kW
h/m
²a)
0102030405060708090100
Sola
r fr
acti
on (
%)
Auxiliary energy (kWh/m²a) Solar fraction (%)
Figure 4.21 Results from simulations of systems with different collector types.
Concentrating collectorsBy using concentrating refl ectors to enhance the irradiance on the absorber, the output from the collectors can be increased. If the geometry of the collectors excludes irradiation from higher solar angles, the collector could improve the seasonal balance by increasing the winter performance and suppressing the summer performance. It is interesting to apply this strategy to evacuated tube collectors, which have the potential to deliver energy during lower irradiance levels and which are also relatively expensive at the present time. An estimation of the effect this would give rise to was investigated for an evacuated tube collector (with collector characteristics according to Collector type 1 in Table 4.4). Polysun simulations were performed assuming a double collector area from October to March and with the collector tilted 70° and 90°. The area was chosen so as to imply a solar fraction of 95 % during summer. The results shown in Table 4.5 indicate that the refl ector gives rise to energy savings of 11 %, if it is tilted either 70° or 90°.

Solar thermal energy systems for building integration
102
Table 4.5 The auxiliary energy demand for an evacuated tube collector with and without refl ectors.
Without reflector
With reflector
Without reflector
With reflector
Total annual auxiliary energy (kWh/a)
47538 42297 45643 40570
Solar fraction (%) 38.6 45.4 41.0 47.6
70°, 42 m2 90°, 56 m2
Design of the collector loop heat exchanger and fl ow rate The design of the storage tank and its connected components is also im-portant for the system effi ciency, as different types of heat exchangers work optimally at different fl ow rates. The fl ow rate in the collector loop should not be too low, so as not to cause laminar fl ow, air traps and/or increased heat losses. Therefore, if the heat from the collectors is transferred to the tank through an internal heat exchanger, a high fl ow rate gives rise to a lower auxiliary energy demand, as shown in Figure 4.22.
The effi ciency of the solar heating system is improved if an external heat exchanger is used instead, and even better if a stratifying device is used. In a smaller tank the importance of a stratifying device is more signifi cant. In these cases, a low fl ow rate is better, since the fl uid inserted into the tank may otherwise cause mixing of the stratifi ed water. However, the fl ow rate should not be too low. The optimum can be seen in Figure 4.22. Lower fl ow rates also contribute to a lower electricity use for the pump, and the dimensions of the pipes are reduced and they are therefore less expensive.

Solar thermal systems i high performance houses
103
3031323334353637383940
0 500 1000 1500 2000 2500 3000 3500 4000
Flow rate in collector loop (l/h)
Aux
iliar
y en
ergy
dem
and
per
livin
g ar
ea (
kWh/
m²a
)
Internal HEXExternal HEX - no stratifyerExternal HEX - with stratifyer
Figure 4.22 The auxiliary energy demand, with varied fl ow rate and type of heat exchanger in the solar circuit.
Non-renewable energy use – for solar DHW systems and combi systems In order to compare our solar combi system with a solar DHW system, simulations were also performed for two different a solar DHW system for the same building construction as for the combisystem. One of these DHW systems is combined with an electric heater in the DHW tank and electricity also for space heating. The other system is combined with district heating for both DHW and space heating. The use of non-renew-able energy and the emissions of CO2
equivalents are shown in Figures 4.23 and 4.24, which clearly show that the most environmentally friendly design is the solar combi system with a pellet boiler. This system reaches the targets of non-renewable primary energy of maximum 60 kWh/m2a (fl oor area) by far and only a small collector is required in order to reach this target. If a solar DHW system combined with electricity for space heating were applied the target would not be reached. For a solar DHW system combined with district heating for space heating, the solar collec-tors would have to be at least 40 m2 in order to reach the target, as shown in Figure 4.23.
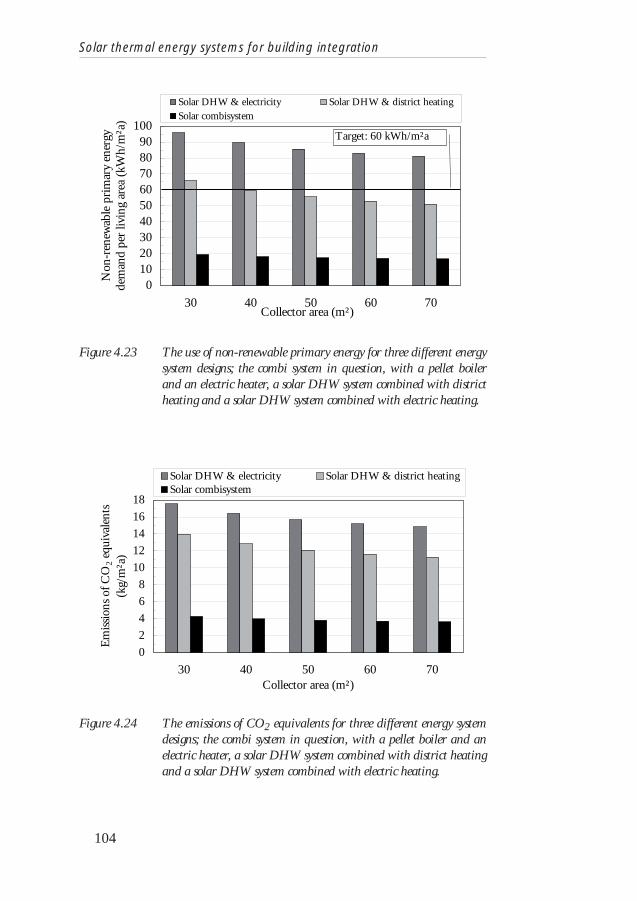
Solar thermal energy systems for building integration
104
0102030405060708090
100
30 40 50 60 70Collector area (m²)
Non
-ren
ewab
le p
rim
ary
ener
gy
dem
and
per
livin
g ar
ea (
kWh/
m²a
)
Solar DHW & electricity Solar DHW & district heatingSolar combisystem
Target: 60 kWh/m²a
Figure 4.23 The use of non-renewable primary energy for three different energy system designs; the combi system in question, with a pellet boiler and an electric heater, a solar DHW system combined with district heating and a solar DHW system combined with electric heating.
0
2
4
6
8
10
12
14
16
18
30 40 50 60 70Collector area (m²)
Em
issi
ons
of C
O2
equi
vale
nts
(kg/
m²a
)
Solar DHW & electricity Solar DHW & district heatingSolar combisystem
Figure 4.24 The emissions of CO2 equivalents for three different energy system designs; the combi system in question, with a pellet boiler and an electric heater, a solar DHW system combined with district heating and a solar DHW system combined with electric heating.

Solar thermal systems i high performance houses
105
4.3.6 Comparison between the different solutionsThe results for the different solutions have also been compared and ana-lysed. These fi gures are also presented in Section 8.1 in the handbook (Smeds, 2007). First a short overview of the design and heat load of the reference building and the different solutions.
Table 4.6 The designs of the solutions and the reference building.
R eference building
Solution 1a Solution 1b Solution 2
U-value of the whole building (W/m2K)
0.35 0.21 0.34 0.41
Space heating demand (kWh/m2a)
44 6.5 13.4 19.0
Heating system
District heating for DHW and space heating
Electric resistance heating of the supply air. Solar DHW system with electric backup.
District heating for DHW and space heating.
Solar combi system with biomass boiler for DHW and space heating.
The results of non-renewable energy use and emissions of CO2 equivalents for the different solutions of buildings and heating systems are presented in Figures 4.25 and 4.26. All the solutions have substantially lower energy demand than the reference building and all the solutions meet the targets of non-renewable primary energy use.
The total energy demand and the delivered energy are lowest for Solu-tion 1a, due to the extremely well insulated building envelope. However, it is for Solution 2 that the lowest emissions of CO2 equivalents and non-renewable primary energy use are achieved, due to the extensive use of renewable energy.

Solar thermal energy systems for building integration
106
41
23
40
17
81
57
46
81
4655
70
44
0
10
20
30
40
50
60
70
80
90
Reference Solution 1a Solution 1b Solution 2
Ene
rgy
dem
and
(kW
h/m
2 a)
total energydelivered energy non-renewable primary energy
Figure 4.25 Overview of the total energy demand, the delivered energy and the non-renewable primary energy demand for the apartment build-ings. The reference building is connected to district heating. (Smeds, 2007)
20,5
1012,1
3,7
0
5
10
15
20
25
Reference Solution 1a Solution 1b Solution 2
CO
2 em
issi
ons
(kg/
m2 a)
Figure 4.26 Overview of the CO2 emissions for the apartment buildings. The reference building is connected to district heating. (Smeds, 2007).

Solar thermal systems i high performance houses
107
4.4 ConclusionsThe thermal energy from a solar combi system can provide a signifi cant part of the total energy demand of a high performance building. If the space heating demand is specifi cally examined, it is seen that solar energy can also contribute to some extent to the space heating supply even for a well-insulated building. However, the relatively low space heating de-mand (although higher in the cold climate) and the short heating season makes it unreasonable to over dimension the solar system to cover much more than the domestic hot water demand (which is a large part of the total demand in a h.p. house and more constant over the year). The solar system should therefore preferably be designed so as to cover most of the energy demand in summer, both for solar combi systems and solar DHW systems. This way the furnace can be switched off in the summer, avoiding ineffi cient operation.
The building design and the choice of heat distribution system set the context for the design of a solar heating system. If the space heating demand is so low that is could be supplied merely by heating the incoming air, e.g. by electric resistance heating and heat recovery, a solar domestic hot water system is more easily argued, given the costs of a radiant heating system.
If a water-based radiant heating system is preferred, it is suitable to de-sign a solar combi system, where a joint storage tank combines the domestic hot water system and the space heating system. The tank can be heated both by the solar collector and by auxiliary heat sources, thus providing fl exibility to the system. The combined storage tank can give benefi cial effects due to the higher energy withdrawal from the tank, which could lower the temperature in the collector circuit and thereby increase the col-lector effi ciency somewhat during the heating season. The solar energy can also be used more effi ciently if the collectors can be directly connected to a low-temperature radiant heating system, e.g. a fl oor heating system.
For a solar DHW system a collector tilt of 40-50º is suitable in the cold climate. For combi systems a higher collector tilt or façade integrated collectors improves the seasonal balance between space heating demand and solar gains, although a larger collector area is required to cover the summer demand.
The simulations performed during the design of the solar thermal system of Solution 2 (renewable energy strategy), for an apartment build-ing in the cold climate, showed that a combi system with a collector area of 50 m2 and a storage tank of 4 m3 should be suitable. The system was designed to cover 95% of the energy demand in summer, so that the risk of stagnation is relatively low and the auxiliary pellet furnace can be switched off during the summer. The parametric study shows how much

Solar thermal energy systems for building integration
108
the collector area needs to be increased when the tilt angles are higher or lower than the optimal angle for summer production.
Generally, a suitable collector area for the energy demand of the build-ing in Solution 2 is between 30 and 80 m2 (0.6 – 1.8 m2/occupant) and a suitable tank volume is between 3000 and 5000 l (60-100 l/occupant). However, this much depends on user behaviour.
The parametric study also shows that the volume of the storage tank has a rather low infl uence on the energy output, although a minimum volume is crucial.
As regards the heat transfer from the collector circuit to the storage tank, the simulation results show that an external heat exchanger with a stratifying device in the tank should preferably be used, as it saves more energy compared to using internal heat exchangers in the tank. For internal heat exchangers a higher fl ow rate gives higher output while a lower fl ow is more benefi cial when an external heat exchanger is used, as the tank water can be kept well stratifi ed.
For Solution 2, the result of non-renewable energy demand is very low, only 17.4 kWh/m2a, which is far below the target of 60 kWh/m2a. Also, the emissions of CO2-equivalents to the atmosphere are very low, 3.8 kg/m2a. The alternative solar DHW systems simulated for the same building as the solar system would give rise to much higher use of non-renewable primary energy. For a solar DHW system combined with auxiliary electricity for DHW and for the space heating, the target would not be reached at all for a reasonable collector size. If the space heating were supplied by district heating, the target could be reached for a col-lector area of 40 m2.
For Solution 1a (a building with U-value 0.21 and a solar DHW system with electric resistance heating for the remainng DHW demand and the space heating) the non-renewable energy demand is 54.8 kWh/m2a and the emissions of CO2-equivalents are 10 kg/m2a.
When the construction of the building envelope is compared to cur-rent building standards, it is clear that today’s apartment buildings could live up to the targets of space heating demand set by the IEA if they were built very airtight and if effi cient ventilation heat exchangers were used. The comparison between the reference building, Solution 1a, Solution 2 and another building, Solution 1b (which has U-value 0.34 and which uses district heating) shows that they all meet the targets of non-renewable energy use but it is Solution 2 that gives the lowest non-renewable energy use and the lowest emissions of CO2-equivalents. As this building has the highest space heating demand, it is interesting to see that the non-renewable primary energy demand can be lowered so much, relative to the other solu-tions. This indicates the huge importance of using renewable energy.

Solar thermal systems i high performance houses
109
There is not one optimum design for an energy effi cient building and in each situation factors such as user behaviour, climatic conditions, politi-cal regulations, building standards and the availability of different energy network systems, such as natural gas or district heating, are important to consider. Depending on the circumstances, the design strategy should be adapted so that a realistic and long-term sustainable development is introduced in the built environment.
Generally, the strategy of renewable energy use is suitable for retrofi t buildings where increased insulation is not a reasonable solution. For the design of new buildings the conservation strategy gives more opportunities for the future as the well insulated building envelope provides opportuni-ties for further reductions in energy use by changing the energy systems to use more renewable energy.
District heating systems use a large share of renewable fuels in Scan-dinavia; approximately 80% of the fuel is renewable. If the building is situated in an urban area with such a district heating system, the district heating is to be preferred to the use of biomass boilers, as biomass boilers can give rise to some emissions from the furnaces, something that may be against the regulations in certain urban areas. However, the purifi cation of the exhaust gases is very good today and modern furnaces are often designed to use optimal oxygen amounts in the combustion process. If a biomass boiler is to be used, it should be an “environmentally approved” boiler and it should be coupled to a thermal heat storage tank in order to achieve an effective and controlled combustion process and to minimise the emissions of VOC and particles (Johansson et al., 2003).
A solar thermal heating system can be combined or integrated with most other heating systems and there is a large potential to lower the primary energy use and the impact on the environment by using solar collectors. Capturing and using energy from the sun is thus a very natural and mar-ketable concept for sustainable, low energy housing.

Solar thermal energy systems for building integration
110

Solar collectors for integration on non-insulated roofs
111
5 Solar collectors for integration on non-insulated roofs
Three solar collectors have been designed for non-insulated roofs in order to provide a cost-effective and easily installed solar collector. The collec-tors were tested outdoors and the measurement results and analysis are presented in this chapter and in Paper IV: Design and evaluation of solar collectors for integration on non-insulated roofs (Gajbert et al., 2007), which was presented at the conference NorthSun 2005 in Vilnius. The paper has been submitted to Solar Energy Materials and Solar Cells. Some ad-ditional results from measurements and simulations are also presented in this chapter.
5.1 IntroductionNon-insulated roofs with cold attics underneath are one of the largest available potential locations for installation of solar thermal collectors in Sweden. Solar thermal collectors for building integration are often very well insulated in order to contribute to the thermal comfort in the building. For collectors integrated on non-insulated roofs less insulation material is suffi cient for the insulation of the collector. There is therefore a potential for development of a cost-effective, thin collector with lower use of insulation material, suitable for easy integration in non-insulated roofs.
The objective of this work is to design a thin, cost-effective solar thermal collector for integration into a roofi ng material. It should be fl exible for production in variable lengths and have potential to be developed into a cost effective product. Prefabrication and simple mounting are desirable features for building integrated collectors.
Three similar collectors for non-insulated roofs have been designed and constructed as small scale prototypes. By using low-concentrating refl ec-

Solar thermal energy systems for building integration
112
tors in two of the collectors the absorber material is used more effi ciently. Existing roofi ng sheet is used for the collector bottoms, which means that no separate collector box is required. This and the fact that the absorber area is reduced enable the collector to be produced at low cost.
The thermal performance and the incidence angle dependence of the collectors were evaluated from measurements and the potential energy production from the collectors was calculated using the MINSUN simu-lation program.
5.2 The collector designsThe three collectors, including absorbers, refl ectors and the expanded polystyrene (EPS) insulation material, are designed to fi t in a commonly used corrugated sheet steel roofi ng material in order to facilitate the instal-lation and to integrate the collector into the building element.
The designs of the three collectors are similar but two of them are designed with concentrating refl ectors and one is a fl at plate reference col-lector. All collectors are covered with a 4 mm acrylic sheet with a relatively low transmittance. It is assumed that this sheet will be replaced by a glass cover with higher transmittance in a full scale collector. A description of the collectors follows.
5.2.1 Collector AStandard size Sunstrip absorbers of 143 mm are used in the reference collector, Collector A, shown in Figures 5.1 and 5.2. Underneath is 50 mm insulation of EPS material. For the other designs the thickness of the insulation is determined by the refl ector geometry.
Figure 5.1 Collector A – the fl at plate reference collector. Two absorber plates fi t into each compartment of the corrugated steel roof.

Solar collectors for integration on non-insulated roofs
113
Figure 5.2 Collector A has standard Sun-strip absorbers of 143 mm.
5.2.2 Collector BThe concentrating Collector B (Figures 5.3 and 5.4) has a Sunstrip absorber of half width (71.5 mm) combined with circular shaped concentrating refl ectors, resulting in a factor of 2.0 between the glazed area and single side absorber area, i.e. the geometrical concentration ratio. The physical concentration is 1.0, since the absorber is bifacial.
Figure 5.3. Collector B – a concentrating collector with narrow strip absorbers and circular refl ectors.
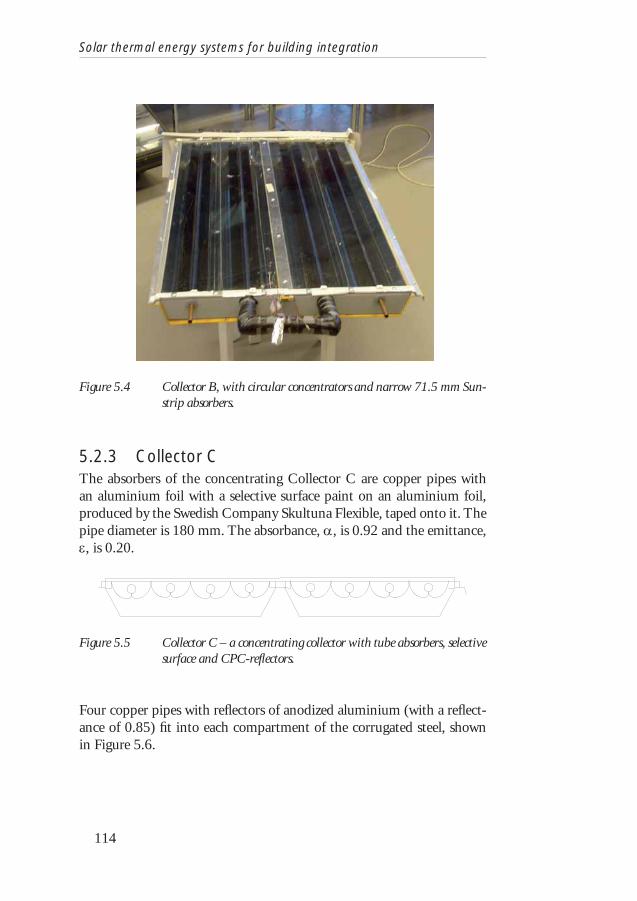
Solar thermal energy systems for building integration
114
Figure 5.4 Collector B, with circular concentrators and narrow 71.5 mm Sun-strip absorbers.
5.2.3 Collector CThe absorbers of the concentrating Collector C are copper pipes with an aluminium foil with a selective surface paint on an aluminium foil, produced by the Swedish Company Skultuna Flexible, taped onto it. The pipe diameter is 180 mm. The absorbance, α, is 0.92 and the emittance, ε, is 0.20.
Figure 5.5 Collector C – a concentrating collector with tube absorbers, selective surface and CPC-refl ectors.
Four copper pipes with refl ectors of anodized aluminium (with a refl ect-ance of 0.85) fi t into each compartment of the corrugated steel, shown in Figure 5.6.
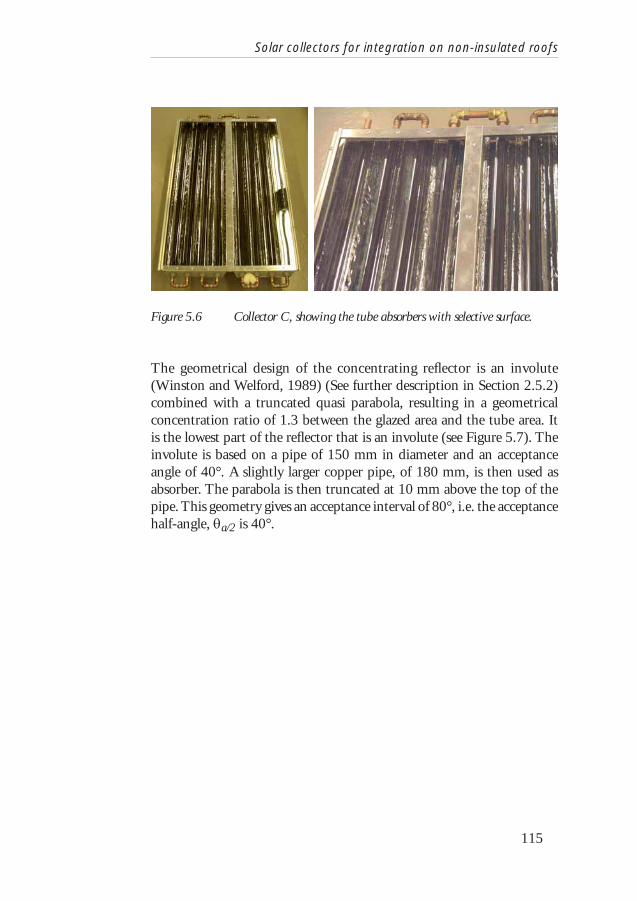
Solar collectors for integration on non-insulated roofs
115
Figure 5.6 Collector C, showing the tube absorbers with selective surface.
The geometrical design of the concentrating refl ector is an involute (Winston and Welford, 1989) (See further description in Section 2.5.2) combined with a truncated quasi parabola, resulting in a geometrical concentration ratio of 1.3 between the glazed area and the tube area. It is the lowest part of the refl ector that is an involute (see Figure 5.7). The involute is based on a pipe of 150 mm in diameter and an acceptance angle of 40°. A slightly larger copper pipe, of 180 mm, is then used as absorber. The parabola is then truncated at 10 mm above the top of the pipe. This geometry gives an acceptance interval of 80°, i.e. the acceptance half-angle, θa/2 is 40°.

Solar thermal energy systems for building integration
116
θa / 2
X
Y
Involute
2L
Semi parabola
Figure 5.7. The shape of the truncated refl ector used in Collector C, which is a combination of an involute and a parabola with an acceptance half-angle, θa/2, of 40°.
If large collectors with straight wide tube absorbers are used, it will be easier to connect them in series. The use of wide pipes in the collectors means that the pressure drop will be low, which is very benefi cial as components of lower dimensions, such as pumps etc., can be used, which also reduces the cost of the system.
5.2.4 OrientationWith these collector designs, the collectors could be oriented either in the east-west or in the north-south direction. For Collectors A and B, this orientation of the absorbers should not have any impact on the energy output, as they accept all irradiation that hits the glass. If only a small part of the roof is used as collector, it would be more suitable to place them in the north-south direction, as it facilitates the water run-off on the corrugated steel.
For Collector C, which has a limited acceptance of irradiation in the transverse plane, this will have a small impact on the energy output, al-though the 80º of acceptance it has will not exclude much of the irradia-tion, if mounted in the north-south direction. Therefore, if an entire roof is constructed as a collector, it is suitable to mount it with the absorbers in the east-west direction, and this is what Collector C is intended for.

Solar collectors for integration on non-insulated roofs
117
5.3 Experimental work and evaluationsThe thermal performance and the incidence angle dependence of the col-lectors have been evaluated by both indoor and outdoor measurements. Long-term outdoor measurements have been performed with larger col-lector prototypes in the Älvkarleby test facility and several indoor and outdoor measurements have been performed in the laboratory in Lund. From the long-term outdoor measurements, the thermal performances of the collectors were evaluated by multi linear regression, MLR. The results were used to set up a model of the expected collector output and it was also used for MINSUN simulations of the annual energy output. Ray tracing simulations of Collector C were performed in ZEMAX by Johan Nilsson. The methods are further described in Chapter 3.
5.3.1 Long-term measurements and MLR
Long-term outdoor measurementsLong-term outdoor measurements of larger collector prototypes were per-formed at the test facility in Älvkarleby (60.5°N, 17.4°E) during the period from 2005-04-02 to 2005-05-10. Three collector prototypes (Collectors A, B and C) of the size 1.0 × 2.0 m were mounted facing towards south with the absorbers directed in the east-west plane. For further method description see Section 3.1.2.
MLR analysisFrom the long-term outdoor measurements, the thermal performances of the collectors were evaluated by Multi Linear Regression, MLR, according to the model described by Perers (1993), which is based on Equation 30. It should be noted that values from measurements even during hours of lower irradiance are accounted for in these analyses. The monitored parameters of the collector power, q, the diffuse and direct irradiance, Gb and Gd, the mean collector temperature, Tm, and the ambient temperature, Ta, are used as input in the MLR calculations. The parameters F’(τα)n, b0, Kd, F’U0, F’U1 and (mC)e given are results from the MLR. The parameters F’U and η0b are thereafter calculated. The results for the three collectors are shown in Table 5.1.

Solar thermal energy systems for building integration
118
Table 5.1 The results from the MLR analysis based on long-term outdoor measurements.
Collector η0b [-]
η0d [-]
F’U [W/m²K]
F’U0 [W/m2 K]
F’U1 [W/m²K]
mCe [J/kgK]
b0 [-]
A 0.76 0.65 5.84 4.90 0.017 6834 0.125
B 0.72 0.62 4.93 4.27 0.012 5617 0.134
C 0.72 0.58 5.79 5.29 0.009 19148 0.154
The MLR analysis shows that the concentrating collectors, B and C, have a lower optical effi ciency than the reference, Collector A. This is explained by refl ectance losses and deviations from the ideal optical design. The pipes of Collector C are slightly displaced from the centre of the refl ec-tor, which affects the beam effi ciency. Collector C shows a lower diffuse effi ciency, which is normal for concentrating collectors. Collector B, with a narrow absorber, shows the lowest heat loss factor F’U, while the F’U values of Collector C and Collector A are comparable. The collectors A and B contain the same volume of water, while Collector C with the tube absorber contains four times more water per collector area. This is also refl ected in the very high specifi c heat parameter, (mC)e, of Collector C. The longitudinal incidence angle dependence is basically equal to Kb using the b0 value from these MLR results. This is explained in Section 5.3.5, Figure 3.19. The incidence angle dependence in the longitudinal plane, given by the b0 value, is similar for all the collectors.
5.3.2 Model accuracyIn order to verify the accuracy of the measurement results, a model of the expected collector power was set up based on the results from the MLR analysis. The model was compared with measurements from the 6th of May 2005, a day with varying weather and low temperature. Figures 5.8-5.10 show the measured and modelled collector power over time. Figures 5.11-5.13 show the modelled power on the Y-axis and the measured values on the X-axis, with data from the period 2005-04-02 to 2005-05-10. The good agreement between modelled and measured power of the collectors that can be seen in these graphs indicates that the evaluation model works satisfactorily.

Solar collectors for integration on non-insulated roofs
119
06:00 10:00 14:00 18:000
100
200
300
400
500
600
700
800Power (W/m²)
SimulationMeasured
Collector A
Figure 5.8 Measured and simulated power of Collector A over time, 6th of May 2006.
06:00 10:00 14:00 18:000
100
200
300
400
500
600
700
800Power (W/m²)
SimulationMeasured
Collector B
Figure 5.9 Measured and simulated power of Collector B over time, 6th of May 2006.

Solar thermal energy systems for building integration
120
06:00 10:00 14:00 18:000
100
200
300
400
500
600
700
800Power (W/m²)
SimulationMeasured
Collector C
Figure 5.10 Measured and simulated power of Collector C over time, 6th of May 2006.
0 100 200 300 400 500 600 700 800Power-measured(W/m²)
0
100
200
300
400
500
600
700
800Power-model(W/m²)
Collector A
Figure 5.11 Measured and modelled power for Collector A. Data from the period 2005-04-02 to 2005-05-10.

Solar collectors for integration on non-insulated roofs
121
0 100 200 300 400 500 600 700 800Power-measured(W/m²)
0
100
200
300
400
500
600
700
800Power-model(W/m²)
Collector B
Figure 5.12 Measured and modelled power for Collector B. Data from the period 2005-04-02 to 2005-05-10.
0 100 200 300 400 500 600 700 800Power-measured(W/m²)
0
100
200
300
400
500
600
700
800Power-model(W/m²)
Collector C
Figure 5.13 Measured and modelled power for Collector. Data from the period 2005-04-02 to 2005-05-10.

Solar thermal energy systems for building integration
122
5.3.3 Thermal inertia of the collectorsThe thermal inertia of Collector C is greater than that of Collectors A and B, since the absorber tube of Collector C is wider and contains more water, giving a larger constant (mC)e. This is confi rmed by the comparison of the modelled and the monitored collector power from the long-term measurements on 25th April 2005, during a sudden temperature drop, see Figures 5.14-5.16, where the model follows the measurements well. Figure 16 shows that the power of Collector C exhibits a strong peak, while the other collectors show just a small response to the decrease in temperature. These properties are also shown by the very high (mC)e value of Collector C from the MLR analysis.
08:00 10:00 12:00 14:00 16:00150
250
350
450
550
650
750Power(W/m²)
MeasuredSimulation
10
14
18
22
26
30
34°C
Tcoll-Tamb
Collector A
Figure 5.14. The relative collector temperature and the measured and modelled power of Collector A during a temperature peak.
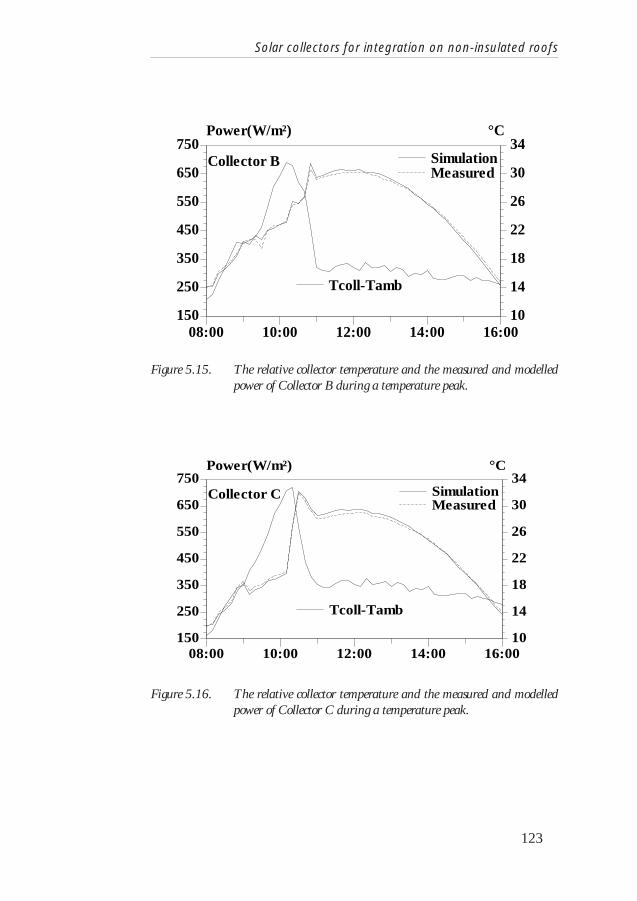
Solar collectors for integration on non-insulated roofs
123
08:00 10:00 12:00 14:00 16:00150
250
350
450
550
650
750Power(W/m²)
MeasuredSimulation
10
14
18
22
26
30
34°C
Tcoll-Tamb
Collector B
Figure 5.15. The relative collector temperature and the measured and modelled power of Collector B during a temperature peak.
08:00 10:00 12:00 14:00 16:00
150
250
350
450
550
650
750Power(W/m²)
MeasuredSimulation
10
14
18
22
26
30
34°C
Tcoll-Tamb
Collector C
Figure 5.16. The relative collector temperature and the measured and modelled power of Collector C during a temperature peak.

Solar thermal energy systems for building integration
124
5.3.4 Monitoring of effi ciency graphs
Results from the long-term outdoor measurementsThe standard effi ciency curves of the three collectors are determined from the long-term measurements during periods of near normal incidence, stable temperatures and for irradiance higher than 900 W/m2. The results are shown in Figure 5.17.
Eff
icie
ncy,
η (-
)
00,10,20,30,40,50,60,70,80,9
1
0 0,01 0,02 0,03 0,04 0,05 0,06 0,07
(T m -T a )/I (Km2/W)
Collector A
Collector B
Collector C
η = 0.77 – 6.5 (Tm-Ta)/G
η = 0.71 – 5.3 (Tm-Ta)/G
η = 0.70 – 6.0 (Tm-Ta)/G
Figure 5.17 The effi ciency of the three collectors as a function of (Tm-Ta)/I. The slope of the graph is the value of the heat loss coeffi cient F’U and the value where the graph crosses the Y-axis is the value of the optical effi ciency, η0.
Good agreement is shown between the results of optical effi ciency, η0, derived from these graphs, and the results from the MLR. The F´U values from these effi ciency graphs at high irradiances are systematically higher than the corresponding data from the MLR, which includes data measured during all hours of operation. This is because an increase in absorbed ir-radiance causes an increase in the temperature difference between the fi n and the heat carrier fl uid, which increases F´U (Hellström, 2005). This effect was confi rmed by measuring F´U from cooling the collectors during dark hours, which resulted in even lower F´U values, shown in Table 5.2. The dependence of F´U on the irradiance is strongest for Collector A, which has a low F´-value because of the wide absorber.

Solar collectors for integration on non-insulated roofs
125
Table 5.2 The heat loss coeffi cient F´U derived from the effi ciency graphs from the long-term measurements, from the MLR analysis and from the dark hour measurements.
Collector F’U from efficiency curves [W/m²K]
F’U from MLR
[W/m2 K]
F’U measured in darkness
[W/m²K]
A 6.5 5.84 5.5
B 5.3 4.93 4.8
C 6.0 5.79 5.5
Results from measurements using the test rig Outdoor measurements on the smaller (0.6 × 1.0 m) prototype of Collec-tor C were performed in Lund, both in daylight and during dark hours as described in Section 3.1.1. The test rig was used and the power and temperatures were recorded at three different operating temperatures. Figure 5.18 shows results from dark hour measurements. The heat losses are shown as negative values of power on the Y axis. On the X-axis is ΔT, the difference between the mean fl uid temperature in the collector and the ambient air temperature. F’U is determined from the slope of the graph to 6.5 W/m²K. The fact that this is higher than the F’U value derived from the MLR analyses based on long-term measurements (with large prototypes) is explained by the higher area-to-volume ratio of the smaller prototypes.

Solar thermal energy systems for building integration
126
-350
-300
-250
-200
-150
-100
-50
0
0 10 20 30 40 50
T m -T a (K)q
(W
/m²)
Figure 5.18. The heat losses of the small prototype of Collector C as a function of (Tm- Ta), from dark hour measurement. The slope of the graph is equal to F’U, which is 6.5 W/m2K.
Results from early measurementsEarlier performed indoor measurements during dark hours on all the small collector prototypes (see Section 3.1.3) show F’U values of 4.5 W/m²K for all prototypes. Similar outdoor measurements (using the same set-up) show the same results. The difference between the results from the measure-ments using the test rig and the early measurements may seem high, but it can be explained by the use of back insulation on the collector during the early measurements, which gives a lower F’U value.
5.3.5 Longitudinal incidence angle dependenceThe longitudinal incidence angle dependence was evaluated using data from the long-term measurements, where the collectors were mounted with the absorbers in the east-west direction. Data from May 1, 2005, when the transverse incidence angle of the irradiance was nearly constant during the whole day (shown in Figure 5.19), show how the incidence angle coincides with the longitudinal incidence angle during most of the time. The transverse incidence angle hardly varies at all. This leads to the conclusion that the collector effi ciency is mostly dependent on variations in the longitudinal incidence angle. This means that the refl ectors of Collector B and C have a very small or no impact on the b0 values. The

Solar collectors for integration on non-insulated roofs
127
b0 values obtained from the MLR-analysis represents only the effect of the incidence angles on the glazing. Therefore the longitudinal incidence angle dependence can be described by Kb, with the b0 values obtained from the MLR-analysis.
-80
-60
-40
-20
0
20
40
60
80
06:00 08:00 10:00 12:00 14:00 16:00 18:00Time (hh:mm)
Deg
rees
Incidence angle
Longitudinal incidence angle
Transverse incidence angle
Figure 5.19 The incidence angles on the collector surfaces, measured on April 1, 2005. The incidence angle coincides with the longitudinal incidence angle during most of the time and the transverse incidence angle hardly varies at all.
The angular dependence of η0b, with corrections for the contribution from diffuse irradiance and heat losses (according to Equation 31), are presented in Figures 5.20 and 5.21. The data is from April 26, 2005. In Figure 21 the zero-loss effi ciency is shown as a function of [(1/cosθ) -1]. Here, the b0 values are equal to the slopes of the graphs.

Solar thermal energy systems for building integration
128
0 10 20 30 40 50 60 70 80 90Angle of incidence(°)
0.0
0.2
0.4
0.6
0.8
1.0ob(-)Beam Efficiency
Collector BCollector C
Collector A
Figure 5.20 The zero-loss beam effi ciency, η0b, shown as a function of the incidence angle.
0.0 0.2 0.4 0.6 0.8 1.0(1/cos(teta)-1)
0.0
0.2
0.4
0.6
0.8
1.0ob(-) Beam Efficiency
Collector B, bo=0.15Collector C, bo=0.18
Collector A, bo=0.20
0.0
0.2
0.4
0.6
0.8
1.0
Figure 5.21 The zero-loss beam effi ciency, η0b, shown as a function of (1/cos θ-1). b0 is derived from the slopes of the graphs.
It is shown that all the collectors have similar angular dependence in the longitudinal direction. For Collectors A, B and C, b0 is equal to 0.20, 0.15 and 0.18 respectively. These are higher values than the corresponding values obtained from the MLR analysis. An explanation for this is that

Solar collectors for integration on non-insulated roofs
129
the MLR results are, to a high degree, determined from angles where high power is achieved, i.e. incidence angles below 30°, which correspond to values of the function [(1/cosθ) -1] lower than 0.15. In Figure 5.21, it is clearly shown that the slopes giving the b0 values are very low for these values. The b0 values from the MLR are thus more representative of the whole range of longitudinal incidence angles.
5.3.6 Incidence angle dependence in the transverse plane
Results from outdoor measurements using the test rigThe incidence angle dependence in the transverse plane of an identical but smaller (0.6 × 1.0 m) prototype of the concentrating Collector C has been evaluated based on outdoor measurements using the test rig and equipment described in Section 3.1.1. Figure 5.22 shows measurement results of optical effi ciency for beam irradiance from September 1st 2005, plotted against the transverse incidence angles, θT.
0,0
0,1
0,2
0,3
0,4
0,5
0,6
0,7
0,8
0,9
1,0
0 10 20 30 40 50 60 70 80 90
Transverse incidence angle, θ T (°)
Opt
ical
bea
m e
ffic
ienc
y, η
0b (
-) Modelled and normalised
valuesModelled values
Measured data, 2005-09-01
A.m.
P.m.
Figure 5.22 The transverse incidence angle dependence of the small prototypes of the concentrating Collector C. Measured data from a.m. and p.m. on September 1st, 2005. The modelled transverse incidence angles, and the normalization to data from the larger collectors, are also shown.

Solar thermal energy systems for building integration
130
As expected, the optical effi ciency is highest and almost constant within the acceptance interval (i.e. when the transverse incidence angle is between 0° and 40°) and thereafter it decreases. A slight difference between values of measured data from a.m. and p.m. can be seen. This difference can be explained by the obstruction in the horizon, the sun is descending before reaching 90°, and by the diffi culty of measuring at low incidence angles.
The fi gure also shows the model of the expected optical effi ciency for different transverse incidence angles that was set up based on the measured data. The model of transverse incidence angle dependence was adjusted to descend gradually to 0 at 90° from the abrupt drop between 70° and 80°. The model was also normalized to match the MLR results of η0b at normal incidence, which meant multiplying all values of η0b by 1.14. This was done because the long-term measurements are considered more accurate due to the larger size and the better precision during the produc-tion of the prototypes.
A complete model to predict the collector power could now be set up (as in Equation 27) with these modelled results of the transverse incidence angle dependence for beam irradiation, η0d(θT), (using the normalized values for larger collectors and the original values for the smaller prototypes) and the results of η0d, F’U and mCe from the MLR analysis.
The model was validated by comparing measured data of the collector power from another day, August 18, 2005, with the modelled values. As can be seen in Figure 5.23, the model agrees well with measured data.
0
100
200
300
400
500
600
700
800
07:12 09:36 12:00 14:24 16:48 19:12
Time of day, August 18, 2005
Pow
er (
W/m
2 )
Measured dataModelled data
Figure 5.23 Measured and modelled data of the collector power during August 18, 2005.

Solar collectors for integration on non-insulated roofs
131
Results from early measurementsThe results of zero-loss effi ciency for normal irradiance from the early measurements (described in Section 3.1.3) are shown in Table 5.3. The results are based on global irradiance on a tilted surface.
Table 5.3 The zero-loss effi ciency at normal incidence angle.
Collector Collector A Collector B Collector C
η0 (%) 72 73 59
Collector B shows similar optical effi ciency as the reference, Collector A. This was expected as Collector B has a low concentration ratio and the same acceptance interval as Collector A (180°). Therefore, it shows that the optics is good. Collector C, on the other hand, shows a lower optical effi ciency at normal irradiance, which is explained by non-ideal refl ec-tor optics. The prototype of Collector C used here was replaced by one with smoother refl ector before the measurements with the test rig were performed.
The effi ciency, η0, for different transverse angles of incidence, θT, is plotted in Figure 5.24.
Efficiency, η 0 (–)
00,10,20,30,40,50,60,70,80,9
1
0 10 20 30 40 50 60 70 80
Transverse incidence angle, θ T (°)
Collector A - simulatorCollector B - simulatorCollector C - simulatorCollector C - outdoors
Figure 5.24 The measured incidence angle dependence of the three collectors in the transverse direction. The collectors A and B are tested indoors with the solar simulator and collector C is tested both indoors and outdoors.

Solar thermal energy systems for building integration
132
Collectors A and B exhibit a similar angular dependence in the transverse direction as in the longitudinal and transverse direction. The concen-trating Collector C, with a tubular absorber, is clearly infl uenced by the limited acceptance interval, and shows that for angles above 40°, the ef-fi ciency decreases. However, Collector C shows a relatively low effi ciency for normal irradiance. An explanation for this is that the absorber pipes may have been slightly dislocated from their original position. The results from outdoor and indoor measurements of Collector C agree well up to transverse incidence angles, θT, of 50°. The difference at higher angles is explained by the low accuracy during measurement on small areas at high angles of incidence. This is due to the somewhat uneven light distribution of the solar simulator used in indoor measurements and the movement of the light pattern during the elevation of the simulator during measure-ments. The outdoor measurements are therefore more reliable at high incidence angles.
5.3.7 Ray tracing simulationsRay tracing simulations of Collector C were performed in ZEMAX by Johan Nilsson in order to show the theoretical transverse incidence angle dependence. Detailed data of the collector geometry was used for the simulations. In the fi rst simulation only the refl ectance of the refl ector was considered and set to 0.85. A second simulation was also performed, where also the transmittance of the glazing and the absorbance of the absorber were included. The transmittance was set to 0.9 and the absorb-ance to 0.9. The incidence angle dependence of the transmittance and the absorbance was accounted for by a variation from 0.9 at normal incidence to 0.0 at 90° incidence, similar to the Kb function. Simulations of the light distribution pattern on the absorber surface were also performed for various incidence angles.
Ray tracing resultsFigure 5.25 shows the ray tracing results of theoretical optical effi ciency, η0b, of Collector C for varying transverse incidence angles, compared to the normalized model shown in Figure 5.22. The ray tracing simulation including refl ectance, transmittance and absorptance corresponds relatively well with the model. The deviations are explained by the slightly imperfect refl ector shape. The simulation that only considers the infl uence of the refl ector gives very much higher values.

Solar collectors for integration on non-insulated roofs
133
0,00,10,20,30,40,50,60,7
0,80,91,0
0 10 20 30 40 50 60 70 80 90Transverse incidence angle, θ T (°)
Opt
ical
bea
m e
ffic
ienc
y, η
0b (
-) Ray tracing - only
reflectanceRay tracing results
Model, normalised to MLR
Figure 5.25 Ray tracing results and the modelled values of optical effi ciency for beam irradiation for varying transverse incidence angles for Collector C.
In Figures 5.26 - 5.33 the results from the ray tracing simulations of ir-radiance on the absorber and the light distribution pattern for incidence angles of 0°, 20°, 45° and 60° are shown. In the fi gures showing irradiance, the X-axis shows the pixels along the absorber surface, which were used in the simulation, clockwise from the top.
Figure 5.26 Light distribution pattern for the incidence angle θT of 0°.

Solar thermal energy systems for building integration
134
0,000
0,002
0,004
0,006
0,008
0,010
0,012
1 18 35 52 69 86 103 120 137 154 171 188
Irra
dian
ce (
W/c
m2 )
Figure 5.27 The irradiance along the tube absorber for incidence angles θT of 0°.
Figure 5.28 Light distribution pattern for the incidence angle θT of 20°.

Solar collectors for integration on non-insulated roofs
135
0,000
0,002
0,004
0,006
0,008
0,010
0,012
1 18 35 52 69 86 103 120 137 154 171 188
Irra
dian
ce (
W/c
m2 )
Figure 5.29 The irradiance along the tube absorber for incidence angles θT of 20°.
Figure 5.30 Light distribution pattern for the incidence angle θT of 45°.

Solar thermal energy systems for building integration
136
0,000
0,002
0,004
0,006
0,008
0,010
0,012
1 19 37 55 73 91 109 127 145 163 181 199
Irra
dian
ce (
W/c
m2 )
Figure 5.31 The irradiance along the tube absorber for incidence angles θT of 45°.
Figure 5.32 Light distribution pattern for the incidence angle θT of 60°.

Solar collectors for integration on non-insulated roofs
137
0,000
0,002
0,004
0,006
0,008
0,010
0,012
1 19 37 55 73 91 109 127 145 163 181 199
Irra
dian
ce (
W/c
m2 )
Figure 5.33 The irradiance along the tube absorber for incidence angles θT of 60°.
5.3.8 MINSUN simulations of annual energy outputThe MINSUN simulation program (see Section 3.3.1) was used to calcu-late the expected annual energy output from the collectors. The parameters derived by the MLR analysis (Table 5.1) were used as input data. Simula-tions were performed for all three collectors. For Collectors A and B, the Kb function with the b0 values from the MLR results was used to describe the incidence angle dependence. For Collector C simulations were performed with the infl uence of both the longitudinal and the transverse incidence angle dependence. The tilt of the surface was varied in order to show the effect of installing the collectors on roofs of different tilt angles.
Annual energy output - MINSUN simulation results
The simulation results show that the maximum annual energy output per glazed collector area would be 320 kWh/m2, 330 kWh/m2 and 280 kWh/m2 respectively for Collectors A, B and C, at an operating temperature of 50°C and with a collector tilt of 45°. If calculated per absorber area, the corresponding yield would be 360, 680 and 1140 kWh/m²
absorber respectively for Collectors A, B and C. (The absorber area of Collector C is based on the pipe diameter).

Solar thermal energy systems for building integration
138
While Collectors A and B show higher performance per glazed area than Collector C, both Collectors B and C, Collector C in particular, show high energy output per absorber area. The low energy output per collector area of Collector C could be explained by a slight dislocation of the absorber, which means that a lot of the irradiation could be refl ected back out from the collector.
The infl uence of the roof tilt on the annual energy output is shown in Figure 5.34. The optimal tilt angle of the roof is 45° and for tilt angles be-tween 35° and 50° the annual output is not reduced by more than 2%.
0
50
100
150
200
250
300
350
0 10 20 30 40 50 60 70 80 90
Collector tilt angle (°)
Ann
ual e
nerg
y ou
tput
per
col
lect
or
surf
ace
(kW
h/m
2 a)
Collector ACollector BCollector C
Figure 5.34 Simulation results showing the annual energy output for the collectors on differently tilted roofs, at an operating temperature of 50°.
5.4 ConclusionsThe thermal performance and incidence angle dependence of two low con-centrating collectors and one fl at plate reference collector, all constructed for direct integration into non-insulated roofs, were investigated in detail by outdoor and indoor measurements and by simulations in MINSUN. Generally, good correspondence between measured and modelled collector performances was shown, which leads to the conclusion that the results are accurate.
The simulation results show that the maximum annual energy output would be 320 kWh/m2, 330 kWh/m2 and 280 kWh/m2
, per glazed col-lector area, respectively, or 360 kWh/m2, 680 kWh/m2 and 1140 kWh/

Solar collectors for integration on non-insulated roofs
139
m2, per absorber for collectors A, B and C respectively at an operating temperature of 50°C and with 45° tilt angle.
According to the detailed analyses of the thermal performance, Collector B, with the narrow strip absorber, shows the lowest heat loss coeffi cient. The heat loss coeffi cient F’U varies slightly between different measure-ments. This is explained by the difference in size of the prototypes, the theoretical difference between dark hour measurements and measure-ments with irradiation and also because of the use of back insulation on the collectors.
The analysis of transverse incidence angle dependence of Collector C shows results similar to the results from the ray tracing simulations. The deviations can be explained by imperfections of the refl ector or by a slight dislocation of the absorber pipe, which can result in slightly higher optical losses.
These solar collectors combined in a ready-to-use roofi ng material should preferably be mounted as entire roofs over cold spaces, which could give a signifi cant contribution to the heat supply.
Judging from the collectors with their present design, Collector B is the most promising, with low heat losses and little use of absorber material. Collector C is the collector that would be the cheapest to produce, but the heat losses could be too high to make it profi table. It would therefore be interesting to further analyse the unexpectedly high F´U0 value of the concentrating Collector C.
It is possible to reduce the heat losses by decreasing the acceptance angle and by increasing the concentration ratio. A suggestion for further development is to decrease the acceptance angle of the refl ectors of Col-lector B. For a previously evaluated non-insulated low-concentrating east -west collector (a roof-MaReCo) with a bifacial narrow absorber and a factor 3 between glazed area and single side absorber area, an acceptance interval of only 45° has been shown to be suffi cient. This collector has a F´U0 value of around 3.5-4.0 W/m²K (Adsten et al., 2005). However, for a concentrating collector with the absorbers in the north-south direc-tion, the acceptance interval needs to be around 80º, as for Collector C, in order for the collector to be operated at least 5 hours in the middle of the day in Sweden.
As the designs are today they can be placed either in the east-west direction or in the north-south direction
Considering the low production costs expected for these collector types, it is estimated that the production of a cost-effective collector has a high potential, although there are improvements to be made. A detailed cost analysis should preferably also be performed in future work to ensure the low cost of the fi nal product.

Solar thermal energy systems for building integration
140

Evaluation of solar simulator performance
141
6 Evaluation of solar simulator performance
This chapter describes the work performed for the evaluation of the accu-racy of indoor measurements of thermal performance and incidence angle dependence of solar collectors using a large solar simulator. The work is described in Paper V - Measurement of concentrating solar collectors using a solar simulator with parallel light, which was presented at Eurosun 2004.
6.1 IntroductionBy using indoor measurements under steady ambient conditions, evalu-ations of concentrating solar collectors could be made easier and more systematic, facilitating the repetitiveness of the experiments. In order to enable indoor evaluation of concentrating solar collectors, a light source with parallel light is required. These kinds of light sources are not common and indoor evaluations are therefore rare. The solar simulator that is used at Energy and Building Design, shown in Figure 3.10, is designed to give parallel light and is adjustable to simulate different solar altitude angles. The simulator is further discussed in Section 3.2.1
In order that values of the irradiation on the collector surface should be recorded correctly during measurements, it is important that the irradiation on the test area is known throughout the measurement. A problem with this solar simulator is that the light distribution is slightly non-uniform and when the simulator is lifted to simulate different solar altitude angles, it is possible that the light pattern is altered, which could make it diffi cult to correctly evaluate the performance of concentrating solar collectors. This has been indicated by previously performed measurements where results were diffi cult to interpret.
The objective of this work is to improve indoor evaluations of incidence angle dependence of concentrating solar collectors by evaluating a method to better estimate the irradiance from the simulator on a test area in front

Solar thermal energy systems for building integration
142
of the simulator. It is investigated if it is possible to compensate for the non-uniform light distribution and the movements of the light pattern by using an array of photodiodes that is placed in front of the test area to estimate the total irradiance on the collector surface.
6.2 The solar simulator light distributionEach of the seven lamps on the solar simulator is placed facing one of the parabolic refl ectors, which render the light nearly parallel. The good paral-lel light quality of the radiation has been achieved to some extent at the expense of a uniform area distribution. The irradiance over the test area perpendicular to the lamps is therefore slightly non-uniform. Fewer large lamps generating nearly parallel light are used instead of a larger number of smaller lamps, which would have generated more evenly distributed but also more diverging light. Previously performed measurements of the irradiance on several locations in front of the simulator have shown a light distribution according to Figure 6.1, where the light intensity peaks ema-nate from the rim of the refl ectors surrounding the lamps. This is further discussed in Håkansson (2003 a, b) Håkansson (2001), Håkansson and Fredlund (1999).
00.2
0.40.6
0.81
1.2
0
0.2
0.4
0.6
0.8
1
1.20
500
1000
1500
2000
Figure 6.1 Light intensity distribution pattern from the solar simulator over a test area perpendicular to the simulator (Håkansson, 2003 a, b).

Evaluation of solar simulator performance
143
When the simulator is lifted to simulate various solar altitudes, the light intensity pattern tends to move over the test area, although placed at the pivot point of the adjustable lifting frame of the simulator. Therefore it is possible that total irradiation on the object is changed as the simula-tor altitude angle is altered. As the irradiation is normally measured by a single pyranometer, the results could be misleading. The radiation from the simulator also changes slightly over time due to the instability of the discharge lamps.
6.3 The photodiode array In order to estimate the mean irradiance on the test area and thereby com-pensate for the spatially non-uniform irradiation from the solar simulator, an array of six photodiodes, connected in parallel by thin copper threads, was placed on the glazing of the collector during the measurements. The placement of the photodiodes divides the front area of the solar collector into smaller areas of equal size with one photodiode placed in the centre of each area. With this arrangement, the total current from the photodiode array should be a fairly good representation of the total irradiance on the collector surface.
Figure 6.2 An illustration of the photodiode array placed in front of a solar col-lector to be tested. The six photodiodes are connected in parallel and the resulting current from the array represents the total irradiance on the test area.

Solar thermal energy systems for building integration
144
6.4 Measurements of concentrating collectors
In order to compare results from indoor measurements with results from outdoor measurements that have higher credibility, the transverse incidence angle dependence of different concentrating solar collectors was evaluated by indoor and outdoor measurements. During the indoor measurements, the photodiode array was placed in front of the test area in order to achieve a mean value of the irradiance on the collector surface.
6.4.1 The roof collector of corrugated steel
MeasurementsThe concentrating roof-integrated solar collector, referred to as Collector C in chapter 5, is based on copper pipe absorbers placed together with concentrating refl ectors in a roofi ng material of corrugated steel. The col-lector was evaluated by indoor and outdoor measurements as described in Sections 3.1.3 and 5.3.6.
Figure 6.3 The concentrating roof-integrated collector based on copper pipe absorbers.
ResultsThe measurement results are described in Section 5.3.6 and Figure 5.24 shows the transverse incidence angle dependence where Collector C is measured both indoors and outdoors. The graphs from indoor and out-door measurements correspond relatively well up to θT=50º. For incidence angles higher than that the results are less accurate.
6.4.2 The roof MaReCo
MeasurementsA prototype of a 2D concentrating collector, a roof MaReCo, which is geo-metrically optimised for spring and autumn performance and intended

Evaluation of solar simulator performance
145
to be placed on a 30° tilted roof, was also evaluated. The collector, which was previously described and evaluated for thermal performance by Adsten (2002), is shown in Figure 6.4.
The refl ector geometry is a parabola combined with a circular section. The bifacial absorber receives irradiation both on the front side and on the back side over an acceptance interval between 0° and 60° solar altitude angle when placed on a roof with 30° slope.
Figure 6.4 Design of MaReCo for tilted roofs (Adsten, 2002).
Indoor measurements with a Roof-MaReCo prototype were performed as described in Section 3.1.3. The collector was mounted in front of the solar simulator with the absorbers placed vertically on a stand that was rotated to get varying incidence angles on the collector, as shown in Figure 6.5. During the measurements the glazing of the prototype was replaced by a Tefl on fi lm, for which the incidence angle dependence is similar to that of glass. The f(θ) function was therefore approximated with Kb, with b0 equal to 0.08. The photodiode array was placed in front of the Tefl on fi lm during the measurement.

Solar thermal energy systems for building integration
146
Figure 6.5 The roof MaReCo mounted in front of the solar simulator, with the absorbers placed vertically.
A single measurement was performed outdoors, at θT =30°, with similar equipment set-up. The result from this measurement was intended to be a normalization point for the indoor measurements.
The relation between the current from the photodiode array and the irradiation at corresponding incidence angles during outdoor measure-ments was calculated based on the outdoor measurements.
The results of optical effi ciency for the various incidence angles gave the incidence angle dependence in the transverse plane, K(0,θT), which includes the infl uence of the Tefl on cover. K(0,θT) was then divided by fL(θL), the infl uence of the glazing, in order to get RT(θT), the infl uence of the refl ector only, according to the method described in Section 2.5.3.
The optical effi ciency was also calculated by multiplying the irradiation at normal incidence by cos θT, as this could be a good approximation had the total irradiation from the simulator been constant throughout the measurement. A comparison has been made with corresponding outdoor measurements of fL(θT) and K(0,θT) on the roof MaReCo, which were previously per-

Evaluation of solar simulator performance
147
formed at the Älvkarleby test facility on a larger prototype with identical geometrical features.
Results
The transverse incidence angle dependence of the roof MaReCo is shown in Figure 6.6. These values of optical effi ciency, RT(θT), show the infl u-ence of the refl ector exclusively, since the infl uence from the Tefl on and the glazing are deducted. For low angles of incidence, from ±0° to ap-proximately ±35°- 40°, the results from the photodiode compensation method show good agreement with outdoor measurements but for higher angles of incidence, when the irradiance is low, the agreement is not so good. Here, the cosine dependence shows better agreement with outdoor measurements than the photodiode compensated data. According to these results the cosine compensation seems to be a good method for estimation of the irradiance but it does not take the moving light pattern, nor the variable irradiance and the time aspect into account.
0
0,1
0,2
0,3
0,4
0,5
0,6
0,7
0,8
0,9
1
-60 -50 -40 -30 -20 -10 0 10 20 30
Transverse incidence angle, θ T (°)
Opt
ical
eff
icie
ncy,
RT(θ
T)
(-)
Outdoor measurments
Photo diode compensation
Cosine compensation
Figure 6.6 The incidence angle dependence of the roof MaReCo from indoor and outdoor measurements is plotted here, showing the optical effi ciency infl uenced only by the refl ector. The interval of incidence angles cor-responds to the interval when placed at a 30° tilted roof. Then -60° in the fi gure means that the solar altitude angle is 0°, 0° is normal incidence and 30° means 90° solar altitude (zenith).

Solar thermal energy systems for building integration
148
6.5 ConclusionsThe measurement technique of using an array of photodiodes for cal-culation of the total irradiance during indoor measurements with the solar simulator has been shown to work well for lower incidence angles. However, the method is in need of improvement before it can be applied during evaluations of the entire angular spectrum.
The results of optical effi ciency from outdoor and indoor measurements show that the agreement between indoor and outdoor measurement is good at lower incidence angles but not so good at higher incidence an-gles. The evaluation of the roof collector of corrugated steel showed that measurements of incidence angles up to ±50° gave accurate results while the measurements of the roof-MaReCo indicate that it is accurate only up to ±35°-40°.
Although the cosine compensation method, which showed very good agreement from the evaluation of the roof-MaReCo, appears good, it is not suitable for application where this solar simulator is used, as neither the light intensity variation in time nor the moving light pattern can be taken into consideration when it is used. In this case it is highly likely that the good correspondence was more or less a coincidence.
An explanation for the lower correspondence when the photodiode method is used at higher incidence angles could be that the active test area is smaller and the power involved is lower.
Also, the number of photodiodes could be too small. A higher number of photodiodes might give a more representative value of the total irradi-ance on the collector surface.
If possible the photodiodes should be replaced by pyranometers, the accuracy of which at high incidence angles is well known.
Actually, the photodiodes might not be suitable for use at high incidence angles. There is a risk that the light might be refl ected into the silica receptor of the photodiodes from the sides and from the back of the diodes, which is transparent glass. There is therefore a risk that the shown current might be higher than the irradiance it should represent, which would explain the lower optical effi ciency at high incidence angles. This problem could possibly be taken care of by painting the sides of the photodiodes black so that no side irradiation affects the result.
The method can thus be improved in a number of respects, and there is potential for development of a good indoor method for evaluations of the incidence angle dependence of solar collectors.

Building integrated solar collectors for district heating systems
149
7 Building integrated solar collectors for district heating systems
A presentation and summary of Paper VI - Design and performance of a large solar thermal system with façade-integrated collectors in several directions, connected to the district heating system is found in this chapter. The work was performed in collaboration with E.ON and Grontmij (former Carl Bro), the owners and ivolved designers of the investigated solar thermal system and with help with climate data from Denmark Technical University. The paper was presented at Northsun 2005 in Vilnius.
7.1 IntroductionA reliable and robust control system is crucial for the optimal function of a solar thermal system. By connecting solar thermal collectors to the district heating system, problems with stagnation in the collectors can easily be avoided due to the constantly large heating demand. This chapter describes the interesting design features of one of the largest façade-integrated solar thermal systems in Europe, which is also connected to the local district heating system. This system has been operated successfully and monitored since June 2002 without stagnations problems or interruptions. The thermal performance of the collectors and the importance of some system features have been evaluated by studies of measured data from the system and by parametric studies from WINSUN simulations.

Solar thermal energy systems for building integration
150
7.2 System description
7.2.1 System designThe solar thermal system works as any other conventional production unit in the district heating system in Malmö, with the exception that the production cannot be predicted. It is therefore very important that the system is robust and provides a high availability, in order not to cause disturbances like the discharge of low-temperature water into the district heating net. The system is therefore highly automated, remote-controlled and requires minimal maintenance.
The installation of the 1050 m2 large fl at plate collectors with antire-fl ection treated and frosted glass was carried out as a replacement of the old façade and they have been given an interesting design, well integrated in the building.
Figure 7.1 The large façade-integrated collectors at Kockum Fritid in Malmö. (Photo: Martin Råberg, Grontmij).
The fi ve collectors are divided into three subsystems, which are integrated in the façades in directions close to east, south and west and tilted at 90° and 73°. The control system allows cooperation of the fi ve collectors. The areas, azimuth angles and tilt angles of the collectors are shown in Table 7.1. In Figure 7.2, an overview of the system design is shown.

Building integrated solar collectors for district heating systems
151
Table 7.1 The size and orientations of the collectors.
Direction Azimuth angle, γ Collector tilt,β Collector area (m²) East -98° 90° 181,6
South -8° 90° 371,2 South -8° 73° 221,6 West 82º 90° 112,4 West 82º 73° 163,4
Ex.
E 90°
S 73°
S 90°
W 90°
W 73°
F
R
FS
T w
T so l,hT s
T e
T D H S , h
T so l, c T D H S , c
V1
V3
V4
V2
P so l P D H S
Figure 7.2 An overview of the system design.
The collectors are marked with S, W and E, for the orientations towards south, west and east, and with the tilt angles. The temperatures from the outlets of the collectors towards south, (Ts), west (Tw) and east (Te) are shown in the fi gure as well as the hot and cold temperatures on the solar circuit side (Tsol,h) and (Tsol,c) and the corresponding temperatures on the district heating system side (TDHS, h) and (TDHS, c). The expansion vessel (Ex), the fl ow sensor (FS), the forward (F) and the return (R) pipes of the district heating system, the solar circuit pump (Psol), the pump on the district heating side (PDHS) and the three-way valves (V1, V2, V3 and V4) are also shown .

Solar thermal energy systems for building integration
152
7.2.2 The fl ows in the collector circuitsThe fl ow in the solar circuit is divided into three main circuits, east, west and south, and the fl ow rates in these circuits vary continuously. Two PID regulators seek to modify the positions of two motorized three-port control valves, V1 and V2, which mix the fl ows in a way that minimises the temperature differences between the outfl ows from the three circuits. The fl ows from the eastern and the western collector circuit are mixed in V1, so that Tw and Te are balanced, by increasing the fl ow where the temperature is highest. The valve V2 mixes the fl ow from the collectors towards east/west with the fl ow from the southern collectors so that the highest temperature of Tw and Te is balanced to Ts. This strategy results in a higher fl ow rate, lowered operation temperatures and thereby reduced heat losses in the most illuminated collector.
7.2.3 Start up and shut down control of the solar circuit
The start up and shut down of the solar circulation pump, Psol, is controlled by a timer, which starts the pump in the morning on low power for two minutes, or as long as any of the three measured outlet temperatures, Te, Ts and Tw, is higher than 40°C. A new attempt to start is made every 30 minutes. In this way, overheating and loss of available energy is avoided. When Tsol, h rises above the required 67°C, the district heating pump, PDHS, is started and the solar circuit pump activity is thereafter increased to 100%. The bypass valve, V3, protects the heat exchanger against freez-ing as it is kept open to the heat exchanger as long as Tsol, h is higher than 5°C. When the temperature is lower than that, V3 shuts and the liquid is shunted outside the heat exchanger.
7.2.4 The control of the district heating circuit In the heat exchanger, the return fl ow from the district heating system is heated from approximately 45°C to the temperature required for the outgoing fl ow, which is 65°C minimum. The three-way valve V4 is used to adjust the temperature of the outgoing water. The pump in the district heating circuit, PDHS, increases the pressure from 4 bar on the return side to approximately 7 bar on the outgoing side. The pump is active as long as Tsol, h is 65°C or higher. The fl ow sensor registers the actual fl ow rate in the district heating system circuit. When PDHW is operating the solar pump Psol, is set to operation mode, i.e. 100%, providing the design fl ow in the

Building integrated solar collectors for district heating systems
153
solar circuit. If the valve V4 on the district heating side has been closed for ten minutes, the district-heating pump is shut off and the solar circuit pump is set to its mode of 25% rotation speed, waiting for the temperature to rise before a start-up can be initiated once again. In the event that the freezing alarm is activated, the three-way valve of the district heating system circuit is opened just enough to keep the outgoing water above 15°C. By having double control functions for the pump, on both the temperature and the fl ow of the circuit, the system is made more robust.
7.2.5 Overheat protection by partial evaporationThe system is protected from overheating by control features allowing partial evaporation of the heat transfer medium (Tyfocor). The system is equipped with a 1000 l compressor-fed expansion vessel that is automati-cally refi lled after boiling. In case of boiling and stagnation, the pressure will rise to a certain limit before air is let out of the expansion vessel through a solenoid valve, maintaining this slightly higher pressure. The solar circula-tion pump is then stopped in order to prevent as much of the liquid as possible from boiling, which could expose the collectors to hammering as the hot steam condenses when meeting the cold liquid. The heat transfer medium is thereby pressed backwards into the expansion vessel. As the weight of the expansion vessel increases over a critical level, a pressure sensor triggers an alarm to the control centre. As the collectors are cooled down, the pressure in the solar circuit decreases and the Tyfocor is then pressed back into the system, due to the higher pressure in the expansion vessel, and it condenses in the solar collector. The compressor refi lls the expansion vessel with air to a certain pressure and the solar circuit is then ready for operation again. This overheat protection system was never ac-tivated during the fi rst years of operation, since the system never reached stagnation. However, the pilot plant was in stagnation several times and the control strategy had then been proved successful.
7.2.6 The importance of location A condition for the success of this solar thermal system is the carefully planned location, which makes it possible to keep the heat losses from the system very low. The solar system is situated in the outer parts of the district heating system where only relatively low temperatures are required. Also, it is very close to an area where the buildings were designed to main-tain thermal comfort using the minimum temperature of 65°C from the district heating system.

Solar thermal energy systems for building integration
154
7.3 Evaluation of the system
7.3.1 MethodologyAn evaluation of the system was carried out based on studies of collected data from the solar heating system, such as temperatures, fl ow rates, valve positions, pump activity etc. during the period 2002-07-01 to 2003-06-30. As detailed data of solar irradiation from the site were not available, an analysis of the performance of the system based on measured data was not possible. Instead simulations of the energy output of each of the collectors were performed using WINSUN, a simulation program for solar collectors, see Section 3.3.2. Climate data from Meteonorm, for a typical year in Lund, was used. Input data of the performance parameters of the collectors are shown in Table 7.2. These values are received from the manufacturer who had the collectors tested by SP Technical Research Institute of Sweden.
Table 7.2 The collector performance parameters used in WINSUN simula-tions. η0 is normally 0.83 but was considered lower due to the frosted glazing.
η0
(W/m²K) F’U0 (W/m²K)
F’U1 (W/m²K²)
b0 (-)
0.81 (0.83) 2.7 0.03 0.10
Monthly mean fl ow weighted operation temperatures in the collectors were derived from measured data and the average operation temperature over the year was calculated to 63°C and used in WINSUN. Simulation results of monthly energy output from the solar collectors during an average year and monitored monthly values of total energy output to the district heat-ing system during the investigated period were compared. Some minor deviations between these values were found, which could be explained by the fact that the irradiation varies considerably from year to year (Adsten, 2002). Also, a comparison between the climate data from Meteonorm and measured data from DTU, Copenhagen was performed in order to verify the simulation results. As Copenhagen and Malmö are close and the climatic conditions are similar it was assumed that these data give a suffi ciently good approximation of the Malmö conditions. The comparison showed that there were considerable differences between the beam irradia-tion from measured data and corresponding climate data. This, and the

Building integrated solar collectors for district heating systems
155
fact that the model is rather rough, explains the small difference between simulated and measured energy output from the collectors.
7.3.2 The overall energy yield During the investigated period from 2002-07-01 to 2003-06-30, the sys-tem delivered 189000 kWh to the district heating system, i.e. 180 kWh/m² collector area, with a peak power of 0.3 MW. The COP (i.e. the thermal energy produced per kWh electricity used for the system operation) was 24, according to measured data. The results from the simulations show an expected energy output of 183000 kWh/a, i.e. 174 kWh/m2a, which is a divergence of only 3% from the measured output. The results of annual energy output are as high as can be expected from a system with collectors in non-optimal directions.
7.3.3 The cooperation of the collectorsFigure 7.3 shows the positions of the motorized three-way valves V1 and V2 as illustrated in Figure 7.2, which alter the fl ows of the main collector sub circuits. The data is from the 20th of July 2003, a sunny clear day when the solar pump was working at 100% speed during the whole day.
0102030405060708090
100
05:0
006
:00
07:0
008
:00
09:0
010
:00
11:0
012
:00
13:0
014
:00
15:0
016
:00
17:0
018
:00
19:0
020
:00
21:0
022
:00
Val
ve p
osit
ions
(%
)
Valve V2 (% open to EW)
Valve V1 (% open to E)
Figure 7.3 The positions of the motorized three-way valves, V1 and V2, con-trolling the fl ows of the collector circuits, measured during a clear summer day, the 20th of July 2003.

Solar thermal energy systems for building integration
156
In Figure 7.4, the outlet temperatures Te, Ts and Tw, from the different collectors, (from the same day) are shown as well as the temperatures at the inlet of the heat exchanger on the solar side, Tsol,h, and at the outlet of the heat exchanger on the district heating side, TDHS,h. It also shows that the temperatures in and out of the heat exchanger, Tsol, h and TDHS, h, are stable from 07:00 to 20:00. As the temperature Tsol,h decreases below 67° in the evening, the district heating pump is stopped and no more energy is delivered to the district heating system. Both Figure 7.3 and 7.4 show that the fl ows are well controlled and result in a constant output temperature to the district heating system.
0102030405060708090
100110
04:0
005
:00
06:0
007
:00
08:0
009
:00
10:0
011
:00
12:0
013
:00
14:0
015
:00
16:0
017
:00
18:0
019
:00
20:0
021
:00
22:0
0
Mea
sure
d te
mpe
ratu
res
(°C
)
Te Ts Tw Tsol,h T DHS,h
Figure 7.4 The outlet temperatures from the three main collector circuits, Te, Ts, Tw, the temperatures at the inlet to the heat exchanger on the solar circuit side, Tsol,h, and the outlet from the heat exchanger, TDHS,h, in the district heating circuit. Data from 2003-07-20.
7.3.4 Parametric studies
Collector orientationWINSUN simulation results of the monthly energy output from the fi ve collectors during a year are shown in Figure 7.5. The west- and south-facing collectors tilted 73° give the highest peaks in summer, while the south-fac-ing vertical collector gives a more balanced output over the year. The two south-facing collectors provide some energy output during winter, when the eastern and western collectors hardly deliver any energy at all.

Building integrated solar collectors for district heating systems
157
0
10
20
30
40
50
60
70
Jan
Feb
Mar
Apr
May Jun
Jul
Aug Sep
Oct
Nov
Dec
Ene
rgy
outp
ut fr
om th
e di
ffer
ent
colle
ctor
s (k
Wh/
m²,
mon
th) West
73°
South73°
West90°
South90°
East 90°
Figure 7.5 The simulated energy output for the different collectors shown as monthly values over the year.
The monthly values of mean area weighted energy output of the system are shown in Figure 7.6, as well as results of the energy output from a system where the collectors are placed horizontally or towards south, tilted 40°. The results of annual energy output are shown in Table 7.3.
0
10
20
30
40
50
60
70
Jan
Feb
Mar
Apr
May Jun
Jul
Aug Sep
Oct
Nov
DecE
nerg
y ou
tput
from
the
diff
eren
t co
llect
ors
(kW
h/m
², m
onth
)
South 40°
Horisontal
Mean energyoutput
Figure 7.6 Simulation results of the mean area weighted energy output and the theoretical output for horizontal or south-facing 40° tilted collec-tors.

Solar thermal energy systems for building integration
158
During the winter, the mean energy output of the system is higher in comparison to horizontally placed collectors but it does not exceed the output from a collector directed towards south tilted 40°.
Table 7.3 The simulated annual energy output of the differently tilted collectors and of a horizontal and south-facing collector tilted 40°.
Collector direction
and tilt
East
90°
South
90°
South
73°
West
90°
West
73°
The total
system
South
40 °
Hori-
zontallyAnnual energy
output (kWh/m²a)90 167 263 137 190 174 343 234
It can be concluded that the high tilt of the south-facing collectors gives balance to the energy distribution over the year whereas the vertical east- and west-facing collectors give less energy during the cold season. If the tilt was 40° they would give the maximum annual output of 343 kWh/m2a, almost twice as much as they give today.
Operation temperatureThe results in Figure 7.7 show how the energy output for the different collectors and the mean (area weighted) energy output of the whole system would change if the mean operation temperature in the collectors were altered. At present the average mean operation temperature is 63°C. The collector facing south and tilted 73° gives the highest annual output, fol-lowed by the 73° tilted collector directed towards west, which gives almost the same results as the area weighted system average. The collector facing east and tilted 90° is the collector with the lowest output. Had the opera-tion temperatures instead been 40°C or 50°C, the output would have been 60-130 kWh/m²a higher. A 10°C increase in temperature reduces the mean annual energy output by around 50 kWh/m².

Building integrated solar collectors for district heating systems
159
050
100150200250300350400450500
40 45 50 55 60 65 70 75 80
Mean operation temperature (°C)
Ene
rgy
outp
ut (
kWh/
m²a
)
South 73°West 73°Mean South 90°West 90°East 90°
Figure 7.7 The theoretical energy output of the different collectors for different mean operation temperatures in the collectors and the mean values of the system.
7.3.5 Comparison of measured and simulated data Measured and simulated results of monthly values of energy output from the solar collectors during an average year are compared in Figure 7.8. The obvious differences are most signifi cant in March and September, when the collectors produced more heat than expected.
0
5000
10000
15000
20000
25000
30000
35000
Jul -
02
Aug
-02
Sep
-02
Oct
-02
Nov
-02
Dec
-02
Jan
-03
Feb
-03
Mar
-03
Apr
-03
Maj
-03
Jun
-03
Tot
al e
nerg
y ou
tput
(kW
h/m
onth
)
Measured
Simulated
Figure 7.8 Measured and simulated results of the total monthly energy output from the solar thermal system.

Solar thermal energy systems for building integration
160
The divergence can be explained by the natural climate changes from year to year. The solar irradiation varies considerably from year to year and the collector output also varies accordingly by ± 20% around the average value, according to Adsten (2002). This was further investi-gated by comparing data of global and beam irradiation measured at Denmark Technical University, Copenhagen to corresponding climate data from Meteonorm used in the simulations (a reference year based on the location of Lund). The measured data of global irradiation cor-responded well with the climate data (see Paper VI, Figure 4). However, important differences were shown between the beam irradiation meas-ured normal to the sun and the corresponding climate data, see Figure 7.9. The deviations are particularly large in March and September. This variation in beam irradiation from year to year, together with the fact that the model is rather rough, could very well explain the deviation of energy output shown in Figure 7.8. This implies that the results showing monthly values should be considered as an indication that these results are of slightly lower accuracy than the results showing annual energy output, which correspond well with measured data.
020
4060
80100120
140160
180200
Jan-
02
Feb-
02
Mar
-02
Apr
-02
May
-02
Jun-
02
Jul-
02
Aug
-02
Sep-
02
Oct
-02
Nov
-02
Dec
-02
Jan-
03
Feb-
03
Mar
-03
Apr
-03
May
-03
Jun-
03
Mon
thly
val
ues
of b
eam
irra
diat
ion
(kW
h/m
²)
MeasuredReference year
Figure 7.9 Monthly values of beam irradiation, normal to the sun, from Co-penhagen and the corresponding values used in the climate data in WINSUN.

Building integrated solar collectors for district heating systems
161
7.4 Conclusions A large solar thermal system for production of heat for the district heating system was studied. The fi ve large collectors are integrated in the façade in different directions. Simulations were performed in order to show the benefi ts of the used control strategies. The overall evaluation shows that the advanced system design for start up, stagnation and control has resulted in a well working solar collector system with high accessibility.
The design criteria are very different for a solar heating system with an immense heat load compared to a solar system for single houses. Still, there are several interesting design features in this system that are interesting to consider also for small scale systems, e.g. robust components and good control strategies such as partial evaporation and anti-freezing protection of the heat exchanger.
The control of the fl ows through the fi ve collectors is designed to even out the temperature differences between the different collectors. The analysis shows that this control strategy results in a balanced fl ow over a day, with the highest fl ow rate in the most illuminated collectors. The output temperature is shown to be fairly constant over the day. It is also shown that the control feature for delivering heat to the heat exchanger at a temperature of at least 67°, works according to the design and with a high reliability. The temperature going into the heat exchanger and the temperature going out to the district heating system are relatively constant during the time heat is delivered.
The parametric studies using WINSUN show that, as expected, the collectors tilted at 73° south give the highest energy output and that the vertical collectors in east and west give the lowest output. The two collec-tors tilted 73º give the highest output in summer, the two south-facing collectors give the highest output during spring and autumn and the east and west collectors contribute to a uniform energy distribution over the day. If all the collectors had been mounted towards south tilted 40°, the total energy output would have been increased by a factor of approximately 2. However, the collectors were installed as a replacement of the old façade and the low total material costs for façade and collectors taken together is considered as a compensation for the lower energy output.
Detailed climate data from the location was not available, and simula-tions in WINSUN were therefore performed to show the expected thermal output. The simulations give a good indication of the energy output. The accuracy of the simulation results of annual energy output is considered fairly high while the monthly values are diffi cult to predict due to climate changes from year to year, especially variations in the beam irradiation.

Solar thermal energy systems for building integration
162
This was shown by comparisons of climate data used in simulations and data measured in Copenhagen.
This evaluation shows the importance of having access to accurate and detailed climate data when evaluating the performance of solar collectors. It also shows that climate data from Meteonorm can be used for simulations of annual output when there are no measured irradia-tion data available.

Optimisation ot module geometries for concentrating façade ...
163
8 Optimisation of module geometries for concentrating façade integrated collectors
This chapter presents an overview of Paper VII, Optimisation of refl ector and module geometries for static low-concentrating, façade integrated pho-tovoltaic systems, which is published in Solar Energy Materials and Solar Cells. The work was also presented at the ISES Solar World Congress in Gothenburg in 2003.
8.1 IntroductionThe geometrical design of a static, façade integrated, concentrating solar collector has been optimised for maximum annual energy output when operated in southern Sweden. The module tilt and the geometry of the parabolic refl ector have been investigated by measurements and simula-tions and the different geometries are compared.
The concentrating system could be used either as a photovoltaic collec-tor, a thermal collector or a hybrid PV/thermal collector, generating both electricity and thermal energy. This work deals only with the geometrical design and the electricity generation from the collector as a photovoltaic system, which should however also be representative for the thermal gen-eration as the optimisation aims to fi nd the highest annual irradiation on the absorber.

Solar thermal energy systems for building integration
164
8.2 Collector designThe collector had previously been produced as a prototype of which an illustration is shown in Figure 8.1. This system has a concentration ratio of 2.96 and includes parabolic refl ectors and photovoltaic string modules, as well as EPS (expanded polystyrene) insulation. Due to the insulation material attached to the back of the refl ector sheet metal, the façade ele-ment can serve as an integral part of the building envelope. The mirrors are made of anodised sheet aluminium, which offers good mechanical properties and has a total solar refl ectance of 81% for wavelengths shorter than 1100 nm.
Figure 8.1 Cross section of a static, two dimensional concentrating photovoltaic system intended for façade integration. The system includes photo-voltaic string modules and parabolic aluminium refl ectors, as well as EPS insulation. (Brogren et al., 2003)
This system can be used either unglazed and passively cooled or with a glass surface placed vertically in front of the whole façade element in order to protect and prolong the lifetime of the refl ector material. As photovoltaic modules give higher output at lower temperatures, it is benefi cial to use active cooling combined with heat generation, especially when glazing is used.

Optimisation ot module geometries for concentrating façade ...
165
The refl ector is shaped as a parabola (see Figure 2.9) with its optical axis tilted at an angle ν to the horizontal, as shown in Figure 8.2. As also shown in Figure 2.9, all irradiation incoming parallel to the optical axis or from higher solar altitude angles will fall between the focal point, F, and the refl ector, and it is therefore suitable to place an absorber here. The letter h denotes the height of the glazing and a the width of the module plane, which can be tilted back and forth around the focal point. In the fi gure, φ is the angle between the vertical glazing and the optical axis of the refl ector. The solar altitude angle projected in the north-south plane is denoted by αNS and the angle between the horizontal and the module plane is denoted β. The geometrical concentration ratio, C, of the system is given by Equation 40.
Optical axis
ν βHorizontal
φ
p
h
Module
a
ReflectorαNS
F
Figure 8.2 Illustration of the geometry of the refl ector and the module plane of the collector.
Similar asymmetric concentrating collector systems for façade integration have been evaluated by measurements (Mallik et al., 2004; Mallik et al. 2006; Zacharopoulos et al. 2000) and found to increase the performance by 62% for a geometrical concentration ratio of 2.0.

Solar thermal energy systems for building integration
166
8.3 Measurements and calculations of optical effi ciency
In order that measurements may be performed for several different sys-tem geometries, a prototype with a parabolic refl ector and an adjustable absorber plane was designed, see Figure 8.3. The module plane of this prototype can be tilted, as can the entire prototype. This means that the system can be evaluated for different values of angle β and for different transverse incidence angles, but the angle ν is constant at 25°.
Measurements of the short circuit current ISC from a photovoltaic thin fi lm CIGS (Copper Indium Gallium Diselenide) module that was placed on the module plane were performed for different geometries. The meas-urements were carried out indoors using the solar simulator described in Section 3.2.1. As the absorber plane was tilted the active absorber width, a, was altered. The thin fi lm cell was shaded with aluminium foil to obtain the correct module area to be exposed for each value of the angle β, see illustration to the right in Figure 8.3. The short circuit current of the cells represents the irradiance, I, and is proportional to the module area. The CIGS cells are suitable for this purpose as the vertical cells are all aligned in one row and can be partly shielded perpendicular to the length of the cells without interrupting the current.
Figure 8.3 To the left, the prototype with adjustable absorber plane. To the right, an illustration of a photovoltaic thin-fi lm cell shielded with aluminium foil to achieve the right area.

Optimisation ot module geometries for concentrating façade ...
167
The entire prototype was tilted so that measurements could be performed for different transverse incidence angles. Two basic geometries, Geometry A and Geometry B, were analysed in detail. In both geometries, the angle ν, is 25° and the distance p is 158 mm. For Geometry A, the module tilt angle, β, is 20°, which results in a geometrical concentration ratio C of 2.96. For Geometry B, β is -15° and C is 3.44. Because of the difference in absorber tilt angles, the absorber width a is slightly higher for geometry A than for Geometry B. The positive module tilt gives the system a better performance at low solar altitudes angles, as direct irradiation can fall on the absorber. The negative module tilt of Geometry B was chosen because it gives the system a higher geometrical concentration ratio and thereby possibly a cheaper absorber.
Figure 8.4 Geometries A and B. For Geometry A, the angle β is -20° and in Geometry B, β is -15°. In both geometries the angle ν is 25º.
Measurements were also performed on the CIGS modules when mounted vertically on the wall, shielded to the corresponding sizes, as references. The results of short circuit current per cell area for Geometry A, B and for the vertical reference cell are presented in Paper VII, Figure 12 and 13.
The optical effi ciency for beam irradiation for each angle was then calculated by Equation 55 for every tenth south-projected incidence angle between 0° and 70°, giving the transverse incidence angle dependence.
(ref.) SC
(conc.) SC0b IC
I
⋅=η Eq. (55)

Solar thermal energy systems for building integration
168
The accuracy of the measured optical effi ciency for higher transverse in-cidence angles was considered too low, due to the limitations of the solar simulator (see Chapter 6). Therefore the optical effi ciency for angles higher than 40° was also calculated according to Equation 56. This is referred to as the calculated optical effi ciency and is also denoted RT(θT). The calcula-tion for angles lower than ν is shown in Equation 57. A constant k=0.69 that represents the effective refl ectance was introduced in Equation 56 to get a good fi t to the results of optical effi ciency. The relatively low value of the effective refl ectance, k, is explained by multiple refl ections, optical imperfections and resistive losses in the photovoltaic cell. The calculation results are shown in Figure 8.5.
)cos(
)90cos(1)1(
)cos(
)90cos())90cos()cos(()(
T
T
T
TTTTT
Ckk
h
aahkR
θθβ
θθβθβθ
θ
−−°−+=
=⋅
−−°⋅+−−°⋅−⋅⋅=
θT >ν Eq. (56)
θT <ν Eq. (57)
)cos(
)90cos(1)(
T
TTT C
Rθ
θβθ
−−°⋅=
0,00
0,10
0,20
0,30
0,40
0,50
0,60
0,70
0,80
0,90
1,00
0 10 20 30 40 50 60 70 80 90
Transverse incidence anlge, θ T (°)
Opt
ical
eff
icie
ny, η
0b (
-)
Geometry A
Geometry B
Figure 8.5 The calculated optical effi ciency RT(θT) for the two system geometries. The values are signifi cantly higher for incidence angles greater than the angle of the optical axis (25°) as this means that the irradiation is concentrated.

Optimisation ot module geometries for concentrating façade ...
169
Figure 8.6 shows the resulting incidence angle dependencies in the trans-verse plane for Geometry A and B, based on measurements up to 40º and on calculations for higher angles.
0,0
0,1
0,2
0,3
0,4
0,5
0,6
0,7
0,8
0,9
1,0
0 10 20 30 40 50 60 70 80 90
Transverse incidence angle, θ T (°)
Opt
ical
eff
icie
ny, η
0b (-
)
Geometry A
Geometry B
Measuredvalues
Calculatedvalues
Figure 8.6 The model of optical effi ciency according to measured values for θT <40° and calculated values for θT >40°.
For angles θT below ν, the concentrator is not used and no light is refl ected, yet some irradiation reaches the module directly, more so for Geometry A than for Geometry B. For θT over 70°, all irradiation reaches the module directly without refl ections, which means that the optical effi ciency is equal to 1. The measured values of lower incidence angles correspond well to the calculated values.
8.4 Analysis of long term outdoor measurements
A long term outdoor evaluation of the prototype of Geometry A had previously been carried out at the Älvkarleby test facility. The results, thus including both diffuse and direct irradiation, show that Isc(conc.) is a factor of 2.0 higher than Isc(ref.) (see Paper VII, Figure 17). This means that the geometrical concentration factor of 2.96 in combination with the optical losses results in a real concentration factor of approximately 0.7, which is similar to the results achieved by (Mallik et al., 2004; Mallik et al. 2006; Zacharopoulos et al. 2000).

Solar thermal energy systems for building integration
170
An analysis of the measured optical effi ciency for beam irradiation η0b(θT) was also performed, which showed a relatively good overall agree-ment with the results in Figure 8.6 (see Paper VII, Figure 18). For θT = 40°, the outdoor measurements show a η0b value of 0.60-0.72, while the estimated value is 0.78. The infl uence of the diffuse irradiation scattering and of the aged and dirty refl ectors explains this difference.
8.5 Simulations of annual energy yield Simulations of the annual energy output from different system geometries were performed using the MINSUN simulation program. Glazing in front of the collector was considered in these simulations. The results of optical effi ciency for beam irradiation for different transverse incidence angles were used as input to the program, which calculates the incidence angle dependence as a product of the optical effi ciency in the transverse plane and the infl uence given for the longitudinal plane, basically the incidence angle dependence of the glazing. In the calculations, b0 was set to 0.25. Read more about MINSUN in Section 3.3.1.
The MINSUN results gave the annual irradiation on a south facing vertical surface, with the optical losses of the concentrating system de-ducted. The annual irradiation on the absorber plane of the collector is then calculated by multiplication by the concentration ratio, C. Thereafter, the annually produced electricity yield is calculated by multiplying the result by the effi ciency of the photovoltaic module. In the calculations, the effi ciency of the photovoltaic module was set to 13%, a common value for thin fi lm photovoltaic cells (Shell Solar, 2003).
Simulations of altered system geometries were also performed. The parabolic curves of the refl ector were rotated in the simulations so that the performance of geometries with differently tilted optical axes (varied angle ν) could be calculated. This was accomplished by shifting the input data of optical effi ciency in the north-south plane to the left or right on the input row, for tilting the optical axis forwards or backwards. As the program will consider the whole system as tilted, the angle β will be al-tered but the angle between the module plane and the optical axis remains unchanged. An illustration of how the geometries were altered is shown in Figure 8.7. The fi gure shows that the concentration ratio will increase as the angle ν increases and vice versa, because the height, h, relative to the module width, a, is increased. As the whole systems are tilted, the module tilt angles β are also altered.

Optimisation ot module geometries for concentrating façade ...
171
ν=25°ν=15° ν=35°C<C 0
C>C0C0
Figure 8.7 The geometries that result from tilting the entire system forwards and backwards, adjusting the refl ector length to the truncation of the glazing. The geometry in the middle is the original system design of Geometry A.
8.6 MINSUN results and annual electricity production
The results of the simulated annual electricity production for different geometries of the concentrating system, based on Geometry A and B, are shown in Figure 8.8. The electricity yield per cell area and per glazed area are shown in the fi gure for varying tilt angles of the optical axis, ν. The horizontal lines show the calculated yield per cell area from the vertical fl at reference module and also for a reference module that is shaded up to 12°, as this is a probable situation for vertically placed photovoltaic cells. The concentrator module is insensitive to shadowing up to the incidence angle equal to the optical axis.

Solar thermal energy systems for building integration
172
0102030405060708090
100110120130
55 50 45 40 35 30 25 20 15 10 5 0 -5
Tilt of the optical axis, ν (°)
Ann
ual e
lect
rici
ty y
ield
per
ab
sorb
er a
rea
(kW
h/m
²a)
0
10
20
30
40
50
60
70
Ann
ual e
lect
rici
ty y
ield
per
gla
zed
vert
ical
are
a (k
Wh/
m²a
)
A - electricity per absorber areaB - electricity per absorber areaA - electricity per glazed areaB - electricity per glazed area
Reference cell
Shaded referencecell
Figure 8.8 The results of energy yield, shown per absorber area and per vertical glazed area, for different geometries of the concentrating system.
The annual electricity yield per absorber area increases with higher values of angle ν (as the concentration ratio C increases) until the tilt of the optical axis is so high that the system does not accept a large share of the irradiation. For ν angles higher than 45° the annual yield is decreased. The annual yield per glazed area decreases with increasing values of angle ν. It can also be seen that the graphs for Geometry A and B are similar but slightly displaced from one another and that Geometry B gives a slightly higher yield per absorber area, compared to Geometry A, at values of ν up to 45°, due to the higher concentration ratio. Geometry A, on the other hand, gives a higher yield per glazed area, which is explained both by the lower concentration ratio and the lower refl ection losses.
The highest annual energy yield per cell area is 120 kWh/m²a, achieved by Geometry B at ν = 35°, when the concentration ratio, C, is 4.65. The simulations show that the reference cell would give 70 kWh/m²a and, if shaded for θT from 0° to 12°, 60 kWh/m²a. The calculated electricity production for this concentrating system is thus 72% higher than that of the unshaded vertical reference module, and 100% higher than a shaded module. In this geometry, the module is tilted slightly backwards (β=-25°), which implies a lower energy generation for low solar altitudes.
However, at ν=35°, Geometry A gives almost as high a yield, 118 kWh/m²a, with C=4.00 (and β=10°).
The measured systems, where ν = 25°, show slightly lower values of the estimated annual yield, 112 and 118 kWh/m²a for Geometry A and B re-spectively, thus 60% and 68% higher than the unshaded reference cell.

Optimisation ot module geometries for concentrating façade ...
173
As long as the angle ν is between 25º and 45º the annual yield is not lower than 93% of the maximum yield.
However, a higher inclination of the optical axis means that the ac-ceptance of irradiation from low solar altitude angles is more limited. This results in a higher summertime production at the expense of a lower wintertime production. This effect can be observed in Figure 8.9, which shows the annual distribution of the electricity yield per module area for different values of angle ν (0°, 25° and 45°) of the Geometry A system and for the vertical reference cell. A low absorber tilt angle, β, also limits the production in winter.
0
5
10
15
20
25
30
35
Jan
Feb
Mar
Apr
May Jun
Jul
Aug Sep
Oct
Nov
Dec
Ele
ctri
city
yie
ld p
er m
odul
e ar
ea (
kWh/
m²
mon
th)
ν=45°
ν=25°
ν=0°
verticalreference
Figure 8.9 Annual distribution of the electricity yield per module area for dif-ferent system geometries and for the vertical reference cell. The higher the tilt angle of the optical axis, ν, the higher the summer production and the lower the winter production.
8.7 ConclusionsThe aim of this investigation was to fi nd the system geometry that would give the highest energy yield per module area. The simulations showed that the difference in annual yield between the two basic geometries A and B (where the difference is the module tilt angle, β) is fairly small. What is more important is to fi nd the right tilt angle of the optical axis. The choice of the absorber tilt angle is more a matter of fi ne adjustment.

Solar thermal energy systems for building integration
174
The presented results suggest that the most effi cient system, on an annual basis, should have a tilt angle ν, of 35°. However as long as the inclination is between 25° and 45° the annual yield is not lower than 93% of the maximum yield. At ν = 35° the energy yield of Geometry B is 120 kWh/m2a, i.e. slightly higher than that of Geometry A, which is 118 kWh/m2a. As Geometry B has a slightly higher concentration ratio there is a chance that it could be cheaper to produce, although this must be further investigated before a conclusion can be made.
The results show that the annual energy yield per module area will increase with a higher tilted optical axis, up to where the tilt of the optical axis, ν, is 35° and 45° respectively for Geometry A and B. The backwards-tilted parabolic refl ector has a larger vertical area compared to the module area and thus a higher geometrical concentration ratio. This means that the cost effectiveness of the whole concentrating system also may be improved by increasing the tilt of the optical axis.
However, a highly tilted optical axis gives a high energy generation in summer at the expense of a lower generation in winter, and vice versa. Which design is the more suitable, must therefore be estimated from considerations of the patterns of energy demand. Of course, if the sys-tem is grid connected, the immense energy demand makes this aspect unimportant, and the inclination of the optical axis should then be 35°. Otherwise it would be reasonable to suggest a system where the inclina-tion of the optical axis is between 25° and 35° and the absorber tilt angle is positive, to give a fairly well balanced energy output over the year. The original design, Geometry A, is therefore considered a good design for southern Sweden.
Another aspect is the cost of the façade. The building element consists of glazing, insulation wires etc. and the cost of these materials, as well as the modules, should preferably be covered by the energy savings per glazed area of the building element, or at least be kept at a reasonable level. However, since it is not uncommon that a large amount of money is spent on façade material, this design may be a very price worthy solution. Also, the collector could very well give an aesthetically appealing façade.
The anodised aluminium offers good solar refl ectance but there are also other refl ector materials available, which give considerably higher solar re-fl ectance. For example, Miro sheets from Alanod have a solar refl ectance of 90% at normal incidence (Brogren et al., 2000). By using these materials the system performance could be increased by almost 10 %, although at a higher cost.
In a line-focusing concentrating system, such as the parabolic refl ec-tor system optimised in this work, the concentration of solar radiation may result in high cell temperatures, which will decrease the effi ciency of the system. One way of eliminating, or at least signifi cantly reducing ,

Optimisation ot module geometries for concentrating façade ...
175
this problem is to cool the photovoltaic modules. There are several cooling methods available, but work by Edenburn (1980) and by Rönnelid et al. (1999) indicates that active water cooling is the most cost effective method for low-concentrating line-focusing systems. In addition to increasing the electric power by reducing the cell temperature, if operated at medium temperatures (about 30–55°C depending on cell type), active water cool-ing makes it possible to utilize the warm water produced for heating or pre-heating of domestic hot water or space heating. If a hybrid absorber is considered, the demand of thermal energy and the pattern of the heating demand should preferably also be considered in the geometrical design of the collector.
Further research on the costs of the materials and the production of the collector is required before a fi nal statement can be made about which geometry and materials to choose in order to minimize the energy costs.
It can be concluded that the use of photovoltaic modules and parabolic aluminium refl ectors in static, low-concentrating systems designed for building integration has a potential to signifi cantly increase the annual electricity production per cell area, compared to planar vertical modules of the same type. Given the low cost of the highly refl ective anodised alu-minium mirrors and the insulation material in combination with a simple manufacturing process, the kinds of systems evaluated in this work have a potential to reduce the cost of solar energy.

Solar thermal energy systems for building integration
176

Summary and discussion
177
9 Summary and discussion
The objective of this work has been to fi nd good design solutions for cost effective solar thermal collectors and solar thermal systems. The focus con-cerning the collectors has been set on concentrating, building integrated collector designs, as these are features that give potential for cost effective products. Collector designs for façade integration and roof integration are investigated. The work on solar thermal systems is intended to highlight important aspects of system design and also to show examples of how to in-tegrate collectors into buildings, depending on different circumstances.
9.1 Collector designsThe collector designs discussed in this work are concentrating designs intended for integration into building elements. The ideas for this type of concentrating collectors are not entirely new, but they have been modifi ed for different applications.
9.1.1 Roof integrated designsThe evaluated collector designs intended for integration in non-insulated roofs are interesting as they are rather thin, they only use little insulation material, and the use of commonly used corrugated steel for the collector box should make the production cheap and easy. It should therefore be easy to integrate the collectors as roofi ng material that could be produced in optional lengths and the assembly and the installation should be eas-ily performed. The results of the evaluation showed that the maximum annual energy output per glazed collector area would be 320 kWh/m2, 330 kWh/m2 and 280 kWh/m2, for the evaluated Collectors A, B and C respectively, in Stockholm climate, at an operating temperature of 50°C and with 45° tilt angle. These results are slightly lower than desired. Col-lector B, with the narrow strip absorber and circular refl ector, is considered the most promising design, as it shows the lowest heat loss coeffi cient and

Solar thermal energy systems for building integration
178
only requires little absorber material in comparison to the fl at reference collector, Collector A. Although the concentrating Collector C, with the tubular absorber, would most likely be the cheapest to produce it also in-volves rather high heat losses. Before any of these collectors are produced on a larger scale it is desirable to further reduce the heat losses.
A suggestion for further development is to decrease the acceptance angle of the refl ectors of Collector B to enhance the concentration on the absorber. As the collectors are designed today they can be mounted with the absorbers either in the north-south or the east-west direction. If Collector B is mounted with the absorbers in the north-south direction it is important to keep the acceptance interval at 80° at the least, in order to have the collector operating at least 5 hours in the middle of the day in summer.
After the experimental tests with these collectors were fi nished, a similar concentrating collector, well suited for integration in non-insulated roofs, with higher concentration ratio, has been developed by a private investor (Solarus, 2008) and is now available on he market.
9.1.2 Façade integrated designsThe geometry of a concentrating façade integrated PV/thermal hybrid collector for higher latitudes, e.g. southern Sweden, has been optimised for maximal annual energy generation. The collector has enough back insulation to allow it to be part of a façade element and it is fl exible for production in variable lengths.
If the inclination of the optical axis of the parabolic refl ector is increased, it gives a higher concentration ratio, meaning a lower requirement of mod-ule area per façade area. The results from measurements and simulations show that best results are achieved for geometries where the inclination of the optical axis is between 25° and 45°. In this range of angles the results do not depend so much on the tilt angle of the module plane. The maxi-mum annual electricity production for a photovoltaic cell in the evaluated concentrating systems was found to be 120 kWh/m² per module area, 72% higher than that of the unshaded vertical reference module. This result was obtained for a system with a tilt of the optical axis, ν, of 35°, and with the concentration ratio, C = 4.65. With this geometry the module plane is tilted backwards, β = -25°, which means that no direct irradia-tion can fall on the module without refl ection on the refl ector, implying lower energy generation for low solar altitudes. A high tilt of the optical axis gives a high energy generation in summer at the expense of a lower generation in winter. Which design is the more suitable, must therefore be estimated from considerations of the patterns of energy demand. As it

Summary and discussion
179
is often is desired to achieve a more evenly distributed solar energy yield over the year the previously designed prototype with ν = 25°, β = 20° and C=2.96 also seems a promising design, which also gives relatively high total annual output.
For photovoltaic cells accepting concentrated light, cooling is very important in order not to reduce the effi ciency. There are even risks of damaging the cells at too high concentration on the cells. Therefore, if photovoltaic cells are to be applied in this system, a promising design feature is to use a combined solution for cooling of the photovoltaic cells and thermal energy generation.
It could also be considered to produce this collector design with only thermal absorbers, as the optimisation is just about fi nding the design that accepts the most irradiation.
9.1.3 Future development For both the roof integrated and the façade integrated collector designs it would be of interest to further investigate the production costs.
Another interesting idea for further work is to design and investigate the performance of a concentrating collector based on an evacuated tube collector with refl ectors for higher irradiance. It could be either for roof or façade integration. Evacuated tube collectors are well suited for high temperatures as the heat losses are so low.
9.2 Solar thermal system designsThere is a great variation in design of the solar thermal systems used today and it is diffi cult to fi nd direct answers to how to best design a solar ther-mal system, as every system is unique and as the energy demand depends on the users and their habits. However, the importance of knowing the energy demand and its distribution over the year, before designing a solar thermal system, should be stressed.
As solar thermal energy is only complementary to other energy sources it is also important to fi nd the best auxiliary energy source for the system, or a system design that is suitable for combining solar thermal energy with the chosen auxiliary energy source. In the same way as e.g. heat pumps, solar collectors are preferably operated at low temperatures, which can cause a diffi culty in priority between the two components. Often it is more suitable to combine solar collectors with a pellet boiler which is operated at high temperatures, and it is also benefi cial to be able to shut off the

Solar thermal energy systems for building integration
180
boiler during summer. However, it also depends much on the design and the temperature requirements of the heating system in the building.
Solar thermal system designs have been discussed in this work with the focus on different aspects. In Chapter 4 solar systems are investigated with the focus on houses with low energy demand and in Chapter 7 several features of solar systems are investigated in the analysis of a grid connected solar thermal system with façade integrated collectors.
9.2.1 Solar systems for houses with low energy demand
The work performed for the International Energy Agency, Task 28 – Sustainable solar housing shows different solutions of how to reduce the emissions of greenhouse gases and the use of non-renewable energy in buildings.
It is discussed that from an economical point of view it is not always evident to design a high performance house with a hot water radiant heating system, as it could be suffi cient to heat the house with low power heat in the supply air. This is demonstrated in Solution 1a, an extremely well insulated building that only requires very low power for space heat-ing, which is why there is no water based heating system, just an electric resistance heater in the ventilation system. In order to reach the target of non-renewable energy use of maximum 60 kWh per living area and year, solar energy is used for heating domestic hot water, replacing electric resistance heating.
For a building with slightly lower insulation standards, as in Solution 2, the higher space heating demand means that higher power is required. Therefore it is suitable to use a water based heating system that can give higher power to the building. Only renewable energy is used, bio pellets and solar energy, in a solar combi system, i.e. a water based heating system where solar energy can contribute to the heating of both domestic hot water and space heating. This solution is by far the best from an environmental point of view, as the resulting green house gas emissions are less than half the emissions of Solution 1a. This shows the importance of using renewable energy even where the building envelope is very well insulated.
The break point where the space heating demands are so low that a water based heating system is not economically justifi ed must be defi ned in each case separately as the cost of a heating system and the solar collector gains depends on the building design and the users’ habits of energy use.
Evacuated tube collectors are suitable for use on these buildings with their shortened heating season, as they use low irradiation very well.

Summary and discussion
181
Another aspect of combi systems is that the use of a common stor-age tank for space heating and hot water heating may be benefi cial to the system effi ciency as the heat withdrawal from the tank due to space heating demands can lower the tank temperature and increase the solar collector effi ciency.
9.2.2 Solar system design featuresThe solar thermal systems for low energy houses were designed to almost cover the summer energy demand. This strategy was chosen so as not to overdimension the system and risk overheating, although there are means to deal with this issue today, such as the use of partial evaporation of the collectors. This strategy was applied for both solar domestic hot water systems and solar combi systems, as the benefi ts from designing larger solar combi systems for high performance houses are few. Most of the presented results for solar thermal systems in high performance houses are applicable also for standard houses, particularly for solar domestic hot water systems. For combi systems in standard houses it can be interesting to design the collector slightly larger if good overheating protection is applied.
One of the parametric studies shows how much the collector area needs to be increased when the tilt angles are higher or lower than the optimal angle for summer production, and shows the solar fraction to be expected for different tilt angles.
It is also shown that the volume of the storage tank has a fairly low infl uence on the energy output, although a minimum volume is crucial and too large a tank gives unwanted heat losses.
According to simulation results an external heat exchanger with a strati-fying unit is a more profi table design compared to internal heat exchangers. For internal heat exchangers a higher fl ow rate gives higher output while a lower fl ow is more benefi cial when an external heat exchanger is used, as the tank water can be kept well stratifi ed.
9.2.3 Benefi cial circumstances for investments A good advice concerning investments in solar thermal systems is to install them when other investments are required, such as a new hot water tank, a new boiler or new roof or façade material, so that good planning and lower costs can be achieved.
The solar thermal system described in Chapter 7, which is delivering heat to the forward side of the district heating system in Malmö, has been installed as a replacement of the old façade. This is why the fi ve large col-

Solar thermal energy systems for building integration
182
lectors are integrated in different directions in the façade. The fl ow through the different collectors are controlled by an advanced control system.
As the system in question is connected to the district heating system, the temperatures are important. The temperature delivered to the forward side must be high enough to give thermal comfort in the buildings, yet low enough not to cause to high thermal losses. Because of this, one of the most important issues is the location of the system. This system is placed in the outer parts of the district heating grid, which means that the temperature requirements are not as high as for some of the other produc-tion plants in the district heating system. The minimum temperature for delivery to the grid is 70º and the buildings in this particular area were actually designed to maintain thermal comfort with only 65º. This is another benefi cial circumstance, as it facilitates the delivery of heat with only low heat losses.
For locations in the city where land is expensive, integration into the façades is an interesting feature from an economic point of view.
9.2.4 Important design features of automated systems
An important feature of the above mentioned system (discussed in Chapter 7) is the highly automated and robust control system which makes the system as reliable as it has proved to be. One very important aspect is the overheating protection. In case of overheating, the collectors are automati-cally evacuated, by partial evaporation, a practice which is increasingly common today. Nevertheless it is important to point out the importance of this feature.
Other features are the many control strategies to stop the delivery of energy to the grid when temperatures are too low or the alarm transmitted when the system is short of electricity.
9.3 Future outlookThe world may soon be facing an environmental disaster if we do not take action now to mitigate the climate changes. Solar energy is one part of the solution that must be found. With solar thermal energy there is potential for signifi cant reductions of green house gas emissions and therefore we need to use it much more than today.
It is hoped that the presented results and observations concerning design features of solar collectors and solar thermal systems can provide inspira-

Summary and discussion
183
tion for product developers, architects, constructors, building owners or anyone interested in these matters.
It would be benefi cial to the building industry if more prefabricated building integrated solar collectors were available on the market, as they give potential for cost reductions in terms of saved time and material and bought energy. The use of building integrated collectors can also give a building an interesting and aesthetically appealing façade.
It is important that the issue of energy use is put on the top of the agenda when planning for new buildings, in order to enable the implementation of cost effective solutions that can reduce energy use. Today this issue is often brought up too late in the construction process, leading to an exces-sive use of energy in the fi nal construction.
We should use solar energy in the best possible way. This means taking into account all technical facts and other important information, such as user behaviour, available energy systems and location, that can improve the function and cost effectiveness of solar energy systems.

Solar thermal energy systems for building integration
184

References
185
References
Adsten, M. (2002) Solar thermal collectors at high latitudes. Design and performance of non-tracking concentrators. Doctoral thesis, Uppsala University, Sweden. ISBN 91-554-5274-4.
Adsten, M., Helgesson, A. & Karlsson, B. (2005) Evaluation of CPC-col-lector designs for stand-alone, roof- or wall installations. Solar Energy 79 (6), pp 638-647.
Brogren, M., Nostell, P. & Karlsson, B. (2000) Optical effi ciency of a PV-thermal hybrid CPC-module for high latitudes. Solar Energy 69 (1-6), pp. 173-185.
Brogren, M., Wennerberg, J., Kapper, R. & Karlsson, B. (2003) Design of concentrating elements with CIS thin-fi lm solar cells for façade integra-tion. Solar Energy Materials and Solar Cells 75 (3 4) pp. 567-575.
Butti, K. & Perlin, J. (1980) A golden thread: 2500 years of solar architecture and technology, Palo Alto, California. ISBN: 0-917352-07-6
Chant, V.G. & Håkansson, R. (1985) The MINSUN simulation and op-timisation program, Application and users guide. A report for IEA SH & C, Task VII, Ottawa.
Dalenbäck, J.O. (2005) Solar thermal market development in Europe, Pro-ceedings of Northsun 2005, Vilnius.
Dessus, B. & Pharabod, F. (2000) Vad vet jag om solenergi, Presses Uni-versitaires de France, ISBN 91-88992-28-4.
Doebelin, E.O. (1990) Measurement Systems Application and Design, Chpt 8.4, ISBN 0-07-100697 4
Duffi e, J.A. & Beckman, W.A. (1991) Solar Engineering of Thermal Proc-esses, 2nd edn. Wiley Interscience, New York.

Solar thermal energy systems for building integration
186
Edenburn, M. W. (1980) Active and passive cooling for concentrating pho-tovoltaic arrays, Fourteenth IEEE Photovoltaic Specialists Conference 1980, San Diego, USA.
ESTIF (2006) Solar thermal markets in Europe, trends and market statistics 2005, Report from ESTIF, European Solar Thermal Industry Federa-tion, www.estif.org.
ESTIF (2007) Solar thermal action plan for Europe, heating and cooling from the sun, Report from ESTIF, European Solar Thermal Industry Federation, www.estif.org.
Eur’ObservER (2007) Solar Thermal Barometer, Systemes Solaires – Le Journal des Energies Renouvelables n° 180, 2007. www.energies-re-nouvelables.org.
European Commission (1997) Energy for the future: renewable sources of energy, White paper for a community strategy and action plan, COM(97)599 final (26/11/1997). http://europa.eu/documents/comm/white_papers/pdf/com97_599_sv.pdf
Frank, E. (1959) Electrical measurement analysis, chapters 10 and 13, McGraw-Hill, New York.
Gajbert, H. (2007) Using active solar energy in Sustainable Solar Housing, Vol. 1: Strategies and Solutions, Hastings, R. & Wall, M. (editors), pp 28-32, ISBN 978-1-84407-325-2, Earthscan, London.
Gajbert, H. & Smeds, J. (2007) Apartment building in the cold climate, Renewable Energy Strategy, in Sustainable Solar Housing, Vol. 1: Strat-egies and Solutions, Hastings, R. & Wall, M. (editors), pp 156-170, ISBN 978-1-84407-325-2, Earthscan, London.
GEMIS (2004) GEMIS: Global Emission Model for Integrated Systems, Öko-Institut, Darmstadt, Germany.
Hastings, R. & Wall, M. (2007) Editors, Sustainable Solar Housing, Vol. 1: Strategies and Solutions, ISBN 978-1-84407-325-2, Earthscan, London.
Hausner, R. & Fink, C. (2002) Stagnation behaviour of solar thermal systems, A Report of IEA SHC – Task 26, AEE INTEC, Austria. http//www.iea-shc.org/.
Heidt, F.D. (1999) Bilanz Berechnungswerkzeug, NESA-Datenbank, Fach-gebiet Bauphysik und Solarenergie, Universität-GH Siegen, D-57068 Siegen, Germany

References
187
Hellström, B, (2005) Calculation and measurement methods for the perform-ance of solar collectors. Doctoral thesis, LTH, Lund University, Sweden. ISBN 91-85147-06-0.
Håkansson, H. & Fredlund, B. (1999) A new solar simulator facility for calorimetric measurements on windows and shading devices in 5th sym-posium on Building Physics in the Nordic Countries, Gothenburg.
Håkansson, H. (2003 a) A parallel beam solar simulator for testing of solar components, Proceedings of ISES Solar World Congress 2003, Gothenburg, Sweden.
Håkansson, H. (2001) Solar laboratory, in Solar Protection in Buildings, Wall M., Bülow-Hübe H. (editors), pp. 49-66, Lund University. ISRN LUTAD/TABK--3060-SE.
Håkansson, H. (2003 b) Solar laboratory, In Solar Protection in Buildings: Part 2, Wall M., Bülow-Hübe H. (editors), pp. 29-67, Lund University. ISBN 91-85147-00-1.
Johansson, L., Gustafsson, L., Tullin, C. & Cooper, D. (2003) Emissions from domestic bio-fuel combustion, calculations of quantities emitted, SP Report 2003:08, SP Technical Research Institute of Sweden, Borås, Sweden. ISBN 91-7848-939-3.
Karlsson, B. & Wilson, G. (2000) MaReCo design for horizontal, vertical or tilted installation. Proceedings of Eurosun 2000, Copenhagen, Denmark.
Kjellsson, E. (2004) Solvärme i bostäder med analys av kombinationen solfån-gare och bergvärmepump, Licentiate thesis, Lund University, Sweden, report TVBH--04/3047--SE(170), ISBN 91-88722-32-5.
Kovacs, P. & Pettersson, U. (2002) Solvärmda kombisystem, en jämförelse mellan vakuumrör och plan solfångare genom mätning och simulering, SP rapport 2002:20, SP Technical Research Institute of Sweden, Borås, Sweden, ISBN 91-7848-912-1.
Kvist, H. (2005) DEROB-LTH for MS Windows, User Manual Ver. 1.0 –20050813. Energy and Building Design, Lund University, Sweden. www.derob.se.
Larsson, S. (2006) http://www.maston.se/melacs
Mallick, T.K., Eames, P.C., Hyde, T.J. and Norton, B. (2004) The design and experimental characterisation of an asymmetric compound para-bolic photovoltaic concentrator for building façade integration in the UK, Solar Energy 77, pp 319-327.

Solar thermal energy systems for building integration
188
Mallick, T.K., Eames, P.C., and Norton, B. (2006) Non-concentrating and asymmetric compound parabolic concentrating building façade integrated photovoltaics: An experimental comparison, Solar Energy 80 (7), pp 834-849.
McIntire, W.R., (1982) Factored approximations for biaxial incident angle modifi ers. Solar Energy 29 (4), pp 315-322.
Meteotest (2004) Meteonorm 5.0 – Global Meteorological Database for Solar energy and Applied Meteorology, Bern, Switzerland. (www.meteotest.ch).
Meteotest (2006) www.meteotest.ch, 2006-12-04.
Morhenne, J. (2000) Chapter V, Controls, Solar Air Systems, A Design Handbook, James & James Ltd., London, ISBN 1 873936869.
Nilsson, J., Brogren, M., Helgesson, A., Roos, A. & Karlsson B. (2006) Biaxial model for the incidence angle dependence of the optical ef-fi ciency of photovoltaic systems with asymmetric refl ectors, Solar Energy 80, pp 1199 1212.
Nilsson, J. (2005) Optical design and characterisation of solar concentrators for photovoltaics, Licentiate thesis, Lund University, report EBD-T-- 05/6, ISBN 91-85147-15-X.
Nostell, P., Roos, A. & Karlsson, B. (1998) Aging of Solar Booster Refl ector Materials. Solar Energy Materials and Solar Cells 54, pp 235-246.
Perers, B. & Karlsson, B. (1993) External refl ectors for large solar collec-tor arrays, simulation model and experimental results. Solar Energy 51 (5), pp 327-337.
Perers, B. (1993) Dynamic method for solar collector array testing and evaluation with standard database and simulation programs. Solar Energy 50 (6), pp 517-526.
Petersdorf, C. & Primas, A. (2007) Primary energy and CO2 conversion factors, in Sustainable Solar Housing, Vol. 1: Strategies and Solutions, Hastings, R. & Wall, M. (editors), pp 281-284, ISBN 978-1-84407-325-2, Earthscan, London.
Polysun (2002) Polysun 3.3, Thermal solar system design, User’s manual, SPF, Institut für Solartechnik, Rapperswil, Switzerland. www.solarenergy.ch.
Russ, C. (2005) Demonstration buildings, design, monitoring and evaluation (Task 28, Subtask D), http//www.iea-shc.org.

References
189
Rönnelid, M. (1998) Optical Design of Stationary Solar Concentrators for High Latitudes, Doctoral thesis, Uppsala University, Sweden, ISBN 91-554-4170-X.
Rönnelid, M., Perers, B., Karlsson, B. & Krohn, P. (1999) Cooling of PV modules equipped with low-concentrating CPC refl ectors. Proceedings of the ISES Solar World Congress 1999, Jerusalem.
Shell Solar, (2003) Shell Solar Product Information Sheet, Shell ST10 Photovoltaic Solar Module.
Smeds, J. & Gajbert, H. (2007) Apartment buildings in the cold climate, conservation strategy, in Sustainable Solar Housing, Vol. 1: Strategies and Solutions, Hastings, R. & Wall, M. (editors), pp 150-156, ISBN 978-1-84407-325-2, Earthscan, London.
Smeds, J. (2007) Cold climate design in Sustainable Solar Housing, Vol. 1: Strategies and Solutions, Hastings, R. & Wall, M. (editors) pp 103-114, ISBN 978-1-84407-325-2, Earthscan, London.
Solarus (2008) www.solarus.se, 2008-05-11.
Swedish Energy Agency (2006) Energiläget 2006, Eskilstuna, www.en-ergimyndigheten.se.
Swedish Ministry of Enterprise, Energy and Communications (2007) Årlig rapportering från det statliga bidraget till investeringar i solvärme (SFS 2000:287), verksamheten 2006. Report Dnr: 00-05-06111.
Thür, A. & Weiss, W. (2005) Success of solar heating in Austria, Proceedings of Northsun 2005, Vilnius.
Wall, M. (2007) Solution examples in Sustainable Solar Housing, Vol. 1: Strategies and Solutions, Hastings, R. & Wall, M. (editors), pp 95-101, ISBN 978-1-84407-325-2, Earthscan, London.
Weiss, W., (editor) (2003) Solar Heating Systems for Houses, A Design Hand Book for Solar Combisystems, James & James Ltd., London.
Weiss, W., Bergmann, I. & Faninger, G. (2006) Solar heat worldwide, markets and contribution to the energy supply 2004, International Energy Agency, Solar Heating & Cooling Programme, Graz, Austria.
Welford, W.T., & Winston, R. (1989) High Collection Nonimaging Optics. Academic Press Inc., San Diego, California. ISBN 0127428852.
Winston, R. (2001) Solar Concentrators, in Solar Energy, The State of the Art, Gordon, J. (editor), pp 357-436, James & James Ltd., London.

Solar thermal energy systems for building integration
190
Zacharopoulos A., Eames P.C., McLarnon D. & Norton B. (2000) Linear dielectric non-imaging concentrating covers for PV integrated building façades, Solar Energy 68 (5), pp 439-452.

Appendix A
191
Appendix A
Equations of the involute and the semi parabola
A.I Derivation of involute equations The equations 41 and 42 for the involute presented in Section 2.5.2 are derived from the fi gure shown below.
σσσ cossin rrx −= Eq. (41)
σσσ sincos rry −−= Eq. (42)
X
Y
σ
r
r sin σ
r sin σ σ
- r c os σ σ
- r c os σ
(x , y )
(x , 0 )
(0 , y)
r σ
r σ

Solar thermal energy systems for building integration
192
A.II Equations of the semi parabola These are the equations that were used for the semi parabola shown in Figure 2.14. This geometry was also used in the design of the Collector C in Chapter 5.
Eq. (42))sin(1
)cos(2/cossin
2/
2/2/
a
aarrxθσ
θσπθσσσ
−+−−++
⋅⋅−⋅=
)sin(1)cos(2/
sincos2/
2/2/
a
aarryθσ
θσπθσσσ
−+−−++
⋅⋅−⋅−=
Eq. (43)

Appendix B
193
Appendix B
Design parameters used in the work for IEA, Task 28 – Sustainable solar housing
B.I Design parameters used in DEROB-LTH simulations
B.I.I Solution 1aThese following assumptions and parameters were applied in the simula-tions of a high performance building that is presented in Solution 1a in Section 4.3.3.This information can also be found in (Smeds & Gajbert, 2007).

Solar thermal energy systems for building integration
194
Table B.1 Design parameters of the building envelope construction in Solution 1a: Conservation strategy. Space heating with electric resistance in the supply air and solar heating of the DHW.
The U-value of the whole building envelope is 0.21 W/m2K.
B.I.II Solution 1b These following assumptions and parameters were applied in the simula-tions of a high performance building that is presented in Solution 1b, which is briefl y discussed for comparison of the other solutions in Sections 4.3.6 and 4.4. This information can also be found in (Smeds, 2007).
Material Thickness Conductivity Percent Studs Studs Resistance
without Rsi, RseResistance
with Rsi, RseU-value
m λ ( W/mK ) % λ ( W/mK ) % ( m2K/W ) ( m2K/W ) ( W/m2K )
wall exterior surface 0.04wooden panel 0.045 100%air gap 0.025 100%mineral wool hd 0.050 0.030 100% 1.67mineral wool 0.250 0.036 85% 0.14 15% 4.84plastic foil 100%mineral wool 0.050 0.036 85% 0.14 15% 0.97plaster board 0.013 0.220 100% 0.06interior surface 0.13
0.433 7.54 7.71 0.130roof exterior surface 0.04
roof felt 0.003 100%mineral wool hd 0.050 0.030 100% 1.67mineral wool 0.350 0.036 100% 9.72plastic foil 100%concrete 0.15 1.700 100% 0.09interior surface 0.10
0.553 11.48 11.62 0.086floor exterior surface
mineral wool 0.300 0.036 100% 8.33concrete 0.150 1.700 100% 0.09interior surface 0.17
0.450 8.42 8.59 0.116window emissivity
pane 0.004 low emissivity 5% reversedgas 0.012 kryptonpane 0.004 clear 83.70%gas 0.012 kryptonpane 0.004 low emissivity 83.70%
0.036 0.800frame 0.093 wood 0.14 0.66 0.83 1.20

Appendix B
195
Table B.2 Design parameters of the building envelope construction in Solution 1b: Energy conservation with district heating for space heating and heating of DHW.
The U-value of the whole building envelope is 0.34 W/m2K.
B.I.III Solution 2These following assumptions and parameters were applied in the simula-tions of a high performance building that is presented in Solution 2 in Section 4.3.4. This information is also presented in (Gajbert & Smeds, 2007).
Material Thickness Conductivity Percent Studs Studs Resistance
without Rsi, RseResistance
with Rsi, RseU-value
m λ ( W/mK ) % λ ( W/mK ) % ( m2K/W ) ( m2K/W ) ( W/m2K )
wall exterior surface 0.04wooden panel 0.045 100%air gap 0.025 100%mineral wool hd 0.030 0.030 100% 1.00mineral wool 0.100 0.036 85% 0.14 15% 1.94plastic foil 100%mineral wool 0.050 0.036 85% 0.14 15% 0.97plaster board 0.013 0.220 100% 0.06interior surface 0.13
0.263 3.97 4.14 0.242roof exterior surface 0.04
roof felt 0.003 100%mineral wool hd 0.030 0.030 100% 1.00mineral wool 0.100 0.036 100% 2.78plastic foil 100%concrete 0.15 1.700 100% 0.09interior surface 0.10
0.283 3.87 4.01 0.250floor exterior surface
mineral wool 0.110 0.036 100% 3.06concrete 0.150 1.700 100% 0.09interior surface 0.17
0.260 3.14 3.31 0.302window emissivity
pane 0.004 low emissivity 5% reversedgas 0.012 kryptonpane 0.004 clear 83.70%gas 0.012 kryptonpane 0.004 clear 83.70%
0.036 0.800frame 0.093 wood 0.14 0.66 0.83 1.20

Solar thermal energy systems for building integration
196
Table B.3 Design parameters of the building in Solution 2.
The U-value of the whole building envelope is 0.41 W/m2K.
B.I.IV The reference apartement building for the cold climate
The following parameters were used for the energy balance calculations of the apartment reference building for the cold climate. The calculations were performed according to EN 832. The values are based on national building codes in countries in colder regions such as e.g. Scandinavia. These values have been somewhat modifi ed (lower u-values etc.) since the standard in Sweden includes heat recovery. Read more about this in the handbook.
Material Thickness Conductivity Percent Studs Studs Resistance
without Rsi, RseResistance
with Rsi, RseU-value
(m) λ ( W/mK ) (%) λ ( W/mK ) (%) ( m2K/W ) ( m2K/W ) ( W/m2K )
wall exterior surface 0.04wooden panel 0.045 100%air gap 0.025 100%mineral wool hd 0.030 0.030 100% 1.00mineral wool 0.100 0.036 85% 0.14 15% 1.94plastic foil 100%mineral wool 0.030 0.036 85% 0.14 15% 0.58plaster board 0.013 0.220 100% 0.06interior surface 0.13
0.243 3.58 3.75 0.267roof exterior surface 0.04
roof felt 0.003 100%mineral wool hd 0.015 0.030 100% 0.50mineral wool 0.100 0.036 100% 2.78plastic foil 100%concrete 0.15 1.700 100% 0.09interior surface 0.10
0.268 3.37 3.51 0.285floor exterior surface
mineral wool 0.110 0.036 100% 3.06concrete 0.150 1.700 100% 0.09interior surface 0.17
0.260 3.14 3.31 0.302window emissivity
pane 0.004 clear 83.70%gas 0.015 airpane 0.004 low emissivity 4%
0.023 1.400frame 0.093 wood 0.14 0.66 0.83 1.20

Appendix B
197
Table B.4 Parameters used for the reference building.
Ventilation (ach) 0.4Infi ltration (ach) 0.2Heat recovery (%) 0.0U-value wall (W/m2K) 0.20U-value window (W/m2K) 1.81U-value roof (W/m2K) 0.19U-value fl oor (W/m2K) 0.20U-value building (W/m2K) 0.29
B.II Design parameters used in Polysun simulations
These parameters were used for the POLYSUN simulations of the solar systems designed for the work within IEA, Task 28, which is presented in Section 4.3. This information is also found in Gajbert& Smeds, (2007) and Smeds and Gajbert(2007).
Table B.5 Parameters used in Polysun simulations.
Parameter Value
The Pipes of the solar circuitPipe material copper∅inside 16 mm∅outside 18 mmLength indoors 24 mLength outdoors 6 mThermal conductivity, λ, of pipe 0,040 W/mKThermal insulation thickness 25 mm
Collector circuitPump power 210 WCollector circuit fl ow 525 l/hSpecifi c throughput 7 l/h,m2
Heat transfer medium water (50%), glycol (50%)Power output to heat transfer medium 60%
Heat exchanger in solar circuitHeat transfer rate k · A for heat exchanger 5000 W/K
TankVolume 4 m3
Height 4 mTemperature in the tank room 15°CThermal insulation of the tank 150 mm

Solar thermal energy systems for building integration
198
B.III Primary energy and CO2 conversion factors
The factors for calculation of primary energy use and emissions of CO2 equivalent that are used for the simulation work within IEA, Task 28 are presented in Table B.6. The factors are based on the GEMIS tool (GEMIS, 2004). This work was presented by (Petersdorf & Primas, 2007).
Table B.6 Primary energy and CO2 conversion factors.
Primary Energy and CO2 conversion factors PEF CO2 eq (kWhpe/kWhend) (g/kWh)
Oil-lite 1.13 311 Natural gas 1.14 247 Hard coal 1.08 439 Lignite 1.21 452 Wood logs 0.01 6 Wood chips 0.06 35 Wood pellets 0.14 43 EU-17 Electricity, grid 2.35 430 District heating CHP-coal cond. 70%, oil 30% 0.77 241 District heating CHP-coal cond. 35%, oil 65% 1.12 323 District heating heating plant; oil 100% 1.48 406 LDH CHP-coal cond. 35%, oil 65% 1.10 127 LDH Heating plant, oil 100% 1.47 323 Local solar 0.00 0 Solar heat (fl at) central 0.16 51 PV (multi) 0.40 130 Wind electricity 0.04 20

Paper I
199
Paper I

Solar thermal energy systems for building integration
200

Paper I
201
2.5 Using active solar energy
Helena Gajbert
2.5.1 Introduction
Heat captured by an active solar heating system can cover a significant part of the very low energydemand of high-performance houses. Because the space heating demand of such houses is very low,the year-round energy demand for domestic hot water (DHW) becomes relatively important. Anactive solar system can cover a large part of this energy demand, often more than 50 per cent, sincethe demand also occurs in summer. The question then is: if there is to be a solar system, would it notbe good to enlarge it to also supply some space heating (a ‘combi-system’)? A key issue, then, isestimating the space heating contribution realistically, given the shorter heating period of high-performance housing.
2.5.2 Solar thermal system designs
If the client desires a water-based heating system, this is a good situation to argue for a solar combi-system. It provides flexibility and there are many interesting system designs on the market, varyingby region and the locally used auxiliary energy sources (Weiss, 2003). The storage tank can serveboth the DHW and the space heating system, and it can be heated by both the auxiliary and the solarsystems, depending on conditions. The system illustrated in Figure 2.5.1 uses a wood pellet boilerand an electric resistance heater as auxiliary energy sources to back up the solar circuit. It is equippedwith a device to enhance thermal stratification in the tank. The DHW is heated in an external heatexchanger.
28 SUSTAINABLE SOLAR HOUSING
DESIGN ADVICE
The amount of energy to heat domestic hot water is a large fraction of the total energy needed inhigh-performance housing, and an active solar system can easily cover up to 50 per cent of thisdemand. Here are example rules of thumb from simulations (see also Part II in this volume).
Suitable dimensions for an example solar system in northern or temperate climates:
An apartment building (approximately 1600 m2, 16 apartments or 48 occupants):
• Tank volume: 3000–5000 l/building or 60–100 l/occupant. • Collector area: 30–80 m2/building or 0.6–1.75 m2/occupant.
A single family house (approximately 150 m2, 4 occupants):
• Tank volume: 400–600 l/house or 100–150 l/ occupant.• Collector area: 5–10 m2/house or 1.3–2.5 m2/occupant.
Collector slope: For domestic hot water (DHW) systems, approximately 40°–50° slope. Forcombi-systems, the slope is preferably steeper, although a larger collector areais then required.
Economics: If water-based heat distribution is preferred (i.e. a low temperature floorheating system), a solar combi-system with direct injection of solar heat to thefloor heating system is a good approach.

Solar thermal energy systems for building integration
202
A critical design condition is the case ofminimum heat demand by maximum solar gains,as often occurs in summer. To minimize thesystem overheating in such instances, the solarsystem should be dimensioned to just cover thesummer energy demand, accepting a small solarcoverage in winter. Nonetheless, an importantadvantage is that the combustion backup heatingcan be shut down during the summer. As a result,short cycling of the back-up system in summercan be eliminated, increasing the life expectancyof the system.
The shorter heating season of a high-performance house results in a more pronouncedseasonal mismatch between solar gains and spaceheating demand than is the case for conventionalhouses. This is illustrated in Figure 2.5.2, withthe case of a reference apartment building in thecold (Stockholm) climate. The DHW demand is
here assumed constant over the year, although it is often slightly lower in summer – for example, dueto vacations.
The overheating problem could be reduced by installing a larger storage tank than the systemdesign would otherwise require. However, this approach is expensive, takes up more house volumeand leads to higher tank heat losses.
There are also good controlsolutions available – forexample, using partial evapora-tion to empty the collectorduring stagnation. Activeremoval of energy transportedvia the steam during stagnationis also possible with a smallvolume heat sink. Alternatively,the tank can be cooled down bycirculating the heat transfermedium through the collectorsat night or by using an aircooler (Hausner and Fink,2002; Weiss, 2003). However,the more cautious design strat-egy is to not over-dimensionthe collector area.
An advantage of a combi-system is that during theheating season, when energyfor space heating is withdrawn from the tank, the operating temperature in the collectors can belowered, increasing the collector efficiency. This typically occurs in autumn and spring. This gain inefficiency can be maximized if the solar collectors supply heat directly to low temperature surfaceheating, as shown in Figure 2.5.3. This requires a good control strategy. Such systems are common inFrance, Denmark and Germany (Weiss, 2003).
ENERGY 29
Source: Helena Gajbert, Lund University SE
Figure 2.5.1 A solar combi-system with a jointstorage tank for the domestic hot water (DHW)
and space heating systems
Source: Helena Gajbert, Lund University SE
Figure 2.5.2 Seasonal variations in solar gains and space heatingdemand in standard housing versus high-performance housing

Paper I
203
One way to better balance the solargains to the heating demand is to mountthe collectors vertically on the façade orto mount them with a high tilt. Thispositioning makes better use of lowwinter sun angles and suppressessummer overheating. This results in amore even distribution of solar gainsover the year; but a larger collector areais required to cover the summer domes-tic hot water demand. Figure 2.5.4shows how the solar fraction increaseswith increased collector area for collec-tors tilted 40° and 90°. The results arefrom Polysun simulations of a flat-platecombi-system coupled to a single familyhouse in the cold climate.
A larger collector area is possiblewithout risking overheating if the collec-tor tilt angle is increased in relation tothe optimal tilt angle, which approxi-mately lies between 35° in southernlatitudes (latitudes around 45°) and 50°in northern latitudes (latitudes around60°). The suitable collector area to cover95 per cent of the summer hot waterheating demand with minimal systemoverheating is illustrated in Figure 2.5.5.The results are from Polysun simula-tions of a flat-plate combi-systemcoupled to an apartment building in thecold climate.
Where houses are closely spaced, amicro-heating grid with a central solarsystem may be plausible. Collectorson the houses then can share a largesemi-seasonal solar storage tankenabling some summer solar gainexcess to be stored for the autumn.The large tank volume has an advan-tageous surface-to-volume ratioreducing tank heat loss. A sharedsystem can also even out peakdemands or supply excesses.Disadvantages are the relatively highheat losses of the pipe grid relative tothe very small space heating demand,and the investment and administrativecosts for meeting such a small
30 SUSTAINABLE SOLAR HOUSING
Source: Helena Gajbert, Lund University SE
Figure 2.5.3 A solar combi-system with the possibility ofdelivering solar heat directly to the heating system without
passing through the tank first
Source: T. Boström
Figure 2.5.4 Effect of collector tilt and area on solar fraction
Source: Helena Gajbert, Lund University SE
Figure 2.5.5 Suitable collector areas at different tilt angles for a collector dimensioned to cover 95% of the summer demand; solar fractions for
the year and for the summer are also shown

Solar thermal energy systems for building integration
204
demand. Such micro-heat distribution grids for row houses have proven effective in demonstrationprojects in Germany (Russ, 2005).
2.5.3 Collector types and placement
There are many reliable and efficient collectors and types on the market today. Flat-plate collectors have been highly optimized with selective coated absorbers, low iron anti-
reflective coated glazing, durable frames and gaskets, and effective back insulation. Evacuated tube collectors, with their extremely good insulation, can operate at higher tempera-
tures with only very small heat losses. Because the losses are so small, evacuated tube collectors candeliver heat even by very low irradiance levels occurring in winter and during overcast periods. Theyare thus very suitable for high-performance houses with their shortened heating season. The individ-ual tubes can be rotated to an optimal absorber tilt angle, allowing great flexibility in where they areplaced. However, the separation between tubes must avoid one shadowing the next. Heat pipe collec-tors need to be mounted with a slight tilt to allow for the gravity flow. A critical issue is snow retentionon the tubes. A façade-mounted system minimizes this problem (Kovacs and Pettersson, 2002).
Concentrating flat-plate collectors can also be envisioned, although such systems are not commer-cially available for housing. Prototype systems have been built and tested – for example, in Sweden,the UK and Australia. A low-cost reflector increases the irradiance on the absorber. The systemgeometry can be optimized for spring and autumn solar angles. While this suppresses the summerperformance, the solar gains are better balanced to the heating demand over the year. Using an evacu-ated tube collector as the target of the reflector is a promising solution.
Solar air collectors, while interesting for conventional houses or renovations, are difficult tojustify economically for high-performance houses. The heat exchanger of the ventilation systemcompetes with the solar air collectors. One system or the other must operate with decreasedefficiency. A plausible configuration would be an entire roof slope covered with a low cost sheet-metal solar air collector. During summer an air-to-water heat exchanger should easily cover all ormost of the water heating energy demand. In the autumn and spring, the system could supply muchof the space heating. Pre-cast hollow-core concrete floor planks or large core masonry walls can alsoserve for heat storage and distribution (Morhenne, 2000).
2.5.4 Tank location
The tank location is an important design decision. On the one hand, it is sensible to locate it insidethe insulated envelope of the building. Heat losses from even a very well-insulated tank are thereforenot lost to the ambient, but remain within the house (although this is a disadvantage in summer).Short pipe runs keep circulation heat losses small. A good location for the tank could be in or next tothe bathroom. The warm tank surface improves the comfort in the bathroom. Comfort here is criticalbecause this is often where exhaust air for the whole living space is extracted, and the occupant maybe feeling cold after showering. Also, the pipe run is minimized between the tank and one of thebiggest points of demand. This decreases pipe heat losses and offers the convenience of immediatehot water at the faucet. An upper floor bathroom is ideal, as the pipe run to roof collectors is alsominimized. However, the insulated building interior is a very expensive volume to sacrifice for atank, so the basement may be the preferred location. This otherwise cold space can then be slightlytempered, improving comfort for the many uses found for a basement. Pipe runs from the tank shouldbe within the heated house envelope as much as possible.
2.5.5 Regional design differences
It is easiest to market a solar combi-system in regions where homeowners prefer hot water radiantheating, particularly low temperature systems. Regions where oil or wood pellet heating is preferredhave proven to be good markets for combi-systems, often even large systems. Solar combi-systemshave been widely sold in Germany, Austria, Switzerland, Sweden, Denmark and Norway. It seems
ENERGY 31

Paper I
205
more difficult to market combi-systems in regions where mainly direct electricity or gas is used forheating – for example, in The Netherlands (Weiss, 2003).
2.5.6 Conclusions
A solar thermal combi-system can be a valuable component of sustainable housing. The dimension-ing and economics of the system have to reflect the very low space heating demand and short heatingseason. For a high-performance house, a solar domestic hot water system is more easily argued than asolar combi-system, given the more constant demand for hot water over the entire year and the costof a water-based radiant heat distribution system. If the client desires a radiant heating system, acombi-system is suitable. The DHW and the space heating system can then share a storage tank,which can be heated both by the solar collector and by the auxiliary heat sources. In such an applica-tion, a higher collector tilt improves the balance between the space heating demand and seasonalsolar gains, although a larger collector area is required to cover the summer demand. Façade-integrated collectors are very suitable and make the system less prone to summer overheating.Capturing and using energy from the sun is a very natural and marketable concept for sustainablelow energy housing.
References
Hausner, R. and Fink, C. (2002) Stagnation Behaviour of Solar Thermal Systems: A Report of IEA SHC –Task 26, AEE INTEC, Austria, www.iea-shc.org/
Kovacs, P. and Pettersson, U. (2002) Solvärmda Kombisystem: En Jämförelse Mellan Vakuumrör och PlanSolfångare Genom Mätning och Simulering, SP rapport 200220, SP Swedish National Testing andResearch Institute, Borås, Sweden
Morhenne, J. (2000) ‘Controls’, in Solar Air Systems: A Design Handbook, James and James Ltd, London,Chapter 5
Russ, C. (2005) Demonstration Buildings: Design, Monitoring and Evaluation, IEA, Task 28, Subtask D,www.iea-shc.org.
Weiss, W. (ed) (2003) Solar Heating Systems for Houses: A Design Handbook for Solar Combisystems,IEA Task 26, James and James Ltd, London,
32 SUSTAINABLE SOLAR HOUSING

Solar thermal energy systems for building integration
206

Paper II
207
Paper II

Solar thermal energy systems for building integration
208

Paper II
209
8.7 Apartment building in the Cold Climate Renewable Energy Strategy
Helena Gajbert and Johan Smeds
Table 8.7.1 Targets for apartment building in the Cold Climate Renewable Energy Strategy
Targets
Space heating 20 kWh/m2a
Non-renewable primary energy:
(space heating + water heating + electricity for mechanical systems) 60 kWh/m2a
This section presents a solution for the apartment building in the cold climate. As a reference for thecold climate, the city of Stockholm is considered. A balanced mechanical ventilation system with heatrecovery is used to reduce the ventilation losses. The solution is based on renewable energy supply.

Solar thermal energy systems for building integration
210
8.7.1 Solution 2: Renewable energy with solar combi-system and biomass boiler
Building envelope
The apartment building has reinforced concrete structure and wooden frame façades with mineralwool. The U-values are shown in Table 8.7.2. The double-glazed windows have a frame ratio of 30per cent, one low-e coating and are filled with air. Construction data are found in Table 8.7.7.
Table 8.7.2 U-values of the building components
Building component U-Value (W/m2K)
Walls 0.27
Roof 0.29
Floor (excluding ground) 0.30
Windows (frame + glass) 1.34
Window frame 1.20
Window glass 1.40
Whole building envelope 0.41
Mechanical systems
Ventilation: a balanced mechanical ventilation system with heat recovery and a bypass for summerventilation is installed. The heat exchanger has an efficiency of 80 per cent. The ventilation rate is0.045 ach and the infiltration rate is 0.05.
Space heating and DHW: a solar combi-system is chosen as the energy supply system for the building– that is, a system where the space heating system and the domestic hot water (DHW) system arecombined, here by a joint storage tank, to which both solar collectors and auxiliary energy sourcesare connected.
The solar thermal heating system consists of 50 m2 collectors placed on the south-facing roof,tilted 40°. The storage tank is 4 m2 and there is a 35 kW pellet boiler, as well as an electrical heater of5 kW, connected to it for increased operational flexibility. The heat from the collector circuit is deliv-ered to the tank via an external heat exchanger coupled to a stratifying device, which improves theimportant thermal stratification in the tank. Another external heat exchanger is used for heating theDHW, taking water from the top of the tank and returning it at the bottom. In the collector circuit,
COLD CLIMATES 157
Source: Helena Gajbert and
Johan Smeds
Figure 8.7.1 The design of the suggested solarcombi-system with a pelletboiler and an electricalheater as auxiliary heatsources and two externalheat exchangers, one forDHW and one for the solarcircuit; the latter isattached to a stratifyingdevice in the tank

Paper II
211
the liquid heat transfer medium is a mixture of 50 per cent water and 50 per cent glycol. Water fromthe tank is also used for the radiant hot water space heating system in the building. Other importantdesign parameters of this system can be found in Table 8.7.8. An illustration of the system is shown inFigure 8.7.1.
The electrical heater and the biomass boiler largely working alternately, heating the upper part ofthe tank when necessary. When only very little auxiliary heat is required during short time intervals,as is often the case in the summer, the biomass boiler operation mode with frequent starts and stopscauses unnecessary energy losses. It is therefore suitable to shut off the furnace during summer,when solar energy can cover most of the energy demand. The electrical heater can then be a goodcomplement during cold and cloudy days. The electrical heater can also be used in tandem with theboiler if needed in extremely cold winter days.
An alternative system design for increased efficiency could also include a possibility of deliveringsolar energy directly to a low temperature radiator heating system when there is prevailing heatingdemand. Since the collector temperature then can be lowered, heat losses of the system are reducedand the efficiency is increased.
The building is designed according to simulations with DEROB-LTH (Kvist, 2005). Simulationsof the active solar energy systems are performed with a modified version of Polysun 3.3 (Polysun,2002): the Polysun-Larsen version, which uses the data files of space heating demand from theDEROB-LTH simulations. Stockholm climate data from Meteonorm (Meteotest, 2004) are used inboth simulation programs. The dimensioning of the solar thermal heating system was performedprimarily with a concern for low auxiliary energy use in summer, avoidance of stagnation andoverheating, and economical aspects. For general assumptions and parameters used in the DEROB-LTH and Polysun simulations, see Table 8.7.7 and 8.7.8.
Energy performance
Space heating demand: the space heating demand of the building is 30,400 kWh/a (19 kWh/m2a)according to simulation results from DEROB-LTH. The assumed heating set point was 20°C.Maximum room temperature set points were 23°C during winter and 26°C during summer (thisassumes the use of shading devices and window ventilation).
The monthly space heating demand for this high-performance case in comparison to a referencebuilding (current building codes year 2001) are shown in Figure 8.7.2. Hourly peak loads of theheating system are calculated with results from DEROB-LTH simulations without direct solar radia-tion in order to simulate a shaded building. The annual peak load occurs in January and is 26.8 kW(17 W/m2).
Domestic hot water demand: the net energy demand for domestic hot water is assumed to be 37,800kWh/a (23.6 kWh/m2a). The DHW demand is thus larger than the space heating demand.
System losses: the system losses consist mainly of losses from the hot water storage tank, but alsofrom circulation losses in the distribution system for DHW. The tank and circulation losses are 1.2and 4.4 kWh/m2a, respectively. The circulation losses are taken into account as internal gains in thebuilding heat load simulations. The tank losses and losses from the collector circuit can, however, notbe used as internal gains since the tank and boiler are placed in the basement outside the thermalenvelope of the building. The efficiency of the biomass boiler is set to 85 per cent, resulting in conver-sion losses of 5.5 kWh/m2a.
Household electricity: the household electricity use is 2190 kWh/a (21.9 kWh/m2a) for two adults andone child in each apartment. The primary energy target does not include household electricity sincethis factor can vary considerably depending on the occupants’ behaviour.
158 SUSTAINABLE SOLAR HOUSING

Solar thermal energy systems for building integration
212
Total energy use, non-renewable primary energy demand and CO2 emissions: as shown in Table 8.7.3,the net energy required for DHW, space heating and mechanical systems is 47.6 kWh/m2a (76,200kWh/a). Adding tank, boiler and system losses gives a total energy use of 58.7 kWh/m2a (93900kWh/a).The total auxiliary energy demand (electricity and pellets), including the conversion losses inthe pellets boiler, is 36.4 kWh/m2a (58300 kWh/a), where 36.2 kWh/m2a (57900 kWh/a) are providedby biomass in the pellet boiler and approximately 0.3 kWh/m2a (400 kWh/a) by the electrical heater.
The active solar gains are 17.3 kWh/m2a (27600 kWh/a) and the solar fraction of the heatingsystem is 35 per cent since the simulation result of the same building but without solar collectorwould require 77,400 kWh/a (described in section 8.7.2). The electricity use for mechanical systemsis 5.0 kWh/m2a (8000 kWh/a).
Due to the solar contribution, the delivered energy is reduced to 41 kWh/m2a (66,200 kWh/a).The total use of non-renewable primary energy is approximately 17 kWh/m2a (27,900 kWh/a) and theCO2 equivalent emissions are 3.8 kg/m2a (6100 kg/a). Compared to the reference building, the non-renewable energy use and CO2 equivalent emissions are considerably lower (see Table 8.7.4 andFigure 8.7.3).
COLD CLIMATES 159
Table 8.7.3 Total energy demand, non-renewable primary energy demand and CO2 equivalent emissions for the apartment building
Source: Helena Gajbert and
Johan Smeds
Figure 8.7.2 Monthlyvalues of the space heatingdemand during one year;the annual total spaceheating demand is 30,400 and 70,000 kWh/a,respectively, for the high-performance building andthe reference building

Paper II
213
Table 8.7.4 A comparison between the high-performance house and the reference house regardingenergy use and CO2 equivalent emissions
Building Net energy Total energy use Delivered energy CO2
equivalent
(kWh/m2a) (kWh/m2a) (kWh/m2a) emissions (kWh/m2a)
High performance building 47.6 58.7 41.4 3.8
Reference building 72.4 81.2 81.2 20.5
8.7.2 Sensitivity analysis
Since the performance of the solar energy system is strongly affected by the system design parame-ters (for example, collector area, tank volume, slope and direction of the collectors and collector typeof the solar heating system), some of the most important results from the Polysun simulations shownduring the designing of the system are presented here. If nothing else is mentioned, the parametersof the simulated systems are the same as for the suggested system. The ‘auxiliary energy’, which isshown in many of the figures, is the heat output from the auxiliary energy system, thus including heatfor DHW heating, space heating and also heat losses. It does not include the conversion losses fromthe heat production (i.e. combustion and heat exchanger losses in a wood pellet furnace).
Collector area
The collector area and tank volume should preferably be considered both individually and as a unit.The collector area is, however, the more important feature to optimize in order to minimize the auxil-iary energy use. The collector area was varied in the simulation while keeping a constant storage tankvolume. The aim was to find a collector size that is large enough to almost cover the summer heatingdemand (i.e. the DHW demand), while still maintaining a relatively low risk of stagnation in thecollectors.
The solar fraction (SF) is calculated according to Equation 8.1. The parameters Aux and Aux0represent the auxiliary energy required with and without the solar system, respectively. In Polysun,the value of Aux0 was obtained by setting the collector area to zero, which resulted in an annual auxil-iary energy demand of 77,400 kWh per year and 11,600 kWh during the summer months (June, Julyand August):
[8.1]SF � 1 �
Aux
Aux0
160 SUSTAINABLE SOLAR HOUSING
Source: Helena Gajbert and
Johan Smeds
Figure 8.7.3 An overviewof the net energy, the totalenergy use and the deliv-ered energy for thehigh-performance buildingand the reference building

Solar thermal energy systems for building integration
214
In Figure 8.7.4 it is shown how the calculated solar fractions for the whole year and also for thesummer months, June, July and August, increase with increasing collector area.
In order to lower the risk of stagnation and overheating, 50 m2 seems a suitable collector size.The pellet boiler can still be turned off during summer, although a small amount of electricity may beneeded during a few colder days. The solar fraction during the three summer months will then be 95per cent. If a solar fraction of 100 per cent in the summer is to be obtained, the risk of overheatingand stagnation would be large. Even if good control strategies can mitigate these problems, it is stilldesirable to avoid the problem completely. Should a heated swimming pool for summer use beincluded in the heating system, the problems of overheating and stagnation could be reduced as thisincreases the heat load during summer. Figure 8.7.5 shows monthly values of the auxiliary energydemand during summer for different system dimensions.
In Figure 8.7.6, the energy saved due to the installation of the collectors is shown for the margincollector area (i.e. the extra savings made with an increase in collector area by 10 m2). A rough estima-tion is that the collector area preferably should be between 40 m2 and 60 m2 to provide a reasonableamount of energy per margin collector area, thus giving sufficient energy yield in relation to the totalinvestment costs.
COLD CLIMATES 161
Source: Helena Gajbert and
Johan Smeds
Figure 8.7.4 The solarfraction of the system forthe whole year and for thesummer months
Source: Helena Gajbert and
Johan Smeds
Figure 8.7.5 Monthlyvalues of auxiliary energydemand for solar systemsof different dimensions

Paper II
215
The resulting non-renewable primary energy demand and CO2 equivalent emissions when solarcombi-systems of different dimensions are used can be seen in Figure 8.7.7. The tank volumes wereoptimized for each case.
If the solar system had been installed in the reference building (described in section 8.1) instead, theauxiliary energy demand would be much higher, as can be seen in Figure 8.7.8, where the auxiliaryenergy demand of the two buildings is shown for different solar system dimensions. Again, the tankvolumes were optimized for each case.
In Figure 8.7.9 the overview of the energy demands of the high-performance building and for thereference building are shown, as well as the solar gains of collectors of 30, 50 and 70 m2. Observe thatthe heat for DHW, circulation losses and tank losses is valid for a 50 m2 collector area. For a largercollector, the tank losses will be slightly higher.
162 SUSTAINABLE SOLAR HOUSING
Source: Helena Gajbert and
Johan Smeds
Figure 8.7.6 The energysavings per margin collec-tor area (i.e. how muchadditional energy is savedif 10 m2 is added to thecollector area, read fromleft to right)
Source: Helena Gajbert and
Johan Smeds
Figure 8.7.7 The resultingnon-renewable primaryenergy demand and CO2equivalent emissions fordifferent collector areas

Solar thermal energy systems for building integration
216
Storage tank volume
For economical reasons it is important to consider the storage tank volume. A larger tank is muchmore expensive, although the impact on the auxiliary energy use is rather small, as shown in Figure8.7.10. The tank could preferably be designed based on the daily energy demand due to the limitedstorage time capacity. The tank should not be too small due to the risk of overheating and because oflowered storage capacity. On the other hand, an oversized tank might require higher auxiliary energydemand in order to heat the tank and also because of the higher heat losses. A high insulation level istherefore important and it becomes more important the larger the tank is, as shown in Figure 8.7.10.
Simulation results for collector areas between 50 m2 and 100 m2, with varying tank volumes, areshown in Figure 8.7.11. The chosen system is marked with a circle. These results also show that thecollector area has a much larger influence on the auxiliary energy use than the tank volume. Althoughthe tank size has a relatively low influence on the auxiliary energy use, it is important not to choosetoo small a tank since there will be a risk of overheating and as it might be difficult to provide therequired heat for DHW and space heating. For the larger collectors, some energy can be saved bychoosing a larger tank. The suggested system with 50 m2 collector area and a storage volume of 4 m3
would neither imply overheating nor excessive tank losses, according to the simulation results.
COLD CLIMATES 163
Source: Helena Gajbert and
Johan Smeds
Figure 8.7.8 Annual auxil-iary energy demand perliving area for differentsystem dimensions basedon Polysun simulations
Source: Helena Gajbert and
Johan Smeds
Figure 8.7.9 The energydemands and the solargains of the high-performance building andthe reference building; thesolar gains are shown fordifferent collector areas

Paper II
217
Collector tilt
The tilt of the collector determines how large the collector should be in order to cover the summerdemand. In order to maintain a solar fraction of 95 per cent during the summer months, the requiredcollector size increases as the collector tilt is increased or decreased from 30° to 40°, which is the tiltwhere the smallest collector area (50 m2) is needed (see Figure 8.7.12).
When using highly tilted or vertical collectors, the solar gains will be better balanced to theseasonal heating demand since more of the winter space heating demand will be covered. However,this requires a larger collector area in order to cover the summer demand. For a very large collectorwith a high tilt angle, energy can be saved in total over the year, thus implying a higher annual solarfraction. A good, yet very expensive, solution would therefore be to use a vertical wall-mountedcollector of very large size. The benefits of this are naturally much higher for combi-systems than forDHW systems. There are generally no benefits in using a horizontal collector or a collector with alow tilt.
Looking further at two mounting options for good building integration to either mount the collec-tors on the 40° tilted roof or vertically on the wall, tilted 90°, it can be seen in Figure 8.7.13 how theauxiliary energy demand decreases with increasing system size. The 40° tilt implies a lower demandof auxiliary energy on an annual basis and the difference is more significant in smaller systems.
164 SUSTAINABLE SOLAR HOUSING
Source: Helena Gajbert and
Johan Smeds
Figure 8.7.10 The influ-ence of tank volume andtank insulation level; theauxiliary energy demandper living area for differenttank volumes is shown
Source: Helena Gajbert and
Johan Smeds
Figure 8.7.11 Annualauxiliary energy per livingarea for different systemdimensions based onPolysun simulations

Solar thermal energy systems for building integration
218
Furthermore, the risk of snow cover should be considered if a very low tilt angle is used. The risk ofsnow cover is even larger for evacuated tube collectors.
Azimuth angle
If the deviation from south is varied (i.e. the azimuth angle), the auxiliary energy demand and solarfraction changes according to Figure 8.7.14.
Collector performance
The choice of collector is very important for the system performance. Simulations have beenperformed with collectors of different types, from older collector types without a selective surface tothe most advanced evacuated tube collectors available, with characteristics and simulation resultslisted in Table 8.7.5. The results are also shown in Figure 8.7.15. In the suggested system, anadvanced flat-plate collector with a selective surface, anti-reflection treated glass and highly efficientthermal insulation, number 3 in Table 8.7.5, is used. When compared to an older collector typewithout selective surface, the chosen collector increases the solar fraction from 21 per cent to 30 percent. If an evacuated tube collector is used, the solar fraction increases even more. For this solar
COLD CLIMATES 165
Source: Helena Gajbert and
Johan Smeds
Figure 8.7.12 The collectorarea required for differ-ently tilted collectors inorder to obtain a solarfraction of 95% duringsummer (this is thus anappropriate area that doesnot imply boiling in thetank); the solar fraction forthe whole year and theconstant solar fraction insummer are also shown
Source: Helena Gajbert and
Johan Smeds
Figure 8.7.13 Results fromsimulations of systems withdifferently tilted collectors:40° for the roof-mountedand 90° for the wall-mounted collectors

Paper II
219
heating system an evacuated tube collector of 35 m2 would be sufficient. Evacuated tube collectorsare very efficient, but are also often very expensive.
Concentrating collectors
By using concentrating reflectors to enhance the irradiance on the absorber, the output from thecollectors can be increased. If the geometry of the collectors excludes irradiation from higher solarangles, the collector could improve the seasonal balance by increasing the winter performance and
166 SUSTAINABLE SOLAR HOUSING
Table 8.7.5 Collector parameters and corresponding solar fraction and auxiliary energy
Source: Helena Gajbert and
Johan Smeds
Figure 8.7.14 The auxil-iary energy demand andsolar fractions of systemswith different azimuthangles
Source: Helena Gajbert and
Johan Smeds
Figure 8.7.15 Results fromsimulations of systems withdifferent collector types

Solar thermal energy systems for building integration
220
suppressing the summer performance. It is interesting to apply this strategy to an evacuated tubecollector, which has the potential to deliver energy during lower irradiance levels and which also,currently, is relatively expensive. An estimation of the effect that this would imply was investigatedfor an evacuated tube collector (with collector characteristics according to Table 8.7.5, collector type1). Polysun simulations were performed assuming a double collector area from October to March andwith the collector tilted 70° and 90°. The area was chosen so as to imply a solar fraction of 95 per centduring summer. The results, shown in Table 8.7.6, indicate that the reflector implies energy savingsof 11 per cent if it is tilted either 70° or 90°.
Design of the collector loop heat exchanger and flow rate
The design of the storage tank and its connected components is also important for the systemefficiency since different types of heat exchangers work optimally at different flow rates. The flowrate in the collector loop should not be too low so as not to cause laminar flow, air traps and/orincreased heat losses. Therefore, if the heat from the collectors is transferred to the tank through aninternal heat exchanger, a high flow rate implies lower auxiliary energy demand, as shown in Figure8.7.16.
The efficiency of the solar heating system is improved if an external heat exchanger is usedinstead and even better if a stratifying device is employed. In a smaller tank, the importance of astratifying device is more significant. In these cases, a low flow rate is better since the fluid insertedinto the tank otherwise can cause mixing of the stratified water. However, the flow rate should not betoo low. The optimum can be seen in Figure 8.7.16. Lower flow rates also contribute to a lowerelectricity use for the pump and the dimensions of the pipes are reduced and less expensive.
COLD CLIMATES 167
Source: Helena Gajbert and
Johan Smeds
Figure 8.7.16 The auxiliary energy demand,with varied flow rate andtype of heat exchanger inthe solar circuit
Table 8.7.6 The auxiliary energy demandfor an evacuated tube collector with andwithout reflectors

Paper II
221
Non-renewable energy use for solar DHW systems and combi-systems
If a solar DHW system would be used instead of the combi-system, the target of non-renewableprimary energy would not be reached if combined with electricity for space heating. If combinedwith district heating for space heating, the solar collectors would have to be at least 40 m2 in order toreach the target of 60 kWh/m2a (living area), as shown in Figure 8.7.17. By looking at Figure 8.7.18,where the emissions of CO2 equivalents are shown, the most environmentally friendly design alsoappears to be with a solar combi-system with a pellet boiler and an electrical heater.
8.7.3 Design advice
The solution presented in this section fulfils the primary energy target. When comparing theconstruction of the building envelope to current building standards, it is clear that today’s apartmentbuildings could live up to the targets set if they were built very air tight and with efficient ventilationheat exchangers.
In cold climates where the heating demand is high, the solar energy from a solar combi-systemcan provide a significant part of the total energy demand of a high-performance house. If looking
168 SUSTAINABLE SOLAR HOUSING
Source: Helena Gajbert and
Johan Smeds
Figure 8.7.17 The use ofnon-renewable primaryenergy for three differentenergy system designs: thecombi-system in question,with a pellet boiler and anelectrical heater; a solarDHW system combinedwith district heating; and asolar DHW systemcombined with electricalheating
Source: Helena Gajbert and
Johan Smeds
Figure 8.7.18 Theemissions of CO2equivalents for three different energy systemdesigns: the combi-systemin question, with a pelletboiler and an electricalheater; a solar DHWsystem combined withdistrict heating; and a solarDHW system combinedwith electrical heating

Solar thermal energy systems for building integration
222
specifically at the space heating demand, solar energy can also contribute, to some extent, to thespace heating supply even for a well-insulated building. However, it may be easier to justify a solarDHW system economically if the energy demand is low enough to warrant a space heating systembased only, for example, on heat recovery and electrical resistance heating of the incoming air.
If a solar combi-system is used, the combined storage tank can give beneficial effects due to thehigher energy withdrawal from the tank, which can lower the temperatures in the collector circuitand thus increase the collector efficiency somewhat during the heating season. By combining thetank for space heating and hot water and thus improving the system flexibility, the heat losses mightbe reduced in comparison to using two separate tanks for DHW and space heating.
The collector solar system dimensions should preferably be designed so as to cover most of theenergy demand in summer, both for solar combi-systems and solar DHW systems. The highest solarfraction on an annual basis is achieved with a collector tilt of approximately 30° to 50°. If a largercollector is affordable, it is beneficial to design a combi-system, over-dimension the collector areaand to place it vertically on the wall since this increases the solar gains during the heating season andreduces the risk of stagnation in summer.
For the technical facility management of the building, a solar combi-system does, of course, meansome additional costs in comparison to the district heating system; but since the biomass boiler canbe shut down during summer, service costs should be at a reasonable level.
The solution presented here implies very low use of fossil fuels and low emissions of CO2 equiv-alents to the atmosphere. Therefore, it is a very good solution for a building in rural areas wheredistrict heating is not available, especially as the solar system can cover the energy demand in summerand the furnace can be switched off.
District heating systems use a large share of renewable fuels in Scandinavia; approximately 80per cent of the fuel is renewable. If the building is situated in an urban area with such a districtheating system, the district heating is to be preferred to the use of biomass boilers as biomass boilersgive rise to some emissions from the furnaces, something that may be forbidden in certain urbanareas. Today, the purification of the exhaust gases is very good and modern furnaces are often
COLD CLIMATES 169
Table 8.7.7 General assumptions for simulations of the building in DEROB-LTH – constructionaccording to solution 2, space heating target 20 kWh/m2a

Paper II
223
designed to use optimal oxygen amounts in the combustion process. If a biomass boiler is to be used,it should be an ‘environmentally approved’ boiler and it should be coupled with a thermal heat storagetank in order to achieve an effective and controlled combustion process and to minimize the emissionsof volatile organic compounds (VOCs) and particles (Johansson et al, 2003).
Table 8.7.8 Design parameters of the solar combi-system used in the Polysun simulations
Parameter Value
Pellet boiler
Pellet boiler peak power 35 kW
Electrical heater peak power 5 kW
The pipes of the solar circuit
Pipe material Copper
Ø inside 16 mm
Ø outside 18 mm
Length indoors 24 m
Length outdoors 6 m
Thermal conductivity, λ, of pipe 0.040 W/mK
Thermal insulation thickness 25 mm
Collector circuit
Pump power 210 W
Collector circuit flow 525 l/h
Specific throughput 7 l/h,m2
Heat transfer medium Water (50%), glycol (50%)
Power output to heat transfer medium 60%
Heat exchanger in solar circuit
Heat transfer rate k*A for heat exchanger 5000 W/K
Tank
Volume 4 m3
Height 4 m
Temperature in the tank room 15°C
Thermal insulation of the tank 150 mm
References
Johansson, L., Gustafsson, L., Thulin, C. and Cooper, D. (2003) Emissions from Domestic Bio-fuelCombustion – Calculations of Quantities Emitted, SP Report 2003:08, SP Swedish National Testingand Research Institute, Borås, Sweden
Kvist, H. (2005) DEROB-LTH for MS Windows, User Manual Version 1.0–20050813, Energy andBuilding Design, Lund University, Lund, Sweden, www.derob.se
Meteotest (2004) Meteonorm 5.0 – Global Meteorological Database for Solar Energy and AppliedMeteorology, Bern, Switzerland, www.meteotest.ch
Polysun (2002) Polysun 3.3: Thermal Solar System Design, User’s Manual, SPF, Institut für Solartechnik,Rapperswil, Switzerland, www.solarenergy.ch
Swedish Environmental Protection Agency (2005) www.naturvardsverket.seSwedish National Testing and Research Institute (2005) www.sp.seWeiss, W. (ed) (2003) Solar Heating Systems for Houses: A Design Handbook for Solar Combisystems,
James and James Ltd, London
170 SUSTAINABLE SOLAR HOUSING

Solar thermal energy systems for building integration
224

Paper III
225
Paper III

Solar thermal energy systems for building integration
226

Paper III
227
8.6 Apartment building in the Cold Climate Conservation Strategy
Johan Smeds
Table 8.6.1 Targets for apartment building in the Cold Climate Conservation Strategy
Targets
Space heating 15 kWh/m2a
Non-renewable primary energy:
(space heating + water heating + electricity for mechanical systems) 60 kWh/m2a
This section presents two solutions for the apartment building in the cold climate. As a reference forthe cold climate, the city of Stockholm is considered. The solutions are based on energy conserva-tion, minimizing the heat losses of the building. A balanced mechanical ventilation system with heatrecovery is used to reduce the ventilation losses.
8.6.1 Solution 1a: Conservation with electric resistance heating and solar DHW
Building envelope
In this solution the envelope and ventilation system were designed so that the peak space heatingload is limited to approximately 10 W/m2. This allows one central heating element for each apart-ment and heat distribution by the supply air, which is more economical than individual room heaters.This solution requires a well-insulated and air-tight building envelope.
The apartment building has reinforced concrete structure and wooden frame façades withmineral wool. The windows have a frame ratio of 30 per cent, triple glazing, one low-e coating andthey are filled with krypton. The U-values are shown in Table 8.6.2. Construction data are shown inTable 8.6.6.
Table 8.6.2 The building components
Building component U-value (W/m2K)
Walls 0.13
Roof 0.09
Floor (excluding ground) 0.12
Windows (frame + glass) 0.92
Window frame 1.20
Window glass 0.80
Whole building envelope 0.21

Solar thermal energy systems for building integration
228
Mechanical systems
A balanced mechanical ventilation system with heat recovery and a bypass for summer ventilation isused. The heat exchanger has an efficiency of 80 per cent. The supply air is used for the distributionof heat. Domestic hot water is supplied by a solar domestic hot water system in combination with anelectric furnace. The solar system consists of 60 m2 collectors, a storage tank of 6 m2 and an electricfurnace of 8 kW.
Energy performance
Space heating demand and peak load: simulation results from DEROB-LTH show that the spaceheating demand is 10,300 kWh/a (6.5 kWh/m2a). The monthly space heating demand of solution 1a incomparison to the reference case (building code 2001) is shown in Figure 8.6.1.
Hourly loads of the heating system are calculated from the DEROB-LTH simulation results withoutdirect solar radiation in order to simulate a totally shaded building. The annual peak load is 16 kW or10 W/m2 and occurs in January.
General assumptions for these simulations were:
• heating set point: 20°C; • maximum room temperatures: 23°C during winter, 26°C during summer (assumes use of shading
devices and window ventilation);• ventilation rate: 0.45 ach;• infiltration rate: 0.05 ach; and• heat recovery: 80 per cent efficiency.
Domestic hot water demand: the net heat demand for DHW is approximately 37,800 kWh/a (23.6kWh/m2a). Thus, the DHW demand is much larger than the space heating demand.
The system losses consist mainly of losses from the hot water storage tank, but also from pipelosses in the distribution system. The tank and circulation losses are 1.5 and 4.4 kWh/m2a, respec-tively. The circulation losses are taken into account as internal gains in the simulations withDEROB-LTH. The tank losses and losses from the collector loop, on the other hand, cannot be usedas internal gains since the tank and boiler are placed in the basement outside the thermal envelope ofthe living area. The conversion losses of the electric boiler are set to zero.
The choices of system solutions are based on simulations of the space heating demand for thebuilding performed with the programme DEROB-LTH. Simulations of the active solar energy
COLD CLIMATES 151
Source: Johan Smeds
Figure 8.6.1 Space heatingdemand of solution 1a

Paper III
229
systems are performed with Polysun 3.3. A modified version of Polysun, the Polysun-Larsen version,was used in order to enable the use of the data files of space heating demand from heat load simula-tions performed in DEROB-LTH.
Household electricity: the use of household electricity for each apartment (two adults and one child)is 2190 kWh or 21.9 kWh/m2. The primary energy target does not include household electricity sincethis factor can vary considerably depending on the occupants’ behaviour.
Non-renewable primary energy demand and CO2 emissions: the total energy use for DHW and spaceheating, system losses and mechanical systems is 63,200 kWh/a. After taking the solar contributionfor DHW into account, the delivered energy is 34,200 kWh/a, which is provided by electricity. Thisresults in a total use of non-renewable primary energy of 80,300 kWh/a (55 kWh/m2a) and CO2 equiv-alent emissions of 10 kg/m2a (see Table 8.6.3).
8.6.2 Solution 1b: Energy conservation with district heating
Building envelope
Using a district heating system with hot water radiant heating allows a less insulated buildingenvelope than solution 1a with supply air heating.
The apartment building has reinforced concrete structure and wooden frame façades withmineral wool. The windows have a frame ratio of 30 per cent, triple glazing, one low-e coating andare filled with krypton. U-values are shown in Table 8.6.4. Construction data are shown in Table8.6.7.
Table 8.6.4 U-values of the building components
Building component U-value (W/m2K)
Walls 0.24
Roof 0.25
Floor (excluding ground) 0.30
Windows (frame + glass) 0.92
Window frame 1.20
Window glass 0.80
Whole building envelope 0.34
152 SUSTAINABLE SOLAR HOUSING
Table 8.6.3 Total energy demand, non-renewable primary energy demand and CO2 equivalent emissions for the apartment building with electric resistance space heating
and solar DHW system with electrical backup

Solar thermal energy systems for building integration
230
Mechanical systems
A balanced mechanical ventilation system with heat recovery and a bypass for summer ventilation isused. The heat exchanger has an efficiency of 80 per cent. District heating is distributed by a hotwater radiant heating system. A wastewater counter-flow pipe heat exchanger for preheating of waterto the space heating system can be installed; but this is not included in any of the calculations forenergy performance shown below.
Energy performance
Space heating demand: simulation results from DEROB-LTH show that the space heating demand ofthe building is 21,500 kWh/a (13.4 kWh/m2a). The monthly space heating demand of the building incomparison to the reference case is shown in Figure 8.6.2. The heating season for the proposedsolution 1b extends from November to March.
Hourly loads of the heating system are calculated with results from DEROB-LTH simulationswithout direct solar radiation in order to simulate a totally shaded building. The annual peak load is21.2 kW or 13 W/m2 and occurs in January.
Domestic hot water demand: the net domestic hot water demand for the 48 inhabitants is 37,800kWh/a (23.6 kWh/m2a).
System losses: the system losses consist mainly of circulation losses in the distribution system. Thecirculation losses are taken into account as internal gains in the simulations with DEROB-LTH. Theconversion losses of the heat exchanger connected to the district heating system are set to zero.
Household electricity: the household electricity use for each apartment is 2190 kWh (21.9 kWh/m2)for two adults and one child. The primary energy target does not include household electricity.
Non-renewable primary energy demand and CO2 emissions: the total energy use for DHW and spaceheating, system losses and mechanical systems is 74,240 kWh/a. The use of district heating results ina non-renewable primary energy demand of 69,760 kWh/a (44 kWh/m2a) and CO2 equivalentemissions of 12 kg/m2a in one year (see Table 8.6.5).
COLD CLIMATES 153
Source: Johan Smeds
Figure 8.6.2 Space heatingdemand

Paper III
231
8.6.3 Design advice
Both solutions here fulfil the primary energy target. When comparing the construction of the build-ing envelope to current building standards, it is clear that today’s apartment buildings could live up
154 SUSTAINABLE SOLAR HOUSING
Table 8.6.5 Total energy demand, non-renewable primary energy demand and CO2 equivalent emissions for the apartment building with district heating
Table 8.6.6 Solution 1a: Conservation with electric resistance heating and solar DHW – building envelope construction

Solar thermal energy systems for building integration
232
to the targets set by IEA Task 28 if they were built very air tight and if they used efficient ventilationheat exchangers.
If the building is situated in an urban area where district heating systems use large quantities ofrenewable fuels (as, for example, in Scandinavia, where 80 per cent of the fuel is renewable), solution1b is preferable. In rural areas where district heating is not available, solution 1a, with a solar domes-tic hot water system and electrical auxiliary heating, is a good alternative, especially since the solarsystem can cover the energy demand in summer. Of course, the production method of electricity isan important issue that significantly affects the resulting primary energy demand of a building usinga high share of electricity – for example, as in solution 1a. An average value for the primary energyfactor for electricity based on 17 European countries is used in all calculations. An environmentallyfriendly choice of electricity production would have a great impact on the primary energy use.
COLD CLIMATES 155
Table 8.6.7 Solution 1b: Energy conservation with district heating – building envelope construction

Paper III
233
Table 8.6.8 Design parameters of the solar DHW system in solution 1a
Parameter Value
Electrical heater efficiency 8 kW
The pipes of the solar circuit
Pipe material Copper
ø inside 16 mm
ø outside 18 mm
Length indoors 24 m
Length outdoors 6 m
Thermal conductivity, λ, of pipe 0.040 W/mK
Thermal insulation thickness 25 mm
Collector circuit
Pump power 210 W
Collector circuit flow 525 l/h
Specific throughput 7 l/h,m2
Heat transfer medium Water (50%), glycol (50%)
Power output to heat transfer medium 60%
Heat transfer rate k*A for heat exchanger of 5000 W/K
stratifying device
Tank
Volume 6 m3
Height 4 m
Temperature in the tank room 15°C
References
Kvist, H. (2005) DEROB-LTH for MS Windows, User Manual Version 1.0–20050813, Energy andBuilding Design, Lund University, Lund, Sweden, www.derob.se
Meteotest (2004) Meteonorm 5.0 – Global Meteorological Database for Solar Energy and AppliedMeteorology, Bern, Switzerland, www.meteotest.ch
Polysun 3.3 (2002) Polysun 3.3: Thermal Solar System Design, User’s Manual, SPF, Institut fürSolartechnik, Rapperswil, Switzerland, www.solarenergy.ch
156 SUSTAINABLE SOLAR HOUSING

Solar thermal energy systems for building integration
234

Paper IV
235
Paper IV

Solar thermal energy systems for building integration
236

Paper IV
237
Design and evaluation of solar collectors for integration onnon-insulated roofs
H. Gajbert*, B. Karlsson and J. Nilsson
Energy and Building Design, Lund University, Box 118, SE-221 00 Lund, Sweden
Submitted to Solar Energy Materials & Solar Cells
Abstract There is a large potential of using cost-effective collectors with low insulation level integrated in non-insulated roofs in Sweden. The thermal performance and incidence angular dependence of three collectors for integration into non-insulated roofing material were evaluated by measurements and simulations. The maximum annual energy output per collector area would be 320 kWh/m2,330 kWh/m2 and 280 kWh/m2 respectively for Collector A, B and C at 50°C operation temperature. The corresponding yield per absorber area is 360, 680 and 1140 kWh/m2 respectively. This indicates that there is a potential for production of cost-effective collectors of this type, Collector B particularly.
Keywords: Solar collector, Building-integration, Concentrating collector, Cost-efficiency, Roofing material
* Corresponding author. Phone: +46-46-2227583, fax: +46-46-2224719, e-mail: [email protected]
1. Introduction
1.1 Background
In order to increase the use of solar thermal collectors, it is important to develop cost-effective collector designs for building integration. One of the largest available potential locations for installation of solar collectors in Sweden is non-insulated roofs with cold attics underneath. Collectors integrated in such roofs do not require heavy insulation for the thermal comfort in the building and therefore they have an important advantage over standard integrated collectors, which must often be well-insulated.
By also using low-concentrating collectors the absorber material is used more efficiently. As existing roofing sheet is used for the collector bottom, no separate collector box is required. This and the fact that the absorber area is reduced enable a low production cost of the collector.
There is therefore a potential for development of a cost-effective, thin concentrating collector with lower use of insulation material, suitable for easy integration in non-insulated roofs.
Since very few collectors have been designed for non-insulated roofs it is interesting to investigate the thermal performance of such collector designs.
1.2 Objectives of this work
The objective of this work was to design cost-effective solar collectors for use on non-insulated roofs, which could be industrially produced, and to evaluate their thermal performance. These collectors was constructed as prototypes and evaluated with respect to their thermal performance and their incidence angle dependence.
2. Theory
2.1 Design criteria
In order to create a selling product, it is necessary to keep the investment costs low. Cost reductions can be achieved by using building integrated collectors that replace building material as the material use and installation time are minimised. By also using readily available products, the production

Solar thermal energy systems for building integration
238
costs can be further reduced, as the expensive start-up of a construction process is avoided. A desired feature is the use of low-concentrating reflectors, as this decreases the required absorber area, and thereby also the heat losses, without thick insulation.
Prefabrication and simple mounting are desirable features for building integrated collectors. In order to reduce the material use and to simplify the mounting process, the collector should preferably be thin and flexible for production in variable lengths. Maintenance requirements should be minimised by using durable materials.
2.2 The collector designs
Three similar collectors were designed to be integrated into commonly used corrugated steel roofing material that was found to enable the above mentioned criteria to be met. Since the material used in this collector box is commonly mass produced steel, the production costs can be lower than for a conventional collector with a thick insulated box. This material also allows flexible use, as collectors can be produced in flexible lengths for covering complete roofs. For all the three similar collectors the absorbers, reflectors and the expanded polystyrene (EPS) insulation material are placed directly in the compartments of an existing corrugated roofing sheet steel. Two of the collectors are designed with concentrating reflectors and one is a flat plate reference collector. The different collector designs are illustrated and described in Figure 1. All prototypes are covered with a 4 mm acrylic plate, which in full scale will be replaced by a glass cover of higher transmittance.
Figure 1a. Collector A - Flat plate reference collector with standard strip absorbers.
Figure 1b. Collector B - Concentrating collector with narrow strip absorbers and circular reflectors.
Figure 1c. Collector C - Concentrating collector with tube absorber, selective surface and CPC-reflector.
The absorber of the flat plate reference Collector A is a standard size Sunstrip absorber of 143 mm width. Underneath is 50 mm insulation of EPS material. For the other designs the thickness of the insulation is determined by the reflector geometry. In the concentrating Collector B, a Sunstrip absorber of half width, 72 mm, is used in combination with a circular shaped concentrating reflector, resulting in a factor of two between the glazed area and single side absorber area. The geometrical concentration ratio is 2.0 and the physical concentration is 1.0, since the absorber is bifacial. The acceptance interval is from -90° to 90°.
For concentrating collectors, it is important to consider the effect of different incidence angle dependences in the longitudinal and transverse plane. The longitudinal and transverse incidence angles, θL and θT, are here defined as shown in Figure 2.
For Collector A and B, which accept irradiation from all angles, the incidence angle dependences for beam irradiation in the longitudinal and transverse plane are both described by Equation 6. For Collector B however, the circular reflector could cause slightly larger optical losses. For the concentrating Collector C, the longitudinal and the transverse incidence angle dependences differ.
θL θT
Figure 2. The transverse and longitudinal incidence angles, θL and θT, of a concentrating collector.
Collector C has a circular absorber that consists of an ∅ 18 mm copper pipe with a selective aluminium foil taped onto it. The absorbance, α, is 0.92 and the emittance, ε, is 0.20. The geometrical design of the reflector is an involute shaped after a ∅ 15 mm copper pipe [1], combined with a truncated quasi parabola. The 61 mm width of the aperture, denoted 2L, results in a geometrical concentration ratio between glazed area and absorber area of 1.1. The geometry, which can be seen in Figure 3, gives an acceptance interval of 80°, and the acceptance half-angle, θa/2, is thus 40°.

Paper IV
239
Figure 3. The shape of the truncated reflector used in Collector C, which is a combination of an involute and a parabola with an acceptance half-angle, θa/2, of 40°.
Four copper pipes with reflectors fit into each compartment of the corrugated steel. A photograph of the absorber is shown in Figure 4.
Figure 4. A closer view of the large prototype of Collector C, showing the tube absorbers.
2.3 Thermal performance
The thermal performance of the collectors were evaluated based on Equation 1, which is similar to the model described by [2] although the piping heat loss coefficient and the wind and sky temperature factors are neglected here.
( )
( ) ( )dt
dTCmTTUF
TTUFGGq
meam
amddbb=
21
000
'
'ηη (1)
The heat loss coefficient, F’U is expressed by the first and second order heat loss coefficients F’U0and F’U1, as shown in Equation 2. The mean collector temperature is calculated from the inlet and outlet temperatures, as shown in Equation 3.
( )am TTUFUFUF = 10 '''
(2)
=2
outinm
TTT (3)
For a flat plate collector the incidence angle dependent optical efficiency for beam irradiance, η0b, is described by Kτα, as written in Equation 4. For angles higher than 60°, η0b diminishes to 0, proportionally to the angle of incidence. [3]
= 1cos
11 0 θτα bK for θ <60° (4)
The over-all collector efficiency at any given time is calculated from the relation between the power and the irradiance as written in Equation 5.
Gq
=η (5)
The absorber areas for the collectors are calculated as seen from a front view
3. Methodology
Prototypes of the three collectors were constructed and evaluated with respect to the thermal performance and the incidence angle dependence.
3.1 Long term measurements for evaluation of the thermal performance
Long term collector measurements have been performed in Älvkarleby, Sweden (60.5°N, 17.4°E), during the period from 2005-04-02 to 2005-05-10. Collector prototypes of a size of 1.0 × 2.0 m are mounted directed towards south, tilted 45°, with the absorbers directed in the east-west plane (see Figure 5). The inlet and outlet temperatures, flow rates, global and diffuse irradiation are monitored in the collector plane are monitored in ten minute intervals.

Solar thermal energy systems for building integration
240
Figure 5. The collectors mounted outdoors for long-term evaluation in Älvkarleby, Sweden.
3.2 Evaluation of incidence angle dependence in the transverse plane
To measure the transverse incidence angle dependence of Collector C, an identical but smaller collector of 0.6 × 1.0 m, has been created and evaluated by measurements. The collector was mounted on a south-facing stand, which is adjustable for variable tilt angles, with the absorbers mounted vertically in the north-south plane. The transverse incidence angle at any specific time could be calculated by Equation 6 [3], since the collector tilt was adjusted continuously during the measurement, so that the surface was rotated around the horizontal east-west axis. That way the collector was always directed towards the sun’s projection in the north-south plane. Although not commonly practiced, this measuring technique was found very suitable and efficient for the purpose.
2/122 )sincos1(cos ωδθ = (6)
3.3 MLR analysis
The collector parameters describing the thermal performance were calculated from the long-term measurements by Multi Linear Regression, MLR, according to the model described by [2], which is based on equation 1. The parameters q, Gb, Gd, Tm,Ta, and dTm/dt were monitored and the parameters η0d, F’U0, F’U1, (mC)e and b0 were given by the MLR results.
3.4 Calculation of transverse incidence angle dependence for Collector C
For the concentrating Collector C, the optical efficiency for beam irradiation for different transverse incidence angles was calculated from the MLR results, according to Equation 7. The observed dependence of the transverse incidence angles was established from these results and during the following days the modelled values were compared to the monitored values of power.
( ) ( )
b
meamamdd
b Gdt
dTmCTTUFTTUFGq=
2100
0
)(''ηη
(7)
3.5 MINSUN simulations of annual energy output
The MINSUN simulation program was used to calculate the expected annual energy output from the collectors [4, 5]. The program considers the characteristic parameters of solar collectors and the longitudinal and transverse incidence angle dependence can be included as input data for simulations of concentrating collectors. The parameters derived from the MLR analysis were used as input in MINSUN. Simulations have been performed for all three collectors and the tilt of the surface was altered in the simulations in order to show the effect of installing the collectors on roofs of different tilt angles.
For Collector A and B, the Kτα function with the b0values from the MLR results was used to describe the incidence angle dependence. For Collector C simulations were performed with the influence of both the longitudinal and the transverse incidence angle dependence. The angular dependence can be described by a function f(θ), as expressed in Equation 8.
)()()( TL hgf θθθ = (8)
The function g(θL) is the incidence angle dependence in the longitudinal plane, where the results of b0 from MLR was used. The function h(θT), represents the transverse incidence angle dependence. The established values from the measurements in Lund were normalised to the MLR result of the η0b value at normal incidence and used for h(θT) in the MINSUN simulations. The F’U0values from the MLR analysis are the most relevant F’U0 values to use, since they are derived from

Paper IV
241
periods of normal operation during an extended time and for larger collectors, which are more similar to the intended product.
The tilt of the surface was also altered in the simulations in order to show the effect of installing the collectors on differently tilted roofs.
3.6 Ray tracing simulations
Ray tracing simulations of Collector C were performed in ZEMAX in order to show the theoretical transverse incidence angle dependence. The reflectance of the reflector was set to 0.85, the transmittance of the glazing to 0.9 and the absorbance of the absorber to 0.9. The incidence angular dependence of the transmittance and the absorbance were accounted for by a variation from 0.9 at normal incidence to 0.0 at 90° incidence similar to the Kτα function.
4. Results
4.1 MLR results
The values in Table 1 were derived from the MLR analysis from 2005-04-02 to 2005-05-05.
Table 1. The results from the MLR analysis.
The MLR analysis shows that the concentrating collectors B and C show lower values of optical efficiency for beam irradiation at normal incidence, compared to the reference, Collector A. This is explained by reflectance losses and deviations from the ideal optical designs of the reflectors. The pipes of Collector C are slightly displaced from the centre of the reflector. The concentrating Collector C shows a lower optical efficiency for diffuse irradiation. Collector B shows the lowest first order heat-loss coefficient, F’U0. The heat loss factors of the concentrating Collector C and the reference, Collector A, are comparable.
The very high specific heat parameter, (mC)e, of Collector C is explained by the 4 times higher water
content in Collector C compared to Collector A and B.
The incidence angular dependence in the longitudinal plane, given by the b0 value, is similar for all the collectors.
4.2 Model accuracy
In Figure 6, 7 and 8, the monitored data of energy output for the 6th of May 2005, a day with varying weather and low temperature, is compared to the corresponding values predicted by the model.
05050606:00 10:00 14:00 18:000
100
200
300
400
500
600
700
800Power (W/m²)
SimulationMeasured
Collector A
Figure 6. Comparison between monitored and simulated results of energy output for Collector A.
05050606:00 10:00 14:00 18:000
100
200
300
400
500
600
700
800Power (W/m²)
SimulationMeasured
Collector B
Figure 7. Comparison between monitored and simulated results of energy output for Collector B.
η0b
[-] η0d
[-] F’U F’U0
[W/m²K]
[W/m2 K]
F’U1
[W/m²K]
mCe
[J/kgK]
b0
[-]
A 0.76 0.65 5.84 4.90 0.017 6834 0.125
B 0.72 0.62 4.93 4.27 0.012 5617 0.134
C 0.72 0.58 5.79 5.29 0.009 19148 0.154

Solar thermal energy systems for building integration
242
06:00 10:00 14:00 18:000
100
200
300
400
500
600
700
800Power (W/m²)
SimulationMeasured
Collector C
Fig 8. Comparison between monitored and simulated results of energy output for Collector C.
Figure 9, 10 and 11 show comparisons between measurements and simulations of the power from the collectors from the period 2005-04-02 to 2005-05-10. The good agreement between simulated and measured results of energy output from the collectors (in figures 6 -11) indicates that the evaluation model works well.
0 100 200 300 400 500 600 700 800Power-measured(W/m²)
0
100
200
300
400
500
600
700
800Power-model(W/m²)
Collector A
Figure 9. Correlation between monitored and simulated thermal effect of Collector A.
0 100 200 300 400 500 600 700 800Power-measured(W/m²)
0
100
200
300
400
500
600
700
800Power-model(W/m²)
Collector B
Figure 10. Correlation between monitored and simulated thermal effect of Collector B.
0 100 200 300 400 500 600 700 800Power-measured(W/m²)
0
100
200
300
400
500
600
700
800Power-model(W/m²)
Collector C
Figure 11. Correlation between monitored and simulated thermal power of Collector C.
4.3 Monitoring of efficiency curves
Standard efficiency curves were plotted based on data from periods during the long-term measurements, when the irradiance was higher than 900 W/m2. Data was taken at near normal incidence and at stable temperatures. The collector efficiencies for ΔT = 0° (see Figure 12) show good agreement with the results of η0b from the MLR results, although not entirely comparable.
Eff
icie
ncy,
η (-
)
0
0.1
0.2
0.3
0.4
0.5
0.6
0.7
0.8
0.9
1
0 0.01 0.02 0.03 0.04 0.05 0.06 0.07
(T m -T a )/I (Km/W)
Collector A
Collector B
Collector C
η = 0.77 – 6.5 (Tm-Ta)/G
η = 0.71 – 5.3 (Tm-Ta)/G
η = 0.70 – 6.0 (Tm-Ta)/G
Figure 12. The efficiency as a function of (Tm-Ta)/I for the three collector prototypes. The slope of the graph isequal to the F’U0-value.
The F´U values from the efficiency graphs at high irradiances are systematically higher than the corresponding data from the MLR results. This is because the data used in the MLR is measured during all hours of operation. An increase in absorbed irradiance causes an increase in the temperature difference between the fin and the heat carrier fluid, which increases F´U [6]. This effect

Paper IV
243
was confirmed by also looking at F´U values from dark hour measurements. The comparison of F´Uvalues is shown in Table 2. The dependence of F´Uon the irradiance is strongest for Collector A, which has a wide absorber and the lowest F´-value.
Table 2. Comparison of F´U values from MLR, from the efficiency curves and from cooling during dark hours.
Collector F’U[W/m²K]
Efficiency
F’U[W/m2 K]
MLR
F’U[W/m²K]
Cooling A 6.5 5.84 5.5
B 5.3 4.93 4.8
C 6.0 5.79 5.5
4.4 The longitudinal incidence angle dependence
Figure 13 (from 1st of May -05) shows that during the long-term measurements, the variation of the transverse incidence angle over the main part of the day was very small, while the variation of the longitudinal incidence angle is far more significant. This means that the b0 values obtained from the MLR analysis practically give information about the angular dependence in the longitudinal direction for all the collectors, as they are mounted with the absorbers in the east-west direction. The reflectors of Collector B and C thus have a small impact on the obtained b0 values.
06:00 10:00 14:00 18:00-80
-60
-40
-20
0
20
40
60
80Angle of incidence (°)
TransversalLongitudinel
Figure 13. Longitudinal and transverse components of the angle of incidence towards the collector plane in the middle of the monitored period.
The longitudinal incidence angle dependence of ηob is derived directly from collected data from varying incidence angles at low operating temperatures during the period from 2005-04-02 to
2005-05-10. The values have been corrected for contribution of diffuse irradiance and heat losses and the results, presented in Figure 14, show that the collectors have similar longitudinal incidence dependencies.
0 10 20 30 40 50 60 70 80 90Angle of incidence(°)
0.0
0.2
0.4
0.6
0.8
1.0ob(-)Beam Efficiency
Collector BCollector C
Collector A
Figure 14. The longitudinal angular dependence of the derived beam efficiency, η0b.
4.5 The transverse incidence angle dependence of Collector C
The transverse incidence angular dependence is important for Collector C, since the acceptance interval is limited in this direction. Measured data of the optical efficiency for beam irradiance, from Lund from the whole day of September 1st 2005, a clear sunny day, was plotted against the transverse incidence angles, θT, as shown in Figure 15.
0.0
0.1
0.2
0.3
0.4
0.5
0.6
0.7
0.8
0.9
1.0
0 10 20 30 40 50 60 70 80
Transverse incidence angle, θ T (°)
Opt
ical
bea
m e
ffic
ienc
y, η
0b (
-)
P.m.
A.m.
Figure 15. The measurement results of the transverse incidence angle dependence of the concentrating Collector C during September 1st 2005. The results from a.m. and p.m. coincide well.

Solar thermal energy systems for building integration
244
As expected, irradiation from within the acceptance interval, 0°- 40°, give higher efficiency than for higher incidence angles. Also, the data from a.m. and p.m. correspond well. The optical efficiency at normal incidence is slightly lower than the MLR analysis for the larger collector showed, which is explained by the relatively lower heat losses of the larger collectors. Over all, the results appear to be accurate.
From these results, a model of the expected optical efficiency for different transverse incidence angles was set-up (see Figure 16).
The model was also adjusted to descend gradually to 0 at 90° from the abrupt down-fall between 70° and 80°, which was the result of the sun descending before reaching 90°, as this was expected also during the following measurements. The values were also normalised to the MLR results of η0b at normal incidence, which are considered the most accurate due to the larger size and the better precision during the production of the prototypes.
The model was validated by comparing measured data of the collector power from another day, August 18, 2005, with modelled values. As can be seen in Figure 17, the accuracy is good.
0.00.10.20.30.40.50.60.70.80.91.0
0 10 20 30 40 50 60 70 80 90Transverse incidence angle, θ T (°)
Opt
ical
bea
m e
ffic
ienc
y, η
0b (
-)
Modelled values normalised to MLR
Modelled values
Figure 16. The model was validated by plotting measured and modelled data of the collector power over measurements from another day, the 18th of August 2005.
0
100
200
300
400
500
600
700
800
07:12 09:36 12:00 14:24 16:48 19:12
Time of day, August 18, 2005
Pow
er (W
/m2)
Measured dataModelled data
Figure 17. The model was validated by plotting measured and modelled data of the collector power over another day, the 18th of August 2005.
4.6 Ray tracing results
Figure 18 shows graphs of the transverse incidence angle dependence, both the modelled values and ray tracing results, which correspond relatively well.
0.0
0.1
0.2
0.3
0.4
0.5
0.6
0.7
0.8
0.9
1.0
0 10 20 30 40 50 60 70 80 90
Transverse incidence angle, θ T (°)
Opt
ical
bea
m e
ffic
ienc
y, η
0b (
-)
Ray tracingresults
Model,normalised toMLRModelledexpected values
Figure 18. Results of incidence angle dependence of Collector C, both from ray-tracing results and from the model set up based on measurements.
The ray tracing results also gave the irradiance patterns and figures of distribution across the tubular absorber for different transverse incidence

Paper IV
245
angles (see Figures 19-22). The x-axis shows the pixels (used in simulations) along the absorber surface from the top and clockwise around. The left side of the absorber tube is thus represented by the higher values on the X-axis.
Figure 19. The irradiance patterns from θT = 20°.
0.000
0.002
0.004
0.006
0.008
0.010
0.012
1 26 51 76 101 126 151 176
Irra
dian
ce (
W/c
m2 )
Figure 20. Light distribution on the absorber. θT = 20°.
Figure 21. The irradiance patterns from θT = 60°.
0.000
0.001
0.001
0.002
0.002
0.003
0.003
0.004
0.004
1 26 51 76 101 126 151 176
Irra
dian
ce (
W/c
m2 )
Figure 22. Light distribution on the absorber. θT = 60°.
4.7 Thermal inertia of the collectors.
The effect of the greater thermal inertia of Collector C, shown by its high (mC)e value, can be observed in Figure 23, 24 and 25, showing the temperature difference between the collector and the ambient air, ΔT, and the measured and modelled power of the collectors during a sudden temperature decrease on the 25th of April 2005. Figure 25 shows that the power of Collector C exhibits a strong peak, while the other collectors show a smaller effect of the temperature decrease. Also here, the model follows the measurements well.
08:00 10:00 12:00 14:00 16:00150
250
350
450
550
650
750Power(W/m²)
MeasuredSimulation
10
14
18
22
26
30
34°C
Tcoll-Tamb
Collector A
Figure 23. The measured and modelled power and ΔT for Collector A during a temperature peak.

Solar thermal energy systems for building integration
246
08:00 10:00 12:00 14:00 16:00150
250
350
450
550
650
750Power(W/m²)
MeasuredSimulation
10
14
18
22
26
30
34°C
Tcoll-Tamb
Collector B
Figure 24. The relative collector temperature and the measured and modelled power of Collector B during a temperature peak.
08:00 10:00 12:00 14:00 16:00150
250
350
450
550
650
750Power(W/m²)
MeasuredSimulation
10
14
18
22
26
30
34°C
Tcoll-Tamb
Collector C
Figure 25. The relative collector temperature and the measured and modelled power of Collector C during a temperature peak.
4.8 MINSUN simulation results
The MINSUN simulation results show that the maximum annual energy output per glazed collector area would be 320 kWh/m2, 330 kWh/m2 and 280 kWh/m2 respectively for collector A, B and C at an operation temperature of 50°C and with a collector tilt of 45°, which proved to be the optimum roof tilt angle. If calculated per absorber area, the corresponding yield would be 360, 680 and 1140 kWh/m2 absorber respectively for collector A, B and C. (The absorber area of collector C is based on the pipe diameter). The simulation results of annual energy output per collector area for varying roof tilt angles are shown in figure 26.
While collector A and B show higher performance per glazed area than collector C, both collector B and C show high energy output per absorber area. Considering the economical potential of cost reductions for the pipe absorber of collector C, both collector B and C seem to have a good potential to
become a cost effective product. The optimal tilt angle of the roof is 45° and for tilt angles between 35° and 50° the annual output is not reduced by more than 2%.
0
50
100
150
200
250
300
350
0 10 20 30 40 50 60 70 80 90
Collector tilt angle (°)
Ann
ual e
nerg
y ou
tput
per
col
lect
or
surf
ace
(kW
h/m
2 a)
Collector ACollector BCollector C
Figure 26. MINSUN simulation results showing the annual energy output for the collector tilts.
5. Discussion
The detailed analyses of the thermal performance of the collectors shows that the flat plate collector, Collector A, and the concentrating tube collector, Collector C, have high heat losses. Collector B, with the narrow strip absorber, shows lower heat losses. The F´U value increase with increasing intensity. The F’ value is temperature dependent and should increase slightly with increased operation temperature, as shown by [6].
The measurements performed in Lund on Collector C show a slightly higher F’U value, which is natural considering the smaller prototypes used, which have a higher area-to-volume ratio.
It is required that the heat losses are further suppressed. This can be done by decreasing the acceptance angle and increasing the concentration ratio. For a previously evaluated non-insulated low-concentrating east-west collector, with a bifacial narrow absorber and a factor 3 between glazed area and single side absorber area, an acceptance interval of 45° has been shown to be sufficient. This collector, a roof-MaReCo, has a F´U0 value of around 3.5-4.0 W/m²K [7]. However, a reflector in the north-south plane requires an acceptance interval of around 80°, as the Collector C, in order to be operated at least 5 hours in the middle of the day in

Paper IV
247
Sweden. The unexpectedly high F´U0 value of the concentrating Collector C should be further analysed.
The analysis of transverse incidence angle dependence of Collector C show results similar to the theoretical values achieved by ray tracing simulations. As expected, the optical efficiency is as highest and almost constant within the acceptance interval from -40° to +40°, and thereafter is diminished. However the deviations shown can be explained by imperfections of the reflector or by a slightly dislocated absorber pipe, which can result in slightly higher optical losses for certain incidence angles.
A cost analysis should preferably also be performed in future work to assure the low cost of the final product.
Considering the very low production costs expected for these collector types, the potential of producing a cost-effective collector are estimated as high, although there are improvements to be made.
6. Conclusions
The thermal performance and incidence angular dependence of two low concentrating and one flat plate reference collector, constructed for direct integration into non-insulated roof, where investigated in detail by outdoor and indoor measurements.
The good correspondence of the measured and the simulated collector performances and temperature variations for the long term measurements leads to the conclusion that the model works well and that the results are accurate.
The simulations show that the maximum annual energy output would be 320 kWh/m2, 330 kWh/m2
and 280 kWh/m2, per glazed collector area,
respectively, or 360 kWh/m2, 680 kWh/m2 and 1140 kWh/m2, per absorber respectively for collector A, B and C at an operation temperature of 50°C and with 45° tilt angle. As there is a potential to further decrease the heat loss coefficients, i.e. by decreasing the acceptance angle and increasing the concentration ratio, there is a high potential of these collectors to be developed into cost-effective products.
Judging from the collectors with their present design, the collector B is the most promising, with low heat losses and little use of absorber material. Collector C is the collector that would be the
cheapest to produce, but the heat losses could be too high to make it profitable.
These solar collectors combined in a ready-to-use roofing material should preferably be mounted as entire roofs of cold spaces, which could give a significant contribution to the heat supply.
List of symbols
b0 Incidence angle modifier coefficient (-) dT/dt Momentary mean collector temperature increase (K/s) F’U Heat loss coefficient (W/m2K)F’U0 First order heat loss coefficient (W/m2K) F’U1 Second order heat loss coefficient
(W/m2K2)G Global irradiance (W/m2)Gb Beam irradiance (W/m2)Gd Diffuse irradiance (W/m2)Kτα Incidence angle modifier (-) (mC)e Collector specific heat capacity (J/m2K) Ta Ambient temperature (°C) Tm Mean collector temperature (°C) Tin Inlet temperature (°C) Tout Outlet temperature (°C) T Time (s) q Collector power (W/m2)δ Declination (°) η0b Optical efficiency, beam irradiance (-) η0d Optical efficiency, diffuse irradiance (-) θ Angle of incidence (º) θL Longitudinal angle of incidence (º)θT Transverse angle of incidence (º) θa/2 Acceptance half-angle (º) ω Angle of time (°)
Acknowledgements
This work was financially supported by the Swedish Energy Agency. This project was partly carried out in cooperation with the construction company NCC Construction Sweden.
References
[1] W.T Welford and R. Winston, High Collection Nonimaging Optics (Academic Press Inc., San Diego, 1989).

Solar thermal energy systems for building integration
248
[2] B. Perers, Solar Energy 50, (1993) 517-526.
[3] J.A. Duffie and W.A. Beckman, 1991. Solar Engineering of Thermal Processes (Wiley Interscience, New York, 1991).
[4] V.G. Chant and R. Håkansson, The MINSUN simulation and optimisation program, application and users guide, IEA SH&C Task VII, Ottawa, 1985.
[5] B. Perers, Optical Modelling of Solar Collectors and Booster Reflectors under Non Stationary Conditions, Ph.D. Thesis , Department of Technology, Uppsala University, Sweden, 1995.
[6] B. Hellström, Calculation and Measurement Methods for the Performance of Solar Collectors, Ph.D. Thesis, Department of Construction and Architecture, Lund University, Sweden, 2005.
[7] M. Adsten, A. Helgesson and B. Karlsson, Solar Energy 79 (2005) 638-647.

Paper V
249
Paper V

Solar thermal energy systems for building integration
250

Paper V
251
1-292 EuroSun2004
01
Measurement of concentrating solar collectors using a solar simulator with parallel light
Helena Gajbert, Energy and Building Design, Lund University, Sweden Håkan Håkansson, Energy and Building Design, Lund University, Sweden Björn Karlsson, Energy and Building Design, Lund University, Sweden
By indoor measurements with steady surrounding conditions evaluations of concentrating solar collectors could be facilitated and made more systematic. In this article, a method is described of how indoor measurements of incidence angular dependence of concentrating collectors can be performed by using a large solar simulator providing nearly parallel light. The problem of spatial non-uniform irradiation from the described simulator is taken into account and compensated for by measurements of the total irradiation by several photodiodes placed in front of the test area.
Background
Concentrating solar collectors have a potential to be cost efficient in comparison to flat plate collectors due to lower investment costs (Adsten, 2002). The ability of evaluating solar collectors indoors provides independence of unwanted climate changes and facilitates the repetitiveness of the experiments. In order to enable indoor evaluation of concentrating solar collectors, a light source with parallel light is required. These kinds of light sources are not common, hence indoor evaluations are rare. A solar simulator providing nearly parallel light, and adjustable for solar angles is in use at Energy and Building Design at Lund Institute of Technology. The distribution of irradiated light from the simulator is however rather uneven. Hence, some results from previously performed evaluations of concentrating solar collectors have been somewhat difficult to interpret. (Gajbert et al., 2003)
The objective of this work is to develop a method to compensate for the non-uniform light distribution and the movements of the light pattern while using the solar simulator. The aim is to improve evaluations of incidence angle dependence of concentrating solar collectors using the simulator.
A method that serves this purpose has been developed and is presented in this article. The idea is to estimate the total irradiance on the test area, based on continuous measurements with a number of photodiodes placed on the glazed surface of the solar collectors. By using this method, two different types of concentrating collectors with limited acceptance angles have been evaluated with respect to incidence angle dependence of the zero-loss efficiency and the results are presented and discussed in this article. Another method which assumes that the irradiance on the collector is proportional to the cosine of the angle of incidence is also tested. The results of these two methods are presented and discussed here.
The solar simulator
The large indoor solar simulator used for some of the measurements in this work, is shown in figure 1. The simulator is further described in Håkansson (2003 a, b) and Håkansson (2001). Seven large parabolic reflectors are used to render the light nearly parallel, which is a rare quality for solar simulators. The simulator was originally designed for simulation of

Solar thermal energy systems for building integration
252
1-29301 – Solar Thermal Energy (low and medium temperature applications)
01
daylight for evaluations of solar shadings. However, the parallel light is an important characteristic also for evaluation of the incidence angle dependence of concentrating collectors and it is desirable to be able to adequately perform this kind of evaluations. In order to achieve correct registered values of the irradiation on the collector surface during measurements, it is important that the total irradiation is known throughout the measurement, hence also when shifting solar altitude, i.e. lifting the simulator.
Figure 1. The solar simulator horizontally and lifted to the maximum elevation of 70°.
The good parallel light quality of the simulator has been achieved, to some extent, at the expense of a uniform area distribution. Fewer larger lamps generating nearly parallel light are used instead of smaller, but more numerous lamps generating more diverging but more evenly distributed light. The light intensity has been measured at several locations over a central test area, perpendicularly to the simulator, and the resulting intensity distribution diagram is shown in figure 2 (Håkansson, 2003 a, b).
0
0.2
0.4
0.6
0.8
1
1.2
0
0.2
0.4
0.6
0.8
1
1.2
0
500
000
500
000
Figure 2. Light intensity distribution pattern from the solar simulator over a test area perpendicular to the simulator.
The light intensity peaks emanates the rim of the reflectors surrounding the lamps (Håkansson, 2003 a). When the simulator is lifted to simulate different incidence angles,

Paper V
253
1-294 EuroSun2004
01
the light intensity pattern tend to move over the test area, thus possibly changing the total irradiation on the object. As the irradiation normally is measured by a single pyranometer, the results could be misleading. Earlier results from evaluations of incidence angle dependence of concentrating collectors were initially found to be poorly corresponding to similar outdoors measurements, thus indicating that the effect of the lifted simulator and the consequently moving light intensity pattern significantly altered these results. (Gajbert et al., 2003)
Compensation method for non-uniform illumination
In order to compensate for the moving light pattern an array consisting of six photodiodes connected in parallel, has been created and placed on the glazed surface of the collectors at the time of the measurement. The placement of the photodiodes divides the front area of the solar collector into smaller areas of approximately equal size with one photodiode placed in the centre of each area. With this arrangement, the total current from the photodiode array should be a rather good representation of the total irradiance on the collector surface.
The non-uniform irradiance makes it difficult to get absolute values of optical efficiency, 0,
from indoor measurements. Therefore, the calculated optical efficiencies from indoor
measurements were adjusted to match the value of 0 from outdoor measurements.
Designs of the evaluated concentrating solar collectors
The roof MaReCo, previously described by Adsten (2002), is 2D, concentrating solar collector intended to be placed on a tilted roof, see figure 3. It has a reflector designed as a parabola combined with a circular section and an absorber that absorbs irradiation on
the back side from an acceptance interval between 0 and 60 solar altitude angle, when placed on a roof with 30° slope. The absorber also receives direct irradiation on the absorber. A prototype of this design was evaluated by indoor and outdoor measurements of thermal performance at varying incidence angles. The glazing of the prototype was replaced by a Teflon film.
Figure 3. Design of MaReCo for tilted roofs (figure from Adsten, 2002).
The other concentrating solar collector evaluated here is a hybrid solar window, which basically consists of a parabolic reflector and a hybrid absorber, designed with a

Solar thermal energy systems for building integration
254
1-29501 – Solar Thermal Energy (low and medium temperature applications)
01
concentration ratio of 2.45. The function of the reflector is both to concentrate the irradiance onto the absorber and to be used as solar shading, as the reflectors may be rotated backwards, as shown in figure 4. The hybrid absorbers consist of thermal absorbers with photovoltaic cells laminated on the surface. The wall element is further described by Fieber et al. (2004). The efficiency of the thermal absorbers in a prototype of this design was evaluated by indoor and outdoor measurements at varying incidence angles. The glazing of the prototype consists of two anti-reflex coated glass panes.
Figure 4. The hybrid solar window.
Incidence angle dependence of the concentrating collectors
For these types of 2D concentrating collectors, the incidence angle dependence of the optical efficiency is composed by the angular dependence of both the transversal and the longitudinal plane, as illustrated in figure 5.
L
T
Figure 5. The longitudinal incidence angle, L, and the transversal incidence angle, T, of a 2D concentrating collector.
A propsed biaxial model, based on separate measurements of the effect on the optical efficiency of the reflector and the glazing, is shown in equation (1).

Paper V
255
1-296 EuroSun2004
01
)()(),(iLTTTL
fRK (1)
Here, fL ( i) gives the influence of the glazing and is obtained by measuring the angular
optical efficiency in the longitudinal plane at a given T, when the reflector gives a constant
contribution. RT ( T) gives the influence of the reflector and is obtained by measuring the
angular optical efficiency of the collector in the transversal plane when L = 0. If glazing is
used, the function K( L= 0, T) gets contribution from both the glazing and the reflector
according to equation (1). Then RT( T) will be obtained from equation (2) according to equation (3).
K( L=0, T)= RT ( T)* fL ( T). (2)
TL
TT
fR
)K(0, T (3)
This means that the ratio between the measured dependency in the T and L directions gives the influence of the reflector only.
The following complete expression for the angular dependency is obtained from equation (4).
TTL
TL
TLtot
LTLtot Rff
KfK
,0, (4)
In the longitudinal plane, the angular dependence consists only of the dependence of the
glazing, f( L). This means K , in the longitudinal plane can be described as flat plate collector by equation (5), where b0 is an incidence angle modifier coefficient, characteristic for the glazing (Duffie and Beckman, 1991).
1cos
11 0bK (5)
Measurements of incidence angle dependence of the concentrating collectors
The two previously described prototypes of concentrating reflectors have been evaluated for incidence angle dependence by indoor and outdoor measurements. During indoor measurements, the collectors where placed at the pivot point of the simulator and the photo diode array was placed on collector surfaces. The irradiance to the collectors where also measured with a pyranometer. The incidence angles were simulated by raising the simulator or by rotating the collectors when placed vertically in front of the simulator.
K(0, T) was derived from the measured values and divided by fL( L), in order to get RT( T).
A single outdoor measurement was performed at T =30° for the roof MaReCo and T =20°for the solar hybrid window. The relations between the current from the photodiode array and the irradiation at corresponding incidence angles at outdoor measurements were

Solar thermal energy systems for building integration
256
1-29701 – Solar Thermal Energy (low and medium temperature applications)
01
calculated. A compensation of the cosine dependence of the incidence angles was also performed, assuming that the total irradiation from the simulator is constant throughout the
measurement and that the irradiance on the collector is dependent on cos T.
The calorimetric measurements were performed with the temperature difference, T, between the water in the collector and the ambient air maintained close to zero. The flow for the calorimetric measurements is recorded with an inductive flow meter and the temperature difference between in- and outlet is measured with a thermopile consisting of five thermocouple pairs. The thermal performance was registered continuously during the measurements.
A comparison has been made to corresponding outdoor measurements of both fL( T) and
K(0, T) of the roof MaReCo, that were previously performed on a larger prototype with identical geometrical features.
Results from indoor and outdoor measurements
The results of the evaluations of the roof MaReCo are shown in figure 6. These values are thus the angular dependence of the reflector exclusively, since the influence from the Teflon and the glazing are deducted, as earlier described. The measurements show good agreement for both methods for low angles of incidence. For high angle of incidence, when the irradiance is low, the cosine dependence shows better agreement with outdoor measurements than diode compensated data.
0
0,1
0,2
0,3
0,4
0,5
0,6
0,7
0,8
0,9
1
-60 -50 -40 -30 -20 -10 0 10 20 30
Incidence angle, T (°)
Op
tica
l e
ffic
ien
cy (
-)
Outdoor measurments
Photo diode compensation
Cosine compensation
Figure 6. The incidence angular dependence of the roof MaReCo from indoor and outdoor measurements are shown here. The interval of incidence angles corresponds to the
interval when placed at a 30° tilted roof. Then -60° means T=0° and 30° means T=90.
An equal relation between the indoor and outdoor measurements of the solar hybrid window was found for the roof MaReCo. This result gives another indication of that the

Paper V
257
1-298 EuroSun2004
01
method is working satisfactory and that the simulator can be used for characterisation of concentrating collectors. However, at higher incidence angles, the agreement is not as good as for lower angles, suggesting that the method still needs further improvements.
Discussion
The results of incidence angular dependence from outdoor and indoor measurements show that the agreement is good at lower incidence angles. At higher incidence angles, the correspondence is less accurate. There are possibilities to improve the method further. By adding more photodiodes to the array, the accuracy of the measured total irradiance would be better. Improvements of the reflectors of the solar simulator, to obtain a more even light field, are also possible. An explanation for the lower correspondence at higher incidence angles could be that the active test area is smaller and that the power involved is lower.
References
Adsten M. (2002) Solar Thermal Collectors at High Latitudes - Design and Performance of Non-Tracking Concentrators, Acta Universitatis Upsaliensis, Uppsala, Sweden. ISBN 91-554-5274-4
Brogren M. (2004) Optical efficiency of low-concentrating solar energy systems with parabolic reflectors, Acta Universitatis Upsaliensis, Uppsala, Sweden. ISBN91-554-5867-X
Duffie J. A. and Beckman W. A. (1991) Solar Engineering of Thermal Processes, 2nd edn. Wiley Interscience, New York.
Fieber A., Gajbert H., Håkansson H., Nilsson J., Rosencrantz T. and Karlsson B., (2004) Design, Building Integration and Performance of a Hybrid Solar Wall Element, submitted to Eurosun2004, 20-23 June 2004, Freiburg, Germany.
Gajbert H., Brogren M. and Karlsson B. (2003) Optimisation of reflector and module geometries for stationary, low-concentrating, facade-integrated photovoltaic systems, Submitted to Solar Energy, In Optical efficiency of low-concentrating solar energy systems with parabolic reflectors, Brogren M., (2004) Acta Universitatis Upsaliensis, Uppsala, Sweden. ISBN 91-554-5867-X.
Håkansson H. (2003 a) A parallel beam solar simulator for testing of solar components, In the proceedings of ISES Solar World Congress 2003, Gothenburg, Sweden 14–19 June 2003.
Håkansson H. (2003 b) Solar laboratory, In Solar Protection in Buildings: Part 2, Wall M., Bülow-Hübe H. (eds), pp. 29-67. Dept. of Construction and Architecture, Lund University. ISBN 91-85147-00-1.

Solar thermal energy systems for building integration
258
1-29901 – Solar Thermal Energy (low and medium temperature applications)
01
Håkansson H. (2001) Solar laboratory, In Solar Protection in Buildings, Wall M., Bülow-Hübe H. (eds), pp. 49-66. Dept. of Construction and Architecture, Lund University. ISRN LUTAD/TABK--3060-SE.
Karlsson B., Nilsson J., Gajbert H. and Helgesson A. (2004) A unified model for the incidence angle dependence of solar collectors, PV modules, windows and sun-shades, submitted to Eurosun2004, 20-23 June 2004, Freiburg, Germany.

Paper VI
259
Paper VI

Solar thermal energy systems for building integration
260

Paper VI
261
DESIGN AND PERFORMANCE OF A LARGE SOLAR THERMAL SYSTEM WITH FAÇADE-INTEGRATED COLLECTORS IN SEVERAL DIRECTIONS, CONNECTED TO THE DISTRICT HEATING
SYSTEM
Helena Gajbert, Bengt Perers and Björn KarlssonEnergy and Building Design, Lund University, Box 118, 221 00 Lund, Sweden
Phone: +46-46-2227583, Fax: +46-46-2224719, E-mail: [email protected]
Astract - A reliable and robust control system is crucial for an optimally working solar thermal system. Improvements of system solutions are required in order to facilitate and widen the use of solar thermal systems. A large façade-integrated, highly automated solar thermal system is connected to the outgoing side of the district heating system in Malmö, Sweden, and has been operated and monitored since June 2002 without interruptions. The aim of this work is to investigate and describe the function of this innovative system. Simulations of energy output from the collectors and parametrical studies of temperatures and tilt angles have been performed. The flows of the five collectors, directed towards east, south and west, tilted in 90° and 73°, are coordinated to minimize the operating temperatures of the collectors, thus lowering the heat losses and resulting in a well-balanced heat production over the day. The system has an overheat protection system based on partial evaporation, where a compressor-connected expansion system is used for automatic refilling after boiling. From 2002-07-01 to 2003-10-30, the collectors delivered 180 kWh/m²a to the district heating system, with a peak power of 0.3 MW, which is as expected from a system with non-optimally oriented collectors. According to simulations performed with WINSUN, the average annual energy output should be 174 kWh/m²a, i.e. a divergence of 3% from the measured output. The simulations performed show relatively good agreement with measured energy output and the parametrical studies performed give an indication of the influence of the separated collectors on the total energy output.
1. INTRODUCTION
1.1 Background A reliable and robust control system is crucial for an
optimally working solar thermal system. Improvements of system solutions are important in order to facilitate and widen the use of solar thermal systems. By connecting solar thermal collectors to the district heating system, problems with stagnation in the collectors can easily be avoided due to the constantly large heating demand. Since no heat storage is needed, the heat losses otherwise caused by a storage tank are avoided.
This paper describes some interesting design features and experiences from one of the largest façade-integrated solar thermal systems in Europe, which also is connected to the local district heating system and has several relatively new control solutions.
The 1050 m² collectors are oriented in different directions, towards east, west and south, on the wall of a sports centre in Malmö, Sweden. It is integrated in the façade, and the energy output is delivered to the district heating system. The system, which is highly automated and remote-controlled, has been operated successfully and monitored since June 2002 without stagnations problems or interruptions. The system is one of 10 solar heat-producing subsystems connected to the forward side of the district heating system, thus serving as small power plants. The total collector area of the ten systems is 2030 m2.
1.2 Objectives of this work This study is concentrated on evaluating the
performance and system design of this highly automated solar thermal system, with the aim to describe some important design features of the system, as it may be beneficial to apply these features elsewhere.
Parametrical simulation studies have been performed in order to show the importance of potential improvements that could be the result of changes of some of the design features such as the orientation of the collectors and the operation temperature.
2. SYSTEM DESCRIPTION
2.1 General system design The 1050 m2 large flat plate collectors from Aquasol
with antireflection treated and frosted glass are modified for attractive façade integration. The five collectors are divided into three subsystems, which are integrated in the façades in directions close to east, south and west and tilted in 90° and 73°. The areas, azimuth angles and tilt angles of the collectors are shown in table 1.

Solar thermal energy systems for building integration
262
2.3 The flows in the collector circuitsTable 1. The size and orientations of the collectors.The flow in the solar circuit is divided into three main
circuits, as the heat transfer medium, Tyfocor (1,2-propylene glycol, 42-45 %), in the collectors with thesame azimuth angle are mixed by static control valves(figure 1).
Direction Azimuthangle, z
Collectortilt, β
Collectorarea (m²)
East -98° 90° 181,6South -8° 90° 371,2South -8° 73° 221,6West 82 90° 112,4West 82 73° 163,4
The flows through the three main collector circuits varycontinuously. Two PID regulators seek to modify thepositions of two motorized three-port control valves, V1and V2, which mix the flows in a way that minimises thetemperature differences between the outflows from thethree circuits. The flows from the eastern and the westerncollector circuit are mixed in V1, so that Tw and Te arebalanced. The valve V2 mixes the flow from thecollectors towards east/west with the flow from thesouthern collectors so that the highest temperature of Twand Te is balanced to Ts. This results in a higher flowthrough the circuit of the most illuminated collector.Therefore, the operation temperatures, and thus the heatlosses, in the most illuminated collectors are minimised,resulting in an optimised energy output.
In figure 1, an overview of the system design with themeasured temperatures marked out is shown.
Ex.
E 90°
S 73°
S 90°
W 90°
W 73°
F
R
FS
Tw
TSol,hTs
Te
TDHS, h
TSol,c TDHS, c
V1
V3
V4
V2
PSOL PDHS
As the valve positions are altered and the flows in the sub circuits change, the total flow rate in the main solarcircuit is changed as well, although the pump power is constant during the time the system delivers energy to thedistrict heating system.
Figure 1. An overview of the system design. These are strategies to create a well-balancedtemperature and flow variation between the collectorcircuits over the day.
The collectors are marked with S, W and E for the orientations towards south, west and east, and with the tilt angles. The temperatures from the outlets of the collectortowards south, (Ts), west (Tw) and east (Te) are shown aswells as the hot and cold temperatures on the solar circuitside (Tsol,h) and (Tsol,c) and the correspondingtemperatures on the district heating system side (TDHS, h)and (TDHS, c). The expansion vessel (Ex), the flow sensor(FS), the forward (F) and the return (R) pipes of thedistrict heating system, the solar circuit pump (PSOL), the pump on the district heating side (PDHS) and the three-way valves (V1, V2, V3 and V4) are marked as well.
2.4 Start up and shut down control of the solar circuitThe start up and shut down of the solar circulation
pump, PSOL, is controlled by a timer, which is programmed with start and stop hours, based on the timeof sunrise and sunset, varying from month to month. Thetimer starts the pump running at 25% of the powerrequired to obtain the dimensioned flow rate. The pumpis operating like this for two minutes, or as long as any ofthe three measured outlet temperatures, Te, Ts and Tw, arehigher than 40°C. Meanwhile, the temperature of theTyfocor at the solar inlet to the heat exchanger, Tsol,,h, ismeasured. In this way, overheating and loss of availableenergy is avoided.
The control system allows cooperation of the fivecollectors.
Heat is delivered at minimum 65°C to the forward sideof the district heating system by a plate heat exchanger.
When the temperature Tsol, h rises above 67°C, the district heating pump, PDHS, is started and the solar circuitpump activity is thereafter increased to 100%, whichcorresponds to the dimensioned flow in the solar circuit.2.2 The system design process
Before the system was built, the system design had firstbeen tested with several different operation modes in simulations with the software Dymola and a pilot planthad been erected where measurements had beenperformed, all in order to find the most efficient solarthermal system. As most of the components used in thesolar thermal systems are of the same type as those usedin the conventional part of the district heating system, therepair time is reduced.
The bypass valve, V3, protects the heat exchangeragainst freezing. It is kept open to the heat exchanger aslong as Tsol, h is higher than 5°C. When the temperature is lower than that, V3 shuts and the liquid is shunted outsidethe heat exchanger.
If the temperatures Te, Ts and Tw are lower than 40°C,the solar circulation pump is shut off but new attempts tostart up again are performed every 30 minutes until thetimer shuts off the system for the day. The fact that the temperature sensor Tsol,h which controls the start of the pump PDHS, is placed in the basement of the building,

Paper VI
263
gives a more robust system compared to if the temperature sensors on the roof would have been controlling the start of the system. The energy lost by running the pump on 25% is during short periods is very low.
A plate heat exchanger which works with equal flow rates on both sides, allows the temperature in the collector circuit, and thus also the heat losses, to be kept as low as possible.
2.5 The control of the district heating circuit It is very important that the water going out to the
district heating system has reached the minimum temperature of 65°C in order to secure the thermal comfort for the customers.
In the heat exchanger, the return flow from the district heating system is heated from approximately 45°C to the temperature required for the outgoing flow, which is 65°C minimum (and approximately 85°C maximum).
The three-way valve, V4, is used to control the flow through the heat exchanger on the district heating system side, adjusting the temperature of the outgoing water. The valve is open enough to secure that the temperature coming out from the heat exchanger, TDHS,h, is 65°C or higher. If TDHS,h, is too low, the water is re-circulated through the heat exchanger.
The pump in the district heating circuit, PDHS, is a distribution pump that increases the pressure from 4 bar on the return side to approximately 7 bar on the outgoing side, which is a rather electricity demanding process. The highest pressure in the district heating system is 12 bar. The pump is active as long as Tsol, h is 65°C or higher. The pump power is then adjusted with the aim to generate equal flow rates on the both sides of the heat exchanger.
The flow sensor (FL in figure 1) registers the actual flow rate in the district heating system circuit by measuring the pressure difference over a measuring flange. Flow disturbances from the district heating system and from the heat exchanger can thereby be adjusted.
The optimal pump power is calculated based on the position of the control valves and the flows in the solar sub circuits. This regulates the set point for the power of the pump on the district heating side.
When PDHW is operating the solar pump Psol, is set to operation mode (100%), providing the dimensioned flow in the solar circuit.
If the valve V4 on the district heating side has been closed for ten minutes, the district heating pump is shut off and the solar circuit pump is set to its mode of 25% rotation speed, waiting for the temperature to rise before a start-up can be initiated once again.
In case of activated freezing alarm, the three-way valve of the district heating system circuit is opened just enough to keep the outgoing water above 15°C.
By having double control functions for the pump, on both the temperature and the flow of the circuit, the system becomes more robust.
2.6 Overheat protection by partial evaporationOne important design criterion has been not to let the
heat transfer medium out of the system unless it is absolutely necessary. The system is protected from overheating by control features allowing partial evaporation of the heat transfer medium. The system is equipped with a compressor-fed expansion vessel that is automatically refilled after boiling. The large expansion vessel of 1000 l is designed to handle the entire collector volume of the system. In case of boiling and stagnation, the pressure will rise to a certain limit before air is let out of the expansion vessel through a solenoid valve, maintaining this slightly higher pressure. The solar circulation pump is then stopped, in order to prevent as much of the liquid as possible from boiling and to protect the collectors from hammering as the hot steam condenses when meeting the cold liquid. The heat transfer medium is thereby pressed backwards into the expansion vessel. As the weight of the expansion vessel increases over a critical level, a pressure sensor triggers an alarm to the control centre.
When the collectors have been cooled down and the Tyfocor condensates, the pressure in the solar circuit decreases and the medium in the expansion vessel is pressed back into the system, due to the higher pressure in the expansion vessel. The compressor refills the expansion vessel with air to a certain pressure and the solar circuit is then ready for operation again.
If electricity is unavailable the solenoid valve can not open and decrease the pressure. To handle this scenario a mechanical safety valve on the airside of the expansion vessel opens. If this also fails each of the five collector subsystems are equipped with a mechanical safety valve. The Tyfocor released from these valves are collected in a large container. From this container the system can be refilled manually with an electric pressure pump.
The risk of implosion, which may arise due to too low pressure when the heat transfer media is running back into the system and the compressor is not in operation, is prevented by another valve that opens if the pressure is below a certain limit, letting air into the system. The system has never been exposed to boiling but the pilot plant was in stagnation several times during the design faze, both with and without electricity, and the overheat control strategy was proven successful.
2.7 The system as a part of the district heating system The system works as any other conventional production
unit in the district heating net, with the exception that the production can not be predicted and the production unit is installed at a customer. It is therefore extremely important that the solar thermal system is robust and provides a high availability, in order for the system not to cause disturbances, like low-temperature water going out on the district heating net. This could cause discomfort for the customers and create a demand for adjusting the problem, which would probably have been done by using electricity peak power.

Solar thermal energy systems for building integration
264
Figure 2. The large façade-integrated collectors.
It has its own data collection algorithm that uses thedeviations between the sampling points to decide if a newdata point should be stored or not. The total energyoutput is measured on the district heating circuit by an energy meter. The temperatures in and out of the heatexchanger are measured, which makes it possible tomonitor the performance of the heat exchanger.
The knowledge about the district heating system and thenearby consumers are utilized to optimise the operationcircumstances of the solar collector system. The solar system is situated in the outer parts of the district heatingsystem but still very close to a larger group of consumers.The buildings in this area are built with consideration tothe fact that they need to keep thermal comfort at the minimum temperature of 65°C from the district heating system. Because of the closeness and the low temperaturerequired the heat losses can be kept very low.
2.9 Architectural aspects of the building integrationThe installation of the collectors was carried out as a
replacement of the old façade and they have been givenan interesting and appealing design, well integrated in thebuilding. The frosted glazing makes the collectors moreappealing but lowers the energy output and hides theabsorber fins.
Another important characteristic of the system is thatthe pipe from the heat exchanger to the main forwardpipe of the district heating system is designed as short aspossible, in order to avoid low-temperature water goingout to the customers.
The bold design of the collectors occupying a very largepart of the façade (see figure 2), accentuates the solar panels and emphasises the concept of renewable energyuse and sustainable solutions.
2.8 Measurements and monitoringHourly values of temperatures, flow rates, valve
positions, pump activity etc. from the system are measured continuously and collected in a data base at thecontrol centre of the district heating network. From therethe system control parameters can be changed and theoperation controlled. A new control system is used and ithas access to every measuring point in the solar system.
2.10 Economical aspectsEconomical support from the government for local
investment programs have been received for theinstallations of the collectors, belonging to the sports

Paper VI
265
WINSUN used climatic data from Meteonorm for atypical year in Lund, close to Malmö. This means thatWINSUN predicts the annual performance of thecollectors for a normal year in Lund. The Meteonorm data were then compared with solar radiation data fromthe Technical University of Denmark, Copenhagen,registered during the measured period.
centre. For the energy company Sydkraft (that owns thedelivered energy and the system components except thecollectors) the alternative to installing this solar thermalsystem was to increase the heat production elsewhere inthe district heating system. The possibility of installing a large field of collectors outside the city and connecting it to the district heating system was never a realistic optionsince the long piping required and the high cost of groundarea would have made the project far too expensive. Incomparison to that option, the placement of the collectorson the façade provides an economically advantageoussolution.
4. RESULTS
4.1 The over all energy yield from the systemDuring the investigated period from 2002-07-01 to
2003-06-30, the system delivered 189000 kWh to thedistrict heating system, i.e. 180 kWh/m² collector area,with a peak power of 0.3 MW. The COP, the CoefficientOf Performance, i.e. the thermal energy produced per unit(kWh) electricity used for the system operation, e.g.pumps etc. was 24, according to the measurements.
3. EVALUATION METHODS
3.1 The WINSUN programThe TRNSYS based simulation program WINSUN was
used for the simulations of solar gains from the differentcollectors. The program calculates the theoretical monthly energy output from the solar collectors usingclimatic data from Meteonorm as input data. The programalso uses the monthly operation temperatures of thecollectors, parameters of the collector performances andorientations, climatic data and certain other surroundingconditions. It returns the monthly energy output for theperiod.
The results from the simulations show an expectedenergy output of 183000 kWh/a, i.e. 174 kWh/m2a, which is a divergence of only 3% from the measured output.
The results of annual energy output are as high as can be expected from a system with collectors in non-optimaldirections.
4.2 Correspondence of measured and simulated energyoutput and irradiation
3.1 Data analysis and simulations Monthly values of simulated energy output from thesolar collectors during an average year and measuredmonthly values of total energy output on the districtheating system during the investigated period are shownin figure 3. The simulated values show a similardispersion over the year as the measured values, althoughthere are obvious deviations, largest in March andSeptember. When the measured output is lower than thesimulations, the deviation could possibly be explained bythe fact that the district heating pump does not start until67°C is obtained at the inlet to the heat exchanger.
Measured data from the solar thermal system from theperiod 2002-07-01 to 2003-06-30 have been analysed andused for simulations. Each collector was simulatedseparately. The performance parameters of the collectorsfrom Aquasol that was used as input to WINSUN areshown in table 2. The parameters are the results ofcollector test performed by SP, the Swedish NationalTesting and Research Institute. The parameter c0 is 0.83 for the collector in its original design, but was for thiscase estimated lower, due to the frosted glazing.
Table 2. The collector performance parameters of the Aquasol collectors used in WINSUN. The parameter c0 isnormally 0.83 but was estimated lower due to the frostedglazing.
0
5000
10000
15000
20000
25000
30000
35000
jul -
02
aug
-02
sep
-02
oct -
02
nov
-02
dec
-02
jan
-03
feb
-03
mar
-03
apr -
03
maj
-03
jun
-03
Tota
l ene
rgy
outp
ut (k
Wh/
mon
th)
Measured
Simulated
c0(W/m²K)
c1(W/m²K)
c2(W/m²K²)
b0(-)
0.81 (0.83) 2.7 0.03 0.10
Solar radiation data from site of the collectors were notavailable. Therefore a detailed analysis of the performance of the system was not possible. Insteadsimulations were performed with the WINSUN program.Monthly mean flow weighted operation temperatures inthe collectors were derived from measurements and usedas input in the simulation program. The average operationtemperature over the year was calculated to 63°C.
Figure 3. Measured and simulated results of the totalmonthly energy output from the solar thermal system.
The divergence can also be explained by the naturalclimate changes from year to year. The solar irradiation

Solar thermal energy systems for building integration
266
The result show that the measured beam irradiation,diverge significantly from the reference year used inWINSUN. This, together with the fact that the model is rather rough, can probably explain the difference betweensimulated and measured energy output from thecollectors. The simulations can thus be accepted as givinginteresting indications of the actual output.
varies considerably from year to year and the collector output also varies accordingly with ± 20% around theaverage value, according to an investigation of data froma 16 year period presented by Adsten (2002).
Figure 4 shows that data used in WINSUN (originallyfrom Meteonorm) of global irradiation on horizontal,which represent an average year, correspond rather wellwith the measured data from Copenhagen. Data is shownfor the year 2002 and the first six months of 2003. 4.3 The cooperation of the collectors
Figure 6 shows the positions of the motorized three-wayvalves, V1 and V2 in figure 1, which alter the flows ofthe main collector sub circuits. The data is from the 20th
of July 2003, a sunny clear day when the solar pump wasworking at 100% speed during the whole day.
From the measured data from Copenhagen from 2003there were some data points missing. Therefore the meanvalues of the measured values each month have been usedinstead for 2003.
020406080
100120140160180200
Jan
-02
Feb
-02
Mar
-02
Apr
-02
Maj
-02
Jun
-02
Jul -
02A
ug -0
2S
ep -0
2O
ct -0
2
Nov
-02
Dec
-02
Jan
-03
Feb
-03
Mar
-03
Apr
-03
Maj
-03
Jun
-03G
loba
l irr
adia
tion
(kW
h/m
²,mon
th) Reference year
Measured
0102030405060708090
100
05:0
006
:00
07:0
008
:00
09:0
010
:00
11:0
012
:00
13:0
014
:00
15:0
016
:00
17:0
018
:00
19:0
020
:00
21:0
022
:00
Val
ve p
ositi
ons
(%)
Valve EW/S (%open to EW)
Valve E/W (%open to E)
Figure 4. Monthly values of global irradiation onhorizontal from Copenhagen and the correspondingreference year values used in WINSUN.
Figure 6. The positions of the motorized three-wayvalves, V1 and V2, controlling the flows of the collectorcircuits, measured during a clear summer day, the 20th ofJuly 2003.
However, the direct beam irradiation also plays animportant role for the energy production from the solarcollector. Figure 5 shows the variation in measuredvalues of direct beam irradiation, normal to the sun, fromCopenhagen. The difference between these values is verylarge during the year and is very large in March andSeptember. This variation in beam irradiation from yearto year could explain the deviation of energy outputshown in figure 3.
In figure 7, data of the outlet temperatures from thedifferent collectors, Te, Ts and Tw, (from the same day)are shown as well as the temperatures going in to the heatexchanger on the solar side, TSol,h, and out of the heatexchanger on the district heating side, TDHS,h.
Figure 7 shows that the temperatures in and out of theheat exchanger, Tsol, h and TDHS, h, are stable from 07:00 to20:00. As the temperature TSol,h is decreasing below 67°in the evening, the district heating pump is stopped andno more energy is delivered to the district heating system.This can be seen in figure 8, showing the total energydelivered to the system during the day.
020406080
100120140160180200
Jan-
02Fe
b-02
Mar
-02
Apr
-02
May
-02
Jun-
02Ju
l-02
Aug-
02Se
p-02
Oct
-02
Nov
-02
Dec
-02
Jan-
03Fe
b-03
Mar
-03
Apr
-03
May
-03
Jun-
03
Mon
thly
val
ues
of b
eam
irrad
iatio
n (k
Wh/
m²)
MeasuredReference year
Figure 5. Monthly values of beam irradiation fromCopenhagen and the corresponding values used in theclimate data in WINSUN.

Paper VI
267
0102030405060708090
100110
04:0
005
:00
06:0
007
:00
08:0
009
:00
10:0
011
:00
12:0
013
:00
14:0
015
:00
16:0
017
:00
18:0
019
:00
20:0
021
:00
22:0
0Mea
sure
d te
mpe
ratu
res
(°C
) Te Ts Tw Tsol,h T DHS,h
Figure 7. The outlet temperatures from the three maincollector circuits, Te, Ts, Tw, and the temperatures at theinlet to the heat exchanger on the solar circuit side, Tsol,h,and the outlet from the heat exchanger, TDHS,h, in thedistrict heating circuit. Data from the 20th of July 2003.
020406080
100120140160180
04:0
005
:00
06:0
007
:00
08:0
009
:00
10:0
011
:00
12:0
013
:00
14:0
015
:00
16:0
017
:00
18:0
019
:00
20:0
021
:00
22:0
0
Tota
l del
iver
ed e
nerg
y (k
Wh)
Figure 8. The total delivered energy to the districtheating system the 20th of July 2003.
The figures 6, 7 and 8 show that the flows are wellcontrolled and result in a constant output temperature.The higher output during the afternoon is explained bythe larger areas towards west than towards east.
4.4 Parametrical studiesIt is interesting to see how much energy could be gained
by decreasing the operating temperatures and how muchis gained by keeping the operation temperature as low as possible.
The results from WINSUN, shown in figure 9, showhow the theoretical energy output for the differentcollectors and the area weighted mean energy output of the whole system would change if the mean operationtemperature in the collectors would change. At presentthe average mean operation temperature is 63°C. Thecollector facing south and tilted 73° give the highestannual output, followed by the 73° tilted collectordirected towards west, which give almost the same resultsas the area weighted system average. The collector facing east and tilted 90° is the collector with the lowest output.
Should the operation temperatures instead be 40°C or50°C, the output would have been 60-130 kWh/m²ahigher. A 10°C increase in temperature decrease themean annual energy output by around 50 kWh/m².
050
100150200250300350400450500
40 45 50 55 60 65 70 75 80Mean operation temperature (°C)
Ene
rgy
outp
ut(k
Wh/
m²a
)
South 73°West 73°MeanSouth 90°West 90°East 90°
Figure 9. The theoretical energy output of the differentcollectors for different mean operation temperatures in the collectors and the mean values of the system.
The simulation results in figure 10 show the monthlydistribution of the energy output from the five collectors.
05
101520253035404550
Jan
Feb
Mar
Apr
May Jun
Jul
Aug
Sep Oct
Nov
Dec
Ene
rgy
outp
ut fr
om th
e di
ffere
nt c
olle
ctor
s(k
Wh/
m²,m
onth
)
West73°
South73°
West90°
South90°
East90°
Figure 10. The simulated energy output for the differentcollectors shown as monthly values over the year.
The west- and south-facing collectors, tilted 73° givethe highest peaks in summer, while the south-facingvertical collector gives a more balanced output over theyear. Both south-facing collectors provide some energyoutput during winter, when the eastern and westerncollectors hardly deliver any energy at all.
In figure 11, the monthly values of mean area weightedenergy output of the system are shown, as well as resultsof the energy output from a system where the collector are placed horizontally or towards south, tilted 40°. Thevalues of annual results are shown in table 3.

Solar thermal energy systems for building integration
268
0
50
100
150
200
250
300
350
400
0 10 20 30 40 50 60 70 80 90Collector tilt (°)
Ener
gy o
utpu
t (kW
h/m
²,a)
East (-98°)South (-8°)West (82°)
Collector orientation(°)
0
10
20
30
40
50
60
70
80
Jan
Feb
Mar
Apr
May Jun
Jul
Aug
Sep
Oct
Nov
DecEn
ergy
outp
ut fr
om th
e di
ffere
ntco
llect
ors
(kW
h/m
²,mon
th)
South 40°
Horisontal
Meanenergyoutput
Figure 11. Simulation results of the mean area weightedenergy output and the theoretical output for horizontal orsouth-facing 40° tilted collectors.
Figure 13. Simulated values of energy output for thecollectors in given directions and in different tilt angles.The rings show the actual orientation of the collectors.
During the winter, the mean energy output of the system is higher compared to if the collectors were to be placedhorizontally but not more than if they were to be directedtowards south tilted 40°.
5. DISCUSSION
The simulation results, without access to irradiationdata, give a relatively rough prediction of the systemperformance.
Table 3. The simulated annual energy output of thedifferently tilted collectors and of a horizontal and south-facing collector tilted 40°.
The agreement between measurement and simulationsbased on Meteonorm data is satisfying. The simulationsand parametrical studies give indications of the possibleimprovements that different orientations or operationtemperatures could give.
Colector direction
and tilt
East
90°
South
90°
South
73°
West
90°
West
73°
The
total
system
South
40 °
Hori-
zontallyAnnual energy
output (kWh/m²a)90 167 263 137 190 174 343 234
The control of the flows through the collectors is veryimportant. The chosen control strategy evens out thetemperature differences between the different collectorsand results in a balanced flow over a daily bases, with thehighest flow rate in the most illuminated collectors. Theoutput temperature is shown to be rather constant over theday.
It can be concluded that the high tilt of the south-facingcollectors gives balance to the energy distribution overthe year whereas the vertical east- and west-facing collectors give less energy during the cold season.
If the collector all had been mounted in the optimaldirection, towards south tilted 45°, the energy outputwould have been increased by a factor of 2. But since the collectors were replacing wall materials they wereinstalled in all directions.
The global irradiation from Meteonorm is shown infigure 12 in order to verify the results in figure 10.
0
20
40
60
80
100
120
140
160
180
Jan
Feb
Mar
Apr
May Jun
Jul
Aug
Sep Oct
Nov
DecHem
ispe
rical
irra
diat
ion
on ti
lted
surfa
ce(k
Wh/
m²m
onth
)
Horizontal
South 73°
West 73°
West 90°
South 90°
East 90°
The system is a well-functioning heat producing plant,which have worked during three years withoutunexpected interruptions.
A solar thermal system that produces heat to theforward side of the district heating system, with a constantly high heat load, can of course be designed verydifferently compared to a system that requires a storagetank, but there are many interesting design featuresapplied in this system that would be interesting toconsider also for other solar thermal systems, as e.g. theuse of robust components.
The design method to both test the system bysimulations and by a building a pilot plant is a very promising strategy, yet seldom possible within the budgetframes. Hopefully, the good ideas and design featuresapplied in this system can also be successfully appliedelsewhere.
Figure 12. Data of global irradiation for differently tiltedsurfaces, derived from Meteonorm.
If the collectors were tilted differently, the energy outputwould change according to figure 13. It the tilt was 45° the would give the maximum annual output of 340kWh/m2a, compared to the 180 kWh/m²a they give today.

Paper VI
269
6. CONCLUSIONS A large façade-integrated, highly automated solar
thermal system is connected to the outgoing side of the district heating system in Malmö, Sweden and has been operated and monitored since June 2002 without interruptions. From 2002-07-01 to 2003-10-30, the collectors delivered 180 kWh/m²a to the district heating system, with a peak power of 0.3 MW, which is as expected from a system with non-optimally oriented collectors. According to simulations performed with WINSUN, the average annual energy output should be 174 kWh/m2a, i.e. a difference of 3% from the measured output.
Collector parameters from standard testing and climatic data based on Meteonorm data for a normal year were used as an input for the simulations. This also means that the procedure for using Meteonorm, when measured irradiation data is missing, seems to work satisfactory. The monthly values from simulations and measurements show larger differences, which are explained by the climatic changes from year to year.
The system consists of five different sub-systems in different directions connected to the district heating net via an advanced control system and heat exchanger. The analysis shows that the control system, which is designed to deliver heat at temperature of at least 67° to the heat exchanger, is working satisfactory. The temperature going into the heat exchanger and the temperature going out to the district heating system are relatively constant during the time heat is delivered.
The system has an overheat protection system based on partial evaporation, where a compressor-connected expansion system is used for automatic refilling after boiling. This system was never tested during first years of operation, since the system never reached stagnation. However, the pilot plant was in stagnation several times and the control strategy was then proven successful.
The parametrical studies show that the collectors tilted in 73° south give the highest energy output. The vertical collectors in east and west give the lowest output. If all collectors were installed in south direction and tilted 40° the annual performance should increase by a factor of 2. This was not an option in this case though, as the collectors were replacing the façade.
The south-facing collectors with a high tilt give higher output during spring and fall and the east and west collectors contribute to a uniform energy distribution over the day.
The idea with the collectors connected to district heating grid close to buildings which are designed to sustain thermal comfort at low temperatures is that it allows the collectors to operate at a relatively low temperature. The over all evaluation show that the advanced system design for start up, stagnation and control has resulted in a well working solar collector system with high accessibility.
ACKNOWLEDGEMENTS
Martin Råberg at Carl Bro Group is acknowledged for support and serving of detailed information of the system design and construction.
Li Lövehed and Per Rosén at Sydkraft Värme Syd are acknowledged for providing measured data from the solar thermal system and general information about the district heating system.
Elsa Anderson and Simon Furbo at the Department of Civil Engineering at the Technical University of Denmark are acknowledged for contribution of climate data.
REFERENCES
Adsten, M., (2002) Solar Thermal Collectors at High Latitudes. Design and Performance of Non-Tracking Concentrators, Acta Universitatis Upsaliensis, Uppsala, Sweden.
Duffie J.A. and Beckman W.A. (1991) Solar Engineering of Thermal Processes, 2nd edn. Wiley Interscience, New York.
Weiss W. (2003) Solar Heating Systems for Houses. A Design Handbook for Solar Combisystems. James and James, London.

Solar thermal energy systems for building integration
270

Paper VII
271
Paper VII

Solar thermal energy systems for building integration
272

Paper VII
273
Solar Energy Materials & Solar Cells 91 (2007) 1788–1799
Optimisation of reflector and module geometries for stationary,low-concentrating, fac-ade-integrated photovoltaic systems
Helena Gajberta,�, Maria Hallb,1, Bjorn Karlssona,2
aEnergy and Building Design, Lund University, P.O. Box 118, SE-221 00 Lund, SwedenbSwedish Energy Agency, P.O. Box 310, SE-631 04 Eskilstuna, Sweden
Received 19 November 2006; accepted 14 June 2007
Available online 9 August 2007
Abstract
The high cost of photovoltaic modules motivates the use of reflectors to increase the electricity production. The system geometry of
static low-concentrating PV systems for building-integration with parabolic aluminium reflectors was optimised for maximum annual
electricity production. The optical efficiency of systems with different geometries was calculated from short-circuit current measurements
on thin film modules and the annual electricity production was simulated. An inclination of the reflectors’ optical axis of 351, resulting in
a concentration ratio of 4.65, showed the highest electricity yield per cell area, 120 kWh/m2 cell area, 72% higher than for a vertical
module without reflector.
r 2007 Elsevier B.V. All rights reserved.
Keywords: Photovoltaic; Parabolic; Reflector; Building integration; Solar simulator
1. Introduction
1.1. Background
Building integration is a rapidly increasing market forphotovoltaic systems [1]. By integration of the photovoltaicsystems in the building envelope already during construc-tion, building material is saved and redundant work isavoided, which results in cost reductions for the combina-tion of new building and electricity system. Still, grid-connected solar electricity is not cost-competitive on theelectricity market due to the high cost of photovoltaicmodules. This high cost motivates the use of relativelycheap, highly reflecting mirrors for increasing the irra-diance on the modules and thus the electricity production.
A previously designed static, concentrating photovoltaicsystem for integration in a south-facing fac-ade is shown in
Fig. 1 [2]. The collector has a PV/thermal hybrid absorberand the system includes parabolic aluminium reflectors andphotovoltaic string modules, as well as expanded poly-styrene (EPS) insulation. Due to the insulation material,which is attached directly to the back of the reflector sheetmetal, the fac-ade element can serve as an integrated part ofthe building envelope.Similar asymmetric concentrating collector systems for
fac-ade integration have been evaluated by measurements[3–5] and found to increase the performance by 62% for ageometrical concentration ratio of 2.0.The geometry of the CPC:s presented in this work is
highly asymmetric and includes only one, upper reflector.This simple design facilitates the production of thecollector, which leads to cost reductions.The transversal incidence angles are here defined as
angles in the north–south–vertical plane and the long-itudinal incidence angles are defined as those in theeast–west plane. This is illustrated in Fig. 2.The thin film photovoltaic CIGS (copper–indium–
gallium–diselenide) module used in this work is suitableto use in combination with reflectors if the long narrowcells are aligned normal to the reflectors. Unlike the
ARTICLE IN PRESS
www.elsevier.com/locate/solmat
0927-0248/$ - see front matter r 2007 Elsevier B.V. All rights reserved.
doi:10.1016/j.solmat.2007.06.007
�Corresponding author. Tel.: +4646 222 7583; fax: +46 46 222 4719.
E-mail addresses: [email protected] (H. Gajbert),
[email protected] (M. Hall),
[email protected] (B. Karlsson).1Tel.: +46 16 544 2174, fax: +46 16 544 2099.2Tel.: +46 46 222 7261, fax: +46 46 222 4719.

Solar thermal energy systems for building integration
274
crystalline silicon cells used by Refs. [3–5], which have to beconnected in a single string if equal irradiance on all cellsshould be obtained, the CIGS cells offer higher flexibility inproduction to suitable sizes and are less sensitive to shadingfrom the horizon. Therefore, this design has a highpotential to be applicable also for large-scale installations,which in turn gives it potential to be developed into a cost-efficient component.
1.2. Objectives of this work
The objective of this work was to optimise the geometryof a wall-integrated concentrating solar collector [6] foroperation in regions of latitudes around 601 so thatmaximum annual electricity production is achieved. Thetilt angle of the photovoltaic module and the inclination ofthe parabolic reflector’s optical axis has been evaluated andoptimised by measurements and simulations. Both theinfluence of the lower acceptance angle and the tilt of themodule plane have been investigated.
2. System design
2.1. Angular distribution of annual irradiation
A static concentrating collector requires a low-concen-tration ratio in order to benefit from solar irradiation alsoat low solar angles. A suitable collector geometry isestimated from data of irradiation in Stockholm, Sweden.Here, the greatest amount of irradiation on a south-facingvertical surface is received from south projected incidenceangles, aNS ¼ 50–551, as shown in Fig. 3, which representsdata collected in Stockholm during the period 1983–1991[7]. This figure indicates that a static, fac-ade-integratedconcentrator for all year operation should accept radiationbetween 101 and 601. The irradiation is considerablyreduced during the winter due to cloudy climate andabsorption of the radiation in the atmosphere [8]. Thisexplains the low irradiation at aNS between 01 and 51.Shadow effects from the surrounding can further decreasethe irradiation for low altitudes.An ideal asymmetric vertical concentrator with reflectors
that accepts solar irradiation from incidence anglesymin ¼ 101 to ymax ¼ 601 gives a concentration ratio, C,of maximum 2.89, as calculated by Eq. (1) [9]. If theacceptance interval is 25–601, Cmax is 4.51. These geome-tries require a vedge formed absorber and two reflectors.With a single reflector that accepts irradiation in theinterval 25–901, Cmax is 3.46:
C ¼ 2
sin ymax � sin ymin. (1)
ARTICLE IN PRESS
Fig. 1. Cross-section of a static, two-dimensional concentrating photo-
voltaic system intended for fac-ade integration. The system has a
concentration ratio of 3 and includes photovoltaic string modules and
parabolic aluminium reflectors, as well as EPS insulation.
�L�T
Longitudinal direction Transverse direction
Fig. 2. Definition of the longitudinal angle yL and the transverse projected angle yT.
H. Gajbert et al. / Solar Energy Materials & Solar Cells 91 (2007) 1788–1799 1789

Paper VII
275
2.2. System geometry
The reflectors used for the system designs are 2Dparabolic mirrors extended in the east–west direction, adesign feature often used in solar energy applications [10].This system is primarily intended to be unglazed andpassively cooled. However a glazed surface could be placedvertically in front of the whole fac-ade element in order toprotect and prolong the lifetime of the reflector material.Glazing is here described in order to better illustrate thegeometry.
The system geometry, illustrated in Fig. 4, is based on a2D parabolic graph. The inclination of the optical axis tothe horizontal is denoted v and h is the height of theglazing. As all irradiation incoming parallel to the opticalaxis or from higher solar altitude angles will fall betweenthe focal point, F, and the reflector, it is suitable to place anabsorber here. The angle b denotes the tilt angle of theabsorber plane and a denotes the width of the moduleplane. The angle f is the angle between the vertical glazingand the optical axis of the reflector. The transversalincidence angle, yT, on the vertical glazing is equal to thesolar altitude angle projected in the north–south verticalplane, aNS.
The mathematical description for the parabola is shownin Eq. (2). The focal length, p, is the distance between theorigin of the parabola and the focal point along the opticalaxis. r is a vector from the focal point to a point on thecurve, at angle f:
rðfÞ ¼ p
cos 2ðf=2Þ . (2)
The geometrical concentration ratio, C, of the concentrat-ing system is defined as the ratio between h and a, whichboth can be expressed by r. For r ¼ h, f is v+90 and for
r ¼ a, f is v+b. C can be calculated from
C ¼ h
a¼ cos 2ððvþ bÞ=2Þ
cos 2ððvþ 90Þ=2Þ . (3)
Two different geometries, illustrated in Fig. 5, wereanalysed in detail in order to investigate the differencebetween system designs of different concentration ratios. Inboth geometries, the angle v, between the optical axisand the horizontal, is 251 and the distance p is 158mm.
ARTICLE IN PRESS
0
10
20
30
40
50
60
70
80
90
0-5
5-10
10-1
5
15-2
0
20-2
5
25-3
0
30-3
5
35-4
0
40-4
5
45-5
0
50-5
5
55-6
0
60-6
5
65-7
0
70-7
5
75-8
0
80-8
5
85-9
0
South projected solar altitude angle, αNS (°)
Ann
ual i
rrad
iatio
n on
a v
ertic
al s
outh
faci
ng s
urfa
ce (
kWh/
m2 ,y
ear)
Direct irradiation
Diffuse irradiation
Fig. 3. Angular distribution of annual direct and diffuse irradiation (mean values for 1983–1991) on a south-facing vertical surface in Stockholm, Sweden.
Optical axis
Horizontal
p
h
Module
a
Reflector
�NS
F
� �
Fig. 4. Illustration of the collector with the parabolic reflector. All
symbols are described in the text.
H. Gajbert et al. / Solar Energy Materials & Solar Cells 91 (2007) 1788–17991790

Solar thermal energy systems for building integration
276
In Geometry A, the module tilt angle, b, is 201, whichresults in a geometrical concentration ratio C of 2.96. ForGeometry B, b is �151 and C is 3.44. The positive moduletilt gives the system a better performance at low solaraltitudes as direct irradiation can fall on the absorber. Thenegative module tilt of Geometry B was chosen because itgives the system a higher geometrical concentration ratio.The different absorber tilt angles also means that theabsorber width a is slightly higher for Geometry A than forGeometry B.
2.3. Reflector material
The mirrors are based on anodised sheet aluminium,which offers good mechanical properties. The total and thespecular reflectance were calculated to 83% and 82%,respectively, from measurements at near normal incidenceat wavelengths of l ¼ 200–2550 nm, for which a Perkim-Elmer l-900 spectrophotometer equipped with an integrat-ing sphere was used. The results are shown in Fig. 6. Thereflectance increases very slowly with increasing angle ofincidence [11]. The weighted total solar reflectance forwavelengths shorter than 1100 nm is 81%.
3. Experimental methods
3.1. Electrical measurements
In this work, measurements of the short-circuit currentof photovoltaic CIGS string modules placed on theabsorber plane of a system prototype were performed.Measurements were performed using a system prototypewith a fixed angle v of 251 and with a module plane that canbe tilted at different angles b (see Fig. 7). Measurements
were performed for Geometry A (v ¼ 251, b ¼ 201),Geometry B (v ¼ 251, P ¼ �151) and for a verticallyplaced reference module without reflector.The measurements were performed indoors, using a large
indoor solar simulator with parallel light [12]. The solarsimulator is built up of parabolic collimators that renderthe light almost parallel, which means that only beamirradiance is used during the measurements. The light bulbsused in the simulator contain a metal halide gas, whichgives the light spectral characteristics similar to sunlight.The simulator can be lifted to simulate different solaraltitudes, between 01 and 73.51, and measurements were
ARTICLE IN PRESS
Fig. 5. Geometries A and B. The angle b is 201 in Geometry A and �151 in Geometry B.
Fig. 6. Total specular, and diffuse reflectance of anodised aluminium at
near normal angle of incidence.
H. Gajbert et al. / Solar Energy Materials & Solar Cells 91 (2007) 1788–1799 1791

Paper VII
277
performed for every 10th solar altitude angle from 01 to701, which for the vertical collector facing the simulator isequal to the transversal incidence angles, yT. No glazingwas used during the measurements.
As the absorber tilt, b, was altered from �151 to +201,the module width, a, was varied accordingly. The accurateactive module sizes were obtained by shielding the CIGScells (including the vertical reference cells) with aluminiumfoil, as illustrated in Fig. 8. The aperture opening h isconstant.
The CIGS module was suitable for this purpose, as themodule is built up by narrow rectangular cells extendedperpendicular to the length of the east–west orientedconcentrator. This means that all series-connected cells getequal irradiance.
3.2. Calculation of optical efficiency
The measured optical efficiency for beam irradiation,Z0b, was determined for each measurement. It wascalculated from the results of short-circuit current mea-surements from the cells in the concentrating systemISC(conc.), and from the measurements of the verticalreference, ISC(ref.) using
Z0b ¼ ISCðconc:ÞCISCðref :Þ
. (4)
The calculated optical efficiency for beam irradiation,here referred to as RT(yT) of this system, was calculated by
RTðyTÞ ¼ 1
C
cosð90� � b� yTÞcosðyTÞ
; yTov, (5)
RTðyTÞ ¼kðh cosðyTÞ � a cosð90� � b� yTÞÞ þ a cosð90� � b� yTÞ
h cosðyTÞ¼ k þ ð1� kÞ 1
C
cosð90� � b� yTÞcosðyTÞ
; yT4v. ð6Þ
Eq. (5) is based on the cosine dependence of the intensityon the modules for yT angles lower than v, when a fractionof the irradiation reaches the module at an angle ofincidence of 901�b�yT and the rest is reflected back outfrom the collector. The direct irradiation on the module isdivided by the direct irradiation on the glazing and theconcentration ratio. For yT angles higher than v, a fractionof the beam radiation reaches the module directly and theremaining fraction is reflected onto the module. Thesefractions are included in Eq. (6), where it is assumed thatthe rays that reach the reflector are reflected only oncebefore they hit the module. An effective reflectance,k ¼ 0.69, was introduced in the equation to get a good fitto measurement data in Fig. 16. In an ideal system withoutresistive losses in the photovoltaic cell, there is no angulardependence of the absorption of the cells, and with aperfect geometry, the value of this constant would be closeto the value of the reflectance of the reflector as the averagenumber of reflections is close to unity. The graphs in Fig. 9show the calculated optical efficiency for Geometries A andB for varying incidence angles and the effect of the reflectoris shown by the difference in optical efficiency at lowincidence angles, when the rays are not reflected, and forincidence angles higher than the optical axis, 251, where thereflector is useful. For incidence angles higher than 701, theirradiation falls directly on the absorber without reflectionsand the optical efficiency reaches unity.
ARTICLE IN PRESS
Fig. 7. The system prototype with parabolic reflector and an adjustable
module plane.
Fig. 8. A thin film CIGS module with the cells extended perpendicular to
the reflector, shielded with aluminium foil.
H. Gajbert et al. / Solar Energy Materials & Solar Cells 91 (2007) 1788–17991792

Solar thermal energy systems for building integration
278
The relatively low value of the effective reflectance, k, isexplained by multiple reflections and optical imperfections.The cell with the lowest irradiance limits the performance.
3.3. Long-term outdoor measurements
An unglazed system of Geometry A and a verticalreference system was long-term monitored in Alvkarleby,Sweden (60.61N, 17.41E) during July–October 2003 bymonitoring the short-circuit current from the reference andthe concentrator module and also the global and diffuseirradiance. The stored data was averaged during 10minperiods. The set-up is shown in Fig. 10.
3.4. The MINSUN simulation program and the biaxial
incidence angle dependence model
The MINSUN program was originally developed forsimulations of energy yield from thermal collectors. It isspecially developed for simulating solar collectors with acomplicated angular dependence [13]. The program can bemodified for simulations of electricity yield from photo-voltaic modules of known nominal power, since itcalculates the annual irradiation on a specified surface.Basically, it means that it simulates the energy yield of asolar collector with a defined optical angular dependenceand no thermal losses.
MINSUN uses hourly climate data of direct and diffuseirradiation to calculate the total annual irradiation on aspecified surface. The total absorbed irradiance, S, is
obtained by multiplying the incoming radiation byincidence angle modifiers for beam, Kb, diffuse, Kd, andground reflected irradiance, Kg. The direct (beam) irra-diance, Ib, is also multiplied by C as shown in Eq. (7). Id isthe diffuse irradiance and Ig is the ground irradiance [14]:
S ¼ CKbðyÞIb þ KdId þ KgIg. (7)
Asymmetric collectors have to be modelled by a biaxialmodel that accounts for the different optical efficiency indifferent planes of incidence. A commonly used model isshown in Eq. (8), where yL is the longitudinal angle and yLis the transverse projected angle of incidence, as defined inFig. 2:
KðyL; yTÞ ¼ KLðyL; 0ÞKTð0; yTÞ. (8)
This model was presented by Ronnelid. [15] andestimates the optical efficiency K by measurements of theoptical efficiency in the perpendicular longitudinal andtransverse directions. This model is difficult to use for thegeometries evaluated in this work, since the angles foryT ¼ 01 is outside the acceptance interval. Furthermore, itdoes not model the angular dependence of the glazing in acorrect way.An alternative model has recently been proposed [16]
that separates the influence of the glazing and of theconcentrator. The optical efficiency of this type ofsymmetric two-dimensional concentrators, like troughs,depends on the components of the rays in the transversalplane. The angle of incidence in this plane is yT and thereflector trough will be modelled as a function of this angle.The transmittance of the glazing depends on the true angleof incidence on this surface, here denoted yi. Eq. (9) definesthe proposed model. Here, RT models the effect of theconcentrator and fL models the effect of the glazing.
KbðyL; yTÞ ¼ RTðyTÞf LðyiÞ. (9)
ARTICLE IN PRESS
0.00
0.10
0.20
0.30
0.40
0.50
0.60
0.70
0.80
0.90
1.00
0 10 20 30 40 50 60 70 80 90
Transversal incidence anlge, �T (°)
Opt
ical
eff
icie
ny, �
0b (
-)
Geometry A
Geometry B
Fig. 9. The calculated optical efficiency RT(yT) for the two geometries.
The current is significantly higher for incidence angles higher than the
angle of the optical axis (251) as it implies that the irradiance is
concentrated.
Fig. 10. Photograph of a ST5 photovoltaic module from Siemens in a
concentrating reflector system of Geometry A, where the tilt of the optical
axis, v, is 251 and the absorber tilt, b, is 201. An identical reference module
was mounted in the vertical plane of the aperture.
H. Gajbert et al. / Solar Energy Materials & Solar Cells 91 (2007) 1788–1799 1793

Paper VII
279
MINSUN calculates the total incidence angle modifier asa product of the functions of RT(yT) and f(yi). The functionsare given in MINSUN numerically in intervals of 51.
In the simulations, the ground reflected radiation, Kg, wasassumed to be 0. The incidence angle modifier for diffuseirradiance, Kd, is given as a constant value or obtained byintegrating RT(yT)fL(yi) over an isotropic sky. This meansthat Eq. (10) gives the useful irradiance S on the cell:
SðyT; yLÞ ¼ CRTðyTÞf LðyiÞIb þ KdId. (10)
The function RT is obtained from measurements of theoptical efficiency in the transversal plane with yL ¼ 0. ThefL function is obtained from measurements of the opticalefficiency in a plane where yL is constant. This means thatfL conveniently can be modelled as a conventional b0function according to Eq. (11) [14]:
f Lðy ¼Þ1� b01
cosðyÞ � 1
� �. (11)
Principally, RT(yT) represents the angular dependence ofthe reflector and fL(yi) represents the angular dependenceof the glazing. A typical reference year of the Stockholmclimate from 1983 to 1992 by the Swedish Meteorologicaland Hydrological Institute Stockholm (SMHI) is includedin the model for the simulations.
3.5. MINSUN simulations of the annual energy yield for
systems with various geometries
The MINSUN simulation program was used to calculatethe expected annual energy output from the solar cells with
reflectors by multiplying the useful irradiance from Eq. (10)by the efficiency of the solar cell (13%). Simulations wereinitially performed for Geometries A and B (shown in Fig.5), with the tilt of the absorber plane, b, 201 and �151,respectively. The values of optical efficiency that wereestablished from the measurement results were used asinput data for RT(yT) for every fifth incidence angle from 01to 901.In order to theoretically investigate a number of
variations of the system geometry, MINSUN simulationswere also performed for geometries based on bothGeometries A and B. The input data of optical efficiency,RT(yT), of the two systems were shifted in the MINSUNinput file in a way that imply that the collectors (both thereflector and the absorber) theoretically were rotatedaround the focal point, F. In a simulation when thereflector is tilted forward 101 (v is rotated from 251 to 151),the values of RT (yT) are shifted 101 towards lower angles.When the reflector is tilted backwards 101 v is rotated from251 to 351 the values of RT(yT) are shifted 101 towardshigher incidence angles and extrapolated. This means thatthe optical axis tilt angle, v, varies between �51 and +551in steps of 51. This also changes the solar acceptanceintervals and implies a change of the concentration ratio asthe height, h, of the vertical glazing has to be altered tomatch the new geometries. The absorber tilt angle from thehorizontal, b, will then also be altered while the anglebetween the optical axis and the module plane is constant.If the system is rotated backwards, as v is increased, theconcentration ratio will increase, because the height, h,relative to the module width, a, is increased. The aperture
ARTICLE IN PRESS
C<C0 C>C0C0
�=15° �=25° �=35°
Fig. 11. Different tilt angles, v, of the optical axes of the systems simulated in MINSUN. The system in the middle is Geometry A, where v is 251 and the
module tilt, b is 201. The left- and right-hand geometries were simulated in MINSUN after rotation.
H. Gajbert et al. / Solar Energy Materials & Solar Cells 91 (2007) 1788–17991794

Solar thermal energy systems for building integration
280
opening of the concentrator will always be in the verticalplane. During forward rotation, the reflector is truncatedand during backwards rotation the reflector is extended.An illustration of the system geometry is shown in Fig. 11.
4. Results
4.1. Results of short-circuit current measurements
The short-circuit current was recorded as a function ofthe transversal incidence angle and the measurement resultswith varied b tilt angles are presented in Fig. 12. Themeasurements show that below the cut-off incidence angleof the concentrator (251), the current is relatively low, asonly some direct irradiance reaches the module with a highincidence angle. Above the cut-off angle the current isrelatively independent of the b angle, since all irradiatedlight reach the module directly or after reflection. However,the average number of reflections is increasing withdecreasing b angles, which means that the current slightlydecreases.
The corresponding current densities of the reference andconcentrator modules are presented in Fig. 13. The figureshows that the output per module area increases withdecreasing module tilt, the b angle, since the module areadecreases and the concentration factor increases withdecreasing tilt angle. The maximum average currentdensity increases from 30 to 70mA/cm2 by concentration.
If it is assumed that both the flat reference module andthe concentrator are modelled by Eq. (10) with the functionCRT(yT) ¼ 1 for the reference module (without concentrat-ing reflector) and a negligible diffuse fraction, then ISC(conc.)of the concentrator module is related to ISC(ref.) of the
reference cell according to Eq. (12):
ISCðconc:ÞðyTÞ ¼ ISCðref :ÞRTðyTÞC. (12)
This further implies that the angular dependence of yL atconstant yT for the concentrator and reference module areidentical. It is important to point out that the reference issituated in the plane of the entrance aperture of theconcentrator.The measured and the ideal ISC of the concentrators of
Geometries A and B are compared in Figs. 14 and 15. Theideal values of ISC should be obtained from a concentratorwith a reflector of reflectance 1. The values of the ideal ISC inthe figures were derived from the monitored ISC(ref.)according to Eq. (12), with RT(yT) derived from Eqs. (5)and (6) and with the effective reflectance parameter k equalto 1. The current of the reference cell is lower in Fig. 15 thanin Fig. 14, since the absorber area is larger in Geometry A.
4.2. The optical efficiency
The measured values of optical efficiency, of the systemsof Geometries A and B was thereafter determined frommeasured data by Eq. (4). This equation is identical to theratio between the monitored ISC(conc.) and the ISC(ideal) foryT4v. The theoretical optical efficiency was also calculatedfrom Eqs. (5) and (6) with k ¼ 0.69. The measured and thetheoretical optical efficiency agree well up to 401. For higheryT, the measurements are unreliable due to the limitations ofthe solar simulator at large angles of incidence.In order to set up an accurate model of optical efficiency
to use in simulations, data of optical efficiency is takenfrom measurements, for yTo401, and from calculations,for yTo401. This resulting model is shown in Fig. 16.
ARTICLE IN PRESS
0
100
200
300
400
500
600
700
800
900
0 2010 30 40 50 60 70 80
Transversal incidence angle, �T (°)
I SC (
mA
)
Geometry A,beta=20°
Geometry B,beta=-15°
Fig. 12. The results of short-circuit current from the CIGS cell in the
concentrating system for Geometries A and B, shown for different solar
altitudes, i.e. transversal incidence angles.
0
10
20
30
40
50
60
70
80
0 10 20 30 40 50 60 70 80
Transversal incidence angle, �T (°)
I SC /A
cell (
mA
/cm
2 )
Geometry A
Geometry B
Vertical ref.
Fig. 13. The results of short-circuit current per cell area from the CIGS
cell in the concentrating system, for Geometries A and B, shown for
different solar altitudes, i.e. transversal incidence angles. The current of
the vertical reference cell is also shown.
H. Gajbert et al. / Solar Energy Materials & Solar Cells 91 (2007) 1788–1799 1795

Paper VII
281
For angles yT below v, the concentrator is not used andno light is reflected, yet some irradiation reaches themodule directly. The fraction of radiation that is reflected
before it reaches the module is increased with increasing yT.For yT over 701, all irradiation reaches the module directlywithout reflections, which means that the optical efficiencyis equal to 1.
4.3. Analysis of long-term outdoor measurements
The results of the long-term outdoor measurements, thusincluding diffuse and direct irradiation, are illustrated inFig. 17 and 18. Fig. 17 shows that the ISC(conc.) is a factor oftwo higher than ISC(ref.). This means that the geometricalconcentration factor of 2.96 in combination with theoptical losses results in a real concentration factor ofapproximately 2.
ARTICLE IN PRESS
0
100
200
300
400
500
600
700
800
900
1000
1100
1200
0 10 20 30 40 50 60 70 80 90
Transversal incidence anlge, �T (°)
I (m
A)
A ideal
A conc
A vertical
Fig. 14. Short-circuit current, ISC, as function of the transversal incidence
angle for the reference module, a concentrator module with Geometry
A(b ¼ +25) and the calculated ISC for a module in an ideal concentrator,
k ¼ 1.
0
100
200
300
400
500
600
700
800
900
1000
1100
1200
0 10 20 30 40 50 60 70 80 90
Transversal incidence anlge, �T (°)
I (m
A)
B ideal
B conc
B vertical
Fig. 15. Short-circuit current, ISC, as function of the transversal incidence
angle for the reference module, a concentrator module with Geometry
B(b ¼ �151) and the calculated ISC for a module in an ideal concentrator,
k ¼ 1.
0.00 10 20 30 40 50 60 70 80 90
0.1
0.2
0.3
0.4
0.5
0.6
0.7
0.8
0.9
1.0
Transversal incidence angle, �T (°)O
ptic
al e
ffic
ieny
, �0b
(-)
Geometry A
Geometry B
Measuredvalues Calculated
values
Fig. 16. The model of optical efficiency Z0b composed by the measured
values for yTo401 and calculated values for yT4401.
0.0
0.5
1.0
1.5
2.0
2.5
3.0
0.0 0.3 0.6 0.9 1.2 1.5
Isc ref. (A)
I sc
conc
. (A
)
Fig. 17. Comparison of the ISC of the reference and the concentrator
module from 10 a.m. to 2 p.m. daily from July 10 to September 12 in 2003.
H. Gajbert et al. / Solar Energy Materials & Solar Cells 91 (2007) 1788–17991796

Solar thermal energy systems for building integration
282
The performance is further analysed by plotting themeasured optical efficiency Z0 as a function of thetransversal incidence angles yT. The results presented inFig. 18 show a large scattering but also a relatively goodoverall agreement with model shown in Fig. 16. The datafrom times when the irradiance was very low are discardedby selecting only data points when ISC(ref.) was higherthan 0.3A.For yT of 401, the outdoor measurements show that the
optical efficiency Z0 is 0.60–0.72, while the estimated valueof Z0b is 0.78. This difference is explained by the influenceof the diffuse irradiation scattering and by aged andunclean reflectors.
4.4. MINSUN results of annual electricity production
The results of the simulated annual electricity productionof CIGS modules (with 13% conversion efficiency) in theconcentrating systems of Geometries A and B are shown inFig. 19. The varying tilt angles of the optical axis, n, areshown on the x-axis and both the yield per cell area and theyield per glazed area are shown in the figure. Thehorizontal lines across the figure show the calculated yieldper cell area from the vertical flat reference module and
ARTICLE IN PRESS
0.0
0.1
0.2
0.3
0.4
0.5
0.6
0.7
0.8
0.9
1.0
30 35 40 45 50 55 60 65 70 75
Transversal incidence angle, �T
Opt
ical
eff
icie
ncy,
�0
(−)
Fig. 18. The optical efficiency Z0 as a function of the transversal incidence
angles yT from long-term outdoor measurements, from 12 a.m. to 5 p.m.
daily from July 10 to September 12 in 2003.
0
10
20
30
40
50
60
70
80
90
100
110
120
130
55 50 45 40 35 30 25 20 15 10 50 0 -5
Tilt of the optical axis, � (°)
Ann
ual e
lect
rici
ty y
ield
per
abs
orbe
r ar
ea
(kW
h/m
2 a)
0
10
20
30
40
50
60
70
Ann
ual e
lect
rici
ty y
ield
per
gla
zed
vert
ical
are
a
(kW
h/m
2 a)
A - electricity per absorber area
B - electricity per absorber area
A - electricity per glazed area
B - electricity per glazed area
Reference cell
Shaded
reference
cell
Fig. 19. Simulated annual electricity production per glazed vertical area and per module area as a function of the tilt angle, v, of the reflector’s optical axis.
The annual output of the vertical reference module is also shown for comparison, with and without shading up to yT ¼ 121.
H. Gajbert et al. / Solar Energy Materials & Solar Cells 91 (2007) 1788–1799 1797

Paper VII
283
also for a reference module that is shaded up to 121, as thisis a probable situation for vertically placed collectors. Theconcentrator module is insensitive to shadowing up to theincidence angle equal to the optical axis.
Fig. 19 shows how the annual electricity yield perabsorber area increases with higher n angles (30–501), as theconcentration ratio C increases, until the tilt of the opticalaxis is too high to accept irradiation from solar altitudes of451 and higher. The greatest part of the annual irradiationin Sweden occurs at projected solar altitude angles, aNS, of50–551 (see Fig. 3). Fig. 19 also shows how the energy yieldper glazed area decreases with increasing v angles.
It can also be seen that the similar graphs of GeometriesA and B are slightly displaced from one another and thatGeometry B gives a higher yield per absorber area thanGeometry A at v angles up to 451, due to the higherconcentration ratio. Geometry A, on the other hand, giveshigher yield per glazed area, as the reflection losses arelower for this geometry.
The highest annual energy yield per cell area is120 kWh/m2 a, achieved by Geometry B at a v angle of351. (Geometry A gives almost as high yield at this point.)The resulting geometrical concentration ratio, C, is 4.65.The simulations show that the reference cell wouldgive 70 kWh/m2 a and if shaded for yT from 01 to 131,60 kWh/m2 a. The calculated electricity production for thisconcentrating system is thus 72% higher than that of theunshaded vertical reference module, and 100% higher thana shaded module.
The measured systems, where v ¼ 251, show slightlylower values of the estimated annual yield, 112 and118 kWh/m2 a for Geometries A and B, respectively.
It is important to also consider that a higher inclinationof the optical axis means that the acceptance of irradiationfrom low solar altitude angles is more limited. This resultsin a higher summertime production on the expense of alower wintertime production. This effect can be observed inFig. 20, which shows the annual distribution of theelectricity yield per module area for varying v angles(01, 251 and 451) and for the vertical reference cell.Although a lowered absorber tilt angle, b, results in
higher yield per cell area, it also impedes the wintertimeproduction, as it excludes the irradiation from low solaraltitudes. Therefore, depending on the pattern of theenergy demand, a tilt of the optical axis of 25–351 and apositive absorber tilt angle b would be suitable. It can alsobe concluded that the original design is very good for theapplication. The system with a v angle of 251 gives abouttwice as high yield as the reference cell, which is inagreement with the outdoors measurements.
5. Discussion
The focus of this investigation is to reduce the cost of thecollector by replacing expensive solar cell material byreflector material. The most interesting of the shown resultsis therefore the annual energy output per module area andits relation to the output of the vertical reference cell, whichshows the potential savings.The results have shown that the annual energy yield per
module area will increase with a higher tilted optical axisup to where the tilt of the optical axis, n, is 351 and 451,respectively, for Geometries A and B. The backwards-tiltedparabolic reflector implies a larger vertical area comparedto the module area and thus a higher geometricalconcentration ratio. This means that the cost-efficiency ofthe whole concentrating system also may be improved byincreasing the tilt of the optical axis.However, a highly tilted optical axis gives a high-energy
generation in summer at the expense of a lower generationin winter. Which design is the more suitable, must thereforebe estimated from considerations of the patterns of energydemand. Of course, if the system is grid connected, theimmense energy demand makes this aspect unimportant.A third important aspect is the cost of the fac-ade. The
building element consists of glazing, insulation and wires,and the cost of these materials, as well as the modules,should preferably be covered by the energy savings perglazed area of the building element, or at least be kept at areasonable level. However, considering that it is notuncommon that fac-ades are allowed high expenses, thisdesign may be a very price worthy solution. Also, thecollector could very well give an aesthetically appealingfac-ade.The optical measurements show that anodised alumi-
nium offers a good solar reflectance. However, there areseveral booster reflector materials available on the market,which exhibit considerably higher solar cell reflectance thananodised aluminium. For example, Miro sheets from
ARTICLE IN PRESS
0
5
10
15
20
25
30
35
Jan
Feb
Mar
Apr
May Jun
Jul
Aug Sep
Oct
Nov
Dec
Ele
ctri
city
yie
ld p
er m
odul
e ar
ea (
kWh/
m2 m
onth
)
ν=45°
ν=25°
ν=0°
vertical ref
Fig. 20. Annual distribution of the electricity yield per module area from
the CIGS cells in the concentrator and for the vertical reference cell. The
higher the tilt angle of the optical axis, v, the higher is the summer
production and the lower is the winter production and vice versa.
H. Gajbert et al. / Solar Energy Materials & Solar Cells 91 (2007) 1788–17991798

Solar thermal energy systems for building integration
284
Alanod have a solar reflectance of 90% at normal incidence[11]. Using these materials should therefore increase systemperformance by almost 10%, but at a higher cost. Furtherresearch of the cost-efficiency per glazed area of the wholebuilding envelope is therefore required before a finalstatement can be made about which geometry andmaterials to choose in order to minimise electricityproduction costs.
In a line-focusing concentrating system, such as theparabolic reflector system optimised in this work, theconcentration of solar radiation may result in high celltemperatures. Due to the negative temperature coefficientof all photovoltaic cells, high cell temperatures willdecrease the efficiency of the system. One way ofeliminating, or at least significantly reduce, this problemis to cool the photovoltaic modules. There are severaldifferent cooling methods available, but work by Refs.[8,17] indicates that active water cooling is the most cost-effective method for low-concentrating line-focussingsystems. In addition to increasing the electric power byreducing the cell temperature, if operated at mediumtemperatures (about 30–55 1C depending on cell type),active water cooling makes it possible to utilise the warmwater produced for heating or pre-heating of domestic hotwater or space heating. If a hybrid absorber is considered,the demand of thermal energy and the pattern of theheating demand should preferably also be considered in thegeometrical design of the collector.
6. Conclusions
The maximum annual electricity production in theevaluated concentrating systems, if installed in Stockholm,Sweden, was calculated to 120 kWh/m2 per solar cell area,using the MINSUN simulation program and measurementdata. This result was obtained for a system withconcentration ratio, C ¼ 4.65 a module tilt angle, b, of�151, and a tilt of the optical axis, v, of 351. The calculatedannual electricity production is 72% higher than that ofthe vertical reference module, which would produce70 kWh/m2 cell area. Compared to a reference modulethat is shaded for yT from 01 to 131, the yield is 100%higher.
For the system of Geometry A, where v is 251 and b is201, the electricity yield is 112 kWh/m2 per solar cell area,according to simulation results.
For this geometry, an effective concentration ofapproximately 2.0 has been observed from outdoormeasurements. Considering the geometrical concentration,which is 2.96, this results in an optical efficiency ofapproximately 0.7, which is similar to the results achievedby Refs. [3–5].
The conclusion is that the use of photovoltaic modulesand parabolic aluminium reflectors in static, low-concen-
trating systems designed for building integration has apotential to significantly increase the annual electricityproduction per cell area, compared to a planar verticalmodule with the same cell type. Given the low cost of thehighly reflective anodised aluminium mirrors and theinsulation material in combination with a simple manu-facturing process, the kind of systems evaluated in thiswork have a potential to reduce the cost of photovoltaicelectricity.
Acknowledgements
This work was supported by Elforsk AB Sweden in co-operation with the Energy Systems Program, which isfinanced by the Swedish Foundation for Strategic Re-search, the Swedish National Energy Agency and Swedishindustry. H. Hakansson at Lund University and J. Jonssonat Uppsala University are acknowledged for assistanceduring the measurements.
References
[1] O. Lundberg, L. Stolt, Trends in photovoltaic applications in selected
IEA countries between 1992 and 2001, Report IEA-PVPS T1-
11:2002, 2002.
[2] M. Brogren, J. Wennerberg, R. Kapper, B. Karlsson, Sol. Energy
Mater. Sol. Cells 75 (2003).
[3] T.K. Mallick, P.C. Eames, T.J. Hyde, B. Norton, Sol. Energy 77
(2004) 319.
[4] T.K. Mallick, P.C. Eames, B. Norton, Sol. Energy 80 (2006) 834.
[5] A. Zacharopoulos, P.C. Eames, D. McLarnon, B. Norton, Sol.
Energy 68 (2000) 439.
[6] M. Brogren, Low-concentrating photovoltaic systems with parabolic
reflectors, Licentiate Thesis, Division of Solid State Physics, Uppsala
University, Sweden, 2001, ISSN 03 46-8887.
[7] M. Ronnelid, Optical design of stationary solar concentrators for
high latitudes, Ph.D. Thesis, Department of Materials Science,
Uppsala University, Sweden, 1998.
[8] M. Ronnelid, B. Perers, B. Karlsson, P. Krohn, Cooling of PV
modules equipped with low-concentrating CPC reflectors, in:
Proceedings of the ISES Solar World Congress, Jerusalem, 1999.
[9] D.R. Mills, J.E. Giutronich, Sol. Energy 23 (1979) 85.
[10] R. Winston, Solar concentrators, in: J. Gordon (Ed.), Solar Energy—
The State of the Art, James & James, London, 2001, pp. 357–436.
[11] M. Brogren, P. Nostell, B. Karlsson, Sol. Energy 69 (2000) 173.
[12] H. Hakansson, A parallel beam solar simulator for testing of solar
components, in: ISES Solar World Congress, Gothemburg, Sweden,
2003.
[13] V.G. Chant, R. Hakansson, The MINSUN Simulation and
Optimisation Program, Application and Users Guide, IEA SH&C
Task VII, Ottawa, 1985.
[14] J.A. Duffie, W.A. Beckman, Solar Engineering of Thermal Processes,
Wiley-Interscience, New York, 1991.
[15] W.R. McIntire, Sol. Energy 29 (1982) 315.
[16] J. Nilsson, M. Brogren, A. Helgesson, A. Roos, B. Karlsson, Sol.
Energy 80 (2006) 1199.
[17] M.W. Edenburn, Active, passive cooling for concentrating photo-
voltaic arrays, in: Fourteenth IEEE Photovoltaic Specialists Con-
ference, San Diego, 1980.
ARTICLE IN PRESSH. Gajbert et al. / Solar Energy Materials & Solar Cells 91 (2007) 1788–1799 1799

Paper VIII
285
Paper VIII

Solar thermal energy systems for building integration
286

Paper VIII
287
Design, Building Integration and Performance of a Hybrid Solar Wall Element Andreas Fieber, Division of Energy and Building Design,
Department of Construction and Architecture, Lund University P.O. Box 118, 221 00 Lund, Sweden [email protected] Phone +46-46-2227347 fax +46-46-2224719
Helena Gajbert, Division of Energy and Building Design, Lund University Håkan Håkansson, Division of Energy and Building Design, Lund University Johan Nilsson, Division of Energy and Building Design, Lund University Tobias Rosencrantz, Division of Energy and Building Design, Lund University Björn Karlsson, Division of Energy and Building Design, Lund University
The building industry and the solar energy industry calls for innovative and attractive building integrated active solar thermal and PV systems, in order to widen the acceptance and use of solar energy. As an answer to a widened understanding of building integration, a multifunctional wall element has been developed.
A PV/T component on the inside of an antireflective insulation window with concentrating mobile reflector screens makes the system fully integrated into the building, even its interior. The Solar Window provides PV electricity and warm water, besides passive space heating and day lighting. Simultaneously, the reflector screens act as sunshades and added internal insulation for the window. The reflectors have an optical concentration factor of 2.45, which decreases the required, cost-intensive PV cell and heat absorber area. The hybrid technology has synergetic effects such as cooling the PV cells for increased performance, and making use of heat generated in the cell. The climate protected system is a visible element in the exterior and particularly in the interior, and its performance is directly connected to the user behaviour, due to the operation of the reflectors, which can be switched between a closed, concentrating mode or an open, transparent mode.
Performance of a 1 m2 prototype of the system, regarding its sun shading and U-value properties and its photovoltaic and active thermal output, has been momitored. For a two-pane anti-reflective window, the U value is reduced from 2.8 to 1.2 W/ m2K with the reflectors closed. The annual transmittance through the window is estimated to 609 kWh/ m2, of which approximately 10% is expected to be delivered by the PV modules. About 20 % will be delivered as active solar heat and 30% as net passive space heating. The distribution is highly dependent on the daily operation of the reflectors, which to some extent could be automated.
1 The design of the Solar Window As an answer to the search for truly building integrated solar energy systems, an experimental design was proposed, which combines all useable forms of solar energy into one system; active and passive heating, PV electricity and daylight. The concept also aims at visually exposing the system in a novel and attractive way. The key for this challenge was simply to use a window as the glazing for a solar collector. By using hybrid absorbers and pivoted reflectors behind the window, a multifunctional and responding building skin is achieved. The basic concept of building integration is

Solar thermal energy systems for building integration
288
hence changed from the notion of the solar energy system being part of the building envelope, to the idea of the building envelope being part of the solar energy system.
The system consists of three main components: the window, the hybrid absorber and the reflector, see figure 1. The combination is intended to give synergy effects by ascribing the components multiple functions
The hybrid absorber is fixed in an angle of 20° to the horizontal plane. A 2 mm thick aluminium absorber has PV cells laminated on the upper side. The thickness
reduces movements due to temperature differences, which otherwise puts the PV cells at risk of cracking. Water pipes are attached to the bottom for distributing active solar gains and for cooling the PV cells and the cavity between the window surface and the reflectors. Building integrated, they also serve as supporting structure for the absorbers and the reflectors, and as the pivot for the reflectors. EPS insulation around the pipes also makes endings for the rotation of the reflectors, and connects the insulation of the reflectors into a continuous convection shield.
The reflector screens are primarily intended for concentrating the solar radiation onto the hybrid absorber. Thus, the need for expensive absorber and PV cell area is reduced, as it is largely replaced by substantially cheaper reflecting material. The resulting distance between the fixed absorbers thus makes it possible to achieve transparency between them when the reflectors are of little use. Hence, daylight may filter through the structure, which also gives passive thermal gains. For passive solar house designs with use of large south facing window areas, risks of overheating and thermal losses are common. The reflectors are intended to reduce these problems, by serving as internal sunshades during daytime and as internal insulation during night time. The reflecting geometry is a two-dimensional parabolic curve, with the optical axis tilted by 15° from the horizontal plane, see figure 2. It has a geometrical concentration factor, i.e. the ratio between the glazed opening and the absorber area, of 2.45. The curve is extruded horizontally as a trough, and the reflector is constructed as a sandwich composition with a 35 mm EPS core between the reflective film on the concave side and a birch veneer on the convex side.
The window serves as the climate shield and as the solar radiation transmitter for the system. After the solar radiation is transmitted through the window, it is distributed as daylight, passive or active heating, or as PV electricity, in proportions
Figure 1: Description of the Solar Window in open and closed mode
Figure 2: Concentrating geometry
A
P
105º
15º
A = = 2,7 Pcos2(105º/2)
P
Y

Paper VIII
289
depending on the handling between the closed or open modes. For maximal input for the PV/T absorber through a vertical surface, the transmittance through the window needs to be maximized. Therefore, a highly transparent glass with anti-reflective coating is used. Due to the over-heating precautions by the solar shading and the cooling effect of the absorber, a higher transmittance of the glazing can be tolerated.
2 Building integration The presence of the hybrid PV/T system inside a window makes it highly visible from the exterior as well as the interior. One of the basic ideas behind the design was to express the building integrated solar energy system architecturally in an attractive, maximally exposed way. Conceptually, the window is the traditional solar collector, hence an interesting starting point for integrating other solar technologies.
Other aesthetical considerations are mainly due to the reflectors. The curved concentrating geometry is decorative and expresses the capturing nature of a solar energy system. The backside facing the interior could be covered with any surface material suitable for the interior context. The modular nature of the reflectors, with no connection to the energy distribution, makes it possible to exchange them for alternative surface, thickness or reflecting geometry. The concave front facing the window will be highly visible from the exterior, and the mirror like surface might be the most critical aesthetical property for a wider acceptance. However, the curved mirror can generate interesting optical expressions in the façade. The extruded picture of the PV/T absorber is visible when the spectator is within the optical acceptance angle range, which means that the impression of the individual modules will differ much in height on a short distance. The overall impression of the façade will hence change when approaching it. The mobility of the reflectors also contributes to a dynamic façade expression.
The system is initially intended for experimental integration into a low energy, single family house, designed simultaneously with the concept for the solar window, see figure 2. This house has an 18 m2 south facing window structure prepared for the integration of the Solar Window system. The house is constructed with an EPS module system with integrated load-bearing wooden beams, with no thermal bridges. A central brick wall and a ceramic clad concrete floor absorb passive gains. The solar heating system is complemented by a pellet burner, and the PV system is grid-connected while also carrying a local DC circuit for reducing magnetic fields and eliminating losses in battery eliminators, used for DC powered devices.
3 Window properties The Solar Window is evaluated for its properties as a building component. From this perspective, it can be regarded as a normal window with added features, such as solar shading and internal insulation by the reflector screens. The window consists of
Figure 3: Illustration of the initial design of the Solar Window building integrated

Solar thermal energy systems for building integration
290
a double-pane insulating glass unit (IGU). The panes are proposed to have anti-reflective coatings in order to increase the active thermal and PV performance for a vertically oriented element. The insulating and sun-shading properties of the reflectors and the anti-reflective coatings are objects for evaluation.
A 1 m2 prototype of the solar window has been constructed for evaluation of the thermal properties. Five hybrid absorbers with reflectors were mounted in a wooden frame with a double pane IGU attached in the front. The U value of the window together with the closed reflectors has been calculated from measurements in a guarded hot-box, according to ISO 8990 (Johansson 2004, ISO8990 1994). The Solar Window was placed in a square shaped hole between a cold and a hot space of 21.6 m3 each. The hot space contained a guarded measuring box, covering the hole and the heating device. The U value was calculated according to Eq. (1):
nTAQ
UΔ
= [Eq. (1)]
U is the U-value of the construction (W/m2K), Q is the power input for heating the guarded measuring box, A is the area of the window, and ΔTn is the environmental temperature difference between the hot and cold space.
Tests were made for the window separately and with the solar window components attached with the reflectors in six different positions, with four intermediate opening angles between the fixed open or closed modes. The window separately represents a U value of 2.80 W/m2K. The U value of the whole Solar Window differs between 2.42 in the fully open mode, to 1.33 for the fully closed mode, see figure 4.
The effect on the U value with the reflectors opened derives from the reduced convection due to interruption of cold downdraught. Hence, the effect of the open reflectors could be regarded as an added internal surface resistance, which varies by opening angle.
The prototype construction was not made sufficiently airtight, why some compensation was made for this by sealing the gaps in its closed position. One measurement was made with the reflectors closed and sealed towards the absorber insulation, and another one also with added sealing between absorber insulation and window, in order to reduce the channel of cold downdraught to one individual module. These two steps made the U value drop from 1.33 to 1.22 and 1.17 W/m2K respectively. Air tightness is hence an important criterion for further design studies. The visual shading effect of the reflectors as sunshades in a closed position is total, which means that effective solar shading, visible shading and effective insulation is obtained simultaneously. However, the shading effect of the reflectors in an open position needs to be evaluated. Especially the risk of glare due to the concentration
a: 0° 95°37° 47° 56° 66°U: 1,33 2,431,73 1,86 2,07 2,25
Figure 4: U values for different opening angles, a

Paper VIII
291
of daylight from the reflectors needs to be observed and reduced to a minimum. A two-dimensional ray-tracing analysis, made by hand in a CAD program (see figure 5), shows that most of the radiation reflected will be distributed upwards to the next element above and then spread again. For solar angles at 20° and lower, there is a small risk of glare from the concentrated daylight. This problem is likely solved by reducing the rotation angle from 95° (which was set for minimizing the horizontal obstruction of view) to 90°.
Figure 5: Ray-tracing illustrating the distribution of direct radiation with the reflectors opened at a solar height of 30° (left) and 20° (right).
4 User strategies The final distribution between the different forms of solar gains, and the thermal losses through the structure, are dependent on how the system is regulated between the two reflector modes. The complexity also increases due to more subjective response from the users due to thermal comfort and wish for daylight and view.
The system was initially designed for integration into a single family house, where most bright hours during weekdays are characterised by the absence of the inhabitants. A rough operating schedule is outlined: during morning hours, with low solar flux and high user activity, the reflectors can be opened to allow for daylight, view and direct passive heat gain. During solar peak hours, with family members being at work or at school, the reflectors can stand closed for maximal active performance. Late afternoons and evenings have similar characteristics like the mornings, thus the reflectors are likely to be opened. For avoiding view inside (i.e. allow for privacy) and thermal losses during dark hours, the reflectors should be mainly closed until the next morning. When integrated into larger areas, zoning of the system allows for combinations of closed and open modules during this cycle.
Another operating strategy could be automating the movement for the reflectors on response to the radiation intensity and the outdoor temperature. It could be programmed for closure at radiation levels too high for thermal or visual comfort, or at levels too low for any practical use, e.g. at night time. In combination with other “intelligent house” technologies, such as sensors indicating occupant absence, obvious opportunities for keeping the reflectors totally closed can be maximally used. For calculations on passive gains in Stockholm, Sweden (lat 59.31), the reflectors were considered closed at transmitted irradiance levels below 50 W/m2 and above 300 W/m2, and opened at intermediate levels, from March to October. Concerns have been taken to the solar shading effect of the reflectors by using the computer tool
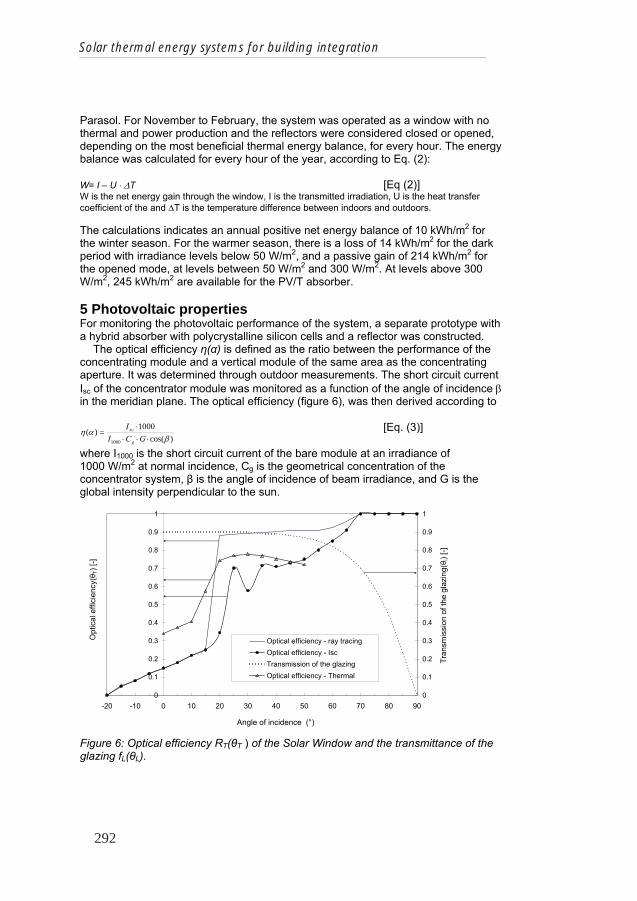
Solar thermal energy systems for building integration
292
Parasol. For November to February, the system was operated as a window with no thermal and power production and the reflectors were considered closed or opened, depending on the most beneficial thermal energy balance, for every hour. The energy balance was calculated for every hour of the year, according to Eq. (2):
W= I – U ΔT [Eq (2)] W is the net energy gain through the window, I is the transmitted irradiation, U is the heat transfer coefficient of the and ΔT is the temperature difference between indoors and outdoors.
The calculations indicates an annual positive net energy balance of 10 kWh/m2 for the winter season. For the warmer season, there is a loss of 14 kWh/m2 for the dark period with irradiance levels below 50 W/m2, and a passive gain of 214 kWh/m2 for the opened mode, at levels between 50 W/m2 and 300 W/m2. At levels above 300 W/m2, 245 kWh/m2 are available for the PV/T absorber.
5 Photovoltaic properties For monitoring the photovoltaic performance of the system, a separate prototype with a hybrid absorber with polycrystalline silicon cells and a reflector was constructed.
The optical efficiency ( ) is defined as the ratio between the performance of the concentrating module and a vertical module of the same area as the concentrating aperture. It was determined through outdoor measurements. The short circuit current Isc of the concentrator module was monitored as a function of the angle of incidence βin the meridian plane. The optical efficiency (figure 6), was then derived according to
)cos(1000
)(1000 β
αη =GCI
I
g
sc [Eq. (3)]
where I1000 is the short circuit current of the bare module at an irradiance of 1000 W/m2 at normal incidence, Cg is the geometrical concentration of the concentrator system, is the angle of incidence of beam irradiance, and G is the global intensity perpendicular to the sun.
0
0.1
0.2
0.3
0.4
0.5
0.6
0.7
0.8
0.9
1
-20 -10 0 10 20 30 40 50 60 70 80 90
Angle of incidence (°)
Opt
ical
effi
cien
cy(
T) [-
]
0
0.1
0.2
0.3
0.4
0.5
0.6
0.7
0.8
0.9
1
Tran
smis
sion
of t
he g
lazi
ng(
i) [-]
Optical efficiency - ray tracingOptical efficiency - IscTransmission of the glazingOptical efficiency - Thermal
Figure 6: Optical efficiency RT( T ) of the Solar Window and the transmittance of the glazing fL( L).

Paper VIII
293
The measurements were performed during high irradiance and with a diffuse fraction of around 10%. The concentrator accepts all irradiance for solar altitudes exceeding 15° in the meridian plane, which means that the diffuse optical performance of the concentrator will be similar to that of a module tilted 20° with a correction for reflectance losses. This further means that the optical acceptance of diffuse irradiance will be around 70% of the beam efficiency. For this reason, the global intensity can be used in Eq (3) without significantly increasing the error of the model.
The optical efficiencies are functions of the projected angle of incidence in the transversal plane and the transmission of the glazing is given as a function of the conventional angle of incidence. Ray tracing represents the theoretical optical efficiency of the system at 85% reflectance. The graph labeled Optical efficiency - Iscin figure 6 contains contributions from measurements with corrections from ray tracing. The difference between measured values and ray tracing at 15°< T<60° is due to resistive losses in the cells when the reflector is effective. The cells on the prototype absorber did not cover the whole width of the absorber, which meant that for angles above 40° the reflected beam partly missed the cell. The angulars above 40° are instead generated by ray tracing. The transmission of the glazing has also been included in the graph as it was used in the calculations of the annual output.
A simulation software, MINSUN (Chant and Håkansson 1985), estimated the annual output of electricity using the optical efficiencies at different angles of incidence. The model used to describe the incidence angle dependence of the system in MINSUN is defined by Eq. (4)
)()( iLTTopt fR θθη = [Eq. (4)]
RT describes the behaviour of the reflector as dependent of T and fL the transmission of the window glass as dependent of i . T is the projected angle of incidence in the transversal plane and i is the conventional angle of incidence relative to the glass normal.
This model has previously been shown to describe the optical performance of an asymmetric compound parabolic reflector system such as this one well (Brogren et al, 2004).
The simulations show a 93% increase in electrical output for the concentrator module relative to the vertical reference module, which means that one square meter of this window annually would deliver 79 kWh of electric energy. The annual performance is 43% higher than that of an identical module tilted 20°.
The active area of the tested measured prototype covers only 87% of the total glazed area, which this has to be taken into consideration when an economical comparison is made with other systems. It is however possible to increase the active area of the window in a future full scale installation.
6 Solar thermal properties The active thermal absorbers for water carried heat serves three purposes; delivering heat for domestic hot water and possibly also for space heating, reducing the heat load in the interior during summer and cooling the photovoltaic cells in order to increase the electrical efficiency. The full scale window prototype was used in indoor and outdoor measurements for determination of the incidence angle dependency and the U value of the thermal collectors. Based on these results the annual energy yield has been derived.

Solar thermal energy systems for building integration
294
To estimate a U value for the prototype of the solar wall operating as a solar collector, measurements of the heat loss from the collector have been performed in a dark surrounding at different temperatures of the inlet water. The values of U0 and U1were estimated to 4.0 W/m2·K and 0.046 W/m2·K2 and the resulting collector U value as a function of ΔT is shown in figure 7.
0
1
2
3
4
5
6
7
8
0 10 20 30 40 50 60 70
ΔT [K]
U v
laue
of t
he th
erm
al c
olle
ctor
[W/m
²,K]
U = 4,0 + 0,046 * ΔT
U0 = 4,0 W/m2, K
U1 = 0,046 W/m2, K2
Figure 7. The U value of the thermal collector as a function of ΔT.
At ΔT = 30 K, the U value is 5.4 W/m2·K per glazed wall area. During the measurements, the prototype was surrounded on both sides with the same temperature. In a building, however, the back side of the window will usually be surrounded with air of room temperature, which will suppress the heat losses. Approximately 10 % of the total heat losses, are estimated as border losses.
The indoor measurements have been performed by using a large solar simulator providing nearly parallel light and adjustable for solar altitude angles (Håkansson H. (2003 a and b). As described in Håkansson (2003 c) and Gajbert et al. (2004), the simulator provides relatively good parallel quality of light, though this has been achieved somewhat at the expense of the light distribution over the area. As different solar altitudes are simulated, there is a tendency of varying irradiation over the test area as the uneven light pattern moves. To continuously measure the variation of the total irradiation on the test area, a number of parallel connected photodiodes were evenly spread out over the front glass of the prototype, giving a current corresponding to the received total irradiation (Gajbert et al, 2004).
By indoor measurements of the thermal efficiency, i.e. the zero-loss efficiency, the incidence angle dependency was derived. The prototype of the solar wall was placed perpendicular to the solar simulator and the simulator was raised in order to simulate every tenth degree of solar altitude angle, i.e. the incidence angle on the glazing projected in the north south vertical plane, θT. The optical efficiency of the prototype was monitored for different solar altitude angles, giving the incidence angle dependency in the meridian plane, ηT ( T ). The result was normalized by an outdoor measurement where the absolute value of the optical efficiency, i.e. the zero-loss efficiency at 30° incidence angle was registered.
The measured zero-loss efficiency has been divided by fL( L), the transmission of the glazing, as described in equation [3], resulting in a graph angular dependence of

Paper VIII
295
the reflector only, R( T ). These functions , R( T ) and f( L), shown in figure y, were used in MINSUN to simulate the annual thermal energy yield. The measured values of optical efficiency at high incidence angles are less reliable, due to the non-uniform light distribution on the small projected area. Therefore, for angles higher than 50°, the same theoretical values as were used for the electricity calculations, shown in figure 6, have been used. The difference between the theoretical graph of optical efficiency, calculated by ray tracing, and the calculated values is due to the reflections on the absorber, the collector efficiency, the multiple reflexes on the reflector at higher incidence angles, and on the unevenness of the reflector. Since the photovoltaic cell situated in front of the thermal absorber has an efficiency of 15%, only 85% of the in MINSUN simulated irradiation falling onto the absorber is taken into count for thermal energy yield.
The result of the simulations shows that the annual thermal energy provided by the Solar Window is 103 kWh/m2 glazed surface, calculated at an operating temperature of 50°C. For operating temperatures of 40°C and 25°C the yield would be 155 and 250 kWh/a,m2 respectively. However, as previously discussed, the real heat losses would probably be lower, because of the higher indoor temperature, thus implying higher yields.
7 Discussion and conclusion A proper model for the regulating strategy of the system is needed to predict the distribution of gains and losses via the Solar Window. The complexity and interrelations between the different functions is a challenge for the modelling, which needs to integrate the spatial surrounding. A detailed model could be of much use for a regulation of an automated system for best performance and comfort.
The level of automation for the system is object for further studies. A range of products with different standard, from fully manual to fully automatic, is a likely development. It is however of importance that the control-function can be overridden manually at all times due to direct response from the user.
Performance of the system has been analysed separately for passive gains, active thermal gains and PV electricity yield. According to the proposed regulating schedule, passive gains are estimated to 210 kWh/m2 annually. However, it is not examined how much of this is usable. The performance of the fully concentrated PV/T absorber is estimated to 79 kWh/m2 of electricity, and at least 155 kWh/m2 of heat for domestic hot water. Following the proposed regulating schedule, these figures might be reduced. For a more accurate and integrated analysis, long-term outside measurements will be made for the full window prototype with PV/T absorbers.
Cost estimations are dependent on where the system border is drawn, since the system also is the building envelope. For comparison with conventional solar energy systems, it might be fair to withdraw the window and sunshade cost if the same is done for the building material the conventional collector replaces. Production cost for the Solar Window excluding the glazing is estimated to approximately €250/m2, but more thorough calculations need to be made.
Acknowledgements This work was supported by the Swedish Energy Agency and Formas, the Swedish Research Council for Environment, Agricultural Sciences and Spatial Planning.

Solar thermal energy systems for building integration
296
ReferencesAdsten M., 2002. Solar Thermal Collectors at High Latitudes – Design and Performance of Non-Tracking Concentrators, Acta universitatis Upsaliensis, Uppsala, Sweden.
Brogren M. et al, 2004. Biaxial model for the incidence angle dependence of the optical efficiency of photovoltaic and solar thermal systems with asymmetric reflectors. Submitted to Solar Energy Journal.
Chant V.G. and Håkansson R., 1985. The MINSUN simulation and optimisation program. Application and users guide. IEA SH&C Task VII, Ottawa.
Fieber A. and Karlsson B. Design, construction and performance of a multifunctional hybrid solar wall element, In the proceedings of ISES Solar World Congress 2003, Gothenburg, Sweden
Gajbert H., Håkansson H., Karlsson B., (2004) Measurement of concentrating solar collectors using a solar simulator with parallel light, Submitted to Eurosun2004, Freiburg, Germany 20-23 June 2004.
Håkansson H., (2003) A parallel beam solar simulator for testing of solar components, In the proceedings of ISES Solar World Congress 2003, Gothenburg, Sweden 14–19 June 2003.
Håkansson H. (2003) Solar laboratory, In Solar Protection in Buildings, Wall M., Bülow-Hübe H. (eds), pp. 49-66. Dept. of Construction and Architecture, Lund University.
Håkansson H. (2003) Solar laboratory, In Solar Protection in Buildings: Part 2, Wall M., Bülow-Hübe H. (eds), pp. 29-67. Dept. of Construction and Architecture, Lund University.
ISO 8990 (1994) Thermal insulation – Determination of steady-state thermal transmission properties – Calibrated and guarded hot box, ISO 8990:1994 (E)
Johansson T. (2004) Utvärdering av Solfönster, en integration av solhybrid och solskydd, Dept. of Construction and Architecture, Lund University
www.parasol.se

Paper IX
297
Paper IX

Solar thermal energy systems for building integration
298

Paper IX
299
COMPETITIVE SOLAR HEATING SYSTEMS FOR RESIDENTIAL BUILDINGS
Simon Furbo and Alexander Thür Department of Civil Engineering, Technical University of Denmark, Brovej, building 118, Kgs. Lyngby, DK-2800,
Denmark, phone number: +45 45 25 18 57, fax number: +45 45 93 17 55, email: [email protected]
Frank Fiedler and Chris BalesSERC, Dalarna University College, Department of Mathematics, Natural Sciences and Technology, Borlänge, S-78188,
Sweden, phone number: +46 23 778 711, fax number: +46 23 778 701, email: [email protected]
John Rekstad and Michaela Meir Department of Physics, University of Oslo, P.O. Box 1048, Blindern, Sem Sælandsvei 24, Oslo, N-0316, Norway,
phone number: +47 2285 6475, fax number: +47 2285 6422, email: [email protected]
Dagnija Blumberga and Claudio RochasDepartment of Energy Systems and Environment, Riga Technical University, Kronvalda bulv. 1, Riga, LV-1010,
Latvia, phone number: +371 9419783, fax number: +371 7089923, email: [email protected]
Björn Karlsson and Helena GajbertDepartment of Construction and Architecture, Division of Energy and Building Design, Lund Institute of Technology,
P.O. Box 118, Lund, SE-22100, Sweden, phone number: +46 268 3529, fax number: +46 46222 4719, email:[email protected]
Abstract – This paper describes the ongoing research project “Competitive solar heating systems forresidential buildings”. The aim of the project is to develop competitive solar combisystems which areattractive to buyers. The solar combisystems must be attractive compared to traditional energy systems,both from an economical and architectural point of view.The project includes education, research, development and demonstration. The project started in 2003 andwill be finished by the end of 2006. The participants of the project, which is financed by Nordic EnergyResearch and the participants themselves, are the universities: Technical University of Denmark, DalarnaUniversity, University of Oslo, Riga Technical University and Lund Institute of Technology, as well as the companies: Metro Therm A/S (Denmark), Velux A/S (Denmark), Solentek AB (Sweden) and SolarNor (Norway). The project consists of a number of Ph.D. studies in Denmark, Sweden and Latvia,and a post-doc. study in Norway. Close cooperation between the researchers and the industry partnersensures that the results of the project can be utilized. By the end of the project the industry partners willbe able to bring the developed systems onto the market.In Denmark and Norway the focus is on solar heating/natural gas systems, and in Sweden and Latvia thefocus is on solar heating/pellet systems. Additionally, Lund Institute of Technology and University ofOslo are studying solar collectors of various types being integrated into the roof and facade of thebuilding.
1. INTRODUCTION
Today only a small part of the worlds energyconsumption is covered by renewable energy systems.Figures 1 and 2 show the world’s installed capacity andyearly energy production of different renewable energysystems. A comparison between the different energysystems based on the figures is not completely fair, sincesome of the energy systems are producing electricity while others, such as solar heating systems, are “only”producing heat. It is however obvious that worldwidesolar energy utilization by means of solar heating systemsis one of the most important ways to utilize renewableenergy sources today.
0
10
20
30
40
50
60
Wind Photovoltaics SolidBiomass
Biogas Geothermal SolarThermalPower
SolarThermal Heat
Inst
alle
d C
apac
ity W
orld
wid
e,20
01 [G
W]
Figure 1. Installed capacity worldwide for differentrenewable energy systems, (Weiss, 2004).

Solar thermal energy systems for building integration
300
Figure 2. Energy produced worldwide by different renewable energy systems, (Weiss, 2004).
Today the solar heating market worldwide is growing byabout 30% per year (Weiss, 2004), and this growth isexpected to continue. In not a too far future, our energysupply must come from renewable energy systems. Solar heating systems can, if the energy costs from the systemsare low enough, play an important role in this connection. In Denmark, Sweden, Norway and Latvia respectively25%, 23%, 27% and 35% of the country’s total yearly energy consumption is used for heating of buildings,while the yearly solar radiation on the horizontal surface of the country is respectively 180, 1030, 1200 and 3130times greater than the country’s total yearly energyconsumption. Certainly, the potential for solar heatingsystems is large, even at Northern latitudes. Further, from the start of 2006 the EU directive2002/91/EC on Energy Performance of Buildings must beimplemented in all 25 EU countries. New and renovatedbuildings must have a low total energy consumption. Thisis expected to further accelerate the growth of the numberof installed solar heating systems in Europe. In the last 10 years the market for solar heating systemsin the Northern European countries has not been as goodas in the central European countries, like Austria andGermany, where major companies are now active in themarket. In Scandinavia the number of yearly installed solarheating systems has not increased in the same way, withsignificant differences between the countries. Significantfactors here are the on-off subsidy conditions over recentyears, lack of major players on the market, and the factthat the cost of solar heating is perceived to be relativelyhigh compared to the price of heating produced byburning fossil fuel or electricity. Electricity is a commonenergy form for heating houses in Norway, Sweden andFinland due to the abundance of hydropower. Increasingelectricity use combined with two dry years with reducedhydropower production, currently make alternativesources for heating much more interesting. In addition,the increased deregulation of electricity production inEurope will probably lead to higher consumer prices inScandinavia.
There are two ways to reduce the energy costs of solarheating systems. One is based on rationalisation effects due to large scale production. This way is only possible ifthere is a continuous sufficient demand for solar heating systems. The alternative is to improve theperformance/cost ratio of the solar heating systems by means of development of improved systems.
Electricity and Heat Generation 2001
34000
339
79600
13617
32700
559
41795
0100002000030000400005000060000700008000090000
Wind Photovoltaics SolidBiomass
Biogas Geothermal SolarThermalPower
SolarThermal Heat
[GW
h]
Recent studies within Task 26 of the InternationalEnergy Agency’s Solar Heating and Cooling Programmehave shown that significant improvements can be made tosolar heating systems, and a few German and Austriancompanies have already optimised their systems (Weiss,2003). These optimised systems are complete systemsincluding boiler as well as solar collectors, and are often installed in new buildings or when an existing boiler is being replaced. However, these systems are not readilyavailable in the Nordic countries. Therefore it has been decided to use the knowledge gained from this previousinternational collaboration in connection withdevelopment of solar heating systems for North Europeancountries.
2. RESEARCH PROJECT: COMPETITIVE SOLARHEATING SYSTEMS FOR RESIDENTIALBUILDINGS
During the period 2003-2006, the research project“Competitive solar heating systems for residentialbuildings” will be carried out in cooperation betweenleading research institutes and companies in the solarheating field in the Nordic and Baltic countries. The aim of the project is to develop solar heating systems whichare attractive to buyers. Up to 50% of the energyconsumption in the building will be covered by solarenergy; the remaining energy consumption will becovered by conventional energy resources. Solar heatingfor new buildings as well as for retrofits will beaddressed.
The project includes education, research, developmentand demonstration. The participants of the project, whichis financed by Nordic Energy Research and theparticipants themselves, are the universities: TechnicalUniversity of Denmark, Dalarna University, University ofOslo, Riga Technical University and Lund Institute ofTechnology as well as the companies Metro Therm A/S and Velux A/S from Denmark, Solentek AB fromSweden and SolarNor from Norway.
The project consists of a number of Ph.D. studies in Denmark, Sweden and Latvia and a post-doc. study inNorway. Close cooperation between the researchers andthe industry partners ensures that the results of the projectcan be utilized. By the end of the project the industrypartners will be able to bring the developed systems ontothe market.
In Denmark and Norway the focus is on solarheating/natural gas systems, and in Sweden and Latviathe focus is on solar heating/pellet systems. Further, Lund Institute of Technology and University of Oslo are

Paper IX
301
studying building integrated solar collectors of various types.
3. EDUCATION ACTIVITIES
During the first part of the Ph.D. projects, two Ph.D. courses on solar energy have been organized at Technical University of Denmark and Riga Technical University, with participants from all around the world. During the courses, which included lectures by experienced researchers, visits to manufacturers and solar heating systems as well as social arrangements, the students worked on different topics within the solar energy field with the aim to prepare state of the art reports. The students presented their findings and their Ph.D. projects to the other participants of the courses. Valuable networks among the Ph.D. students and the teachers were established. A third specialized Ph.D. course focusing on thermal stratification in solar storage tanks will be organized at Technical University of Denmark in September-October 2005.
The Ph.D. students of the project have carried out/will carry out study stays at one of the other participating universities for a period of about 6 months. In this way good cooperation between the participating universities is ensured.
At SERC the ESES education, European Solar Engineering School education, a one-year Master degree on solar energy with new students from all around the world every year, is carried out. Lectures for the ESES students have been given by teachers from the participating universities of the project. Further, ESES students have carried out their Master Thesis projects in connection with the research project at the participating universities.
Further, the students following the normal solar heating courses at the participating universities have been informed about the activities of the research project. Several Master Thesis projects and special courses have been carried out in connection with the research project. Consequently, the project contributes to capacity building in the solar heating field.
Finally, national workshops for the solar heating industry and solar heating seminars for all interested have been arranged. In this way not only the participating industries will benefit from the research project.
4. RESEARCH ACTIVITIES
Research is carried out with focus on: Building integrated solar collectors New materials Heat storage Good interplay between solar collectors and
auxiliary energy supply system Advanced control strategy
Low temperature heating systems In total 5 Ph.D. students and 1 post-doc. are working on the project. Two Ph.D. studies on solar combisystems are carried out at Technical University of Denmark by Alexander Thür and Elsa Andersen. Alexander Thür is working on development of solar heating/natural gas systems in cooperation with Metro Therm A/S, while Elsa Andersen is working on differently designed solar combisystems. At SERC Frank Fiedler is working on a Ph.D. study with the aim to develop a solar/pellet heating system in cooperation with Solentak AB and Metro Therm A/S. At Riga Technical University, Claudio Rochas is working on a Ph.D. project with the aim to develop a solar/pellet heating system. At Lund Institute of Technology, Helena Gajbert is working on a Ph.D. project on concentrating solar collectors for building integration. At University of Oslo, Michaela Meir is carrying out a post-doc. study concerning new façade and roof integrated solar collectors and solar heating/natural gas systems with high solar fractions. She is working in close cooperation with SolarNor.
5. DEVELOPMENT OF SOLAR HEATING SYSTEMS
The research groups at SERC and Technical University of Denmark work together with the industry partners Metro Therm A/S and Solentek AB with the aim to develop attractive natural gas/solar heating systems and pellet/solar heating systems.
The concept for both systems is the same: The system consists of a highly prefabricated technical unit with all the equipment of the systems including the natural gas/pellet boiler and one or more units with the heat storage. The units are built into 60x60 cm cabinets, see Figure 3. Prototypes of the units will be tested in laboratory test facilities during the summer of 2005 and demonstration systems will be installed during the autumn of 2005. The integration allows faster installation and reliable systems. Although the system is highly prefabricated, there is significant flexibility: choice of gas or pellet boiler; choice of system size, with larger systems either having multiple 60 x 60 cm cabinet stores, or single larger stores.
The goal is, by the end of the project, to have natural gas/solar heating system units and pellet/solar heating systems installed in several houses for field tests by Metro Therm A/S and by Solentek AB, respectively.

Solar thermal energy systems for building integration
302
Figure 3. Solar storage unit and technical unit for theDanish/Swedish solar combisystems.
At Riga Technical University work, with the aim todevelop solar pellet heating systems using the sameprinciples as used in the Danish/Swedish concept iscarried out.
Lund Institute of Technology is focusing on thedevelopment of concentrating integrated solar collectorsin cooperation with NCC AB.
At University of Oslo, a low temperature drain backsolar heating/natural gas system based on plasticcollectors, a large solar store and a floor heating system with a high solar fraction has been developed incooperation with SolarNor. Further, façade integratedsolar collectors have been developed. Figure 4 shows anexample of a façade integrated solar collector in a onefamily house.
Figure 4. SolarNor’s façade integrated solar collectors in a one family house, (source: SolarNor).
6. DEMONSTRATION SYSTEMS
A number of solar combisystems based on thedeveloped solar heating systems and components will bebuilt in one family houses in the autumn of 2005. The
systems will be monitored in such a way that the thermalperformance and energy savings of the systems can be determined.
For instance, the Danish solar heating will be installedin a one family house with an existing natural gas boiler.The energy demand as well as the natural gasconsumption has been measured since August 2004. It is therefore possible to determine the energy savings of thesolar heating system based on measurements from thehouse without and with the solar heating system installed.
The measurement periods for the demonstration systemswill be about 1 year.
7. FUTURE WORK
Prototypes of the developed solar heating systems and components will be tested in laboratory test facilitiesduring the summer of 2005. Based on the test results, thedesigns of the systems/components might be improvedbefore the demonstration systems will be built in onefamily houses in the autumn of 2005. Measurements fromthe demonstration systems will be carried out until theend of the project by the end of 2006.
Theoretical investigations based on detailed computersimulations and cost estimates concerning optimization of the design of the systems will be carried out in parallelwith the tests of the prototypes and the measurementsfrom practice. The investigations will, among other things, elucidate how to design the systems in order to achieve solar heating systems with high solar fractions.
The results of the project will be available in a numberof Ph.D. reports, a report finalizing the post-doc. studyand in a number of scientific papers. Further, the resultsof the project will be presented at international solarheating conferences and at national solar heatingseminars and workshops. The results will also, along with general information on the project, be available on theproject homepage: http://energi.fysikk.uio.no/rebus.
Preliminary results from the project are found in thefollowing papers and reports: (Fiedler, 2003), (Boström,Wäckelgård and Karlsson, 2003), (Gajbert and Fiedler,2003), (Meir and Rekstad, 2003), (Fiedler, 2004), (Thür,Furbo and Shah, 2004), (Meir, Rekstad and Svåsand,2004), (Meir, Fiedler, Rekstad, van Wieringen andKristoffersen, 2004), (Furbo, Andersen, Thür, Shah and Andersen, 2004), (Fiedler, Nordlander, Bales and Persson, 2004), (Andersen, Jordan, Shah and Furbo,2004), (Kahlen, Wallner, Meir and Rekstad, 2005),(Gajbert, Råberg, Lövehed and Karlsson, 2005),(Schakenda, Spikkeland, Meir, Olivares and Rekstad,2005), (Gajbert and Karlsson, 2005), (Meir, Fiedler, Gao,Kahlen, Mathisen, Olivares, Rekstad and Schakenda,2005), (Thür and Furbo, 2005), (Rochas and Blumberga,2005), (Meir, Rekstad, Fiedler, Kristoffersen, Olivares,Schakenda, van Wieringen, 2005), (Fiedler, Bales, Thür,and Furbo, 2005), (Andersen, Furbo and Fan, 2005) and(Andersen and Furbo, 2005).
Paper IX
303
8. CONCLUSIONS
The project “Competitive solar heating systems for residential buildings” has increased the educational and research cooperation within the solar heating field between the Nordic and Baltic universities. Further, the project has resulted in an increased number of young experts in the solar heating field.
It is expected that the attractive solar combisystems developed in the project will be brought to the market by the industry partners of the project from 2007.
Finally, the basis for development of improved solar heating systems in the Nordic and Baltic countries for the future has been improved. Consequently, the project will contribute to increased use of solar heating systems in the future.
ACKNOWLEDGEMENT
We are grateful to Nordic Energy Research for their financial support for the project “Competitive solar heating systems for residential buildings”.
REFERENCES
Weiss W. (2004). New emerging markets and applications for solar thermal systems. Chance or risk for the European solar thermal industry? Key note presentation EuroSun 2004 Congress. June 20-23, Freiburg, Germany.
Weiss W. (2003). Solar Heating Systems for Houses. A Design Handbook for Solar Combisystems. Solar Heating and Cooling Executive Committee of the International Energy Agency. James & James Ltd, London.
Fiedler F. (2003). The application of renewable energy for prefab houses in Germany. SERC Report No. ISRN DU-SERC—76—SE, SERC, Department of Mathematics, Natural Sciences and Technology, Högskolan Dalarna, Sweden.
Boström T.K., Wäckelgård E. and Karlsson B. (2003). Design of a solar system with high solar fraction in an extremely well insulated house. Proceedings of ISES Solar World Congress 2003, June 14-19, Gothenburg, Sweden.
Gajbert H. and Fiedler F. (2003). Solar combisystems – a state of the art report. From Ph.D. course Solar Energy, Technical University of Denmark.
Meir M. and Rekstad J. (2003). Der SolarNor Kunststoffkollektor – The development of a polymer collector with glazing. Proceedings of Polymeric Solar
Materials, Erstes Leobener Symposium “Solartechnik – Neue Möglichkeiten für die Kunststoffbranche”. October 7-8, Leoben.
Fiedler F. (2004). The state of the art of small-scale pellet-based heating systems and relevant regulations in Sweden, Austria and Germany. Renewable and Sustainable Energy Reviews 8(3), pp. 201-221.
Thür A., Furbo S. and Shah L.J. (2004). Energy savings for solar heating systems. EuroSun 2004 Proceedings. June 20-23, Freiburg, Germany.
Meir M., Rekstad J. and Svåsand E. (2004). Façade integration of coloured polymeric collectors. EuroSun 2004 Proceedings. June 20-23, Freiburg, Germany.
Meir M., Fiedler F., Rekstad J., van Wieringen B., Kristoffersen A.R. (2004). A non-pressurized heat store with immersed DHW-tank. EuroSun 2004 Proceedings.June 20-23, Freiburg, Germany.
Furbo S., Andersen E., Thür A., Shah L.J., Andersen K.D. (2004). Advantages by discharge from different levels in solar storage tanks. EuroSun 2004 Proceedings,June 20-23, Freiburg, Germany.
Fiedler F., Nordlander S., Persson T. and Bales C. (2004). Heat losses and thermal performance of commercial combined solar and pellet heating systems. EuroSun 2004 Proceedings, June 20-23, Freiburg, Germany.
Andersen E., Jordan U., Shah L.J. and Furbo S. (2004). Investigations of the SOLVIS stratification inlet pipe for solar tanks. EuroSun 2004 Proceedings, June 20-23, Freiburg, Germany.
Kahlen S.M., Wallner G.M., Meir M.G. and Rekstad J. (2005). Investigation of polymeric materials for solar collector absorbers. North Sun 2005 Proceedings, May 25-27, Vilnius, Lithuania.
Gajbert H., Råberg M., Lövehed L., Karlsson B. (2005). Design and performance of a large solar thermal system with wall integrated collectors in several directions. North Sun 2005 Proceedings. May 25-27, Vilnius, Lithuania.
Schakenda J.A., Spikkeland G., Meir M., Olivares A. and Rekstad J. (2005). Energy metering in solar heating systems – A comparison of three methods. North Sun 2005 Proceedings. May 25-27, Vilnius, Lithuania.
Gajbert H. and Karlsson B. (2005). Design and evaluation of two concentrated roof-integrated solar collectors for uninsulated roofs. North Sun 2005 Proceedings. May 25-27, Vilnius, Lithuania.

Solar thermal energy systems for building integration
304
Meir M., Fiedler F., Gao P., Kahlen S., Mathisen, Olivares A., Rekstad J., Schakenda J.A. (2005). Facade integration of polymeric solar collectors. North Sun 2005 Proceedings. May 25-27, Vilnius, Lithuania.
Thür A. and Furbo S. (2005). Investigations on design of heat storage pipe connections for solar combisystems. North Sun 2005 Proceedings. May 25-27, Vilnius, Lithuania.
Rochas C. and Blumberga D. (2005). Solar combisystems in Latvia – market needs and potential. North Sun 2005 Proceedings. May 25-27, Vilnius, Lithuania.
Meir M., Rekstad J., Fiedler F., Kristoffersen A.R., Olivares A., Schakenda J.A. and van Wieringen B. (2005). A new and simple concept for a heat store combining solar and gas. North Sun 2005 Proceedings.May 25-27, Vilnius, Lithuania.
Fiedler F., Bales C., Thür A. and Furbo S. (2005). The actual status of the development of a Danish/Swedish system concept for a solar combisystem. North Sun 2005 Proceedings. May 25-27, Vilnius, Lithuania.
Andersen E., Furbo S. and Fan J. (2005). Investigations of fabric stratifiers. ISES Solar World Congress 2005 Proceedings. August 8-12, Orlando, USA.
Andersen E. and Furbo S. (2005). Investigations of solar combisystems. ISES Solar World Congress 2005 Proceedings. August 8-12, Orlando, USA.

Paper IX
305

Solar thermal energy systems for building integration
306


ISSN 1671-8136ISBN 978-91-85147-29-8