Embed Size (px)
Citation preview
Sandro Hanaehan Sirait1, Nuhindro PriagungWidodo1, Mikha Simanjuntak2
1Mining Engineering Department, Institut Teknologi Bandung2PT Cibaliung Sumberdaya
INDONESIA
International Symposium on Earth Science and Technology (CINEST)
Kyushu University, Fukuoka, JAPAN 2013
2
CIN
EST,
KYU
SHU
UN
IVER
SITY
, JA
PAN
20
13
PREFACE3
CIN
EST,
KYU
SHU
UN
IVER
SITY
, JA
PAN
20
13
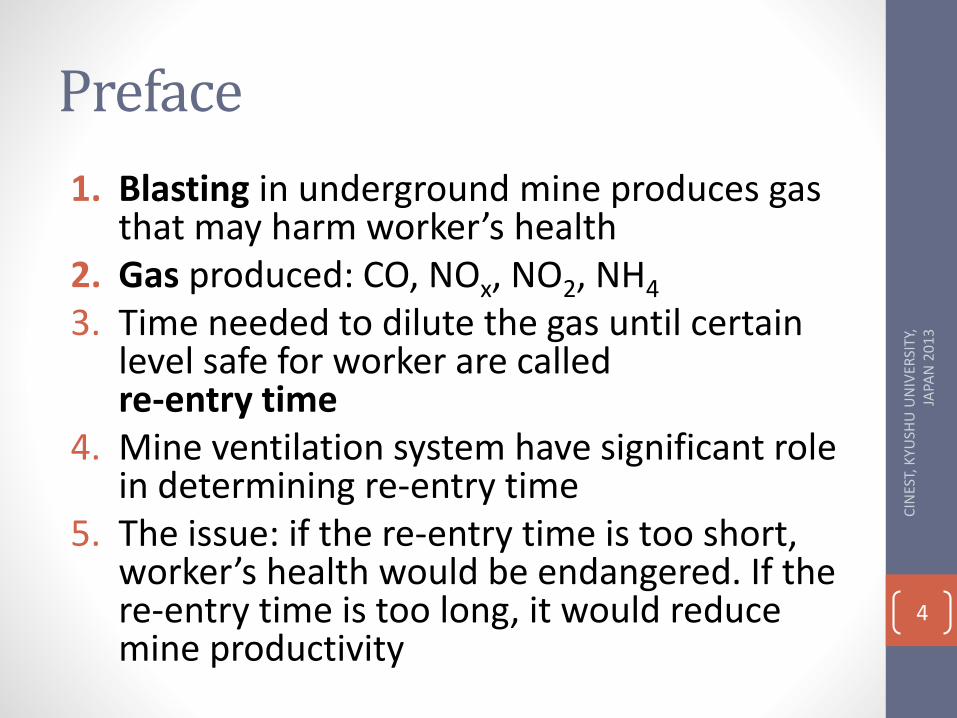
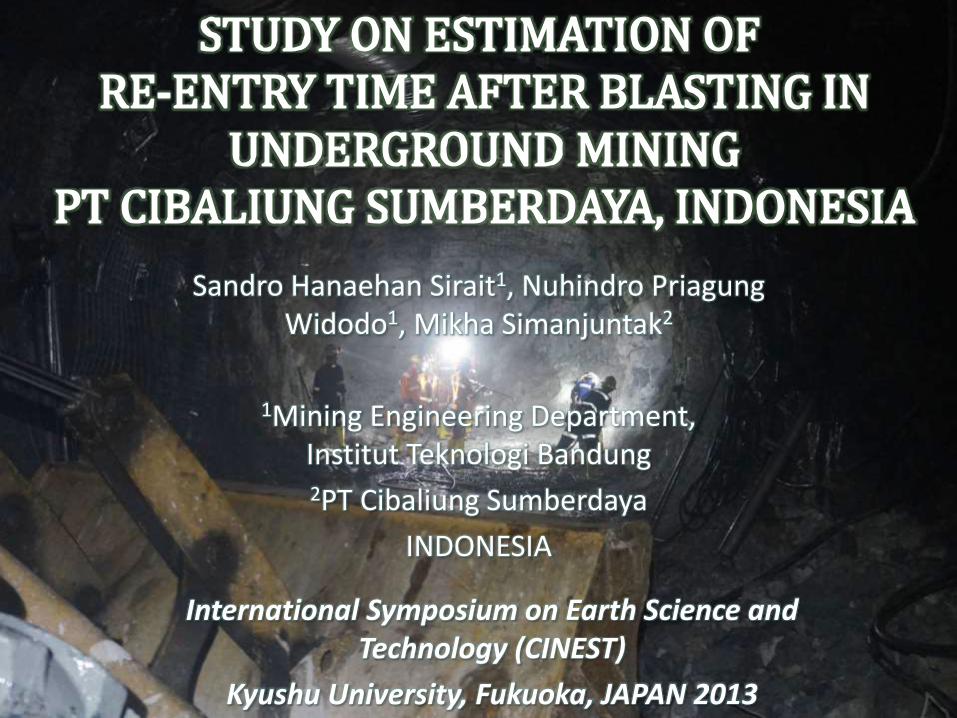
Preface
1. Blasting in underground mine produces gas that may harm worker’s health
2. Gas produced: CO, NOx, NO2, NH4
3. Time needed to dilute the gas until certain level safe for worker are calledre-entry time
4. Mine ventilation system have significant role in determining re-entry time
5. The issue: if the re-entry time is too short, worker’s health would be endangered. If the re-entry time is too long, it would reduce mine productivity
4
CIN
EST,
KYU
SHU
UN
IVER
SITY
, JA
PAN
20
13
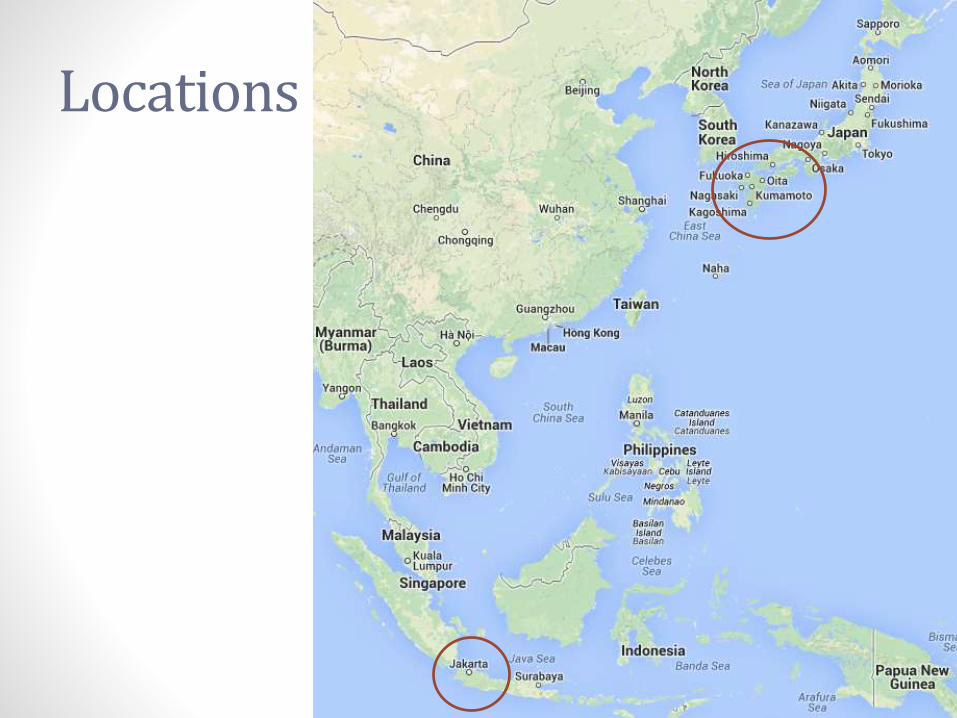
Locations
CIN
EST,
KYU
SHU
UN
IVER
SITY
, JA
PAN
20
13
5
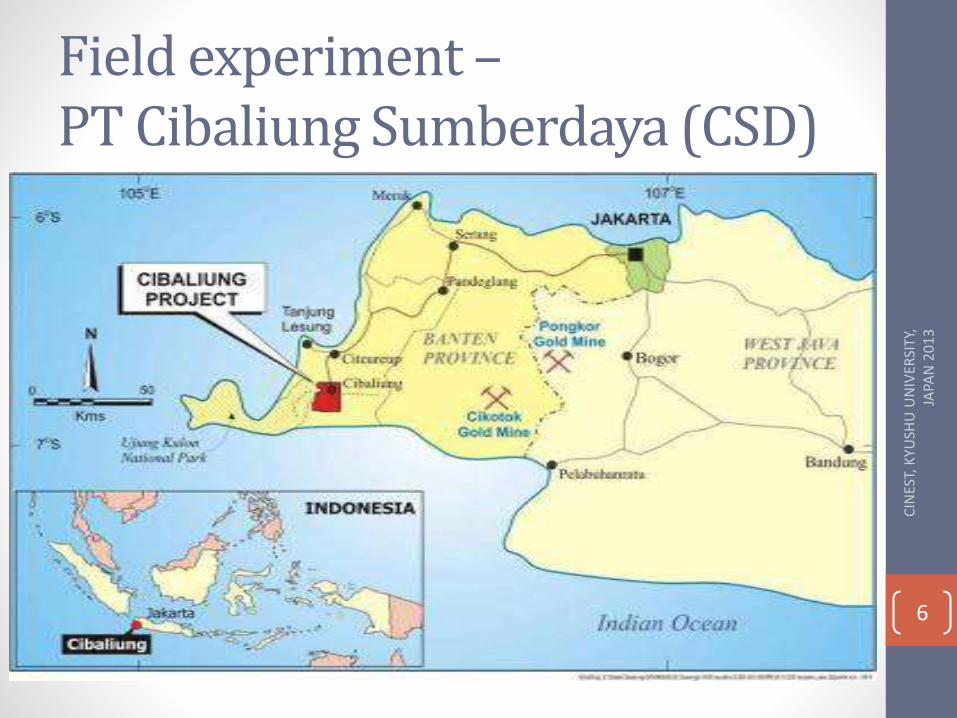
Field experiment –PT Cibaliung Sumberdaya (CSD)
6
CIN
EST,
KYU
SHU
UN
IVER
SITY
, JA
PAN
20
13
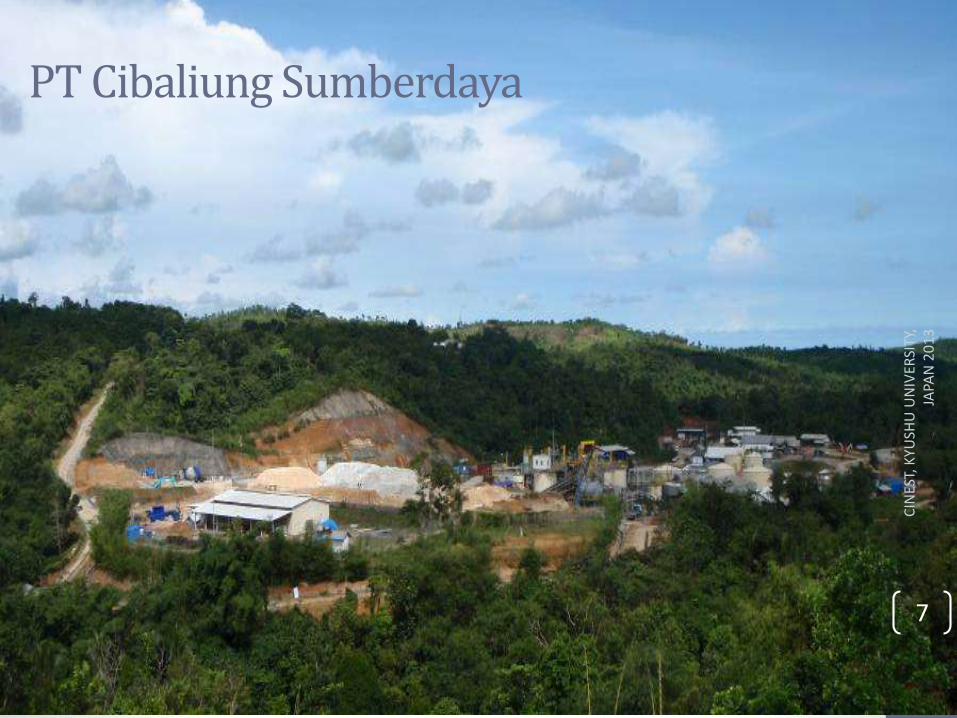
PT Cibaliung Sumberdaya
7
CIN
EST,
KYU
SHU
UN
IVER
SITY
, JA
PAN
20
13
BASIC THEORY8
CIN
EST,
KYU
SHU
UN
IVER
SITY
, JA
PAN
20
13
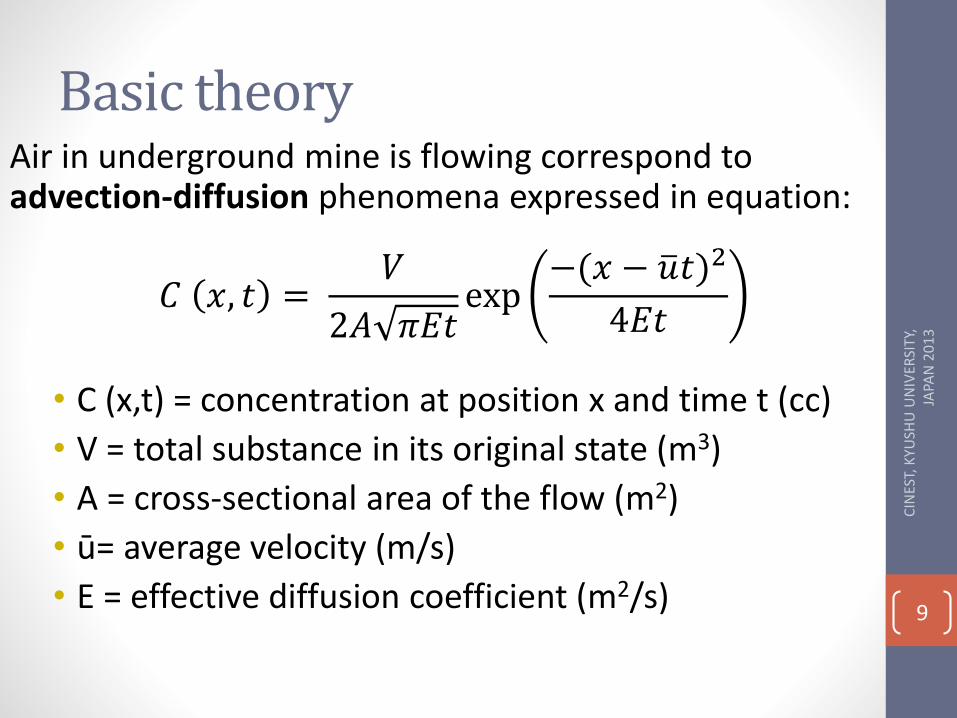
Basic theoryAir in underground mine is flowing correspond to advection-diffusion phenomena expressed in equation:
𝐶 𝑥, 𝑡 =𝑉
2𝐴 𝜋𝐸𝑡exp
−(𝑥 − 𝑢𝑡)2
4𝐸𝑡
• C (x,t) = concentration at position x and time t (cc)
• V = total substance in its original state (m3)
• A = cross-sectional area of the flow (m2)
• ū= average velocity (m/s)
• E = effective diffusion coefficient (m2/s)9
CIN
EST,
KYU
SHU
UN
IVER
SITY
, JA
PAN
20
13
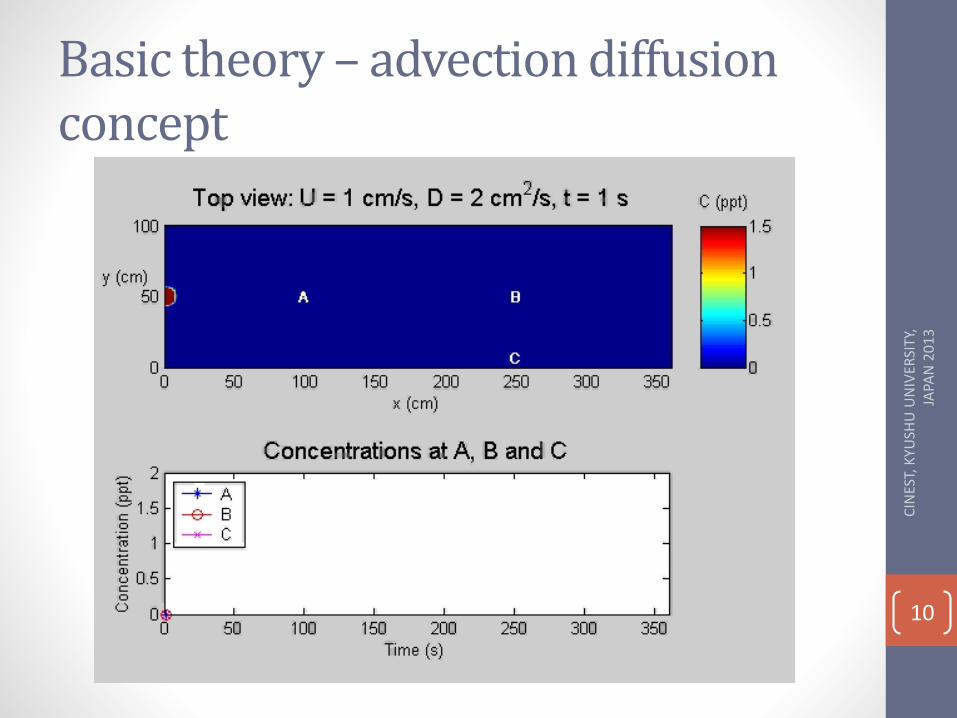
Basic theory – advection diffusion concept
CIN
EST,
KYU
SHU
UN
IVER
SITY
, JA
PAN
20
13
10
FIELD EXPERIMENT
11
CIN
EST,
KYU
SHU
UN
IVER
SITY
, JA
PAN
20
13
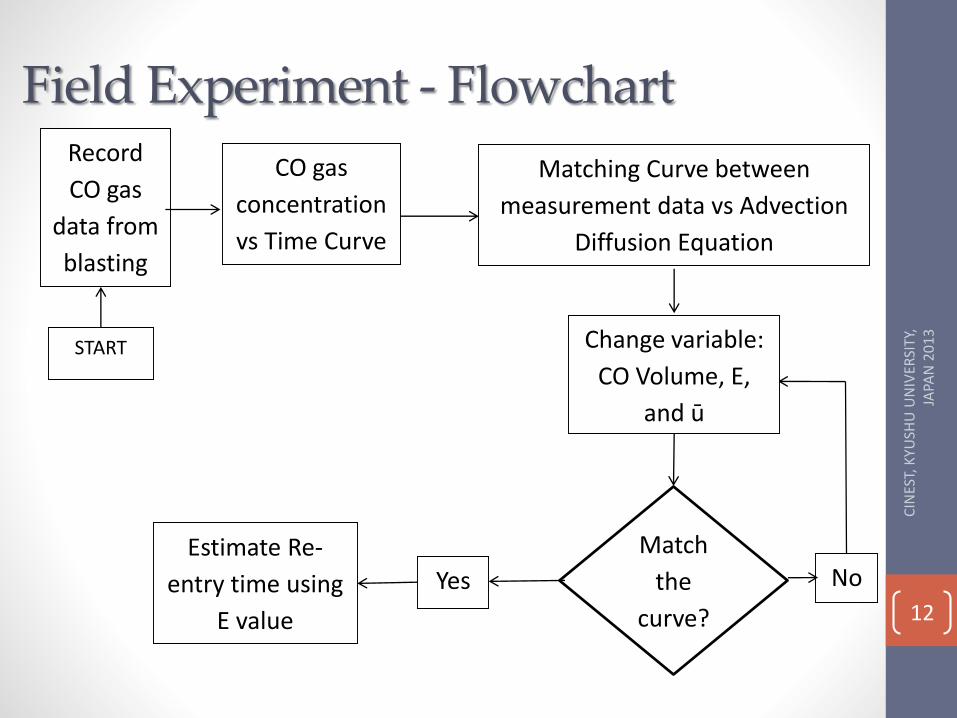
Field Experiment - FlowchartRecord
CO gas
data from
blasting
CO gas
concentration
vs Time Curve
Matching Curve between
measurement data vs Advection
Diffusion Equation
Match
the
curve?
Yes
Estimate Re-
entry time using
E value
No
Change variable:
CO Volume, E,
and ū
START
CIN
EST,
KYU
SHU
UN
IVER
SITY
, JA
PAN
20
13
12
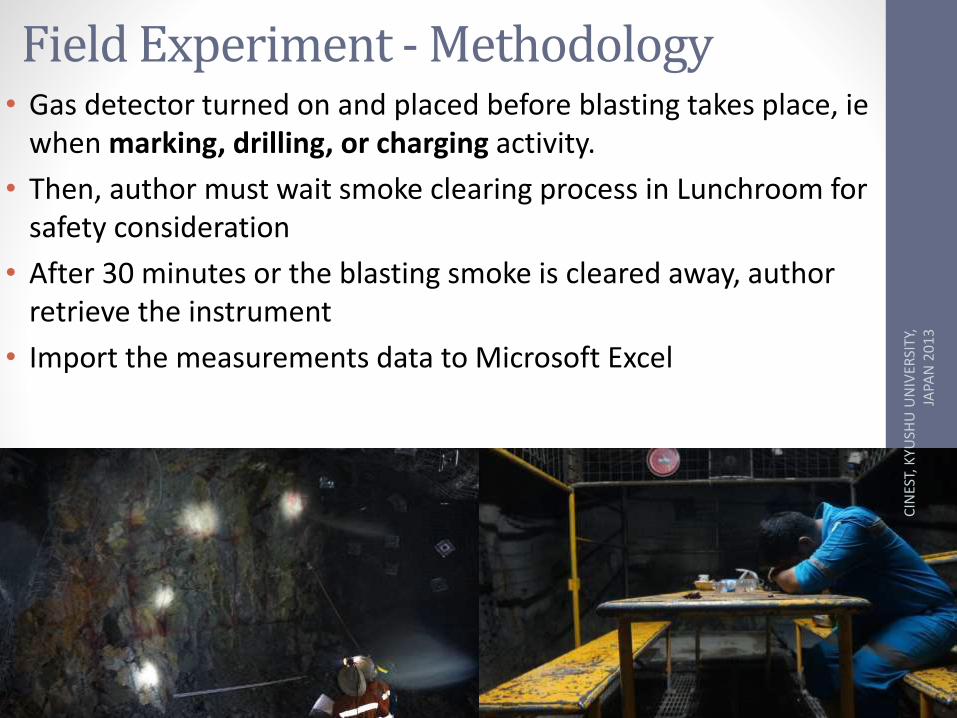
Field Experiment - Methodology• Gas detector turned on and placed before blasting takes place, ie
when marking, drilling, or charging activity.
• Then, author must wait smoke clearing process in Lunchroom for safety consideration
• After 30 minutes or the blasting smoke is cleared away, author retrieve the instrument
• Import the measurements data to Microsoft Excel
13
CIN
EST,
KYU
SHU
UN
IVER
SITY
, JA
PAN
20
13
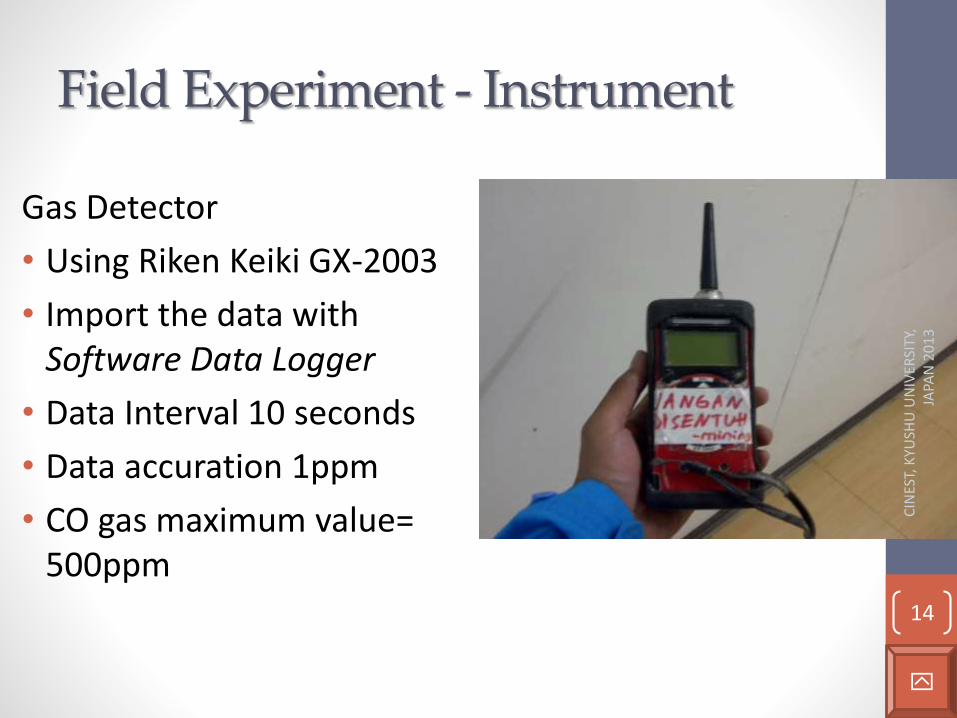
Field Experiment - Instrument
Gas Detector
• Using Riken Keiki GX-2003
• Import the data withSoftware Data Logger
• Data Interval 10 seconds
• Data accuration 1ppm
• CO gas maximum value= 500ppm
14
CIN
EST,
KYU
SHU
UN
IVER
SITY
, JA
PAN
20
13
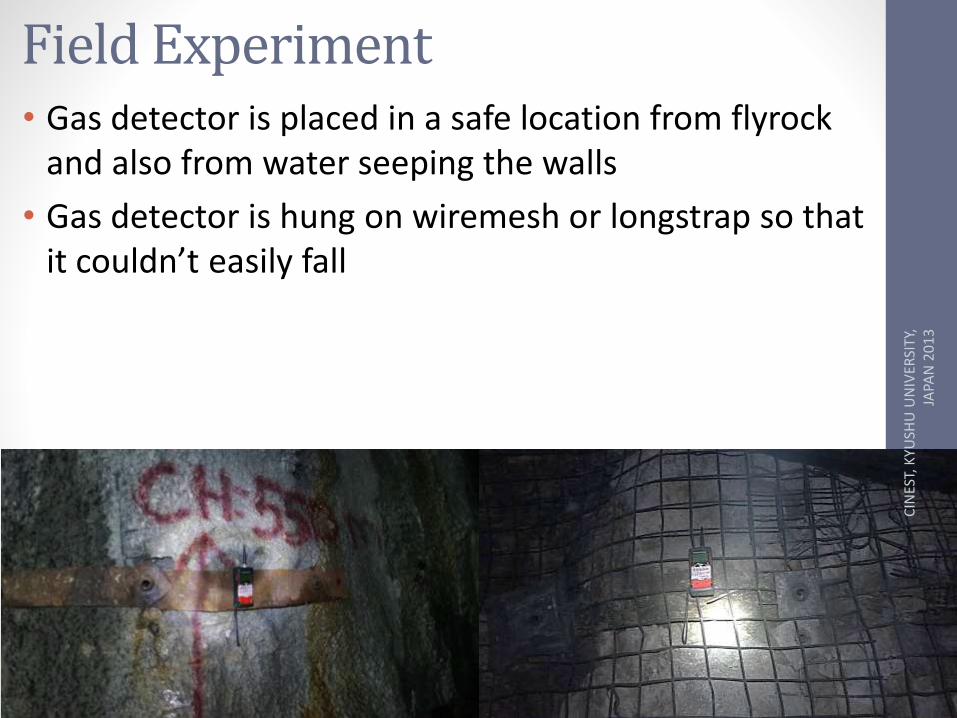
Field Experiment• Gas detector is placed in a safe location from flyrock
and also from water seeping the walls
• Gas detector is hung on wiremesh or longstrap so that it couldn’t easily fall
15
CIN
EST,
KYU
SHU
UN
IVER
SITY
, JA
PAN
20
13
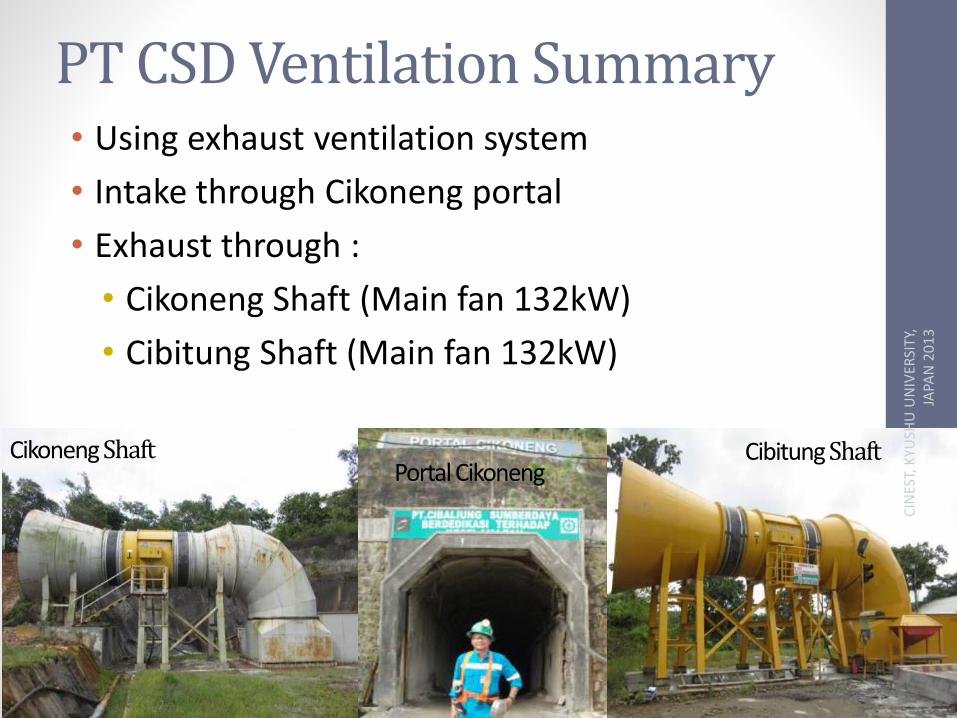
PT CSD Ventilation Summary• Using exhaust ventilation system
• Intake through Cikoneng portal
• Exhaust through :
• Cikoneng Shaft (Main fan 132kW)
• Cibitung Shaft (Main fan 132kW)
16
Portal CikonengCikoneng Shaft Cibitung Shaft
CIN
EST,
KYU
SHU
UN
IVER
SITY
, JA
PAN
20
13
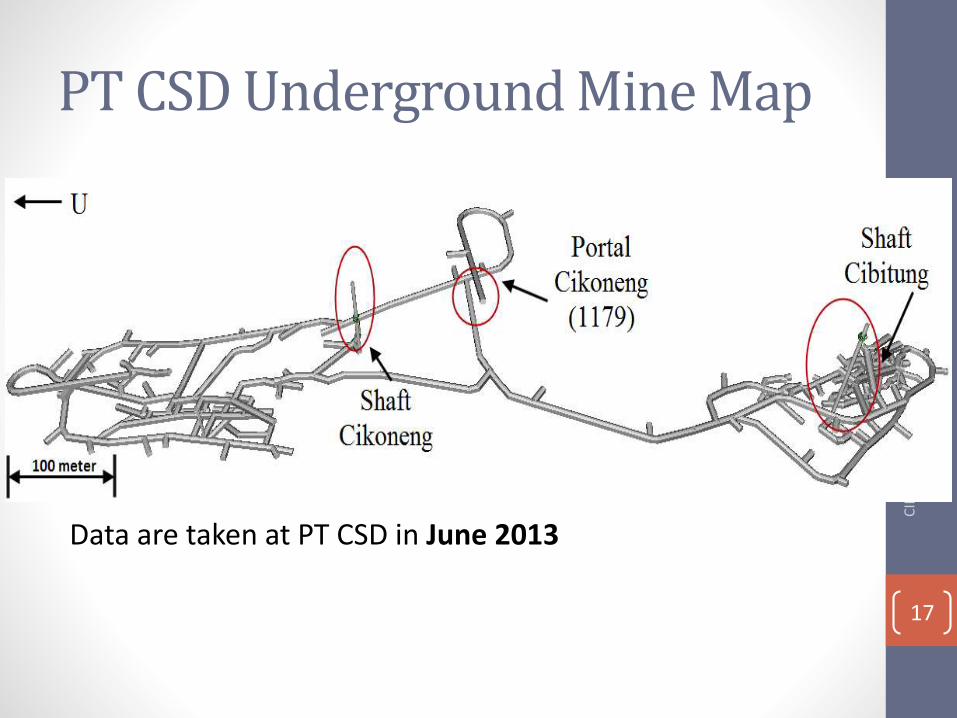
PT CSD Underground Mine Map
Data are taken at PT CSD in June 2013
CIN
EST,
KYU
SHU
UN
IVER
SITY
, JA
PAN
20
13
17
RESULTS AND DISCUSSIONS
18
CIN
EST,
KYU
SHU
UN
IVER
SITY
, JA
PAN
20
13
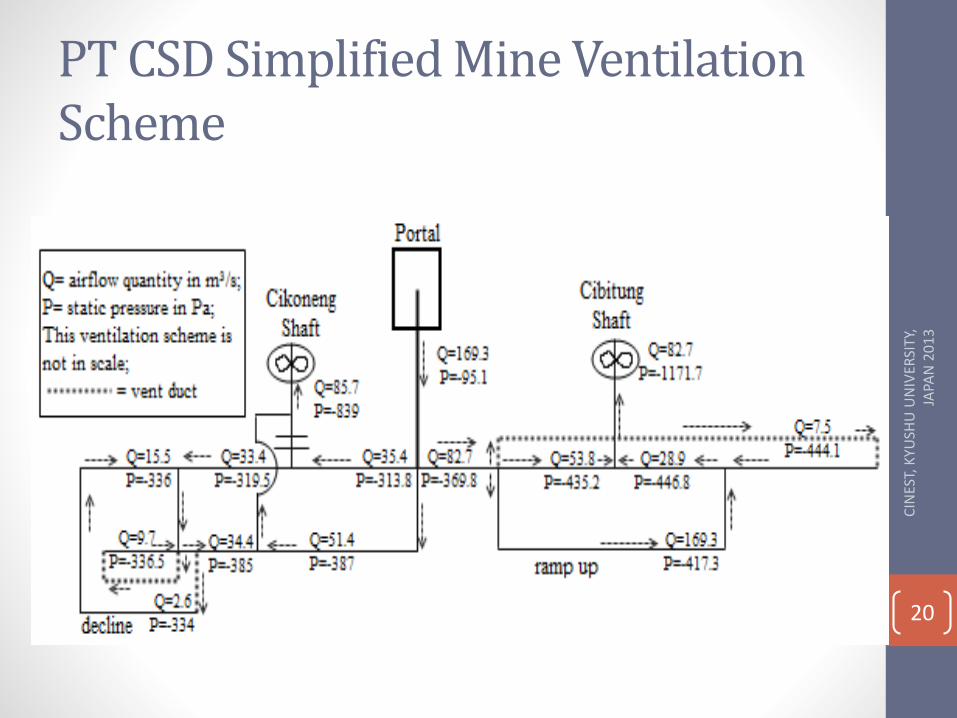
PT CSD Simplified Mine Ventilation Scheme
20
CIN
EST,
KYU
SHU
UN
IVER
SITY
, JA
PAN
20
13
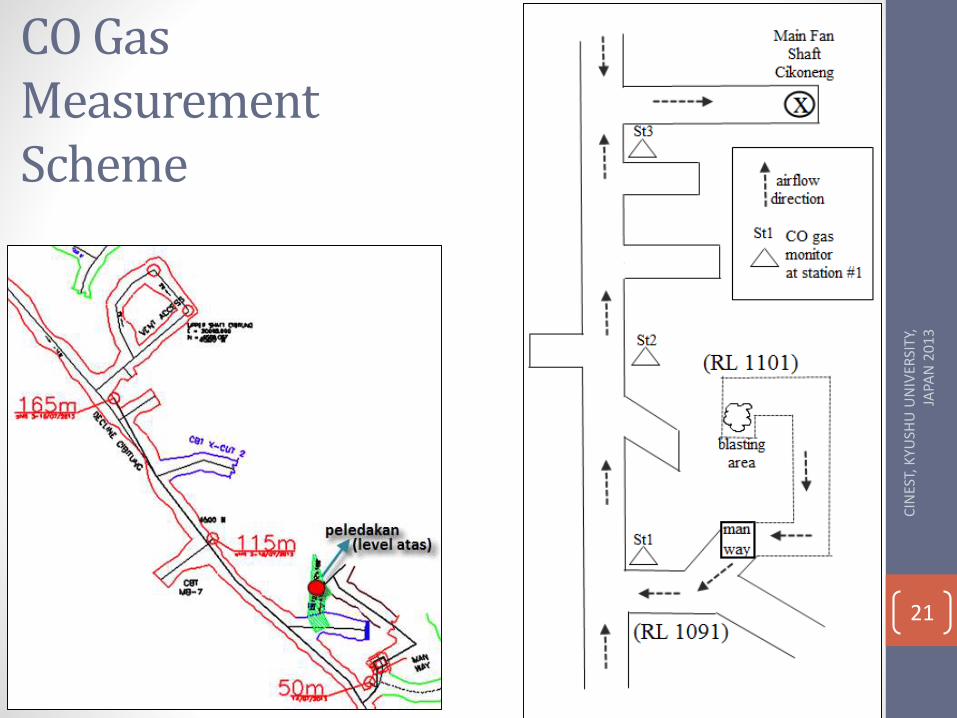
CO Gas Measurement Scheme
21
CIN
EST,
KYU
SHU
UN
IVER
SITY
, JA
PAN
20
13
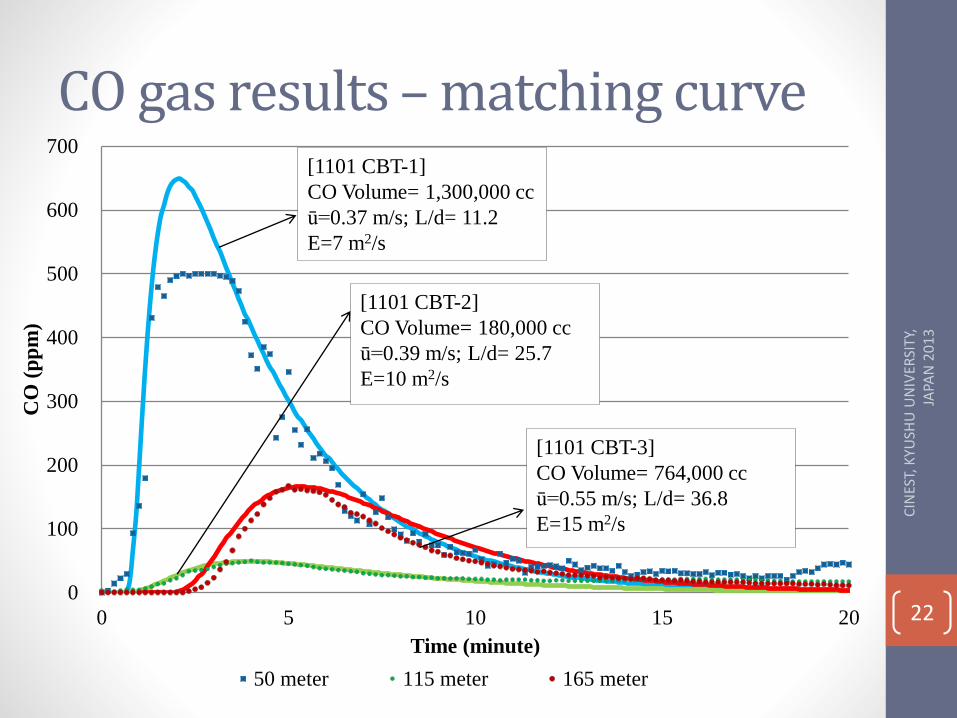
CO gas results –matching curve
220
100
200
300
400
500
600
700
0 5 10 15 20
CO
(p
pm
)
Time (minute)
50 meter 115 meter 165 meter
[1101 CBT-1]
CO Volume= 1,300,000 cc
ū=0.37 m/s; L/d= 11.2
E=7 m2/s
[1101 CBT-2]
CO Volume= 180,000 cc
ū=0.39 m/s; L/d= 25.7
E=10 m2/s
[1101 CBT-3]
CO Volume= 764,000 cc
ū=0.55 m/s; L/d= 36.8
E=15 m2/s
CIN
EST,
KYU
SHU
UN
IVER
SITY
, JA
PAN
20
13
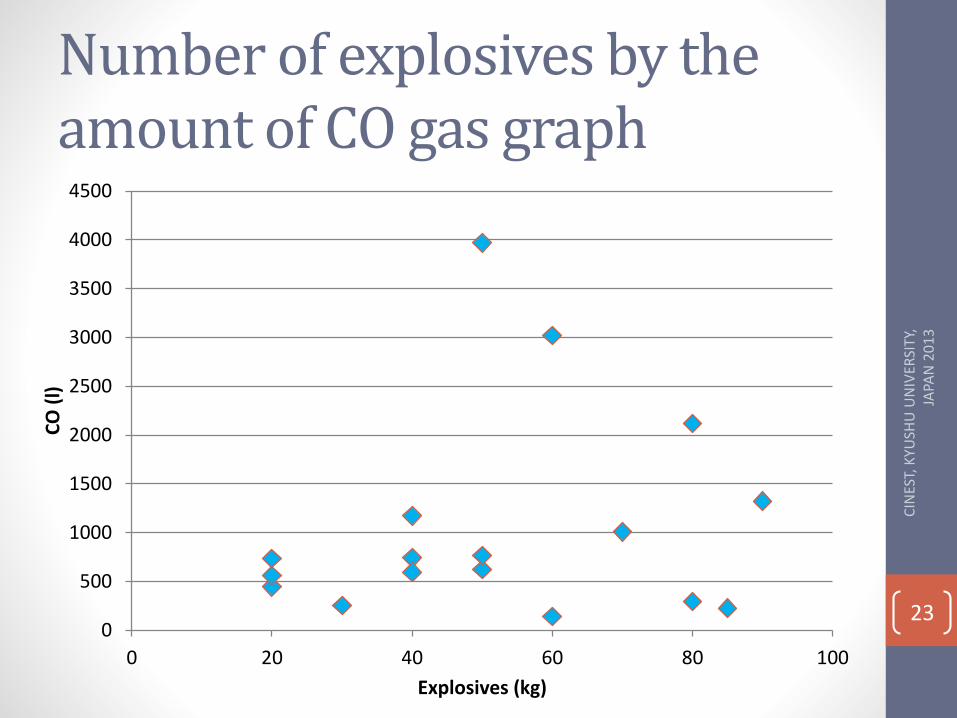
Number of explosives by the amount of CO gas graph
230
500
1000
1500
2000
2500
3000
3500
4000
4500
0 20 40 60 80 100
CO
(l)
Explosives (kg)
CIN
EST,
KYU
SHU
UN
IVER
SITY
, JA
PAN
20
13
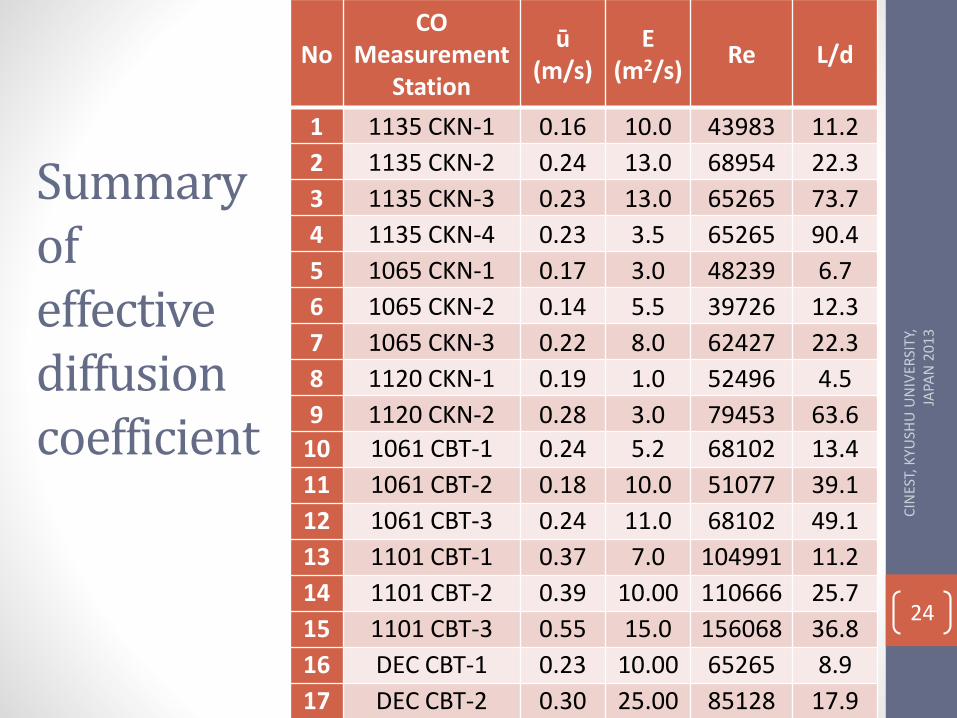
Summary of effective diffusion coefficient
24
NoCO
Measurement Station
ū (m/s)
E (m2/s)
Re L/d
1 1135 CKN-1 0.16 10.0 43983 11.2
2 1135 CKN-2 0.24 13.0 68954 22.3
3 1135 CKN-3 0.23 13.0 65265 73.7
4 1135 CKN-4 0.23 3.5 65265 90.4
5 1065 CKN-1 0.17 3.0 48239 6.7
6 1065 CKN-2 0.14 5.5 39726 12.3
7 1065 CKN-3 0.22 8.0 62427 22.3
8 1120 CKN-1 0.19 1.0 52496 4.5
9 1120 CKN-2 0.28 3.0 79453 63.6
10 1061 CBT-1 0.24 5.2 68102 13.4
11 1061 CBT-2 0.18 10.0 51077 39.1
12 1061 CBT-3 0.24 11.0 68102 49.1
13 1101 CBT-1 0.37 7.0 104991 11.2
14 1101 CBT-2 0.39 10.00 110666 25.7
15 1101 CBT-3 0.55 15.0 156068 36.8
16 DEC CBT-1 0.23 10.00 65265 8.9
17 DEC CBT-2 0.30 25.00 85128 17.9
CIN
EST,
KYU
SHU
UN
IVER
SITY
, JA
PAN
20
13
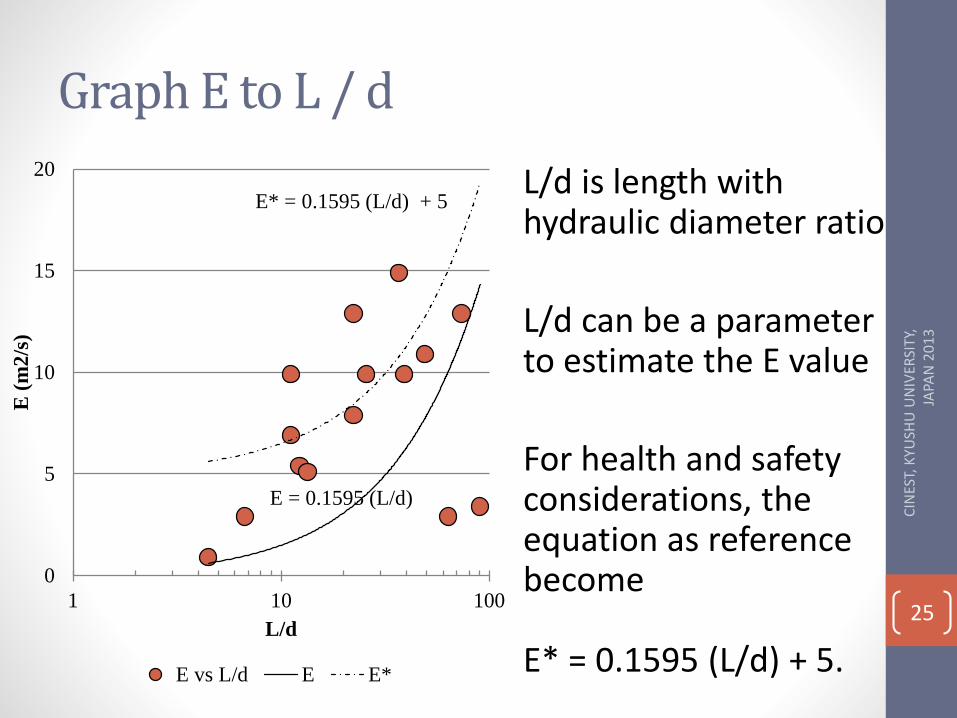
Graph E to L / d
L/d is length with hydraulic diameter ratio
L/d can be a parameter to estimate the E value
For health and safety considerations, the equation as referencebecome
E* = 0.1595 (L/d) + 5.
25
E = 0.1595 (L/d)
E* = 0.1595 (L/d) + 5
0
5
10
15
20
1 10 100
E (
m2
/s)
L/d
E vs L/d E E*
CIN
EST,
KYU
SHU
UN
IVER
SITY
, JA
PAN
20
13
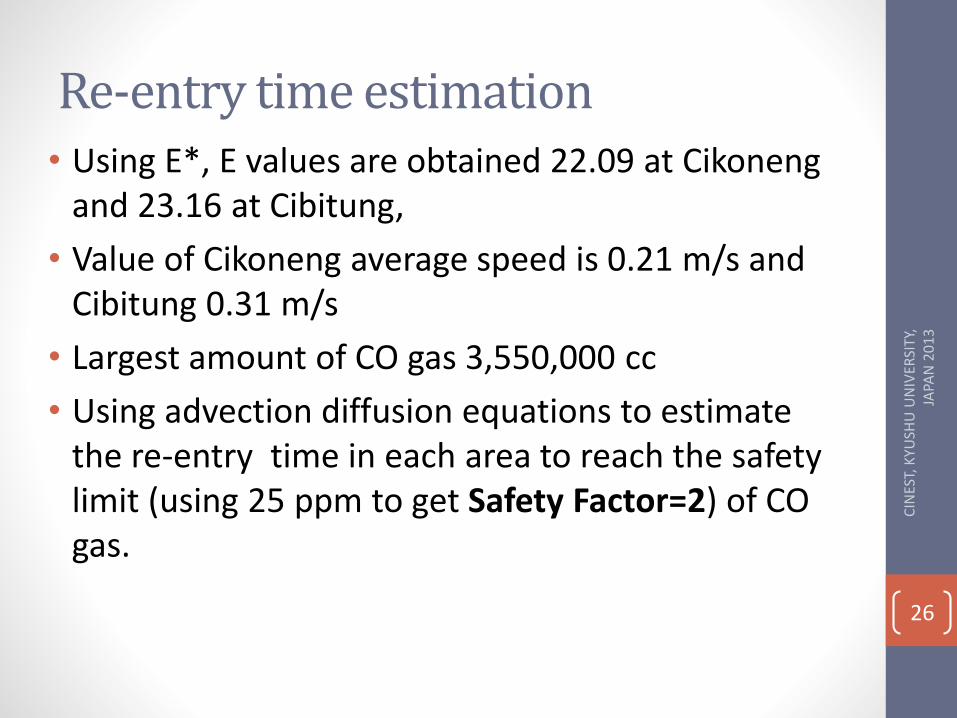
Re-entry time estimation• Using E*, E values are obtained 22.09 at Cikoneng
and 23.16 at Cibitung,
• Value of Cikoneng average speed is 0.21 m/s and Cibitung 0.31 m/s
• Largest amount of CO gas 3,550,000 cc
• Using advection diffusion equations to estimate the re-entry time in each area to reach the safety limit (using 25 ppm to get Safety Factor=2) of CO gas.
26
CIN
EST,
KYU
SHU
UN
IVER
SITY
, JA
PAN
20
13
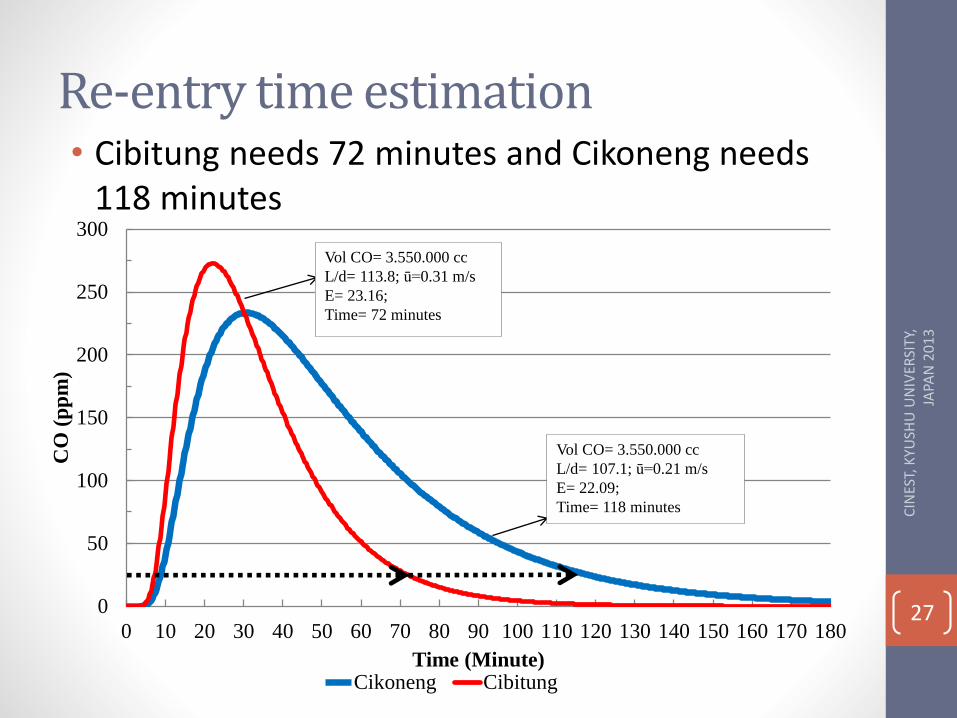
Re-entry time estimation• Cibitung needs 72 minutes and Cikoneng needs
118 minutes
270
50
100
150
200
250
300
0 10 20 30 40 50 60 70 80 90 100 110 120 130 140 150 160 170 180
CO
(p
pm
)
Time (Minute)Cikoneng Cibitung
Vol CO= 3.550.000 cc
L/d= 107.1; ū=0.21 m/s
E= 22.09;
Time= 118 minutes
Vol CO= 3.550.000 cc
L/d= 113.8; ū=0.31 m/s
E= 23.16;
Time= 72 minutes
CIN
EST,
KYU
SHU
UN
IVER
SITY
, JA
PAN
20
13
CONCLUSION REMARKS
28
CIN
EST,
KYU
SHU
UN
IVER
SITY
, JA
PAN
20
13
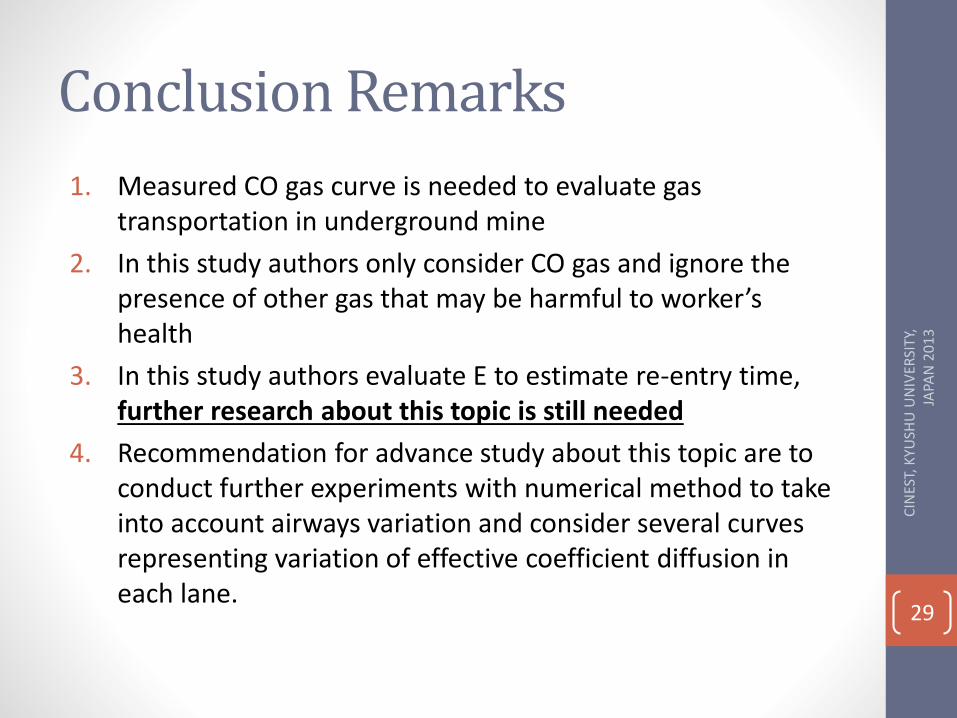
Conclusion Remarks
1. Measured CO gas curve is needed to evaluate gas transportation in underground mine
2. In this study authors only consider CO gas and ignore the presence of other gas that may be harmful to worker’s health
3. In this study authors evaluate E to estimate re-entry time, further research about this topic is still needed
4. Recommendation for advance study about this topic are to conduct further experiments with numerical method to take into account airways variation and consider several curves representing variation of effective coefficient diffusion in each lane.
29
CIN
EST,
KYU
SHU
UN
IVER
SITY
, JA
PAN
20
13
THANK YOU!
30
ARIGATOU GOZAIMASU!
CIN
EST,
KYU
SHU
UN
IVER
SITY
, JA
PAN
20
13