Embed Size (px)
Citation preview
Signature Recognition using Successive Geometric
Centers, Grid and Texture and Soft Biometric Features
Pravin Jangid
Thakur/115
Under Guidance of
Dr. R.R Sedamkar
Thakur College of Engineering and Technology2013-14

2
Outline• Introduction• Literature Survey• Signature Recognition • Pre-processing of Signature• Successive Geometric Centers • Grid & Texture Information Feature Extraction • Results and Discussion• Conclusions and Future Scope• References• Publications
3
Introduction• Biometrics comprises methods for uniquely recognizing
humans based upon one or more intrinsic physical or behavioral traits.
• Biometric characteristics can be divided in two main classes:
• Physiological are related to the shape of the body.
• Behavioral are related to the behavior of a person.
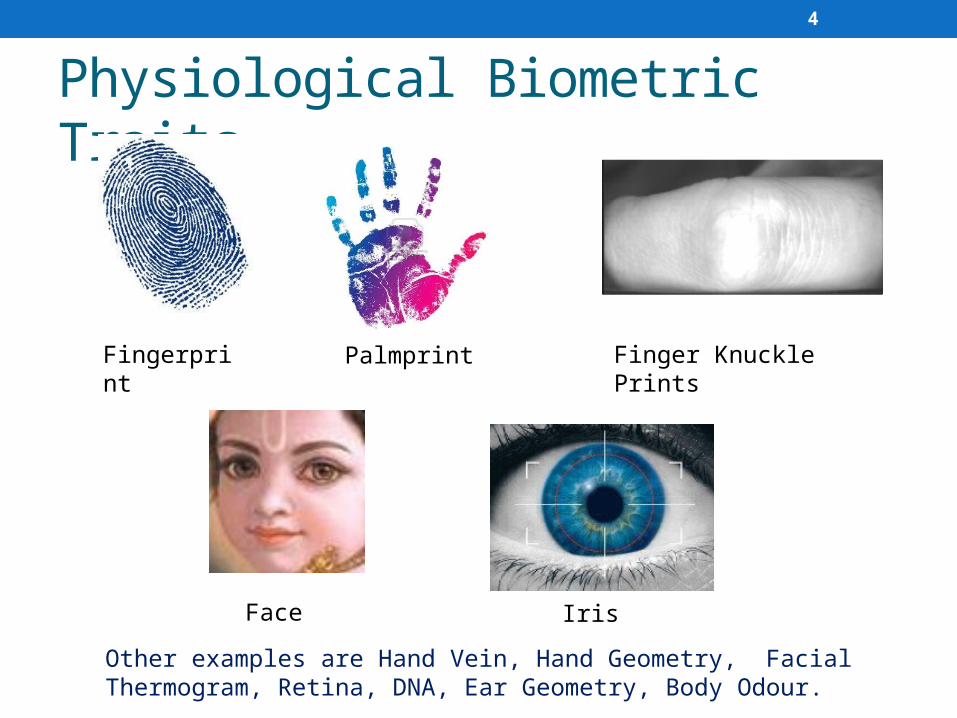
4
Physiological Biometric Traits
Fingerprint Palmprint Finger Knuckle Prints
Face Iris
Other examples are Hand Vein, Hand Geometry, Facial Thermogram, Retina, DNA, Ear Geometry, Body Odour.
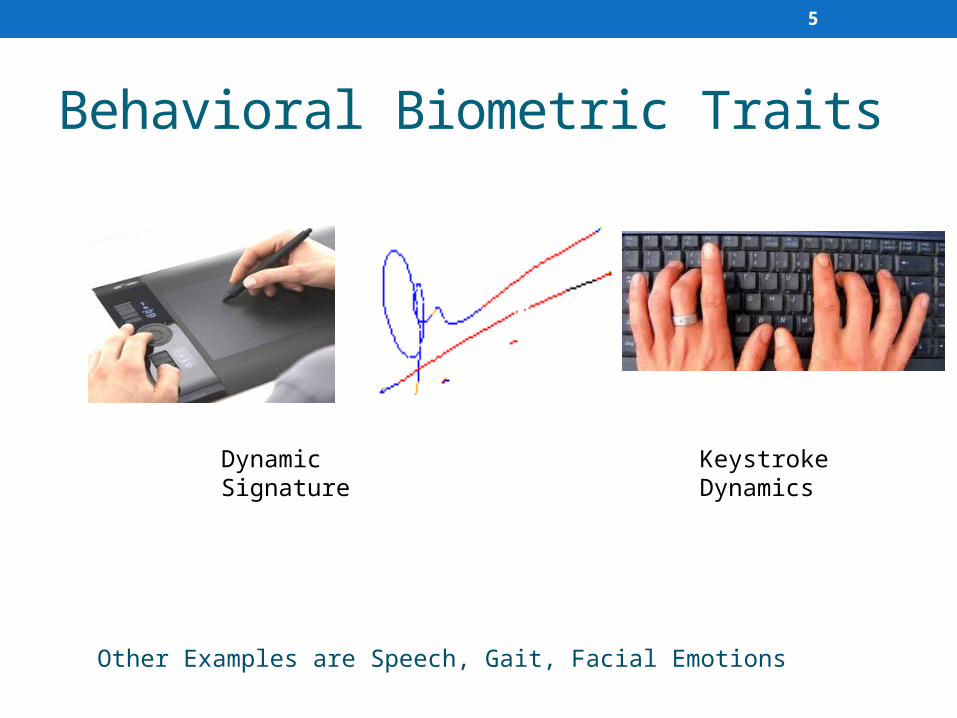
5
Behavioral Biometric Traits
Dynamic Signature Keystroke Dynamics
Other Examples are Speech, Gait, Facial Emotions
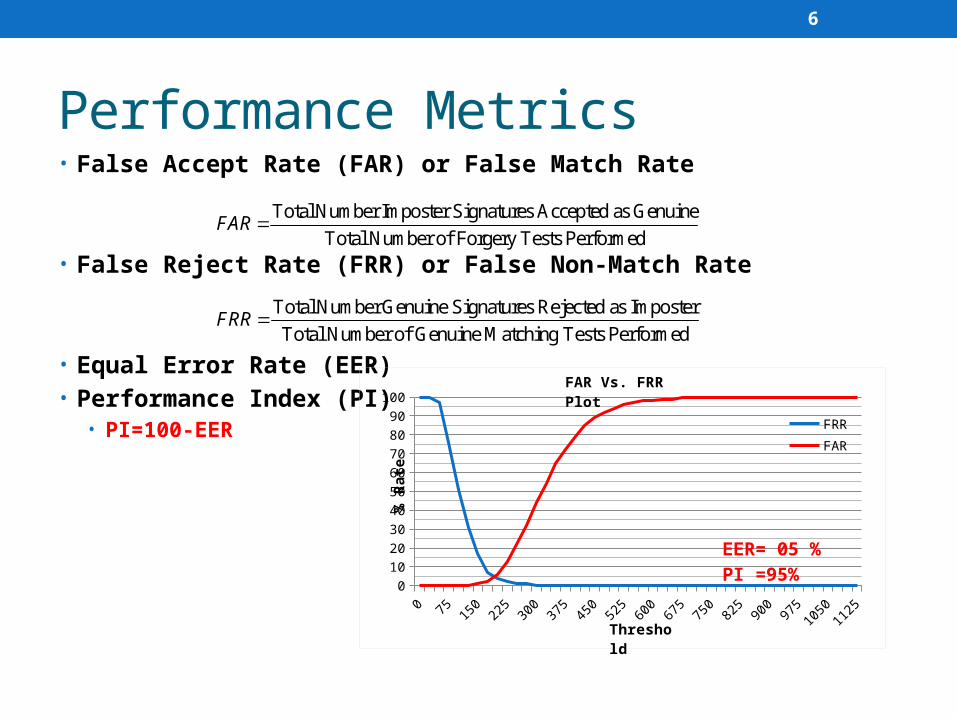
6
Performance Metrics• False Accept Rate (FAR) or False Match Rate
• False Reject Rate (FRR) or False Non-Match Rate
• Equal Error Rate (EER) • Performance Index (PI)
• PI=100-EER
0 75 150
225
300
375
450
525
600
675
750
825
900
975
1050
1125
0
10
20
30
40
50
60
70
80
90
100
FRR
FAR
EER= 05 %PI =95%
Threshold
% R
ate
FAR Vs. FRR Plot
Total Number Imposter Signatures Accepted as Genuine
Total Number of Forgery Tests PerformedFAR
Total Number Genuine Signatures Rejected as Imposter
Total Number of Genuine Matching Tests PerformedFRR
7
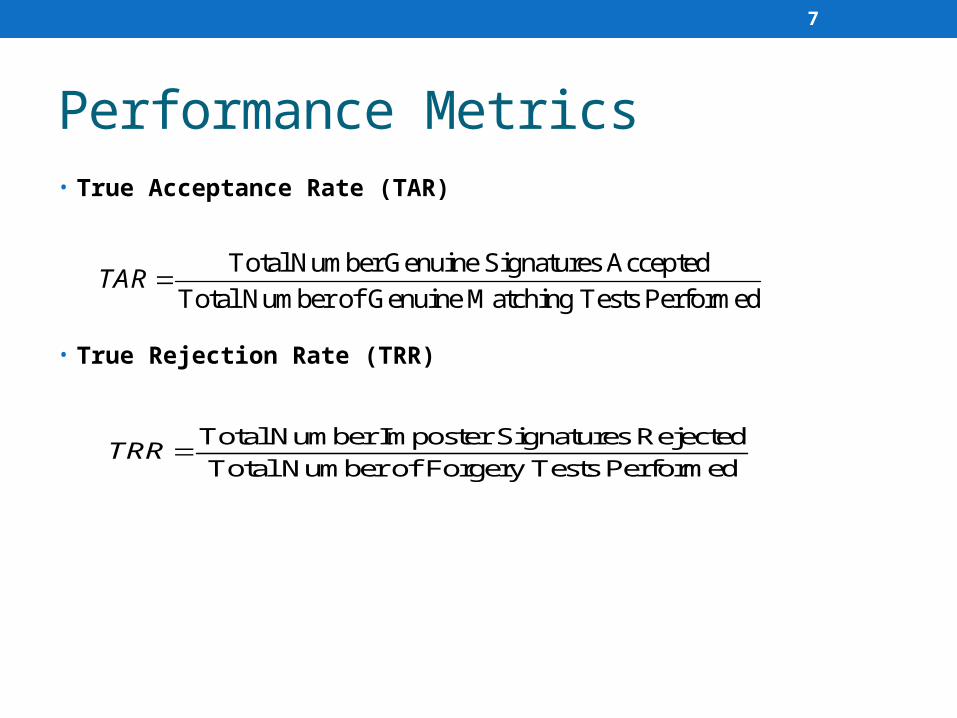
Performance Metrics• True Acceptance Rate (TAR)
• True Rejection Rate (TRR)
Total Number Genuine Signatures Accepted
Total Number of Genuine Matching Tests PerformedTAR
Total Number Imposter Signatures Rejected
Total Number of Forgery Tests PerformedTRR
8
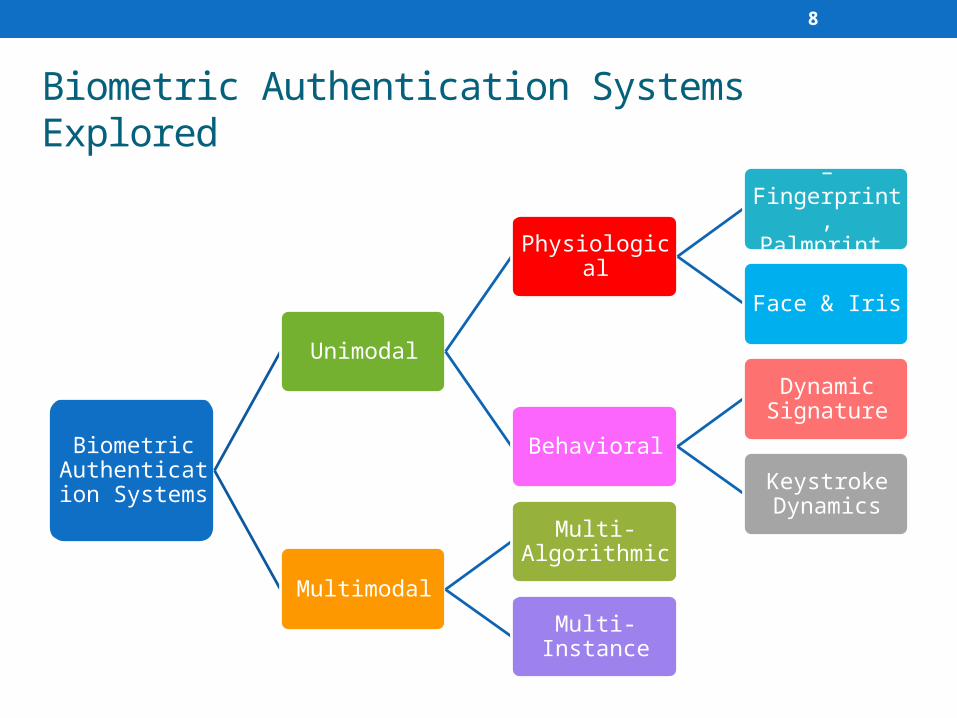
Biometric Authentication Systems Explored
Biometric Authentication
Systems
Unimodal
Physiological
Hand Based – Fingerprint,
Palmprint, FKP
Face & Iris
Behavioral
Dynamic Signature
Keystroke Dynamics
Multimodal
Multi-Algorithmic
Multi- Instance
9
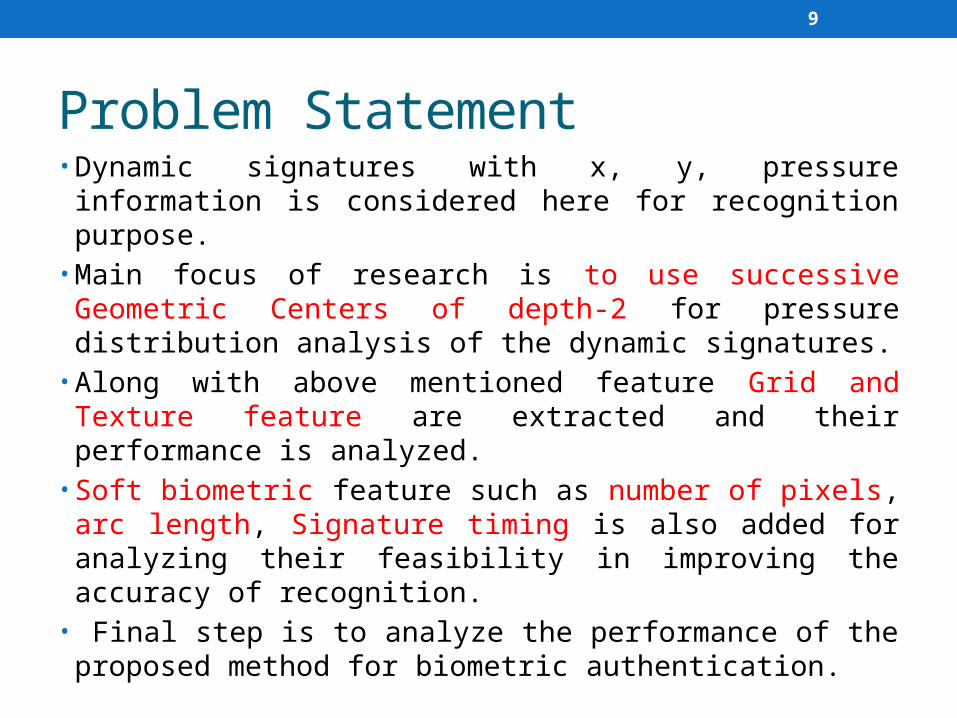
Problem Statement• Dynamic signatures with x, y, pressure information is
considered here for recognition purpose. • Main focus of research is to use successive Geometric
Centers of depth-2 for pressure distribution analysis of the dynamic signatures.
• Along with above mentioned feature Grid and Texture feature are extracted and their performance is analyzed.
• Soft biometric feature such as number of pixels, arc length, Signature timing is also added for analyzing their feasibility in improving the accuracy of recognition.
• Final step is to analyze the performance of the proposed method for biometric authentication.
10
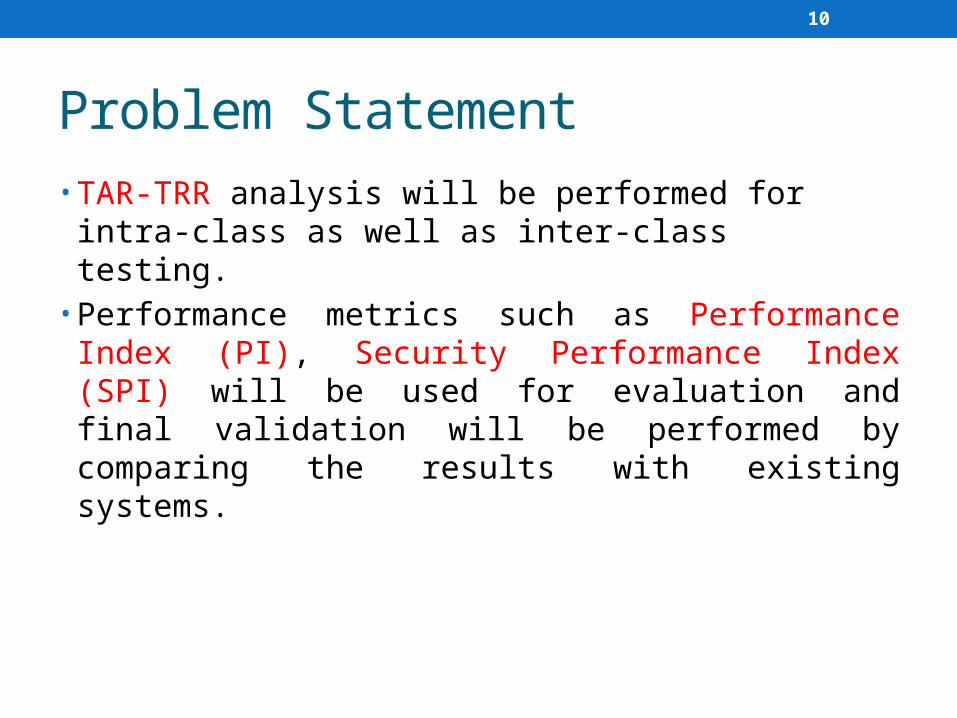
Problem Statement• TAR-TRR analysis will be performed for intra-class as well
as inter-class testing.• Performance metrics such as Performance Index (PI),
Security Performance Index (SPI) will be used for evaluation and final validation will be performed by comparing the results with existing systems.
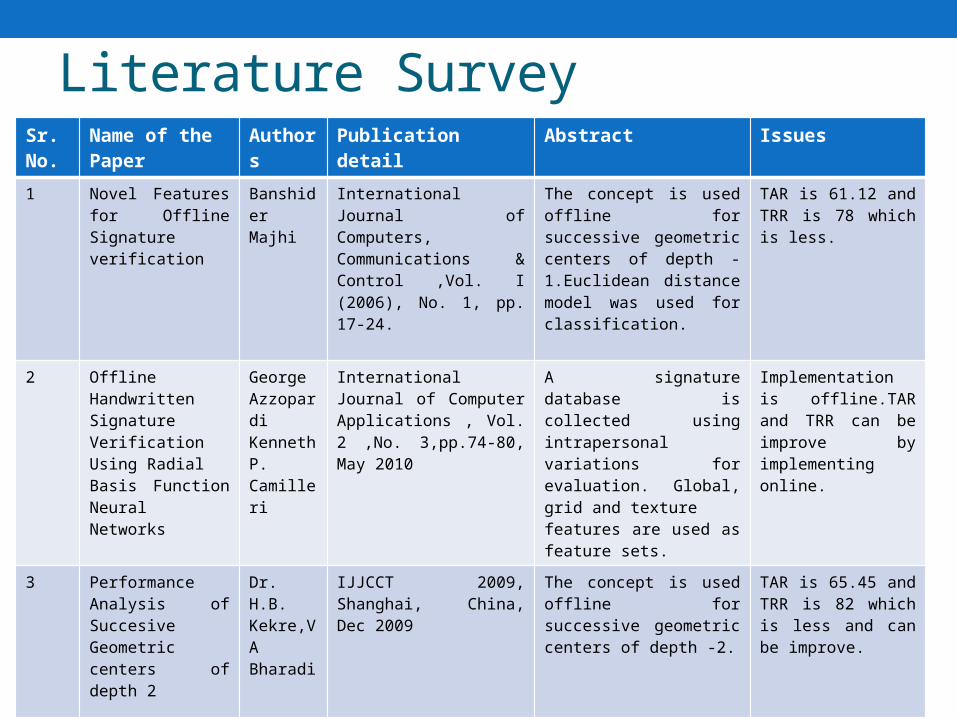
Literature SurveySr. No.
Name of the Paper
Authors Publication detail Abstract Issues
1 Novel Features for Offline Signature verification
Banshider Majhi
International Journal of Computers, Communications & Control ,Vol. I (2006), No. 1, pp. 17-24.
The concept is used offline for successive geometric centers of depth -1.Euclidean distance model was used for classification.
TAR is 61.12 and TRR is 78 which is less.
2 Offline Handwritten Signature Verification Using Radial Basis Function Neural Networks
George Azzopardi Kenneth P. Camilleri
International Journal of Computer Applications , Vol. 2 ,No. 3,pp.74-80, May 2010
A signature database is collected using intrapersonal variations for evaluation. Global, grid and texture features are used as feature sets.
Implementation is offline.TAR and TRR can be improve by implementing online.
3 Performance Analysis of Succesive Geometric centers of depth 2
Dr. H.B. Kekre,V A Bharadi
IJJCCT 2009, Shanghai, China, Dec 2009
The concept is used offline for successive geometric centers of depth -2.
TAR is 65.45 and TRR is 82 which is less and can be improve.
12
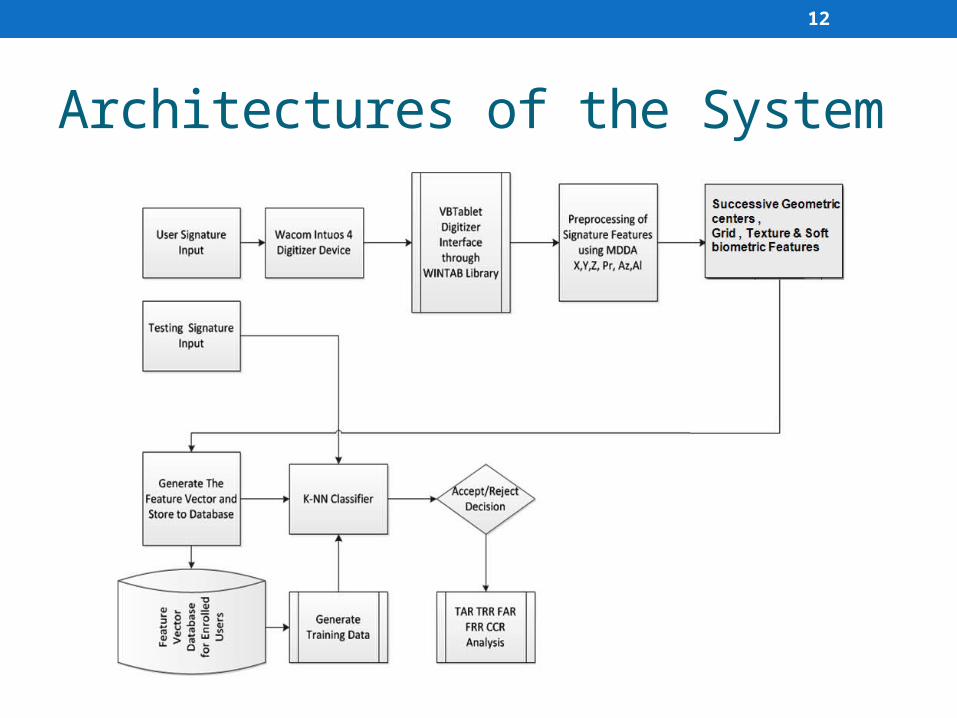
Architectures of the System

13
Signature Recognition• Dynamic Signatures are explored as behavioral
Biometrics• Digitizer Tablet is used for capturing dynamic signatures.
Digitizer Tablet for Online Signature Scan
Feature Plot for Multidimensional features X,Y,Z Co-ordinates, Pressure Azimuth & Altitude parameter
Signature Samples of a Person (a) Static Scanned Signature, (b) Dynamic Signature Scanned by Wacom Intuos Pressure Levels for the Dynamic Signatures Shown
(a) (b)
14
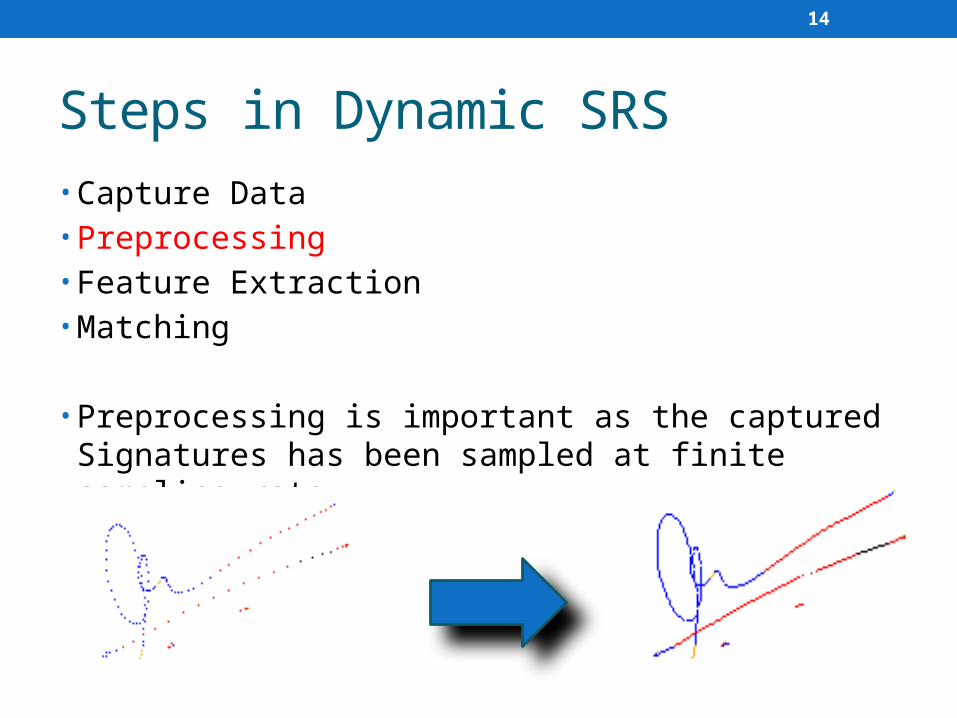
Steps in Dynamic SRS• Capture Data • Preprocessing• Feature Extraction • Matching
• Preprocessing is important as the captured Signatures has been sampled at finite sampling rate
15
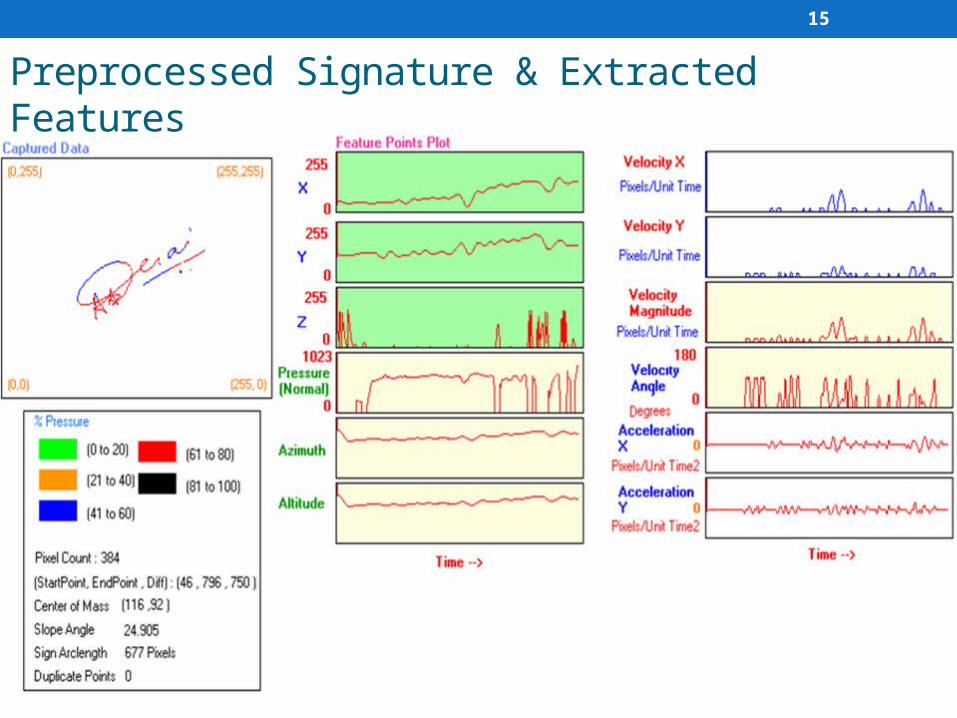
Preprocessed Signature & Extracted Features
16
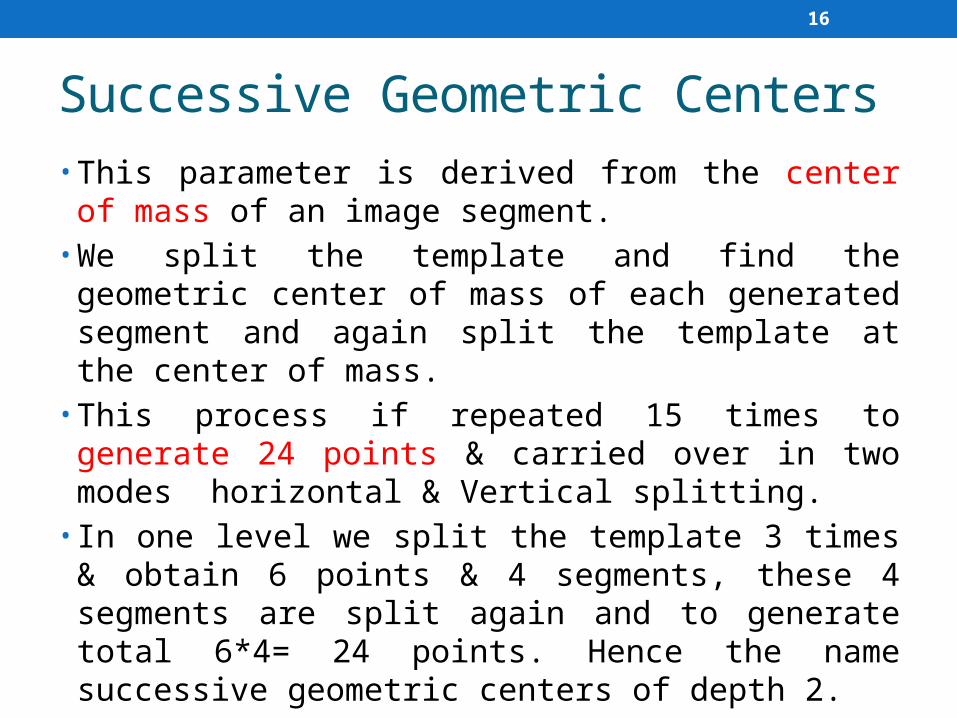
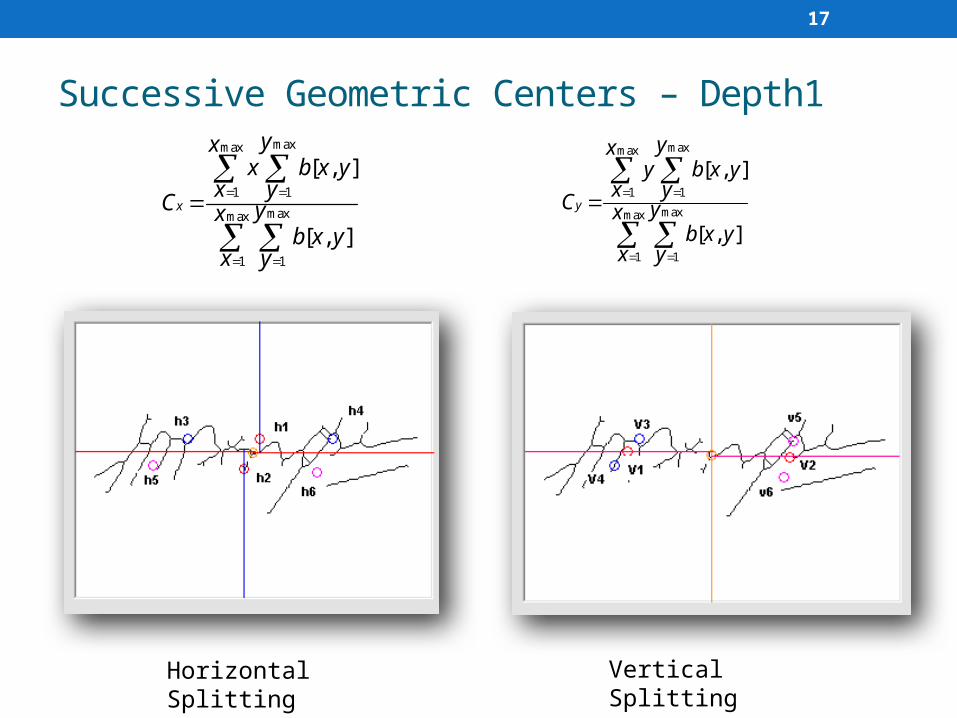
Successive Geometric Centers • This parameter is derived from the center of mass of an
image segment.• We split the template and find the geometric center of
mass of each generated segment and again split the template at the center of mass.
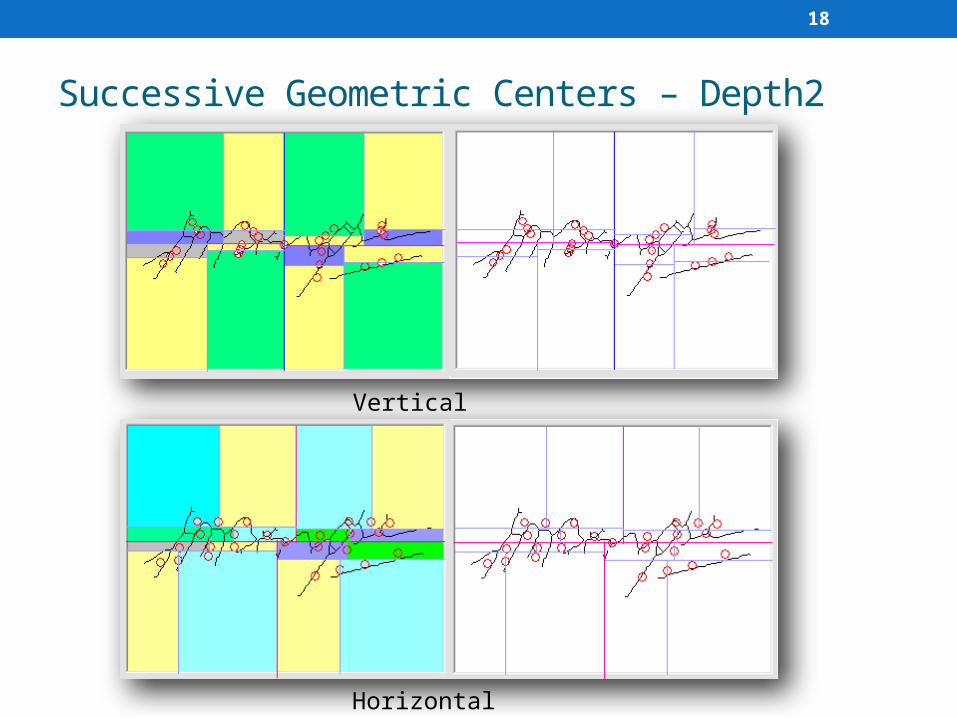
• This process if repeated 15 times to generate 24 points & carried over in two modes horizontal & Vertical splitting.
• In one level we split the template 3 times & obtain 6 points & 4 segments, these 4 segments are split again and to generate total 6*4= 24 points. Hence the name successive geometric centers of depth 2.
17
Successive Geometric Centers – Depth1
Horizontal Splitting Vertical Splitting
maxmax
1 1
maxmax
1 1
[ , ]
[ , ]
x
yxx b x y
x yC yx
b x yx y
maxmax
1 1
maxmax
1 1
[ , ]
[ , ]
y
yxy b x y
x yC yx
b x yx y
18
Successive Geometric Centers – Depth2
Vertical Splitting
Horizontal Splitting
19
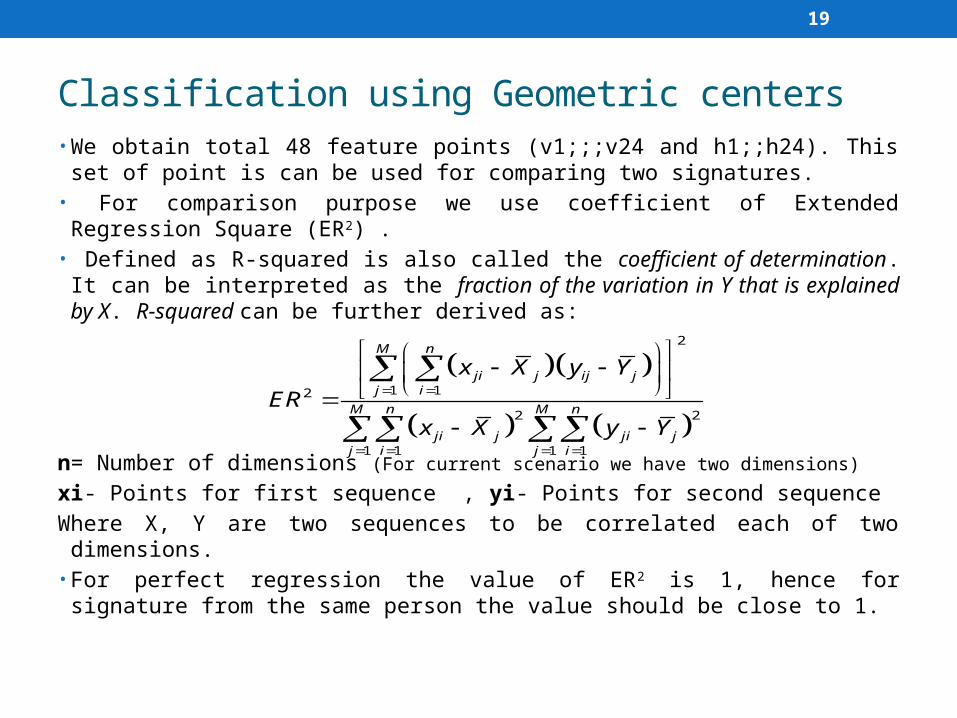
Classification using Geometric centers• We obtain total 48 feature points (v1;;;v24 and h1;;h24). This set of point
is can be used for comparing two signatures.• For comparison purpose we use coefficient of Extended Regression
Square (ER2) .• Defined as R-squared is also called the coefficient of determination. It
can be interpreted as the fraction of the variation in Y that is explained by X. R-squared can be further derived as:
n= Number of dimensions (For current scenario we have two dimensions)
xi- Points for first sequence , yi- Points for second sequence
Where X, Y are two sequences to be correlated each of two dimensions.• For perfect regression the value of ER2 is 1, hence for signature from the
same person the value should be close to 1.
2
1 12
2 2
1 1 1 1
M n
ji j ij jj i
M n M n
ji j ji jj i j i
x X y Y
ERx X y Y
20
Grid & Texture Information Features• Grid and texture feature provide information about the
distribution of pixels and the distribution density of the pixels
• Grid feature provides information about pixel density
• Texture feature provide information about the occurrence of specific pattern in the signature template
• These features are not based on single pixel or whole signature but they are based on group of pixels or signature segments, hence these are cluster features

21
Grid Information FeatureAlgorithm for grid feature extraction from signature template of size
256*256 pixels
1. Divide the skeletonized image into 10 X 10 Pixels blocks.
2. For each block segment, calculate the area (sum of pressure pixels). This gives a grid feature matrix (gf) of size 25 X 25
3. Find minimum and maximum (min, max) values for pixels block. Ignore blocks with no pixels.
4. Normalize the grid feature matrix by replacing each nonzero element ‘e i j’ by
This gives matrix with all elements within the range of 0 and 1.
5. The resulting 625 elements of the matrix (gf) form the grid feature vector
( min)
max min
ijij
eg
22
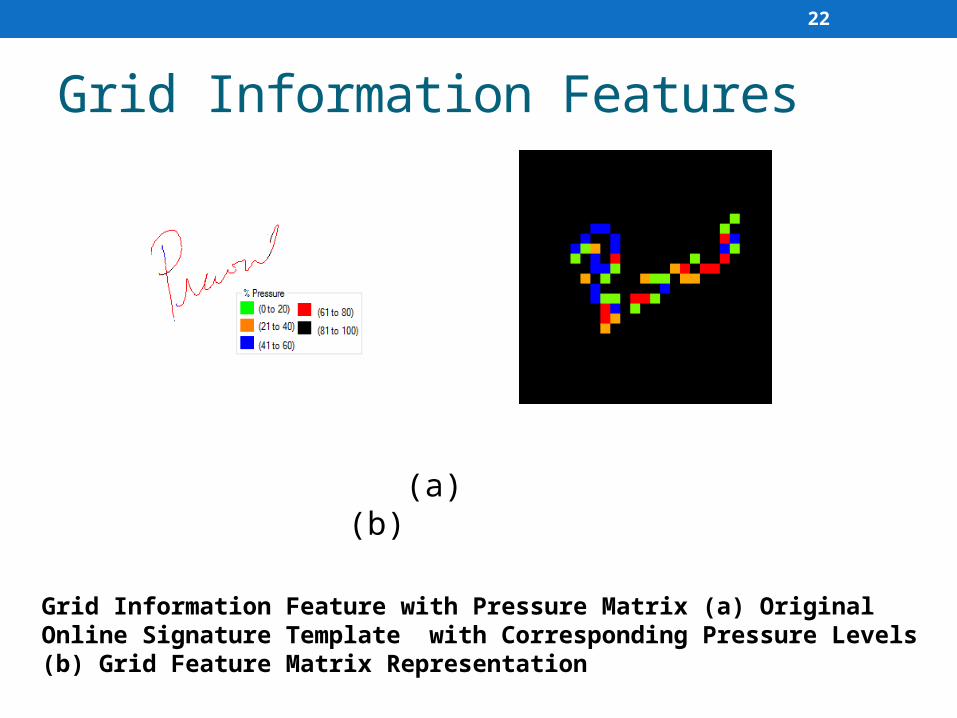
Grid Information Features
(a) (b)
Grid Information Feature with Pressure Matrix (a) Original Online Signature Template with Corresponding Pressure Levels (b) Grid Feature Matrix Representation
23
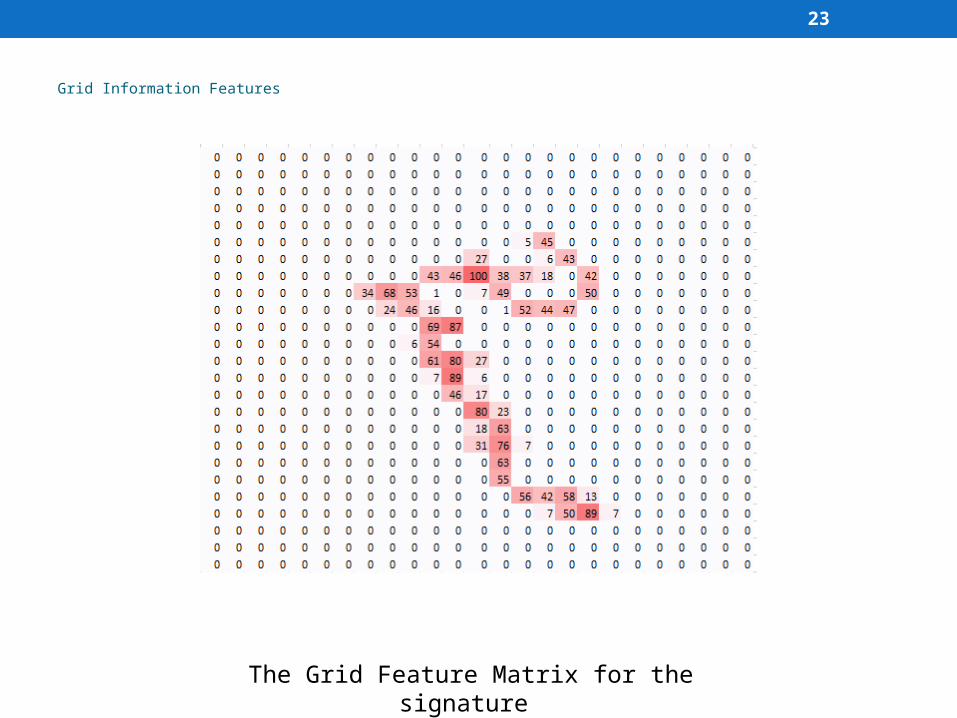
Grid Information Features
The Grid Feature Matrix for the signature
24
Texture Feature• Texture feature [12] gives information about occurrence of
specific pen tip pressure pattern while signing.• Originally it is proposed for a pair of pixel values , here it
is extended to pressure values.• The five different pressure levels are R1 = (0-20), R2 =
(21-40), R3 = (41-60), R4 = (61-80) and R5 = (81-100)• The signature template is first scanned and divided in to 5
different sub-templates.• Each template has signature points having pressure
levels given by one of the five ranges R1 to R5.
25
Texture Feature• Each sub template can be treated as a simple template
with signature points as black and background as white level.
• To extract the texture feature group, the co-occurrence matrices of the sub-template are used.
• In a sub- template, the co-occurrence matrix C [i, j] is defined by first specifying a displacement vector d = (dx, dy) and counting all pairs of pixels separated by d and having pressure level values Pi and Pj.
• In current case, the signature image is binary and therefore the co-occurrence matrix is a 2 X 2 matrix describing the transition of black (Pressure Pi) and white (Pressure Pj) pixels.
26
Texture Feature• Therefore, the co-occurrence matrix C [i, j] is defined as• Where c00 is the number of times that two white pixels
occurs, separated by d. c01 is the number of times that a combination of a white and a black pixel occurs, separated by d. c10 is the same as c01. The element c11 is the number of times that two black pixels occur, separated by d.
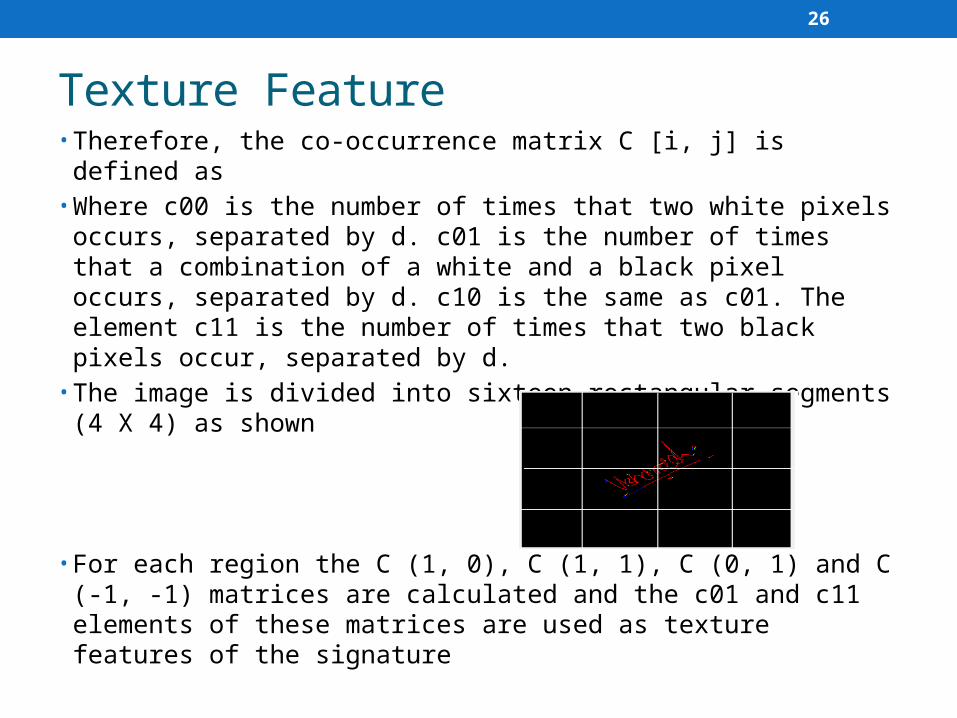
• The image is divided into sixteen rectangular segments (4 X 4) as shown
• For each region the C (1, 0), C (1, 1), C (0, 1) and C (-1, -1) matrices are calculated and the c01 and c11 elements of these matrices are used as texture features of the signature
27
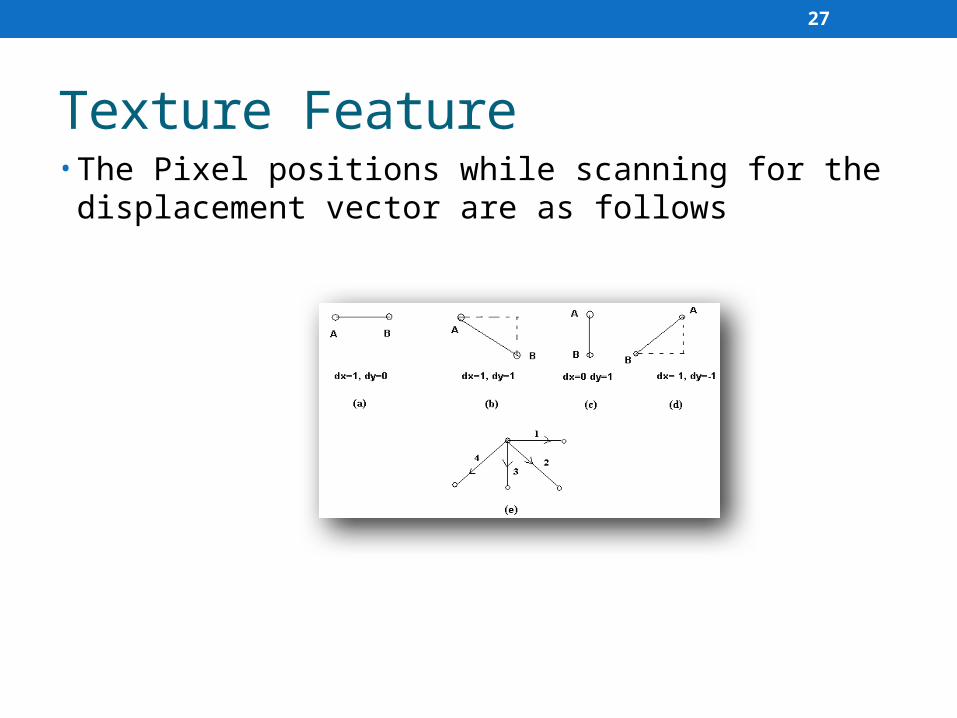
Texture Feature• The Pixel positions while scanning for the displacement
vector are as follows
28
Algorithm for texture feature extraction
1. Scan the signature pressure template, Divide the template into five sub-template with pressure level range R1 = (0- 20), R2 = (21-40), R3 = (41-60), R4 = (61-80) and R5 = (81-100). Start with Template R1.
2. Define the displacement vector. d= (dx, dy).
3. Start scanning the signature sub-template segments 1 to segment 16.
4. Find the occurrence of pixel sets c00, c01, c10 & c11 for the displacement vector dx, dy for the segments defined in step 3. Where 0 indicates pressure level P1 and 1 indicates Pressure Level P2
29
Algorithm for texture feature extraction
5. Repeat the procedure for all the 16 segments, and all pressure ranges. Store the values in specific memory structure.
6. When all the segments are scanned, select other displacement vector and repeat steps 3 to 5. This is repeated for all four displacement vectors (1,0),(1,1),(0,1),(-1,-1).
7. Select element c01 and c11 of the following matrix for each displacement vector.
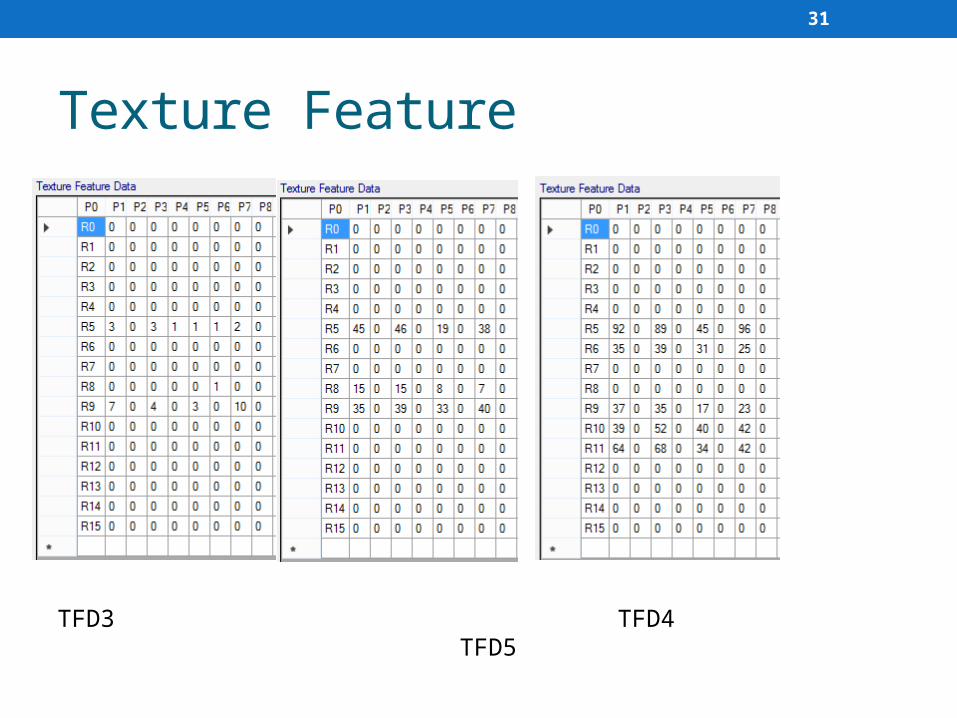
8. This procedure gives total 128 X 5 = 320 elements as follows (16 segments X 4 matrices X 2 elements per matrix X 5 Ranges). This forms the texture feature vector. Fig. shows TFD 1 to TFD 5 for the signature shown in Fig. 2. These matrices are used as feature vector and signatures are matched using them. Euclidean distance based matching is done.
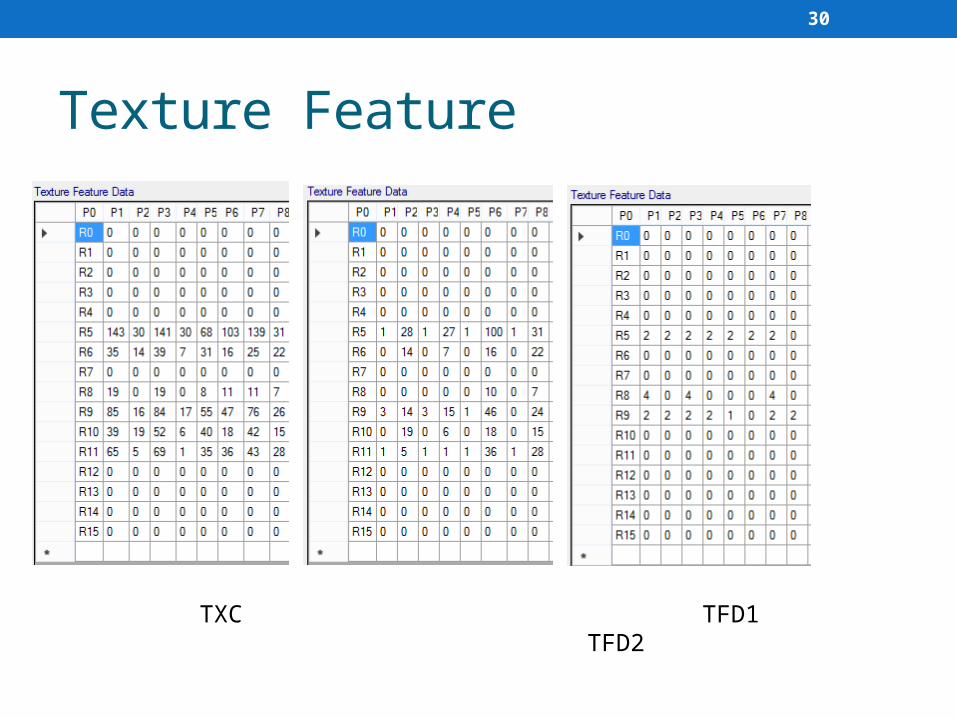
30
Texture Feature
TXC TFD1 TFD2
31
Texture Feature
TFD3 TFD4 TFD5
32
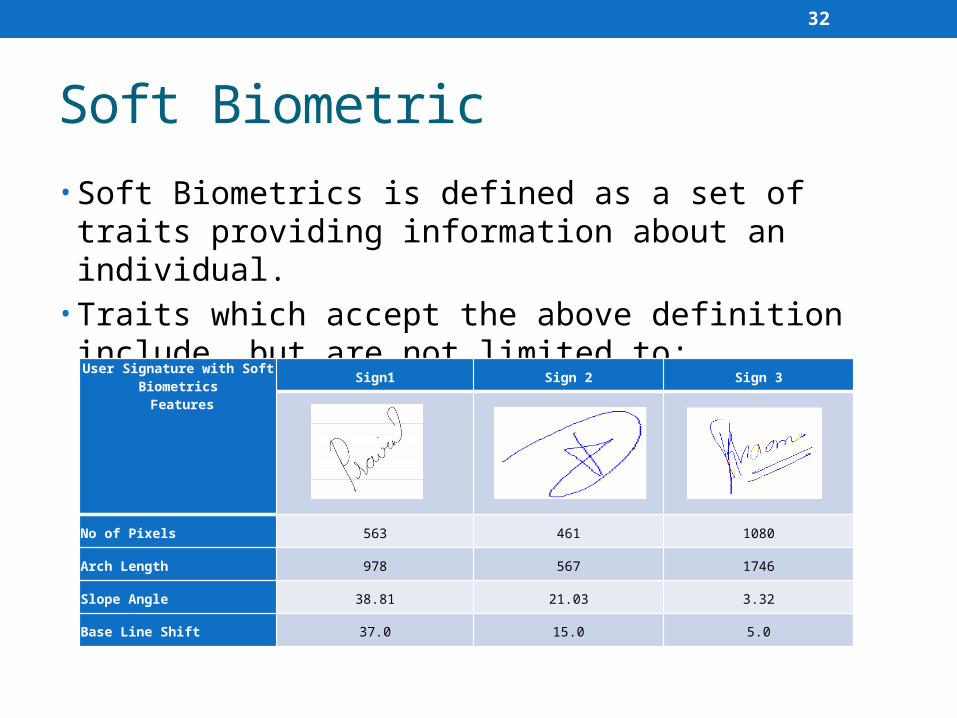
Soft Biometric
• Soft Biometrics is defined as a set of traits providing information about an individual.
• Traits which accept the above definition include, but are not limited to:
User Signature with Soft Biometrics Features
Sign1 Sign 2 Sign 3
No of Pixels 563 461 1080
Arch Length 978 567 1746
Slope Angle 38.81 21.03 3.32
Base Line Shift 37.0 15.0 5.0
33
Soft Biometric
• Physical: skin colour, eye colour, hair colour, and presence of beard, presence of moustache, height, and weight.
• Behavioral: gait, keystroke, Signature length, pixel counts etc.
• Adhered human characteristics: clothes colour, tattoos, accessories.
34
Enrollment & Training • Signature Recognition is a two class pattern recognition.
Signature is to be classified as genuine or forgery.
• Total 108 signatures
• Goal is to calculate decision thresholds based on the intra-class variation
• We use Euclidian Distance Model for classification.
35
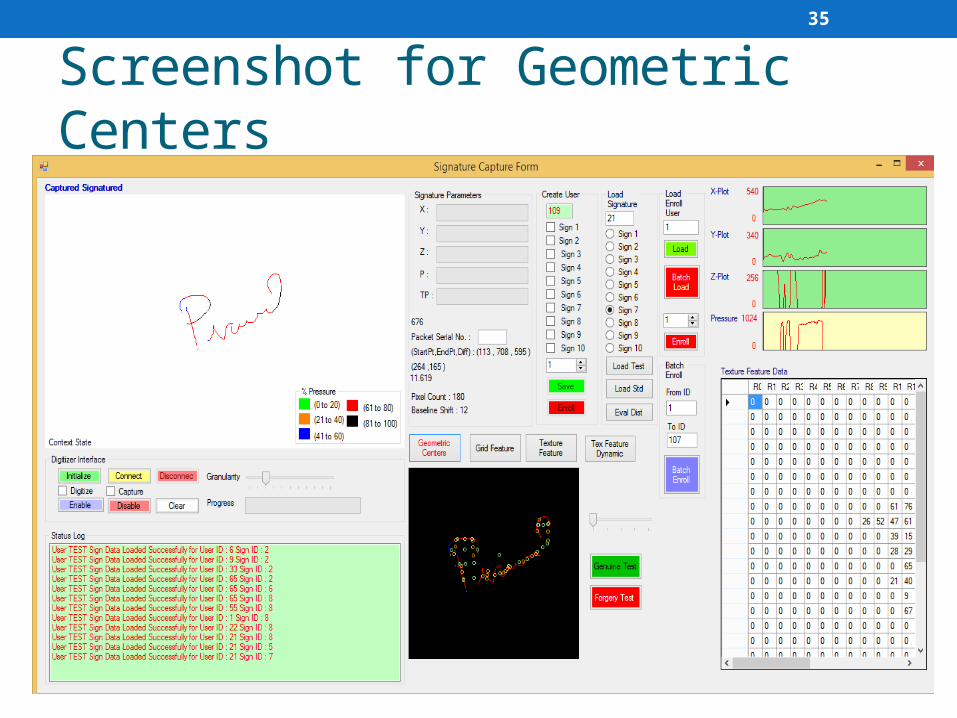
Screenshot for Geometric Centers
36
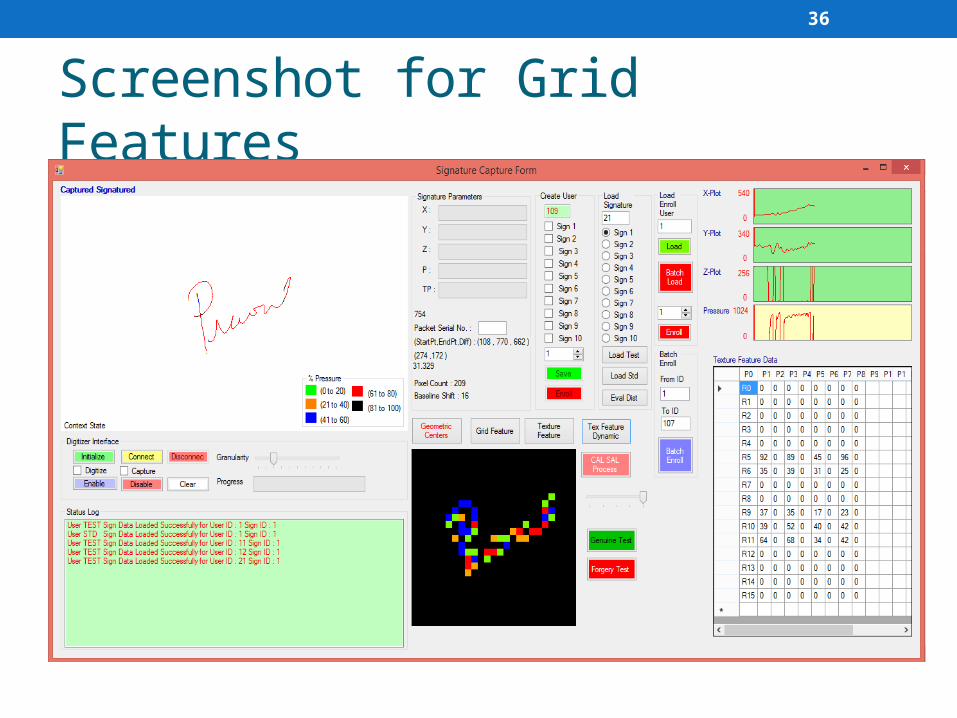
Screenshot for Grid Features
37
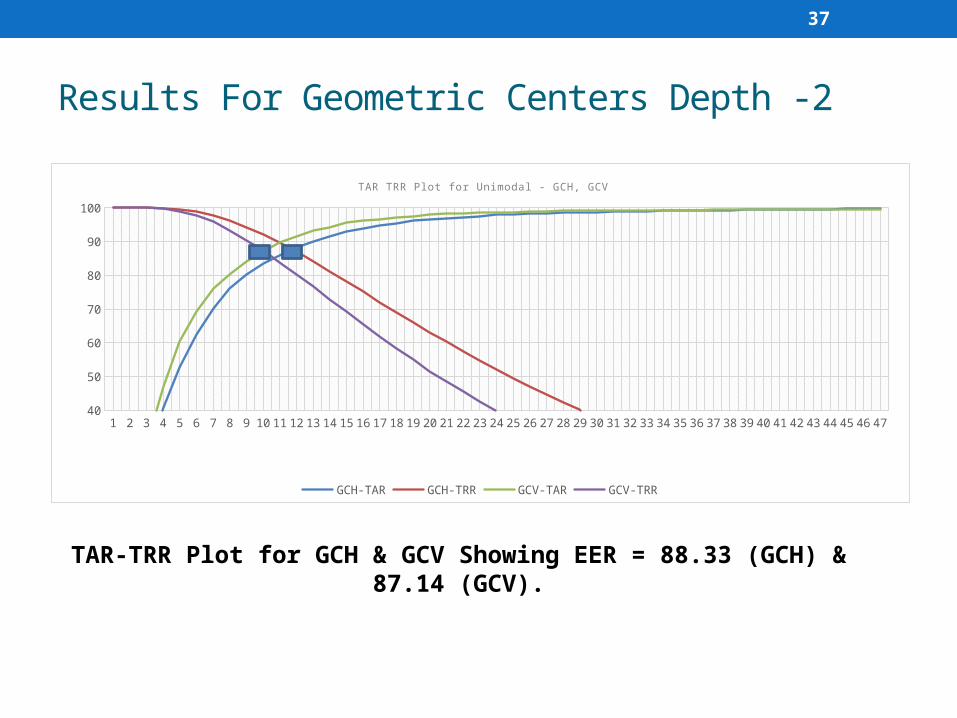
Results For Geometric Centers Depth -2
1 2 3 4 5 6 7 8 9 10 11 12 13 14 15 16 17 18 19 20 21 22 23 24 25 26 27 28 29 30 31 32 33 34 35 36 37 38 39 40 41 42 43 44 45 46 4740
50
60
70
80
90
100
TAR TRR Plot for Unimodal - GCH, GCV
GCH-TAR GCH-TRR GCV-TAR GCV-TRR
TAR-TRR Plot for GCH & GCV Showing EER = 88.33 (GCH) & 87.14 (GCV).
38
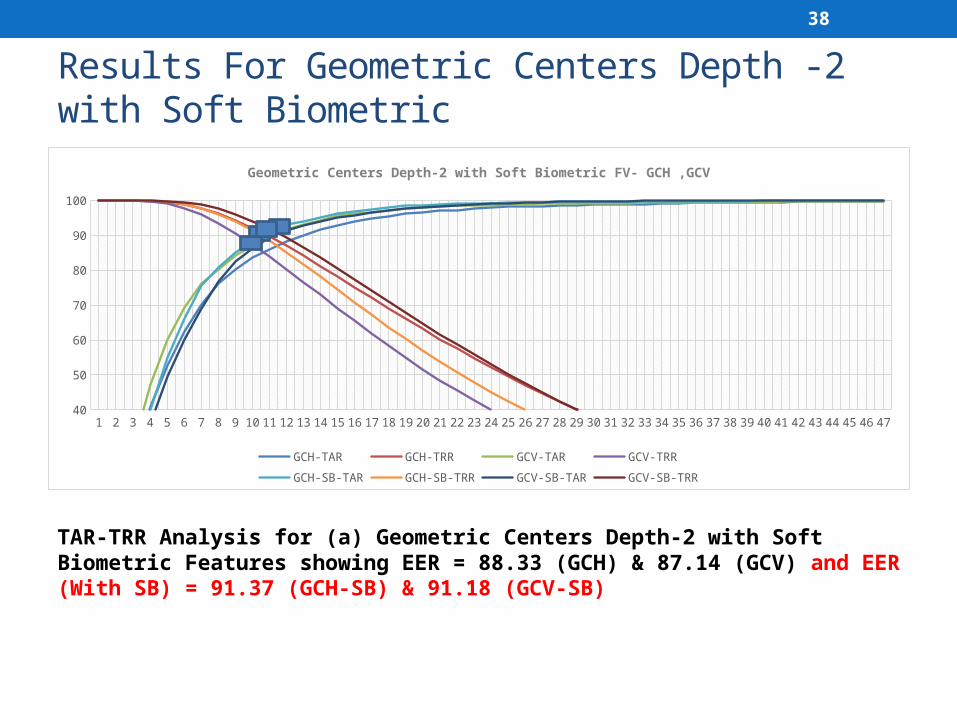
Results For Geometric Centers Depth -2 with Soft Biometric
1 2 3 4 5 6 7 8 9 10 11 12 13 14 15 16 17 18 19 20 21 22 23 24 25 26 27 28 29 30 31 32 33 34 35 36 37 38 39 40 41 42 43 44 45 46 4740
50
60
70
80
90
100
Geometric Centers Depth-2 with Soft Biometric FV- GCH ,GCV
GCH-TAR GCH-TRR GCV-TAR GCV-TRR
GCH-SB-TAR GCH-SB-TRR GCV-SB-TAR GCV-SB-TRR
TAR-TRR Analysis for (a) Geometric Centers Depth-2 with Soft Biometric Features showing EER = 88.33 (GCH) & 87.14 (GCV) and EER (With SB) = 91.37 (GCH-SB) & 91.18 (GCV-SB)
39
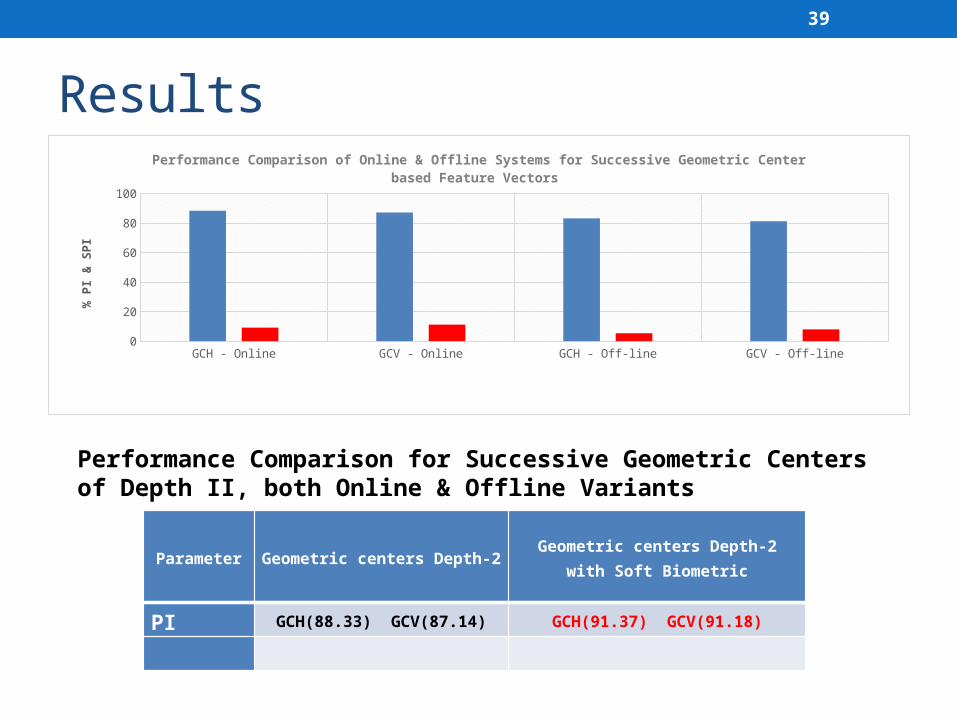
Results
GCH - Online GCV - Online GCH - Off-line GCV - Off-line
PI 88.33 87.14 83.14 81.22
SPI 9.1 11.11 5.29 7.9
5152535455565758595
Performance Comparison of Online & Offline Systems for Successive Geometric Center based Feature Vectors
% P
I & S
PI
Performance Comparison for Successive Geometric Centers of Depth II, both Online & Offline Variants
Parameter Geometric centers Depth-2Geometric centers Depth-2 with Soft
Biometric
PI GCH(88.33) GCV(87.14) GCH(91.37) GCV(91.18)
40
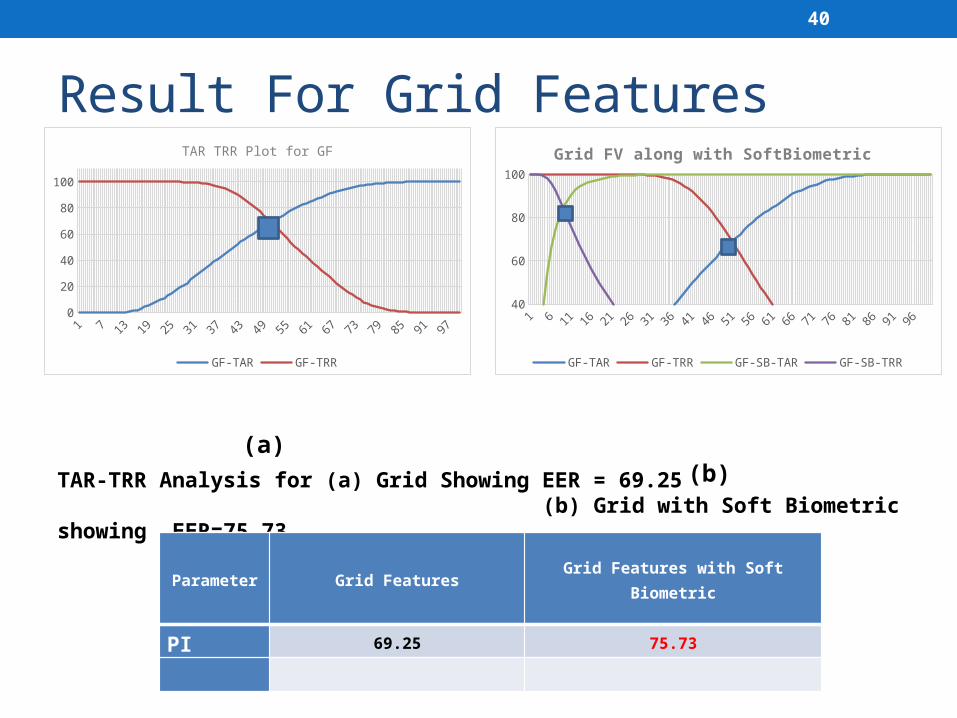
Result For Grid Features
1 6 11 16 21 26 31 36 41 46 51 56 61 66 71 76 81 86 91 9640
60
80
100
Grid FV along with SoftBiometric
GF-TAR GF-TRR GF-SB-TAR GF-SB-TRR
(a) (b)
TAR-TRR Analysis for (a) Grid Showing EER = 69.25 (b) Grid with Soft Biometric showing EER=75.73
Parameter Grid Features Grid Features with Soft Biometric
PI 69.25 75.73
1 7 13 19 25 31 37 43 49 55 61 67 73 79 85 91 970
20
40
60
80
100
TAR TRR Plot for GF
GF-TAR GF-TRR

41
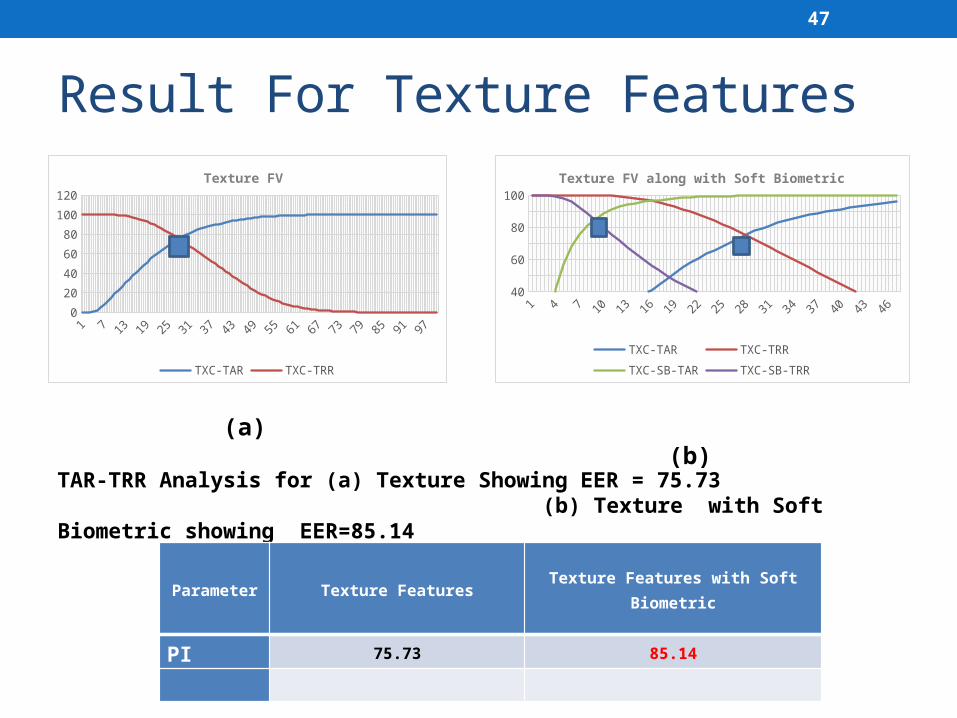
Result For Texture Features
1 7 13 19 25 31 37 43 49 55 61 67 73 79 85 91 970
20
40
60
80
100
120
Texture FV
TXC-TAR TXC-TRR
1 4 7 10 13 16 19 22 25 28 31 34 37 40 43 4640
50
60
70
80
90
100
Texture FV along with Soft Biometric
TXC-TAR TXC-TRR
TXC-SB-TAR TXC-SB-TRR
(a) (b)
TAR-TRR Analysis for (a) Texture Showing EER = 75.73 (b) Texture with Soft Biometric showing EER=85.14
Parameter Texture Features Texture Features with Soft Biometric
PI 75.73 85.14
42
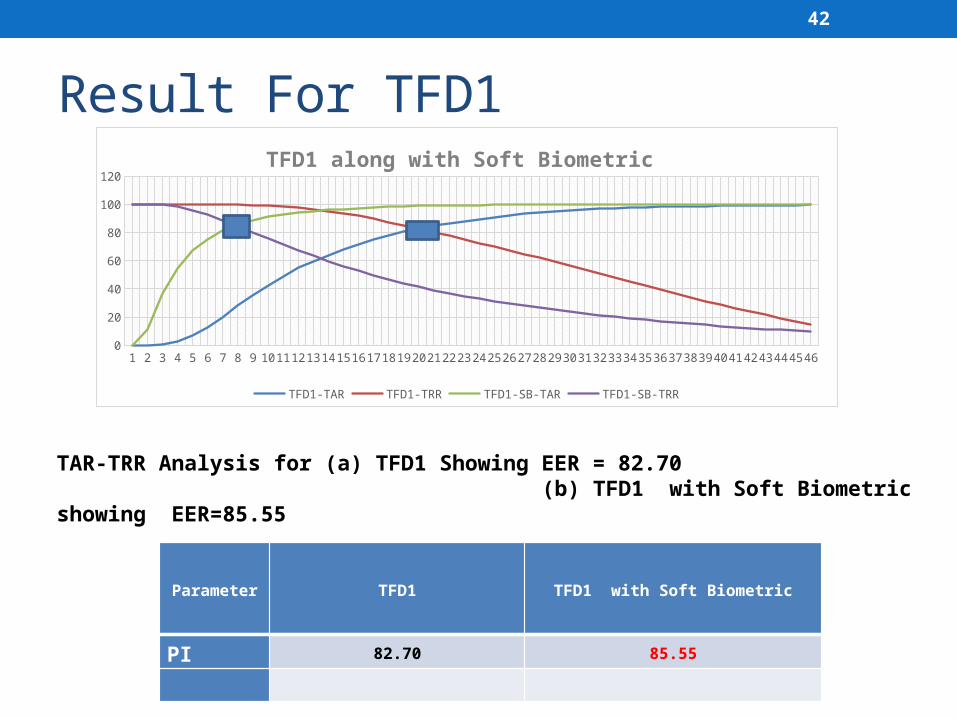
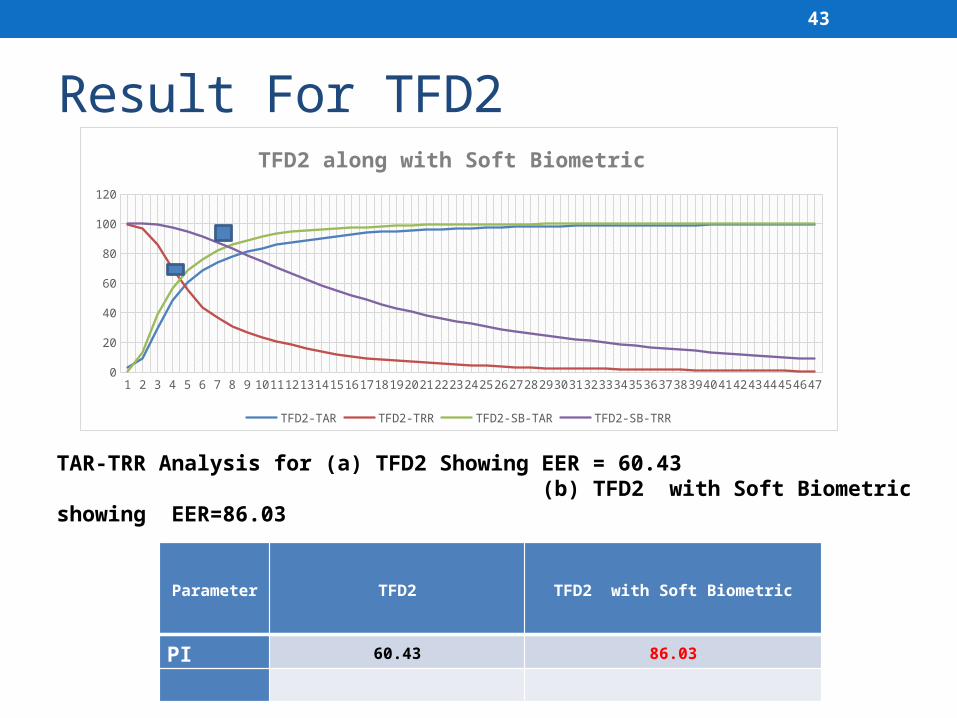
Result For TFD1
TAR-TRR Analysis for (a) TFD1 Showing EER = 82.70 (b) TFD1 with Soft Biometric showing EER=85.55
Parameter TFD1 TFD1 with Soft Biometric
PI 82.70 85.55
1 2 3 4 5 6 7 8 9 101112131415161718192021222324252627282930313233343536373839404142434445460
20
40
60
80
100
120TFD1 along with Soft Biometric
TFD1-TAR TFD1-TRR TFD1-SB-TAR TFD1-SB-TRR
43
Result For TFD2
TAR-TRR Analysis for (a) TFD2 Showing EER = 60.43 (b) TFD2 with Soft Biometric showing EER=86.03
Parameter TFD2 TFD2 with Soft Biometric
PI 60.43 86.03
1 2 3 4 5 6 7 8 9 101112131415161718192021222324252627282930313233343536373839404142434445460
20
40
60
80
100
120TFD2 along with Soft Biometric
TFD1-TAR TFD1-TRR TFD1-SB-TAR TFD1-SB-TRR1 2 3 4 5 6 7 8 9 1011121314151617181920212223242526272829303132333435363738394041424344454647
0
20
40
60
80
100
120
TFD2 along with Soft Biometric
TFD2-TAR TFD2-TRR TFD2-SB-TAR TFD2-SB-TRR
44
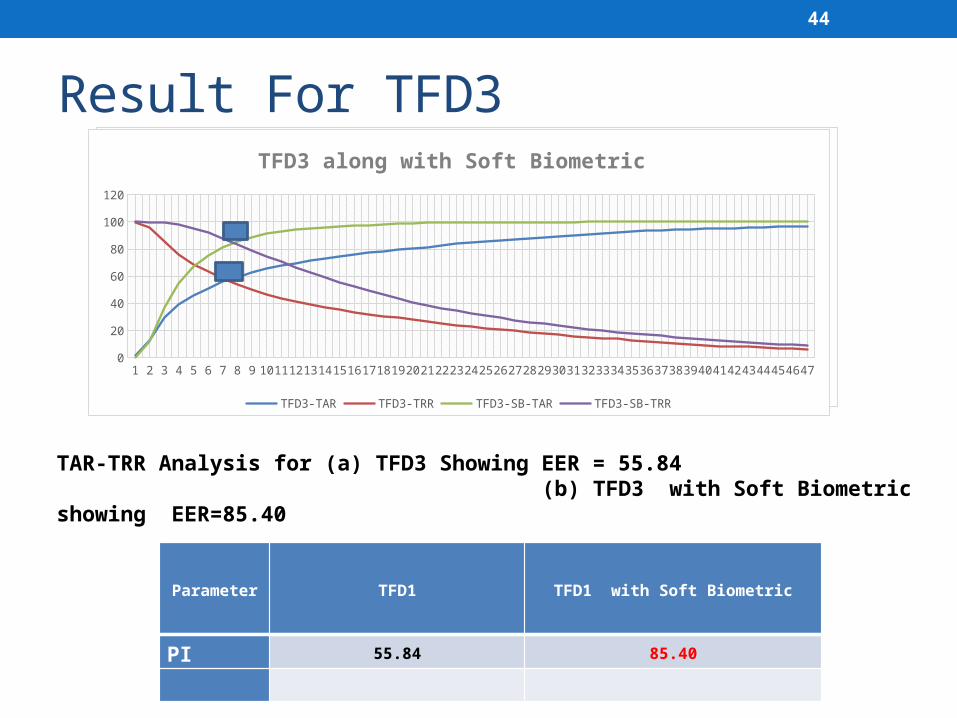
Result For TFD3
TAR-TRR Analysis for (a) TFD3 Showing EER = 55.84 (b) TFD3 with Soft Biometric showing EER=85.40
Parameter TFD1 TFD1 with Soft Biometric
PI 55.84 85.40
1 2 3 4 5 6 7 8 9 101112131415161718192021222324252627282930313233343536373839404142434445460
20
40
60
80
100
120TFD3 along with Soft Biometric
TFD1-TAR TFD1-TRR TFD1-SB-TAR TFD1-SB-TRR
1 2 3 4 5 6 7 8 9 10111213141516171819202122232425262728293031323334353637383940414243444546470
20
40
60
80
100
120
TFD3 along with Soft Biometric
TFD3-TAR TFD3-TRR TFD3-SB-TAR TFD3-SB-TRR
45
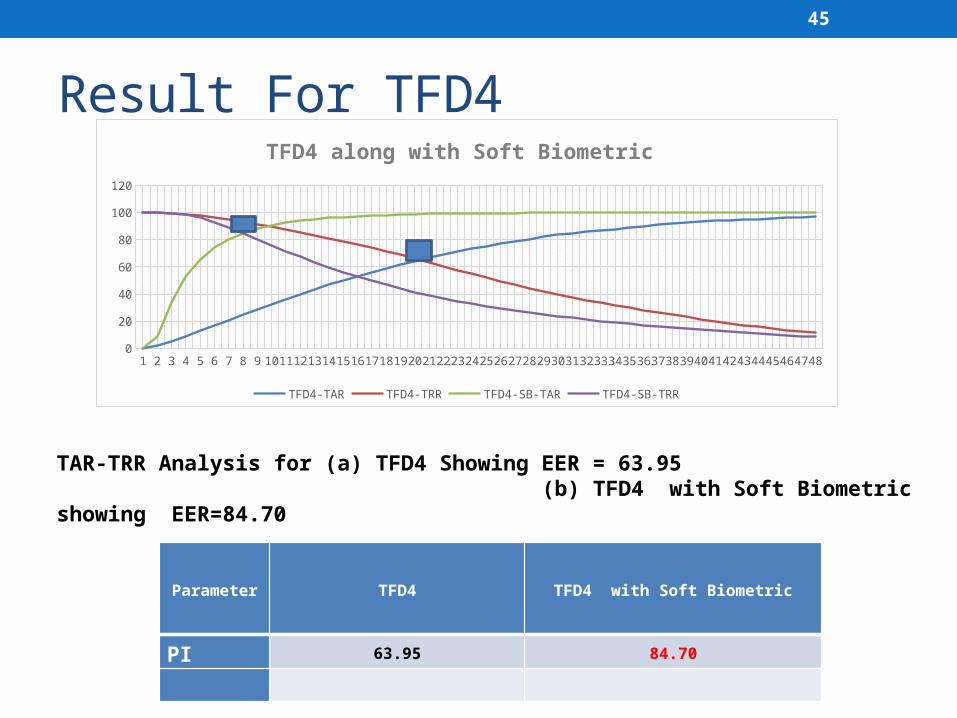
Result For TFD4
TAR-TRR Analysis for (a) TFD4 Showing EER = 63.95 (b) TFD4 with Soft Biometric showing EER=84.70
Parameter TFD4 TFD4 with Soft Biometric
PI 63.95 84.70
1 2 3 4 5 6 7 8 9 101112131415161718192021222324252627282930313233343536373839404142434445460
20
40
60
80
100
120TFD4 along with Soft Biometric
TFD1-TAR TFD1-TRR TFD1-SB-TAR
1 2 3 4 5 6 7 8 9 1011121314151617181920212223242526272829303132333435363738394041424344454647480
20
40
60
80
100
120
TFD4 along with Soft Biometric
TFD4-TAR TFD4-TRR TFD4-SB-TAR TFD4-SB-TRR
46
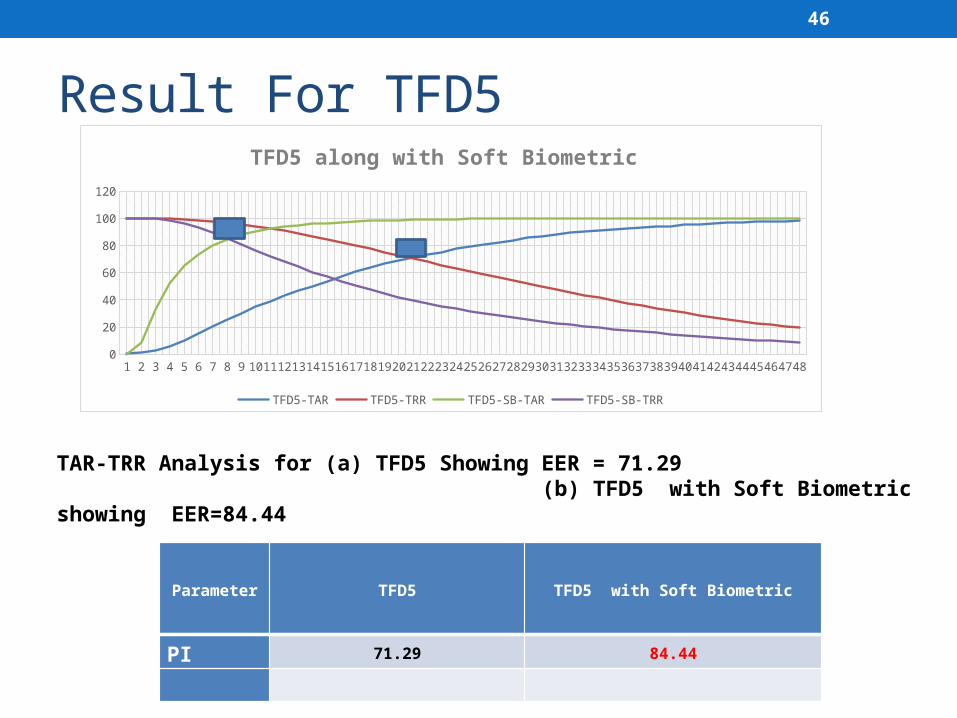
Result For TFD5
TAR-TRR Analysis for (a) TFD5 Showing EER = 71.29 (b) TFD5 with Soft Biometric showing EER=84.44
Parameter TFD5 TFD5 with Soft Biometric
PI 71.29 84.44
0
20
40
60
80
100
120TFD5 along with Soft Biometric
TFD1-TAR TFD1-TRR
TFD1-SB-TAR TFD1-SB-TRR
1 2 3 4 5 6 7 8 9 1011121314151617181920212223242526272829303132333435363738394041424344454647480
20
40
60
80
100
120
TFD5 along with Soft Biometric
TFD5-TAR TFD5-TRR TFD5-SB-TAR TFD5-SB-TRR
47
Result For Texture Features
1 7 13 19 25 31 37 43 49 55 61 67 73 79 85 91 970
20
40
60
80
100
120
Texture FV
TXC-TAR TXC-TRR
1 4 7 10 13 16 19 22 25 28 31 34 37 40 43 4640
50
60
70
80
90
100
Texture FV along with Soft Biometric
TXC-TAR TXC-TRR
TXC-SB-TAR TXC-SB-TRR
(a) (b)
TAR-TRR Analysis for (a) Texture Showing EER = 75.73 (b) Texture with Soft Biometric showing EER=85.14
Parameter Texture Features Texture Features with Soft Biometric
PI 75.73 85.14
48
Result Analysis
Without Soft Biometrics
With Soft Biometrics
Offline SystemPerformance
Feature Vector Type PI SPI PI SPI PI SPI
GCH 88.33 9.09 91.37 18.18 83 6.0
GCV 87.14 11.11 91.18 20.00 81 5.2 Grid Feature 69.25 32 85.03 25 82 2.1
TXF 75.73 14.81 85.14 25 81 6.1
TFD1 82.7 15.79 85.55 30 NA NA
TFD2 60.43 40 86.03 14.29 NA NA
TFD3 55.84 14.29 85.4 14.29 NA NA
TFD4 63.95 5.24 84.7 14.29 NA NA
TFD5 71.29 14.29 84.44 14.29 NA NA
(GCH: Geometric Centers Horizontal Feature Vector, Geometric Centers Vertical, TXC- Texture Feature Vector)

49
Software and Hardware RequirementHardware Requirement:• Processor : Intel(R) Core(TM) 2 Duo CPU @ 2.00
GHz• RAM : 2.00GB or more• Hard disk : 40GB or more• Digitizing Tablet
Software Requirement:• Operating System : Windows XP• Windows edition : Windows 8 Pro © 2012 Microsoft
Corporation.• Programming Language : C# .Net• Development Kit : Visual studio 2013
50
Conclusion• The proposed method was tested on 108 users, total 2700 Genuine
(Intra Class) & 2,88,900 (Inter Class) Tests were performed• In our research it is observed that the Successive Geometric Centers
of Depth II achieve 88.33(GCH) & 87.14(GCV) % PI for dynamic signatures as compared to 83.14 & 81.22% PI of Static implementation.
• Online signature recognition system gives more accuracy.• Dynamic signature based system gives best performance amongst
behavioral biometrics. Research suggests that online signature based systems are more accurate than static systems as they consider dynamic nature of the signature. Forgery detection which is difficult in static system can be easily done in the dynamic systems.
• For comparing the performance TAR-TRR analysis based Performance Index (PI) and Security Performance Index (SPI) are used.
51
Conclusion• The EER for Grid Features was 69.25% and that of Texture
features is 75.73%.• Performance is increased when the soft biometric features
such as Number of Pixels (NOP), Dominant Angle, Baseline Shift (BLS) are added to the feature vector.
• It is clearly seen that the Online-signature based feature vector along with soft biometric features gives the best performance of PI =86.03% for TFD 2 an PI = 85.55% for TFD 1. The grid features give PI = 85.03%.
• The static signature based system has less results of 82 & 81 % respectively.
• The proposed system has achieved up to 86.03% of PI and 40% of SPI for texture Feature, as compared to 81% of PI & 6.1% SPI of static signature recognition system.
52
Further Work• For better performance Successive Geometric Centers of
Depth-3 can be use.
• Mainly K-NN classifier is used for classification in unimodal as well as multimodal implementations. This is a simple classifier with limited scope for training. The classification accuracy can be improved by incorporating SVM (support vector machine)classifier.
53
Summary of Publications• Dr. R. R. Sedamkar, Mr. P. S. Jangid, “Dynamic Signature
Recognition using Successive Geometric Center Level 2 based Feature Vector Extraction”, ELSEVIER, Vol. I (2014), No. 1, pp. 17-24.
• Dr. R. R. Sedamkar, Mr. P. S. Jangid,“Performance Analysis of Grid & Texture based Feature Vector for Dynamic Signature Recognition”, ELSEVIER, Vol. I (2014), No. 1, pp. 27-37.
54
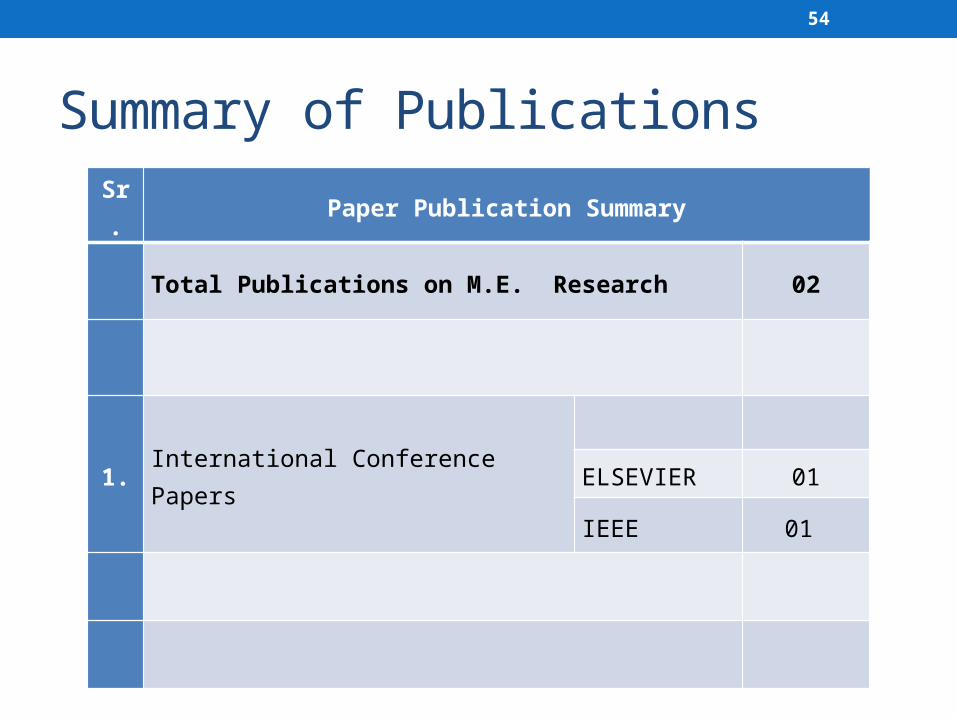
Summary of PublicationsSr. Paper Publication Summary
Total Publications on M.E. Research 02
1. International Conference Papers
ELSEVIER 01
IEEE 01
55
References• H. Dullink, B. van Daalen, J. Nijhuis, L. Spaanenburg, H. Zuidhof, “Implementing a DSP
Kernel for Online Dynamic Handwritten Signature Verification using the TMS320 DSP Family”, EFRIE, France December 1995 SPRA304.
• A. K. Jain, A. Ross, and S. Prabhakar, “On Line Signature Verification”, Pattern Recognition, vol. 35, no. 12, pp. 2963-2972, Dec 2002.
• H. lei, S. Palla and V Govindraju, “ER2: an Intuitive Similarity measure for On-line • Signature Verification”, Proceedings of CUBS 2005. • K.Tanabe, M.Yoshihara, H.Kameya and S.Mori, “Automatic Signature Verification Based
on the Dynamic Feature of Pressure”, IEEE Conf., 10-13 Sept. 2001, 10.1109/ICDAR.2001.953945
• Abdullah I. Al-Shoshan, “Handwritten Signature Verification Using Image Invariants and Dynamic Features”, Proceedings of the International Conference on Computer Graphics, Imaging and Visualization (CGIV'06) ,March 2006, 0-7695-2606
• J. Hasna, “Signature Recognition Using Conjugate Gradient Neural Networks”, IEEE transactions on engineering, computing and technology, Vol. 14, august 2006, ISSN 1305-5313
• V. Nalwa, “Automatic On-Line Signature Verification”, proceedings of the IEEE Transactions on Biometrics, vol. 85, No. 2, February 1997.
56
References
• J Edson, R. Justino, F. Bortolozzi and R. Sabourin, "An off-line signature verification using HMM for Random, Simple and Skilled Forgeries", Sixth International Conference on Document Analysis and Recognition, pp. 1031-1034, Sept.2001.
• Bai-ling Zhang, “Off-line Signature Recognition and Verification by Kernel Principal Component Self-regression”, Proceedings of the 5th International Conference on Machine Learning and Applications (ICMLA'06), 0-7695-2735-3/06, 2006
• H. Baltzakis, N. Papamarkos, “A new signature verification technique based on a two-stage neural network classifier”, Engineering Applications of Artificial Intelligence 14 (2001) 95±103, 0952-1976/01/$ - PII: S 0 9 5 2 - 1 9 7 6 (0 0) 0 0 0 6 4 - 6
• S. Armand, M. Blumenstein and V. Muthukkumarasamy, “Off-line Signature Verification based on the Modified Direction Feature”, Engineering Applications of Artificial Intelligence 14 (2004), 0952-1976/04/$ - PII: S 0 9 5 2
• B. Majhi, Y. Reddy, D. Babu, “Novel Features for Off-line Signature
Verification”, International Journal of Computers, Communications & Control Vol.
I (2006), No. 1, pp. 17-24.• M.K kalera, S. Shrihari, “Offline Signature Verification And Identification Using Distance Statistics”, International
Journal of Pattern Recognition and Artificial Intelligence Vol. 18, No. 7 (2004) 1339-1360 ,World Scientific Publishing Company
• S. Chen and S. Srihari, “Use of Exterior Contours and Shape Features in Off-line Signature Verification”, Proceedings of the 2005 Eight International Conference on Document Analysis and Recognition (ICDAR’05), 1520-5263/05
• Y. Xuhua, F. Takashi, K. Obata, Y. Uchikawa, “Constructing a High Performance Signature Verification System Using a GA Method”, IEEE Conf. ANNES, 20-23 Nov. 1995, PP: 170 - 173, 10.1109/ANNES.1995.499465,

57
Questions ?

58
Thank You !!