Embed Size (px)
Citation preview
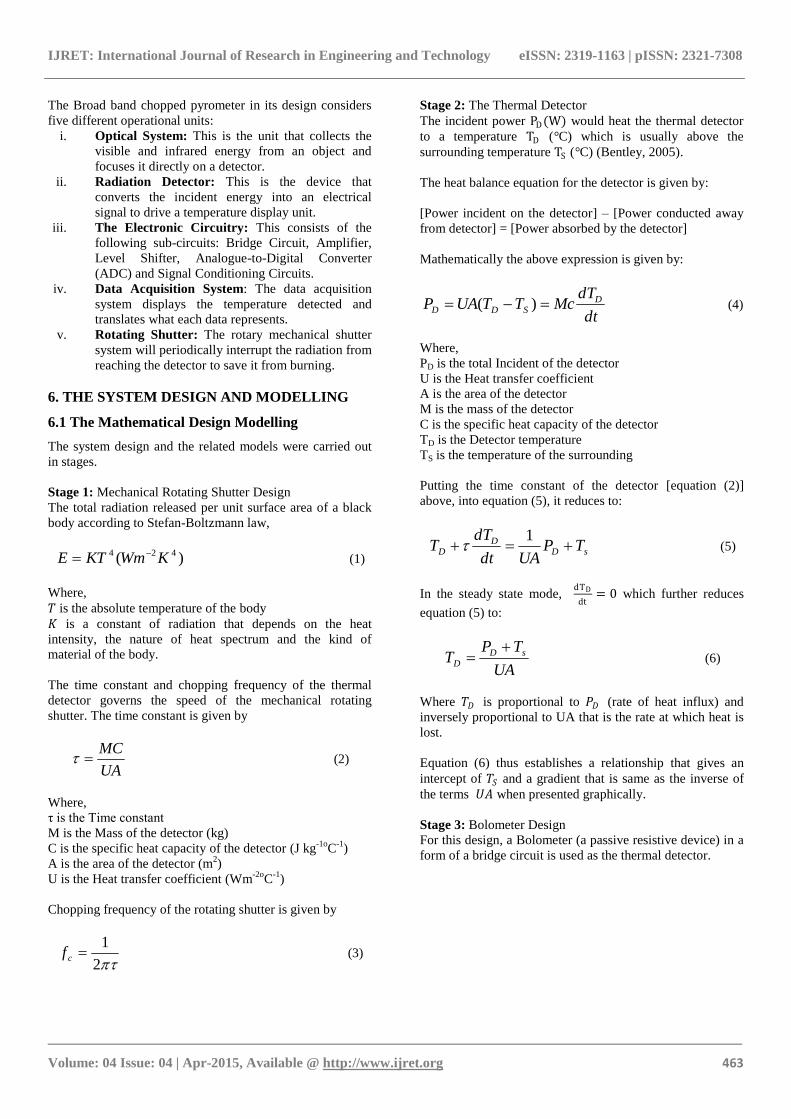
IJRET: International Journal of Research in Engineering and Technology eISSN: 2319-1163 | pISSN: 2321-7308
_______________________________________________________________________________________
Volume: 04 Issue: 04 | Apr-2015, Available @ http://www.ijret.org 461
THE DESIGN OF A SIGNAL CONDITIONING & ACQUISITION
ELEMENTS OF A CHOPPED BROADBAND RADIATION
PYROMETER
Kufre Esenowo Jack1, Israel Etu
2, Veronica Nicholas Ukanide
3
1Department of Electrical /Electronic Engineering Technology, Akanu Ibiam Federal Polytechnic,Unwana, P.M.B
1007 Afikpo, Ebonyi State 2Department of Electrical /Electronic Engineering Technology, Akanu Ibiam Federal Polytechnic,Unwana, P.M.B
1007 Afikpo, Ebonyi State 3Department of Electrical /Electronic Engineering Technology, Akanu Ibiam Federal Polytechnic,Unwana, P.M.B
1007 Afikpo, Ebonyi State
Abstract This paper presents the design of signal conditioning and acquisition elements of a chopped broadband radiation pyrometer. This
instrument is capable of measuring temperature between 900oC and 1200
oC. This work aims at solving the problem of measuring
hot objects with a thermometer. The radiation pyrometer is a non-contact temperature sensor that infers the temperature of an
object by detecting its naturally emitted thermal radiation. It collects the visible and infrared energy and focuses it on a detector.
The detector used in this device is a thermal sensor. It receives heat energy reflected from a mirror inclined at 45o to the incident
signal from the hot object. The design achieved the following: temperature range measured, from 900℃ to 1200℃; the calibrated
instrument is fairly linear with a tolerable non-linearity of 3.6%, with the sensitivity of 0.014𝑉℃−1; the resolution was quite very
small as such it can easily detect the slightest change at its input; the rotating shutter was configured to supply the chopped
signal; it operates at a frequency of 50Hz that is lower than the system frequency of 200Hz; the data acquisition system was able
to capture data at a periodic time of 0.02 second and below, the system operates within the specified sampling range thus,
satisfying Nyquist criteria. The signal so received by the detector is translated to a human readable form and sent to a display.
Keywords:- Broadband Radiation Pyrometer, Temperature Sensor, Instrument, Chopped and Detector.
--------------------------------------------------------------------***------------------------------------------------------------------
1. INTRODUCTION
The broadband radiation pyrometer will be used to measure
a temperature without making contact with the object.
Thermal sensors detect the temperature of the environment
and the objects in it. This instrument is designed in such a
way that the sensor would get the radiated signal from the
source (Thomas, 2006). Other means of measuring high
temperature include the use of narrow band radiation
pyrometer and broadband (un-chopped) radiation pyrometer
(Alan, 2001). All these instruments operate on the same
principle except that the chopped broadband radiation
pyrometer has a unique feature. This feature is a mechanical
shutter that closes and opens the gate to the detector
intermittently to prevent it from being burnt due to high
temperature (Bentley, 2005). In practice, other traditional
radiation pyrometers give error temperature readings due to
the actual surface condition of the object, the effect of
oxidation and coating of the black body (Ramos et al.,
2012). The application of a radiation pyrometer for
temperature measurement in other relevant areas with the
range covering 250 to 6000 C were found in aluminum
processing according to Jones et al., (1987). Muller et al.,
(2001) developed a two-color pyrometer used in measuring
the temperature of surfaces with unknown emissivity during
high-speed turning processes. Moreover, the accuracy of the
two-color pyrometer was compared with the accuracy of
monochromatic pyrometers for different metallic surfaces.
Similarly, the rolling and extrusion demonstrate how much
greater uncertainties that result from the various factors
affect emissivity (Jones et al., 1987). Quantum Logic
Corporation has developed, patented and currently,
marketed Laser and Microcomputer Pyrometers, usually
employ a new technology with small semiconductor lasers
and microcomputers for the purpose of determining the
spectral emissivity from a distance. As a result this
measurement of the emitted radiation, the microcomputer
can compute the actual temperature of the body with Planck
Equation (Webster, 1999). The accuracy of the temperature
measurement is usually higher than that of the primarily
known pyrometers. Industrial and research applications
reveal that, it is safer to measure the temperature of a body
from a distance without touching it. Evidently, when
something is moving, when it is hot (as inside a furnace) or
when it is difficult to access, the best option is a non-contact
thermometer (Orlov et al., 2014). This device can measure a
wide range of the heat radiating from a body. This is why
the term, broadband is used for it. Pyrometers measure the
temperature of bodies, integrating the infrared energy
coming from them. In general, measuring temperature using
infrared techniques is more complicated than using contact
sensors due to the existence of problems associated with the

IJRET: International Journal of Research in Engineering and Technology eISSN: 2319-1163 | pISSN: 2321-7308
_______________________________________________________________________________________
Volume: 04 Issue: 04 | Apr-2015, Available @ http://www.ijret.org 462
physical measurement procedure. The main purpose for
improving pyrometers is to increase the measurement
accuracy by reducing the influence of background
temperature of the optical system. The issue with
conditioning the information so acquired, is the main reason
this design was embarked upon.
2. RELATED LITERATURES
Radiation Thermometry has been a practice for some years.
The first practical infrared thermometer was the human eye.
Research shows that the human eye has a lens that directs
radiation to the retina. The retina is in turn, stimulated
thereby transferring the signal to the brain. The brain then
serves as the indicator of the radiation by converting the
signal to a measure of temperature, if well calibrated
(Komanduri & Hou, 2001). The word, pyrometer is from the
Greek root pyro, meaning fire. At first, it was used to
indicate a device that can measure temperatures of objects
beyond the incandescent level (objects bright to the human
Eye). Infrared heat has been useful for many years. A Study
shows that many years ago, the sun was used to heat objects
form molds for construction (Bowden et al., 1954).
Craftsmen knew how hot to make metals before they could
form them. This was achieved by the experience of the color
of iron. Due to the scarcity of fuel for firing, olden-day
builders depended on the infrared radiation of the sun to dry
the bricks for their buildings.
The common applications of radiation thermometry are the
heat treating, forming, tempering and annealing of glass.
Others are the casting, rolling, forging, and heat treating of
metals; as well as quality control in the food, pulp, and
paper industry. Furthermore, it includes the drying of
plastics, extrusion, lamination of rubber and paper, and in
the curing process of paints, resins, and adhesives. Non-
touch temperature sensors are invaluable research tools in
military, medical, industrial, meteorological, ecological,
forestry, agriculture, and chemical implementations.
The first license for a radiation thermometer was issued in
1901. The device made use of a thermoelectric sensor. It
used an electrical output signal and exhibited self-operation.
In 1931, the first commercially-available total radiation
thermometers were introduced. These devices were widely
used throughout industries to record and control industrial
processes. They are still used today, but mainly used for
low-temperature applications. The first modern radiation
thermometers came into being after the Second World War
originally developed for military use; and has since then
undergone modifications until today when it has
metamorphosed to radiation pyrometers.
3. DESIGN TASK AND MODEL
This work aims at designing signal conditioning and
acquisition elements of a chopped broadband radiation
pyrometer that is capable of measuring temperature from
900oC to 1200
oC
The objectives of this work are to:
i. Design a thermal detector which can convert
incident radiant power into an electrical output.
ii. Design a signal conditioning element that can
handle the output of the thermal detector to a form
more suitable for further processing.
iii. Design a data acquisition element of the pyrometer.
iv. Choose a suitable chopping frequency that matches
the physical properties of the system under design.
v. Estimate the limits imposed by the chosen
hardware on overall system resolution.
vi. Provide the calibration data and plot the output
voltage against the source temperature.
4. THE DESIGN PARAMETERS
i. The Thermal Detector Data
The sensing element of the pyrometer under review
will make use of the following physical properties:
Heat transfer coefficient 124102 CWmU o
Surface area 24106.1 mA
Heat capacity and Mass of the detector 12106.1 CJMC o
Temperature Coefficient of Resistance 1004.0 Co
Reference Resistance .100oR at 0℃
The assumed rate at which radiant energy falls on the
thermal detector is 50T4pWcm−2
ii. The Digital Signal
Frequency of 10 kHz
ADC with 12bits
Voltage range of ±1volt
iii. Design Temperature
Range 900℃ to 1200℃
Environment temperature 25℃
iv. The Bolometer Design
Voltage 3.0volts
5. THE DESIGN OF THE BROAD BAND
CHOPPED PYROMETER
Fig 1 The block representation of the designed broad band
chopped pyrometer
IJRET: International Journal of Research in Engineering and Technology eISSN: 2319-1163 | pISSN: 2321-7308
_______________________________________________________________________________________
Volume: 04 Issue: 04 | Apr-2015, Available @ http://www.ijret.org 463
The Broad band chopped pyrometer in its design considers
five different operational units:
i. Optical System: This is the unit that collects the
visible and infrared energy from an object and
focuses it directly on a detector.
ii. Radiation Detector: This is the device that
converts the incident energy into an electrical
signal to drive a temperature display unit.
iii. The Electronic Circuitry: This consists of the
following sub-circuits: Bridge Circuit, Amplifier,
Level Shifter, Analogue-to-Digital Converter
(ADC) and Signal Conditioning Circuits.
iv. Data Acquisition System: The data acquisition
system displays the temperature detected and
translates what each data represents.
v. Rotating Shutter: The rotary mechanical shutter
system will periodically interrupt the radiation from
reaching the detector to save it from burning.
6. THE SYSTEM DESIGN AND MODELLING
6.1 The Mathematical Design Modelling
The system design and the related models were carried out
in stages.
Stage 1: Mechanical Rotating Shutter Design
The total radiation released per unit surface area of a black
body according to Stefan-Boltzmann law,
)( 424 KWmKTE (1)
Where,
𝑇 is the absolute temperature of the body
𝐾 is a constant of radiation that depends on the heat
intensity, the nature of heat spectrum and the kind of
material of the body.
The time constant and chopping frequency of the thermal
detector governs the speed of the mechanical rotating
shutter. The time constant is given by
UA
MC (2)
Where,
τ is the Time constant
M is the Mass of the detector (kg)
C is the specific heat capacity of the detector (J kg-1o
C-1
)
A is the area of the detector (m2)
U is the Heat transfer coefficient (Wm-2o
C-1
)
Chopping frequency of the rotating shutter is given by
2
1cf (3)
Stage 2: The Thermal Detector
The incident power PD(W) would heat the thermal detector
to a temperature TD (°C) which is usually above the
surrounding temperature TS (°C) (Bentley, 2005).
The heat balance equation for the detector is given by:
[Power incident on the detector] – [Power conducted away
from detector] = [Power absorbed by the detector]
Mathematically the above expression is given by:
dt
dTMcTTUAP D
SDD )( (4)
Where,
PD is the total Incident of the detector
U is the Heat transfer coefficient
A is the area of the detector
M is the mass of the detector
C is the specific heat capacity of the detector
TD is the Detector temperature
TS is the temperature of the surrounding
Putting the time constant of the detector [equation (2)]
above, into equation (5), it reduces to:
sDD
D TPUAdt
dTT
1 (5)
In the steady state mode, dTD
dt= 0 which further reduces
equation (5) to:
UA
TPT sD
D
(6)
Where 𝑇𝐷 is proportional to 𝑃𝐷 (rate of heat influx) and
inversely proportional to UA that is the rate at which heat is
lost.
Equation (6) thus establishes a relationship that gives an
intercept of 𝑇𝑆 and a gradient that is same as the inverse of
the terms 𝑈𝐴 when presented graphically.
Stage 3: Bolometer Design
For this design, a Bolometer (a passive resistive device) in a
form of a bridge circuit is used as the thermal detector.

IJRET: International Journal of Research in Engineering and Technology eISSN: 2319-1163 | pISSN: 2321-7308
_______________________________________________________________________________________
Volume: 04 Issue: 04 | Apr-2015, Available @ http://www.ijret.org 464
Fig 2 Bridge circuit of a bolometer (sensor)
R1 is the radiation-detecting (or measuring) element at
TD (°C) and is given by,
R1 = R0(1 + αTD ), the detector resistance. (7)
R2 is the reference element at TS (°C) and is given by,
R2 = R0(1 + αTS), the reference resistance. (8)
The two resistors R3 and R4 are fixed equal resistors.
𝑅 = 𝑅4 = 𝑅3
Where R0 is the internal resistance of the (sensor)
Bolometer at 0℃ ; and α is the temperature coefficient of
resistance.
The approximated output of the Bolometer bridge circuit is
given by,
S
S
D
D
STRR
TR
TRR
TRVV
1
1
1
1
0
0
0
0
0
V0 = 0 for TD – TS (9)
Rearranging this expression from equation (9) will give:
SD
S
TR
R
TR
RVV
1
11
1
1
11
1
00
0
By setting R R0 the output can be linearized at the
expense of a smaller sensitivity.
In this limit the output becomes
00
0
11
RR
T
RR
TVV SD
S
Which simplifies to SDS TTR
RVV 0
0 (10)
The output of the bolometer becomes
)(0
sDso TTR
RVV
Equation (10) above represents the output from the
Bolometer. The output is an AC voltage since a rotating
shutter was incorporated in the pyrometer.
The output is then fed into the amplifier as an input for
signal conditioning.
Stage 4: The Design and modelling of an Analogue
Amplifier with a level shifter as a signal conditioning
measure.
In this step, A.C. signals are generated as a result of the
chopping effect of the rotating shutter that requires further
amplification to enhance effective digitization with a
minimum aliasing. An operational amplifier with a level
shutter is added as illustrated in figure 3.
Fig 3 Diagram of an inverting amplifier for signal
conditioning
From the circuit diagram of the inverting amplifier in figure
3, an offset voltage for adjusting the output of the amplifier
was modelled in series with one of the amplifier input
terminals. The offset voltage is placed in the positive input
terminal. The output voltage equation of the inverting
amplifier is given by
off
in
f
in
f
oout VR
R
R
RVV
1 (11)
Similarly, equation (11) can be expressed as:
off
in
f
in
f
o VR
R
R
RVsV
1
Rin
Rf
Voff
Vout
Vo
IJRET: International Journal of Research in Engineering and Technology eISSN: 2319-1163 | pISSN: 2321-7308
_______________________________________________________________________________________
Volume: 04 Issue: 04 | Apr-2015, Available @ http://www.ijret.org 465
𝑉𝑜𝑢𝑡 = −𝑅𝑓
𝑅𝑖𝑛 (1.2−4 × 𝑇𝑆 − 𝑇𝐷 ) + 1 +
𝑅𝑓
𝑅𝑖 𝑉𝑜𝑓𝑓 (12)
Where Vo is the input voltage (output of the thermal
detector),
in
f
R
R is the Gain of the amplifier and Voff is the
offset voltage.
The output voltage of the amplifier, Vout is of the range ±1V
that should correspond to the given temperature range of
900℃ to 1200℃ (or 1173°K to 1473°K).
Now, let theVoff = 0, at the initial temperature of 900℃
(1173°K). The range of temperature defined for the
Pyrometer calibration is selected for an interval of 10℃
difference from 900oC completing a total of 31 calibrations
for the enhancement of accuracy and system precision.
Similarly, from the earlier computation that was
demonstrated it indicates that the mid-range value of 𝑇𝑆 − 𝑇𝐷 was obtained at an absolute temperature of -
76.59K.
Hence, at 𝑇𝑆 − 𝑇𝐷 = −76.59𝐾, 𝑉𝑂 = 0; as stated. Putting
this into available output voltage in equation (12) −1V.
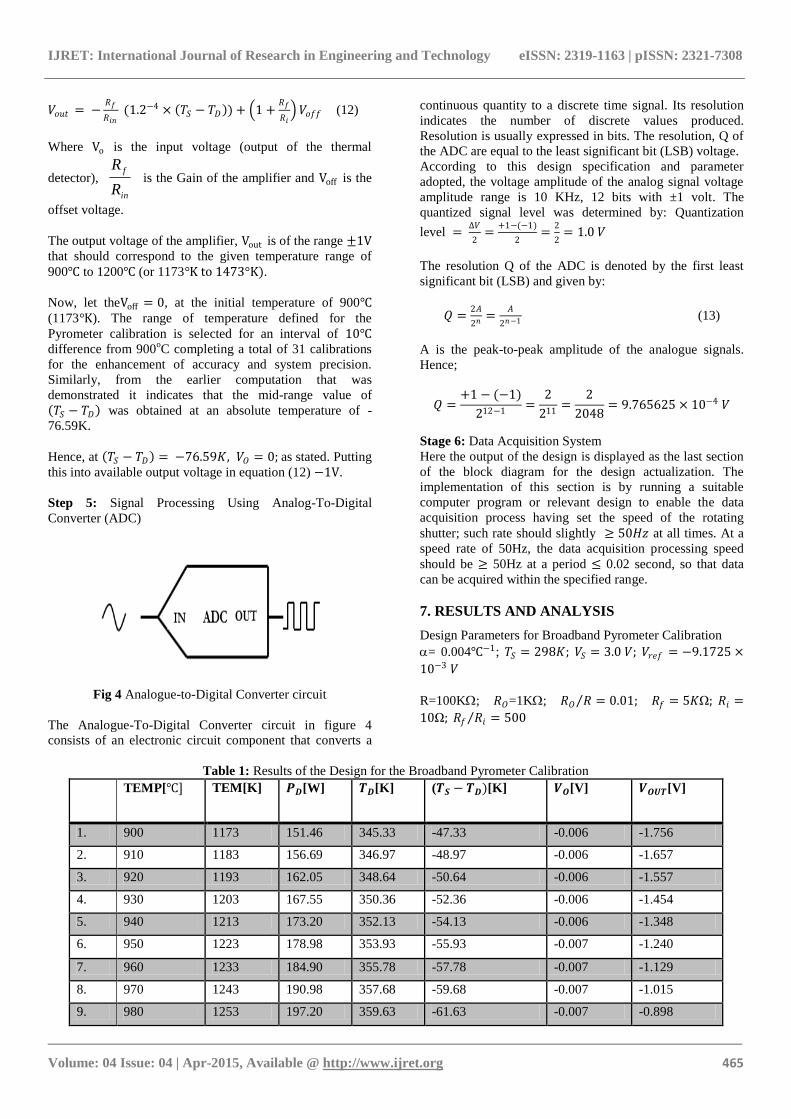
Step 5: Signal Processing Using Analog-To-Digital
Converter (ADC)
Fig 4 Analogue-to-Digital Converter circuit
The Analogue-To-Digital Converter circuit in figure 4
consists of an electronic circuit component that converts a
continuous quantity to a discrete time signal. Its resolution
indicates the number of discrete values produced.
Resolution is usually expressed in bits. The resolution, Q of
the ADC are equal to the least significant bit (LSB) voltage.
According to this design specification and parameter
adopted, the voltage amplitude of the analog signal voltage
amplitude range is 10 KHz, 12 bits with ±1 volt. The
quantized signal level was determined by: Quantization
level = ∆𝑉
2=
+1−(−1)
2=
2
2= 1.0 𝑉
The resolution Q of the ADC is denoted by the first least
significant bit (LSB) and given by:
𝑄 =2𝐴
2𝑛 =𝐴
2𝑛−1 (13)
A is the peak-to-peak amplitude of the analogue signals.
Hence;
𝑄 =+1 − (−1)
212−1=
2
211=
2
2048= 9.765625 × 10⁻⁴ 𝑉
Stage 6: Data Acquisition System
Here the output of the design is displayed as the last section
of the block diagram for the design actualization. The
implementation of this section is by running a suitable
computer program or relevant design to enable the data
acquisition process having set the speed of the rotating
shutter; such rate should slightly ≥ 50𝐻𝑧 at all times. At a
speed rate of 50Hz, the data acquisition processing speed
should be ≥ 50Hz at a period ≤ 0.02 second, so that data
can be acquired within the specified range.
7. RESULTS AND ANALYSIS
Design Parameters for Broadband Pyrometer Calibration
= 0.004℃−1; 𝑇𝑆 = 298𝐾; 𝑉𝑆 = 3.0 𝑉; 𝑉𝑟𝑒𝑓 = −9.1725 ×
10−3 𝑉
R=100K; 𝑅𝑂=1K; 𝑅𝑂 𝑅 = 0.01; 𝑅𝑓 = 5𝐾Ω; 𝑅𝑖 =
10Ω; 𝑅𝑓 𝑅𝑖 = 500
Table 1: Results of the Design for the Broadband Pyrometer Calibration
TEMP[℃] TEM[K] 𝑷𝑫[W] 𝑻𝑫[K] (𝑻𝑺 − 𝑻𝑫)[K] 𝑽𝑶[V] 𝑽𝑶𝑼𝑻[V]
1. 900 1173 151.46 345.33 -47.33 -0.006 -1.756
2. 910 1183 156.69 346.97 -48.97 -0.006 -1.657
3. 920 1193 162.05 348.64 -50.64 -0.006 -1.557
4. 930 1203 167.55 350.36 -52.36 -0.006 -1.454
5. 940 1213 173.20 352.13 -54.13 -0.006 -1.348
6. 950 1223 178.98 353.93 -55.93 -0.007 -1.240
7. 960 1233 184.90 355.78 -57.78 -0.007 -1.129
8. 970 1243 190.98 357.68 -59.68 -0.007 -1.015
9. 980 1253 197.20 359.63 -61.63 -0.007 -0.898

IJRET: International Journal of Research in Engineering and Technology eISSN: 2319-1163 | pISSN: 2321-7308
_______________________________________________________________________________________
Volume: 04 Issue: 04 | Apr-2015, Available @ http://www.ijret.org 466
10. 990 1263 203.57 361.62 -63.62 -0.008 -0.778
11. 1000 1273 210.09 363.65 -65.65 -0.008 -0.656
12. 1010 1283 216.77 365.74 -67.74 -0.008 -0.531
13. 1020 1293 223.61 367.88 -69.88 -0.008 -0.403
14. 1030 1303 230.61 370.07 -72.07 -0.009 -0.271
15. 1040 1313 237.77 372.30 -74.30 -0.009 -0.137
16. 1050 1323 245.09 374.59 -76.59 -0.009 -0.000
17. 1060 1333 252.59 376.93 -78.93 -0.009 0.1404
18. 1070 1343 260.25 379.33 -81.33 -0.010 0.284
19. 1080 1353 268.09 381.78 -83.78 -0.010 0.431
20. 1090 1363 276.11 384.28 -86.28 -0.010 0.581
21. 1100 1373 284.30 386.84 -88.84 -0.011 0.735
22. 1110 1383 292.67 389.46 -91.46 -0.011 0.892
23. 1120 1393 301.23 392.13 -94.13 -0.011 1.052
24. 1130 1403 309.97 394.87 -96.87 -0.012 1.217
25. 1140 1413 318.90 397.66 -99.66 -0.012 1.384
26. 1150 1423 328.03 400.51 -102.51 -0.012 1.555
27. 1160 1433 337.35 403.42 -105.42 -0.013 1.730
28. 1170 1443 346.86 406.39 -108.39 -0.013 1.908
29. 1180 1453 356.58 409.43 -111.43 -0.013 2.090
30. 1190 1463 366.50 412.53 -114.53 -0.014 2.276
31. 1200 1473 376.62 415.69 -117.69 -0.014 2.466
Fig 5 The Calibration Graph of Broadband Radiation Pyrometer Output Voltage (v) against Temperature (
oC)
-2
-1.5
-1
-0.5
0
0.5
1
1.5
2
2.5
3
900 950 1000 1050 1100 1150 1200
OU
TPU
T V
OLT
AG
E (V
)
TEMPERATURE (oC)
The Pyrometer Calibration Response
IJRET: International Journal of Research in Engineering and Technology eISSN: 2319-1163 | pISSN: 2321-7308
_______________________________________________________________________________________
Volume: 04 Issue: 04 | Apr-2015, Available @ http://www.ijret.org 467
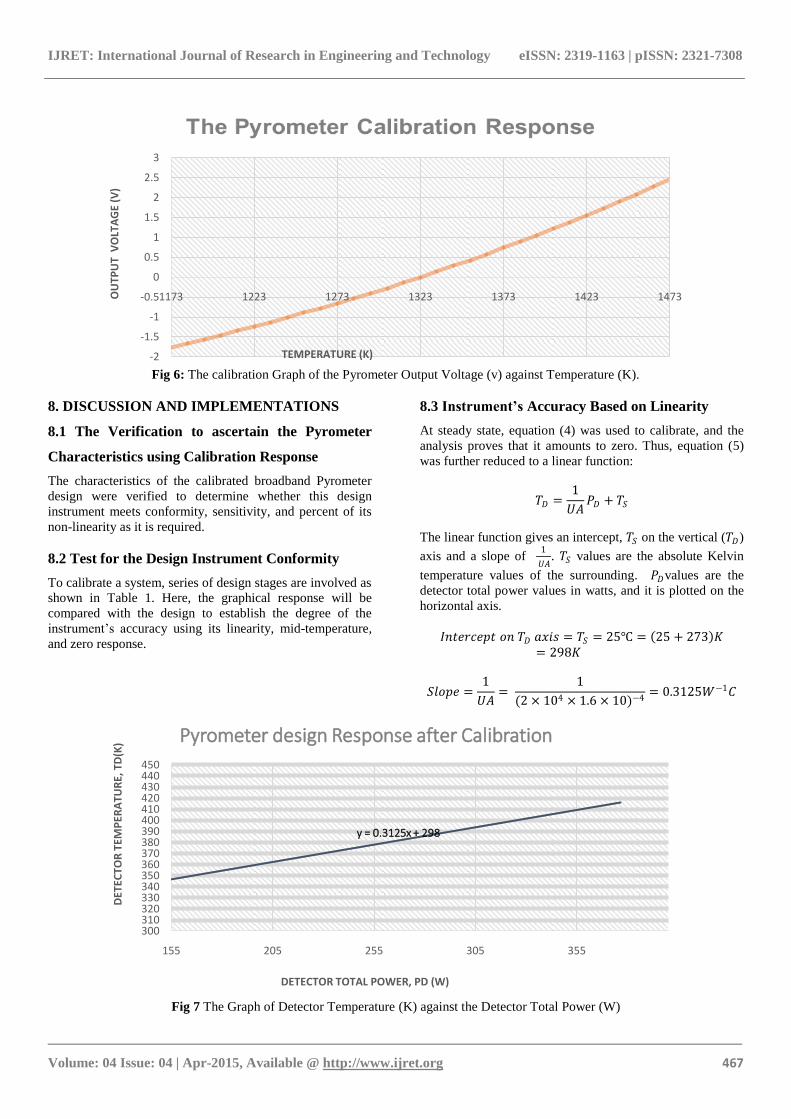
Fig 6: The calibration Graph of the Pyrometer Output Voltage (v) against Temperature (K).
8. DISCUSSION AND IMPLEMENTATIONS
8.1 The Verification to ascertain the Pyrometer
Characteristics using Calibration Response
The characteristics of the calibrated broadband Pyrometer
design were verified to determine whether this design
instrument meets conformity, sensitivity, and percent of its
non-linearity as it is required.
8.2 Test for the Design Instrument Conformity
To calibrate a system, series of design stages are involved as
shown in Table 1. Here, the graphical response will be
compared with the design to establish the degree of the
instrument’s accuracy using its linearity, mid-temperature,
and zero response.
8.3 Instrument’s Accuracy Based on Linearity
At steady state, equation (4) was used to calibrate, and the
analysis proves that it amounts to zero. Thus, equation (5)
was further reduced to a linear function:
𝑇𝐷 =1
𝑈𝐴𝑃𝐷 + 𝑇𝑆
The linear function gives an intercept, 𝑇𝑆 on the vertical (𝑇𝐷)
axis and a slope of 1
𝑈𝐴. 𝑇𝑆 values are the absolute Kelvin
temperature values of the surrounding. 𝑃𝐷values are the
detector total power values in watts, and it is plotted on the
horizontal axis.
𝐼𝑛𝑡𝑒𝑟𝑐𝑒𝑝𝑡 𝑜𝑛 𝑇𝐷 𝑎𝑥𝑖𝑠 = 𝑇𝑆 = 25℃ = 25 + 273 𝐾= 298𝐾
𝑆𝑙𝑜𝑝𝑒 =1
𝑈𝐴=
1
(2 × 104 × 1.6 × 10)−4= 0.3125𝑊−1𝐶
Fig 7 The Graph of Detector Temperature (K) against the Detector Total Power (W)
-2
-1.5
-1
-0.5
0
0.5
1
1.5
2
2.5
3
1173 1223 1273 1323 1373 1423 1473OU
TPU
T V
OLT
AG
E (V
)
TEMPERATURE (K)
y = 0.3125x + 298
300310320330340350360370380390400410420430440450
155 205 255 305 355
DET
ECTO
R T
EMP
ERA
TUR
E, T
D(K
)
DETECTOR TOTAL POWER, PD (W)
Pyrometer design Response after Calibration

IJRET: International Journal of Research in Engineering and Technology eISSN: 2319-1163 | pISSN: 2321-7308
_______________________________________________________________________________________
Volume: 04 Issue: 04 | Apr-2015, Available @ http://www.ijret.org 468
Figure 7 illustrates the Linear Characteristics of Broadband
Pyrometer at Steady State
The linear function: 𝑦 = 0.3125𝑥 + 298 is deduced from
the graph:
Sensitivity = 0.3125
Intercept on y-axis = 298K
With the available data from the graph of figure 7, the
design value proves its conformity. Thus, the calibration
graph represents the behaviour of the Chopped Broadband
Radiation Pyrometer.
8.4 Instrument’s Accuracy Based on Mid-Range
Temperature and Zero Response
The design defined a zero output voltage for the Pyrometer
at mid-range temperature (TD -TS); VOUT = 0 Volt. The
mid-range temperature from Table 1 is 1050℃ or 1323K
respectively. From the evidence in Figures 5 and 6 above,
Mid-range Temperature = 1050℃ and 1323K is at 0 volt
respectively. The graph agrees with the design.
Conclusively this Pyrometer Calibration Graph represents
the Characteristics of the Pyrometer and its performance.
8.5 Test for Sensitivity Requirement
The sensitivity of an instrument is the rate of change of the
output of that instrument with respect to input changes.
𝑆𝑒𝑛𝑠𝑖𝑡𝑖𝑣𝑖𝑡𝑦, 𝑆 =∆𝑂𝑢𝑡𝑝𝑢𝑡
∆𝐼𝑛𝑝𝑢𝑡
Fig 8. Graph of Output Voltage (v) against Temperature (
oC)
Figure 8 illustrates the sensitivity Characteristics of
Broadband Pyrometer. The result shows that the response is
not linear as originally stated by the heat balance equation
thus, this degree of non-linearity from this equation:
𝑦 = 0.00002𝑥2 − 0.0191𝑥 + 2.6932
Therefore to determine the sensitivity, a tangent line was
drawn so that only the linear part was considered for the
calculation.
Y = 2E-05x2 - 0.0191x + 2.6932
-2
-1.5
-1
-0.5
0
0.5
1
1.5
2
2.5
3
900 950 1000 1050 1100 1150 1200
OU
TPU
T V
OLT
AG
E (V
)
TEMPERATURE (oC)
The Pyrometer Response before calibration
IJRET: International Journal of Research in Engineering and Technology eISSN: 2319-1163 | pISSN: 2321-7308
_______________________________________________________________________________________
Volume: 04 Issue: 04 | Apr-2015, Available @ http://www.ijret.org 469
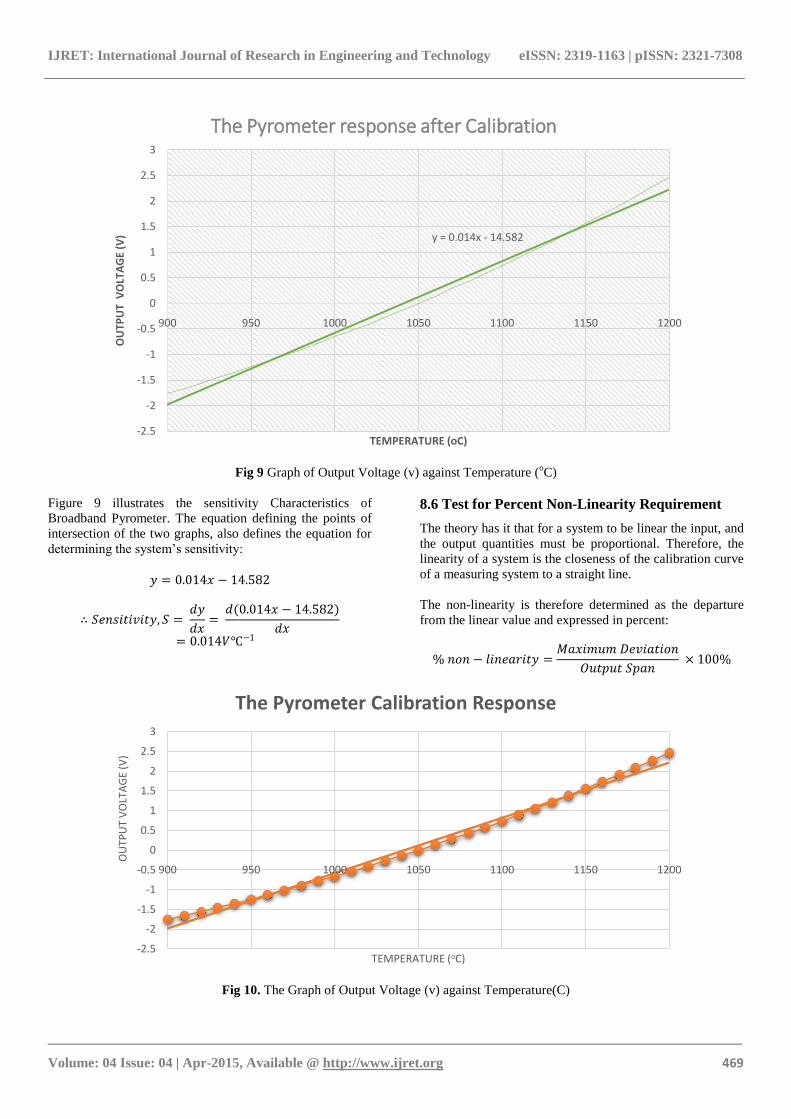
Fig 9 Graph of Output Voltage (v) against Temperature (
oC)
Figure 9 illustrates the sensitivity Characteristics of
Broadband Pyrometer. The equation defining the points of
intersection of the two graphs, also defines the equation for
determining the system’s sensitivity:
𝑦 = 0.014𝑥 − 14.582
∴ 𝑆𝑒𝑛𝑠𝑖𝑡𝑖𝑣𝑖𝑡𝑦, 𝑆 = 𝑑𝑦
𝑑𝑥=
𝑑(0.014𝑥 − 14.582)
𝑑𝑥= 0.014𝑉℃−1
8.6 Test for Percent Non-Linearity Requirement
The theory has it that for a system to be linear the input, and
the output quantities must be proportional. Therefore, the
linearity of a system is the closeness of the calibration curve
of a measuring system to a straight line.
The non-linearity is therefore determined as the departure
from the linear value and expressed in percent:
% 𝑛𝑜𝑛 − 𝑙𝑖𝑛𝑒𝑎𝑟𝑖𝑡𝑦 =𝑀𝑎𝑥𝑖𝑚𝑢𝑚 𝐷𝑒𝑣𝑖𝑎𝑡𝑖𝑜𝑛
𝑂𝑢𝑡𝑝𝑢𝑡 𝑆𝑝𝑎𝑛 × 100%
Fig 10. The Graph of Output Voltage (v) against Temperature(C)
y = 0.014x - 14.582
-2.5
-2
-1.5
-1
-0.5
0
0.5
1
1.5
2
2.5
3
900 950 1000 1050 1100 1150 1200
OU
TPU
T V
OLT
AG
E (V
)
TEMPERATURE (oC)
The Pyrometer response after Calibration
-2.5
-2
-1.5
-1
-0.5
0
0.5
1
1.5
2
2.5
3
900 950 1000 1050 1100 1150 1200
OU
TPU
T V
OLT
AG
E (V
)
TEMPERATURE (oC)
The Pyrometer Calibration Response
IJRET: International Journal of Research in Engineering and Technology eISSN: 2319-1163 | pISSN: 2321-7308
_______________________________________________________________________________________
Volume: 04 Issue: 04 | Apr-2015, Available @ http://www.ijret.org 470
Figure 10 illustrates the characteristics of the designed
Chopped Broadband Radiation Pyrometer. The dotted line
represents the actual nonlinear response while the straight
line represents the linear response after calibration. The
coordinates are intersected from the graph of figure 10, thus
the Maximum Deviation (extracted from the graph) =
0.1015 V
And the Output Span = 1.5551775-(-1.2396225) = 2.7948 V
∴ % 𝑛𝑜𝑛 − 𝑙𝑖𝑛𝑒𝑎𝑟𝑖𝑡𝑦 =0.1015
2.7948 × 100% = 3.6317%
Conclusively, the Pyrometer is moderately linear with a
tolerable non-linearity of 3.6%.
9. CONCLUSION
The signal conditioning and data acquisition elements were
thus designed. These elements were meant for a chopped
broadband radiation pyrometer capable of measuring a range
of temperature from 900oC to 1200
oC. The successful
achievement of this work gave the following parameters:
temperature measured: 900℃ to 1200℃ (1173K to 1473K
respectively); the calibrated instrument is relatively linear
with a tolerable non-linearity of 3.6%; with the sensitivity of
0.014𝑉℃−1. The resolution was quite very small; as such
the instrument so designed easily detects the slightest
change at its input. The rotating shutter was configured to
supply the chopped signal. It operates at a frequency of
50Hz that was found to be lower than the system frequency
of 200Hz. The data acquisition system was able to capture
data at a periodic time of 0.02 second and below thus, the
system operates within the specified sampling range
satisfying Nyquist criteria.
REFERENCES
[1] Alan S. M. (2001) Measurement and Instrumentation
Principles, Third Edition, Butterworth-Heinemann,
UK.
[2] Bentley, J. P. (2005) Principles of Measurement
Systems, Fourth Ed., Prentice Hall, USA.
[3] Bowden, F. P. and Thomas, P. H. (1954). The
Surface Temperature of Sliding Solids. Proc Roy Soc
London.
[4] Jones, T. P., Gardner, J. L., & Richards, A. J. (1987).
Radiation Pyrometers for Temperature Measurement
during Aluminum Processing. Journal of Physics E:
Scientific Instruments, 20(6), 615.
[5] Komanduri, R., & Hou, Z. (2001).A Review of the
Experimental Techniques for the Measurement of
Heat and Temperatures Generated in some
Manufacturing Processes and Tribology. Tribology
International, 34(2001), 653 – 682.
[6] Orlov, I. Y., Nikiforov, I. A. & Afanasjev, A. V.
(2014). Wireless Infrared Pyrometer with Fiber
Optic: Construction and Processing Algorithms.
Wireless Engineering and Technology, 5, 25 – 33.
[7] Ramos, M., de Pablo, M. A., Sebastian, E., Armiens,
C. & Gomez-Elvira, J. (2012).Temperature Gradient
Distribution in Permafrost Active Layer, Using a
Prototype of the Ground Temperature Sensor (Rems-
Msl) on Deception Island (Antarctica). Cold Regions
Science and Technology, 72, 23 – 32.
[8] Thomas A. H. (2006) Measurement and Control
Basics, Fourth Ed. Heywood & Company Ltd.,
London.
[9] Webster, J. G. (1999). The Measurement,
Instrumentation and Sensors Handbook. CRC Press
in corporation with IEEE Press, California, USA.