Embed Size (px)
Citation preview

H O W C O M M U N I T I E S U S E C L E A N E N E R G Y T O B U I L D L O C A L P O W E R
A D VA N C I N G E N E R G Y D E M O C R A C Y
John Farrell Director of Energy DemocracyOctober 20, 2017
Presentation to the AERO Annual Meeting

L E T ’ S W A R M U P

W I N D P O W E R P O T E N T I A L ?Percentage of state electricity sales

A. 25% B. 75% C. 154% D. 12,000% E. 27,000%
W I N D P O W E R P O T E N T I A L ?Percentage of state electricity sales
E. 27,000%
W I N D P O W E R P O T E N T I A LPercentage of state electricity sales
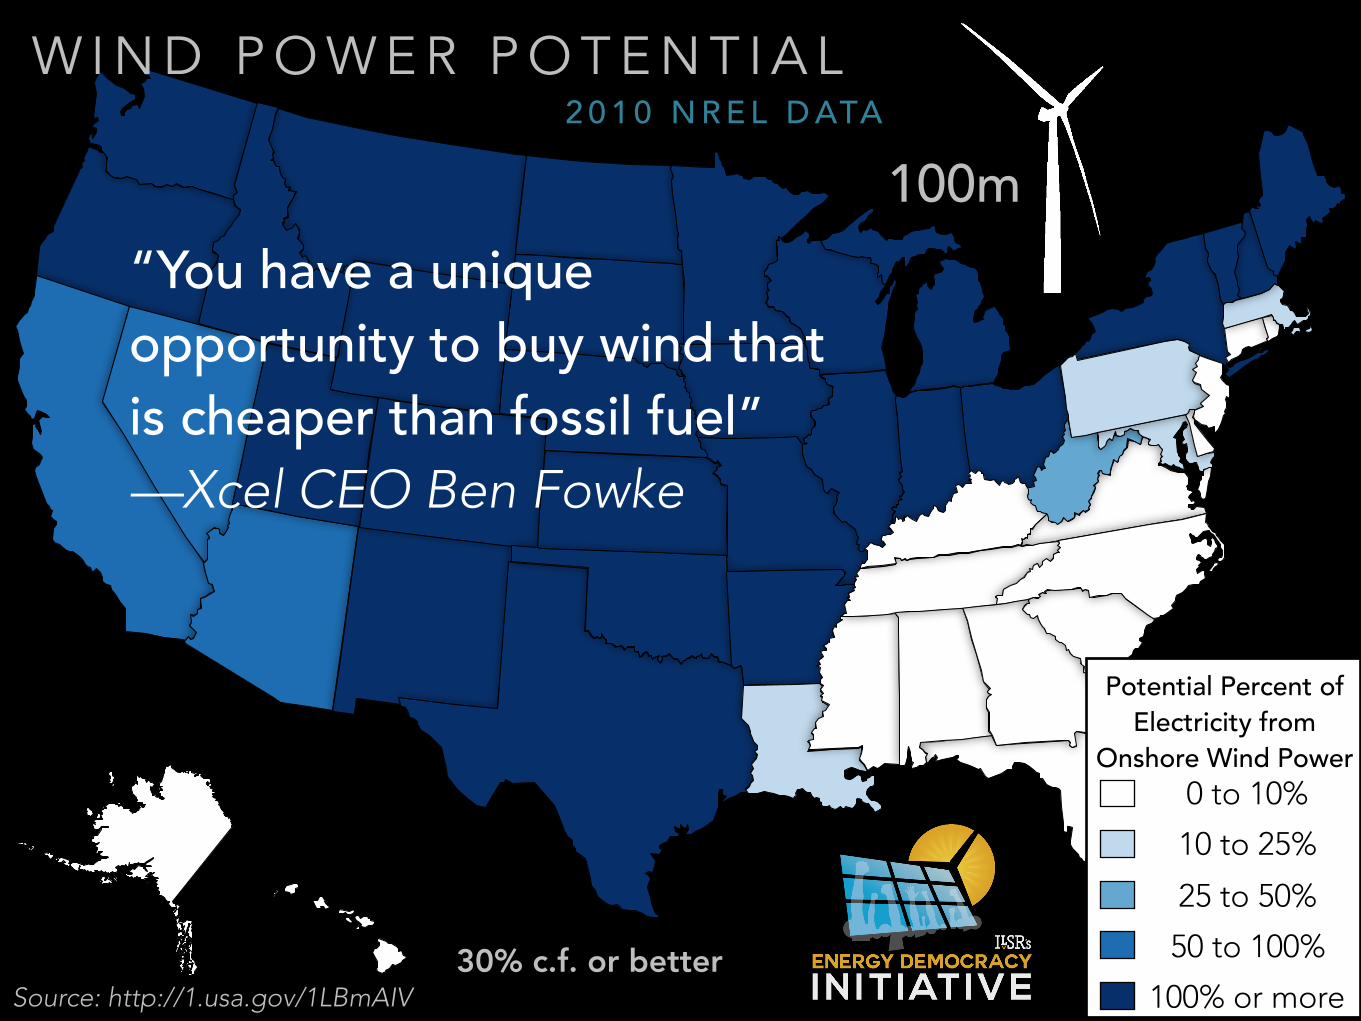
W I N D P O W E R P O T E N T I A L
30% c.f. or better
2 0 1 0 N R E L D ATA
100m
Potential Percent of Electricity from
Onshore Wind Power0 to 10%
10 to 25%
25 to 50%
50 to 100%
100% or moreSource: http://1.usa.gov/1LBmAIV
“You have a unique opportunity to buy wind that is cheaper than fossil fuel” —Xcel CEO Ben Fowke

L E T ’ S W A R M U P ( # 2 )

R O O F T O P S O L A R P O T E N T I A L ?
A. 2% B. 8% C. 28% D. 59% E.112%
Percentage of state electricity sales
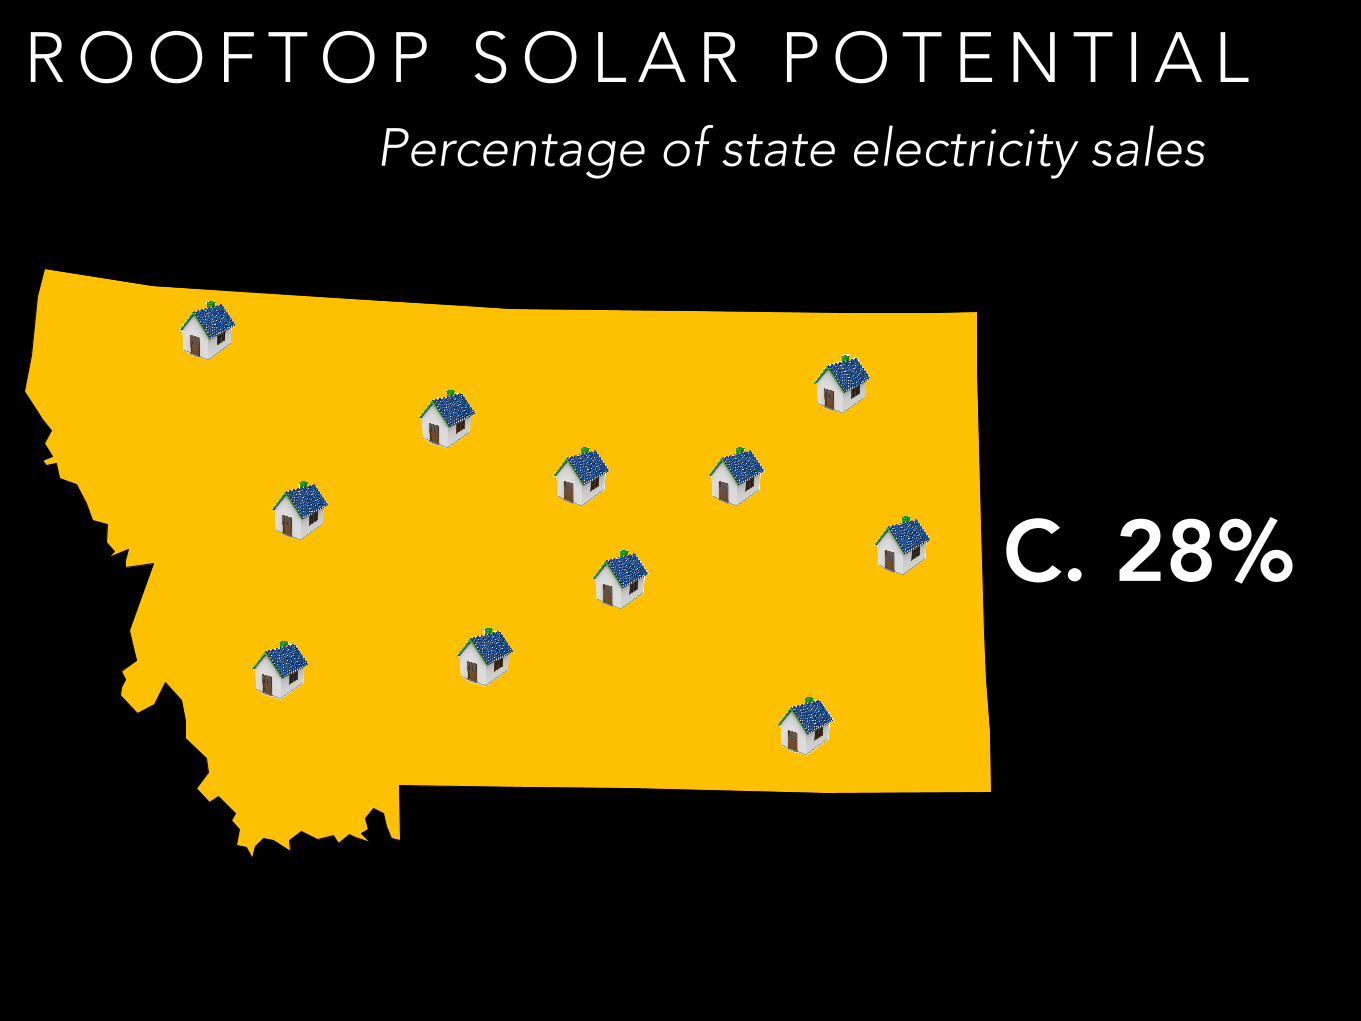
R O O F T O P S O L A R P O T E N T I A L
A. 2% B. 8% C. 28% D. 59% E. 112%
Percentage of state electricity sales

23%
49%
All buildings Source: http://www.nrel.gov/docs/fy16osti/65298.pdf
R O O F T O P S O L A R P O T E N T I A L 2 0 1 6
POTENTIAL PERCENT OF POWER FROM LOCAL
ROOFTOP SOLAROver 50% 40 to 50% 25 to 40% 11 to 25%
2008 data
40-50%25-40%
Over 50%
Over 50%
25-40%
Co
st o
f ele
ctric
ity
0.0¢
2.0¢
4.0¢
6.0¢
8.0¢
10.0¢
12.0¢
14.0¢
Residential ≤10 10-20 20-50 50-100 100-250 250-500 500-1000 5-10 MW 10 to 20 MW
20 to 100 MW
100 to 1,000 MW
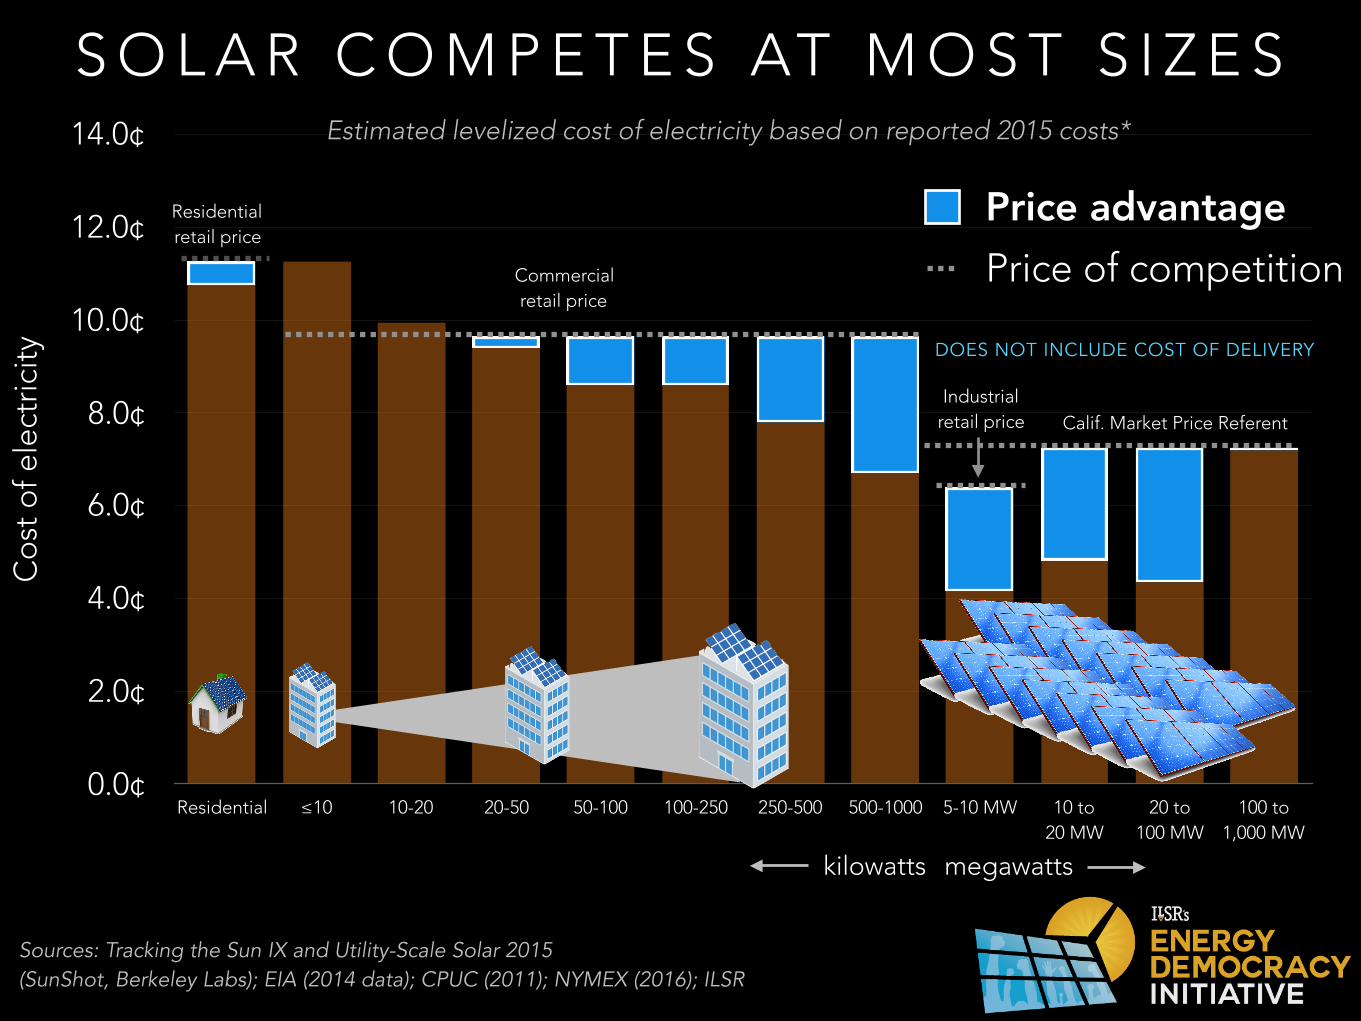
S O L A R C O M P E T E S AT M O S T S I Z E S
kilowatts megawatts
Sources: Tracking the Sun IX and Utility-Scale Solar 2015 (SunShot, Berkeley Labs); EIA (2014 data); CPUC (2011); NYMEX (2016); ILSR
DOES NOT INCLUDE COST OF DELIVERY
Residential retail price
Commercial retail price
Industrial retail price Calif. Market Price Referent
Price of competition
Price advantage
Estimated levelized cost of electricity based on reported 2015 costs*
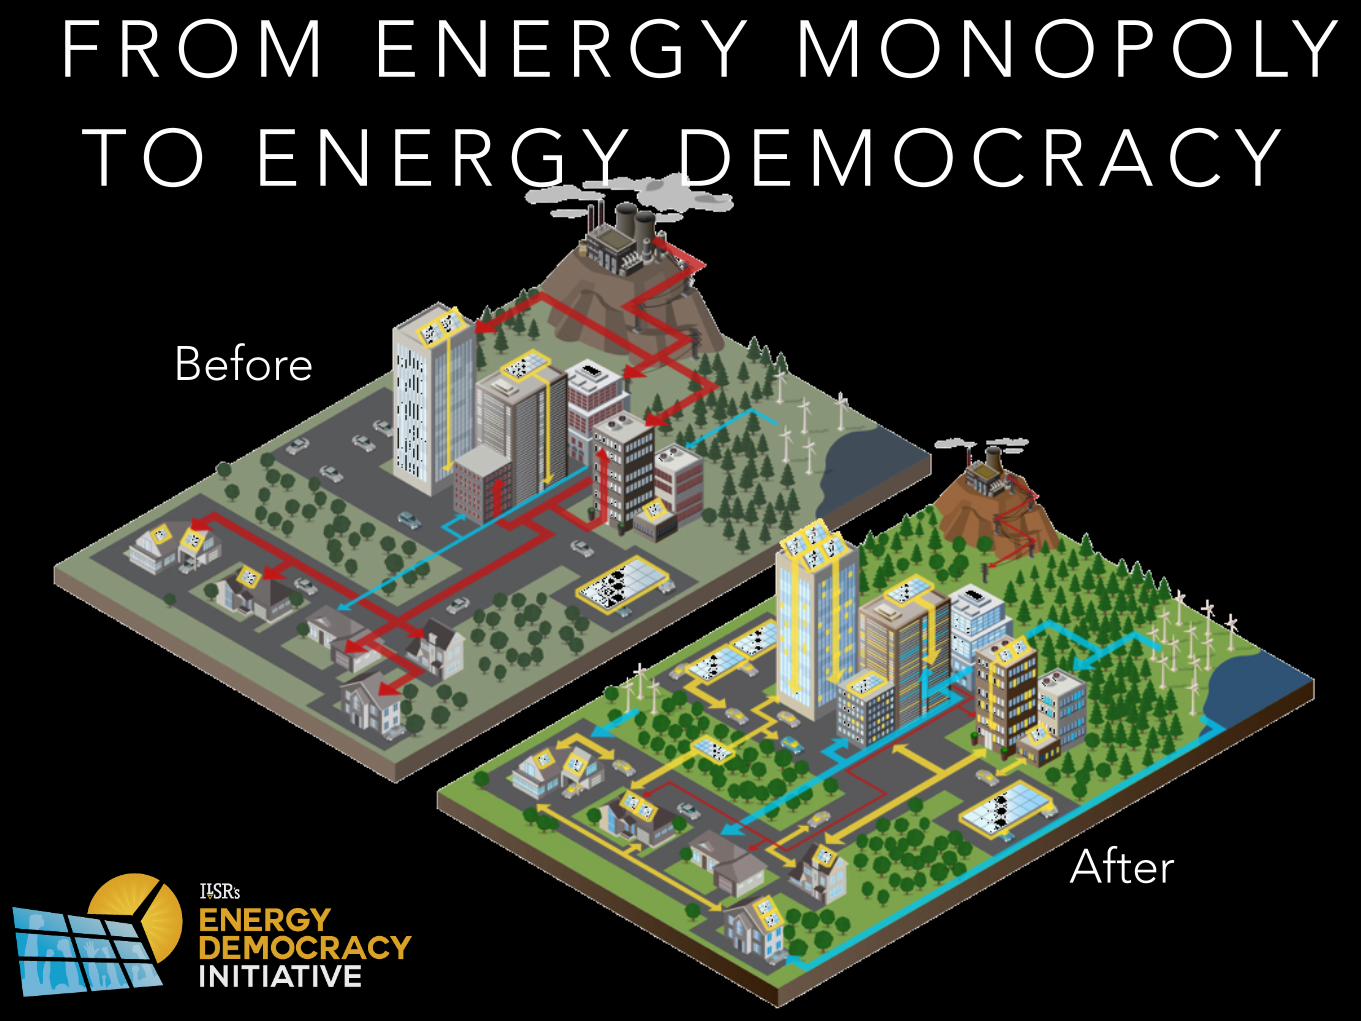
F R O M E N E R G Y M O N O P O LY T O E N E R G Y D E M O C R A C Y
Before
After
S T O R Y: C O M M U N I T Y S O L A R I N K E E N E , N H

0¢
5¢
10¢
15¢
20¢
Lease A Lease B PPA*0¢
5¢
10¢
15¢
20¢
SOLAR COSTS MORE FOR NON-TAXABLE ORGANIZATIONS
Incentives do not apply
to tax-exempt entities
Depreciation only Tax credit only
Tax credit and
depreciation
Transaction costs
Tax credit and
depreciation
Transaction costs
Transaction costs
15.5¢
14.1¢ 13.7¢12.3¢
11.2¢
Federal tax credit = 30% off Depreciation = ~24% off *PPA not legal in 25 states
Solar cost per kilowatt-hour
Purchase via third partyNon-profitFor-profit or
individual
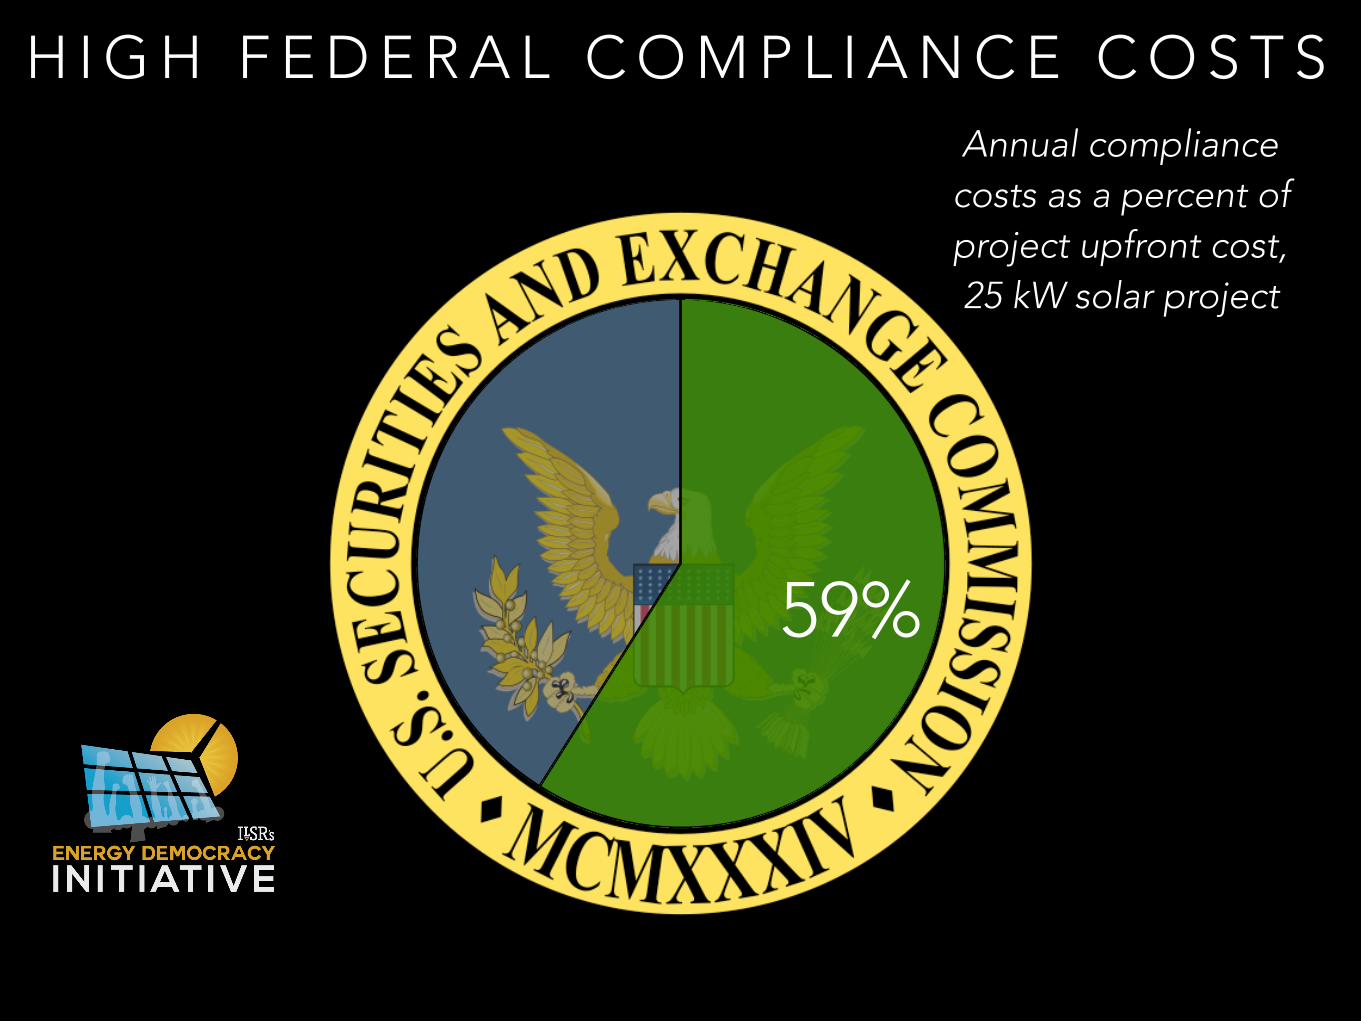
H I G H F E D E R A L C O M P L I A N C E C O S T S
59%
Annual compliance costs as a percent of project upfront cost, 25 kW solar project

L I M I T S T O S H A R I N G
Prohibited in 34 states

C O M M U N I T Y R E N E W A B L E E N E R G Y P R O J E C T S L A W

W E N E E D T O G E T R E A D Y
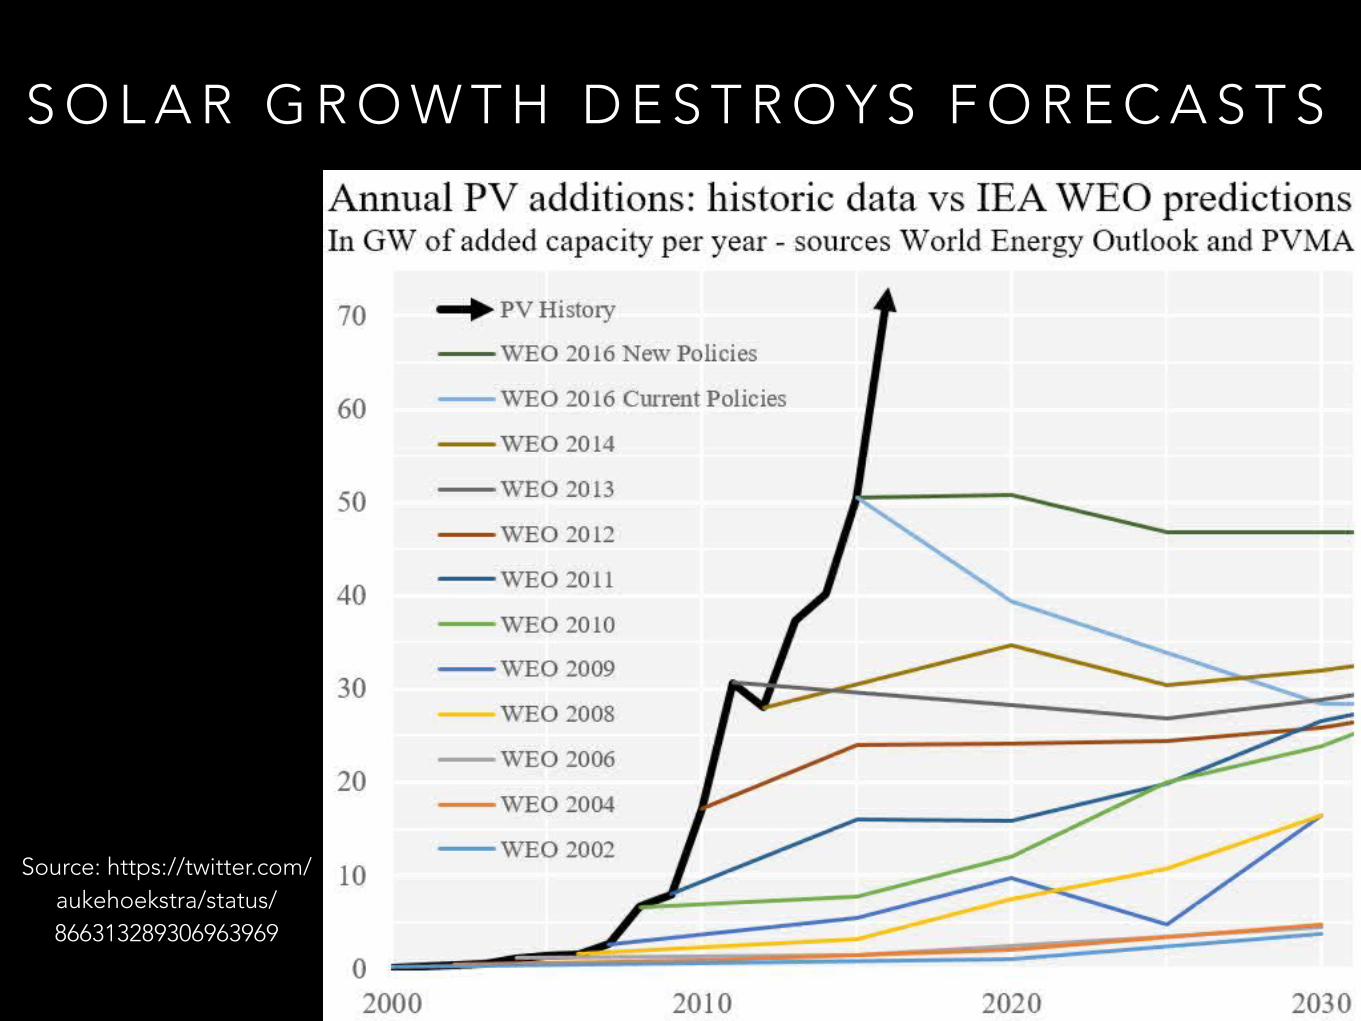
S O L A R G R O W T H D E S T R O Y S F O R E C A S T S
Source: https://twitter.com/aukehoekstra/status/866313289306963969

1 I N S TA L L E V E R Y 6 0
S E C O N D S
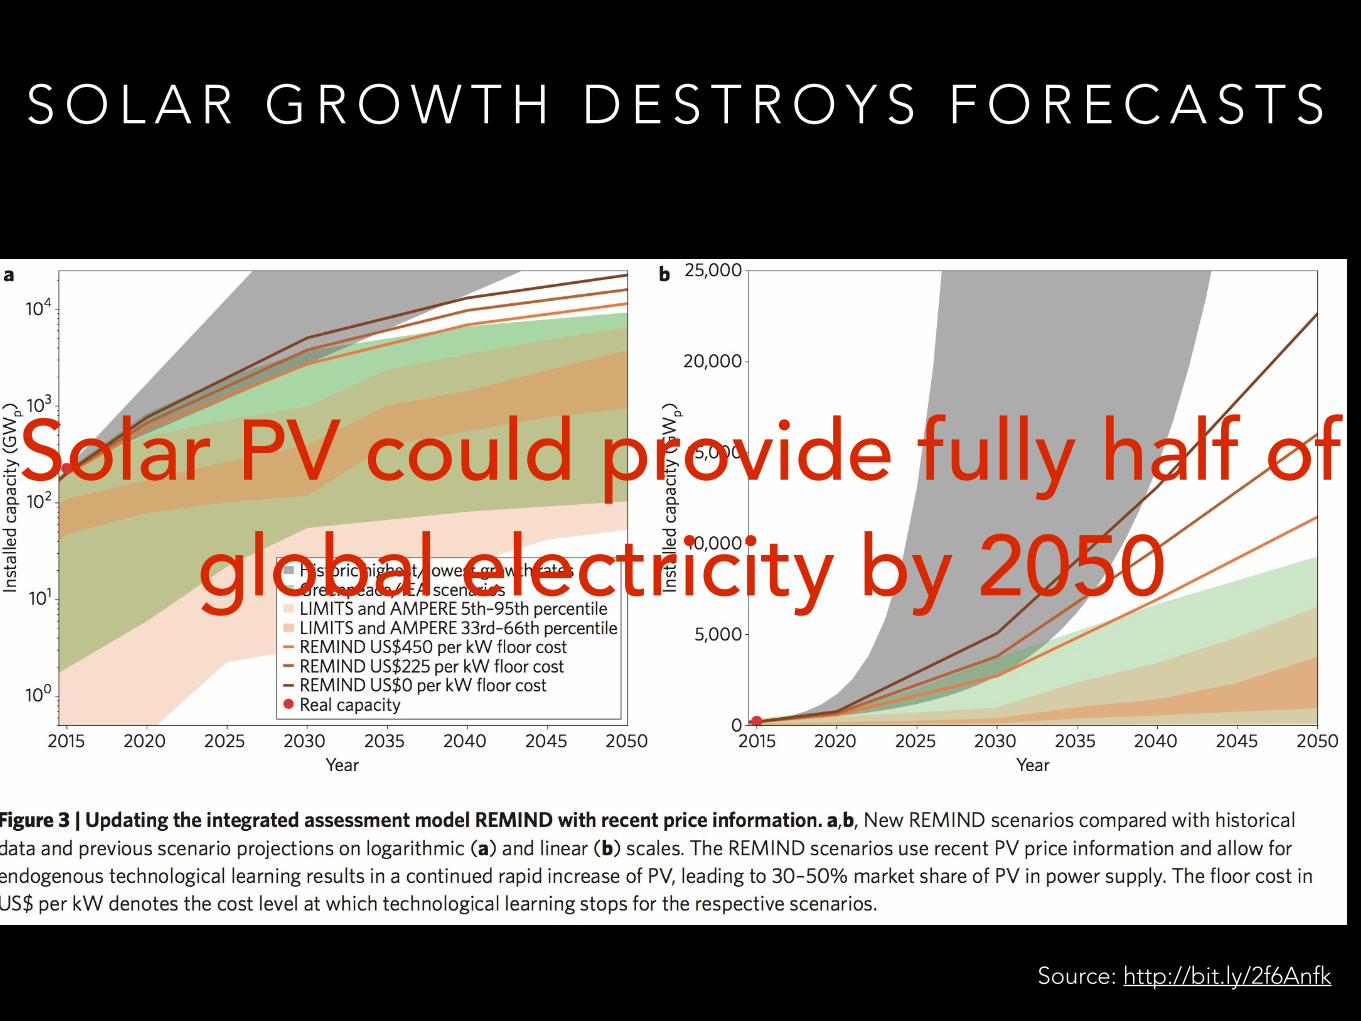
Solar PV could provide fully half of global electricity by 2050
Source: http://bit.ly/2f6Anfk
S O L A R G R O W T H D E S T R O Y S F O R E C A S T S

Source: http://bit.ly/2gKCKVc
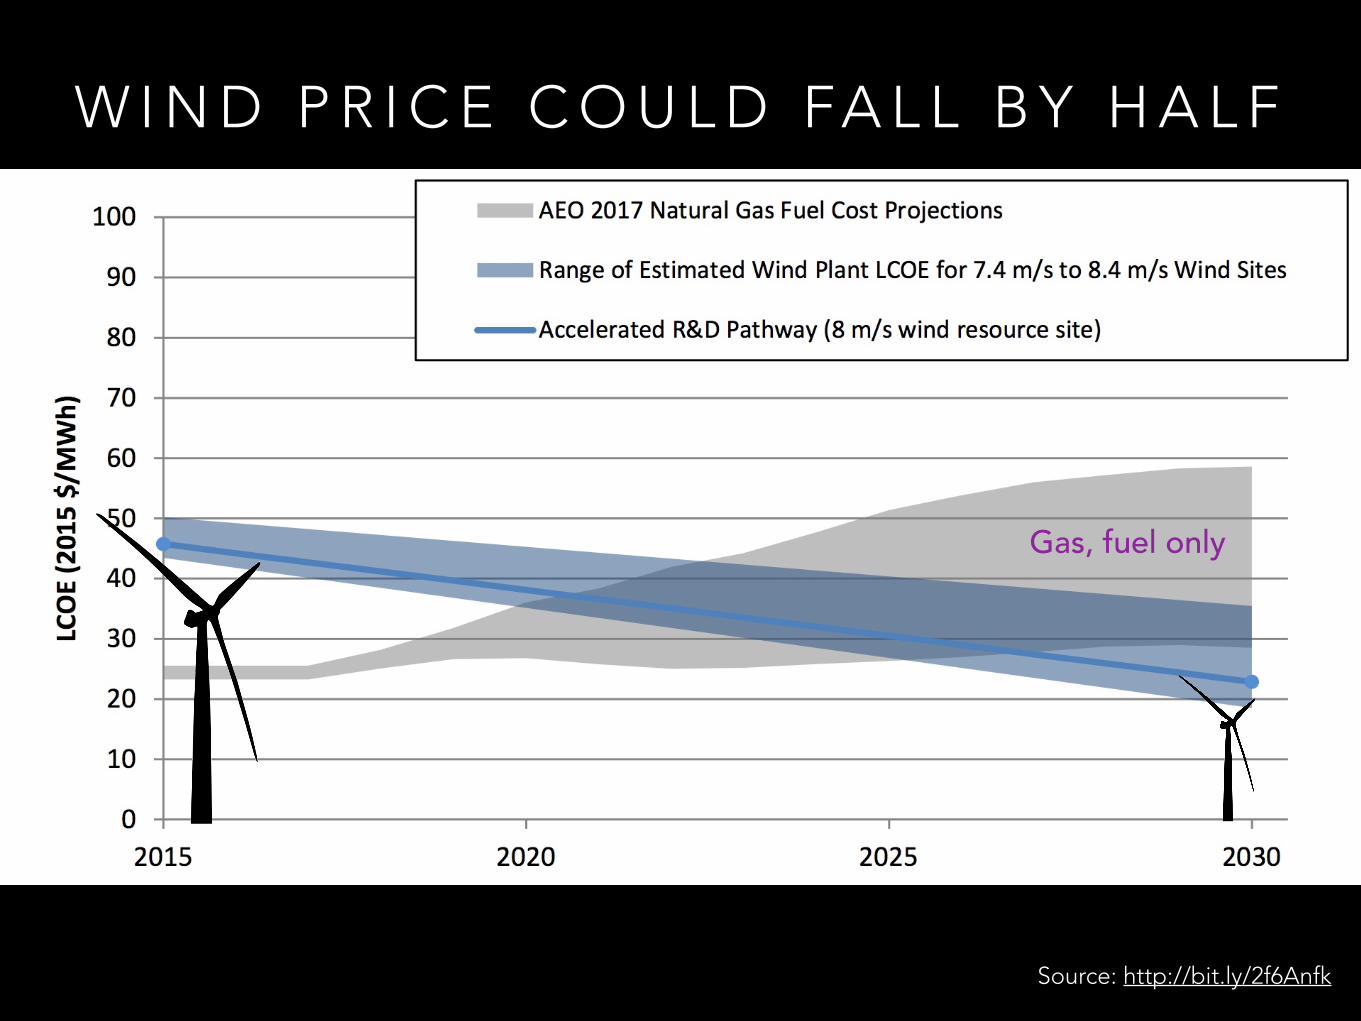
W I N D P R I C E C O U L D FA L L B Y H A L F
Gas, fuel only
Source: http://bit.ly/2f6Anfk

B AT T E R I E S A R E G E T T I N G C H E A P

B AT T E R I E S A R E G E T T I N G C H E A P
Actual

C H A N G E J U M P S B O U N D A R I E S

D O U B L E T H E R A N G E , S A M E P R I C E

E L E C T R I C V E H I C L E O W N E R S H I P 1 0 - Y E A R S AV I N G S
$0
$3,000
$6,000
$9,000
$12,000
$15,000
2017 Nissan Leaf v. Nissan Versa
10-year sched. maintenance savings
10-year fuel cost savings (est.)Battery replacement cost (est.)
Does not include typical repairs unique to gasoline cars, including
timing belts, water pumps, etc.

I T ’ S C O M I N G F O R Y O U R F U R N A C E …

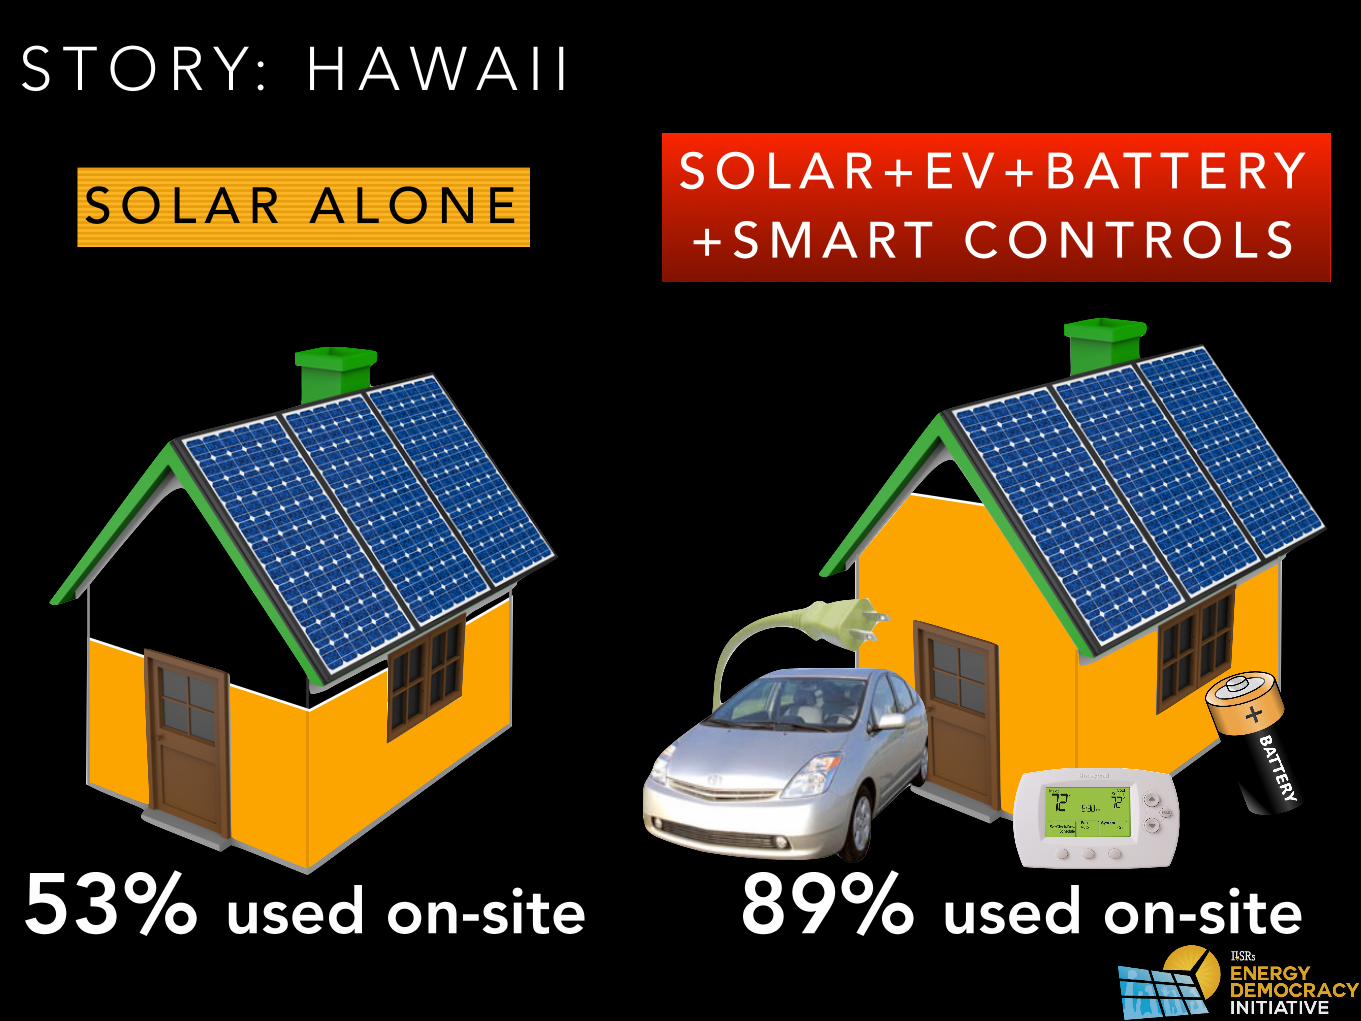
53% used on-site
S T O R Y: H A W A I I
S O L A R A L O N E S O L A R + E V + B AT T E R Y + S M A R T C O N T R O L S
89% used on-site
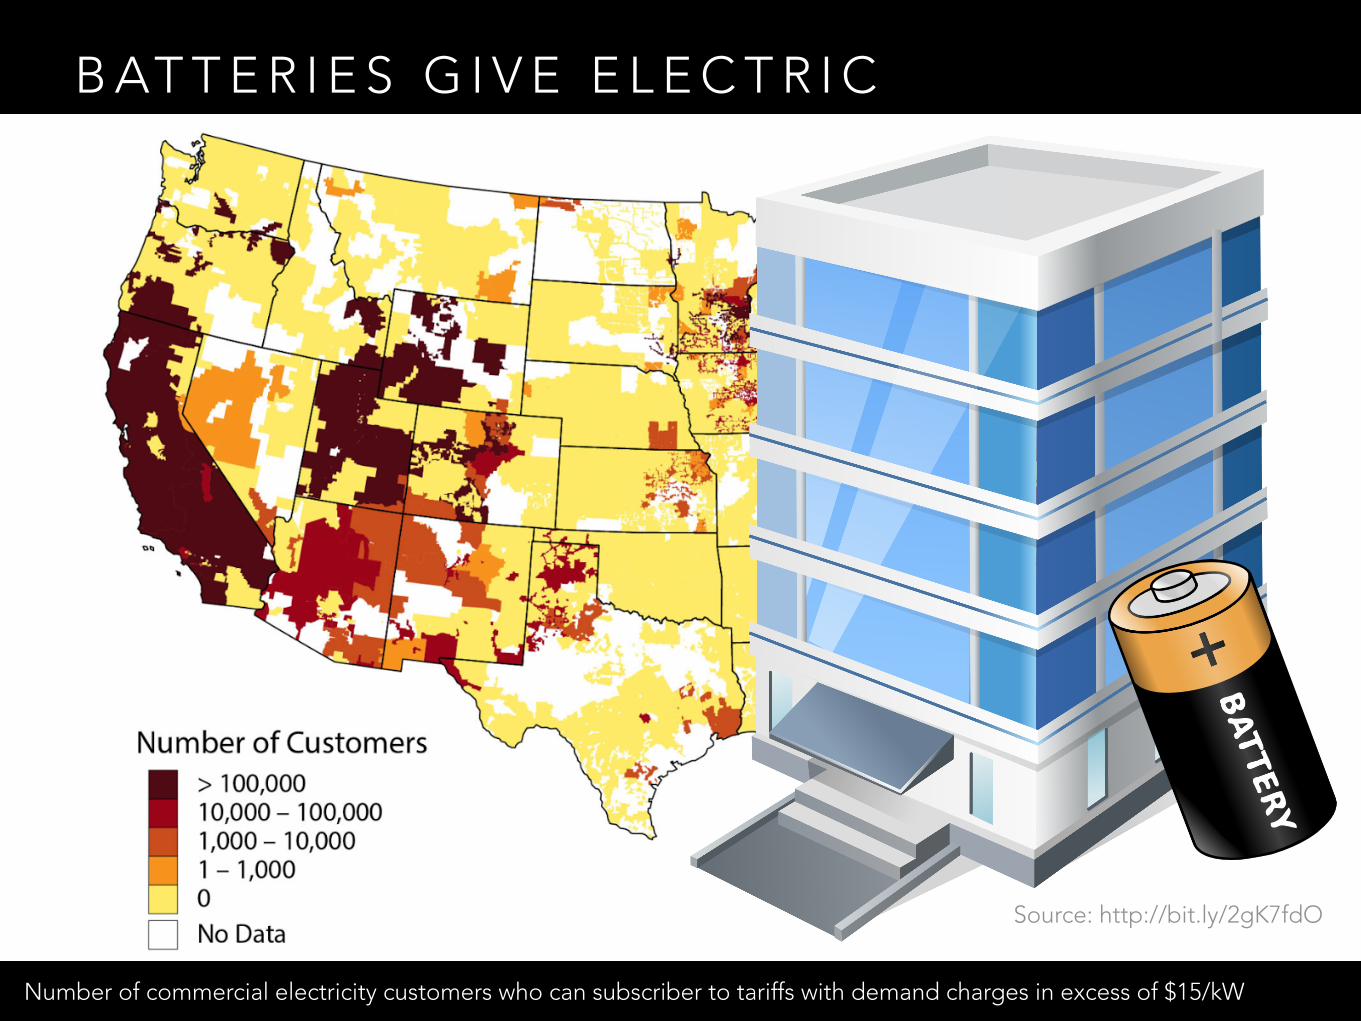
B AT T E R I E S G I V E E L E C T R I C C U S T O M E R S C H O I C E
Number of commercial electricity customers who can subscriber to tariffs with demand charges in excess of $15/kW
Source: http://bit.ly/2gK7fdO

W H O W I L L L E A D ?
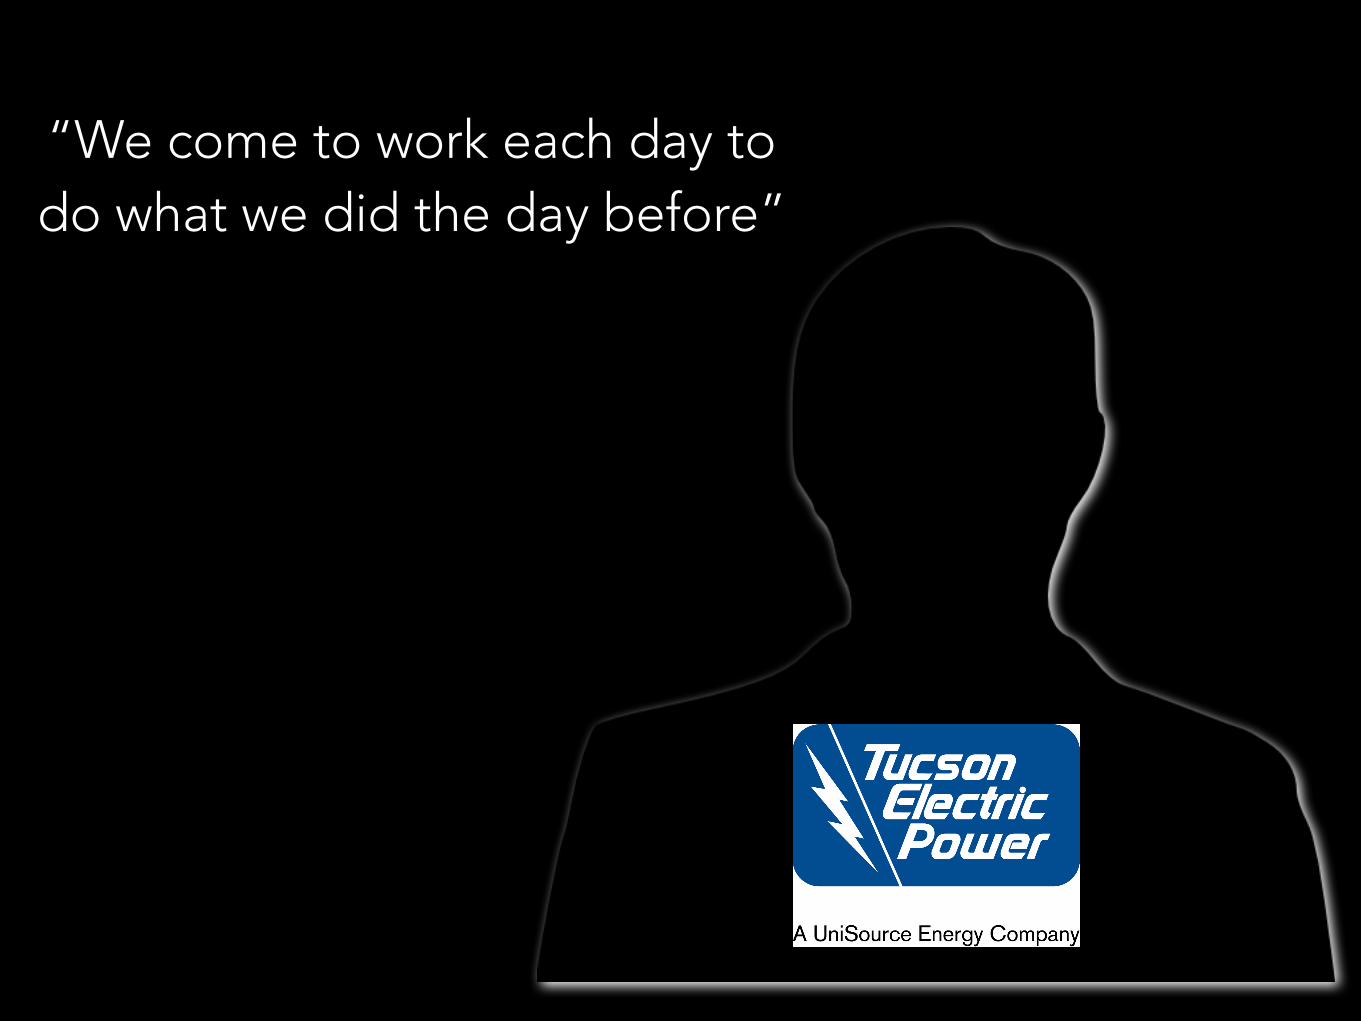
“We come to work each day to do what we did the day before”
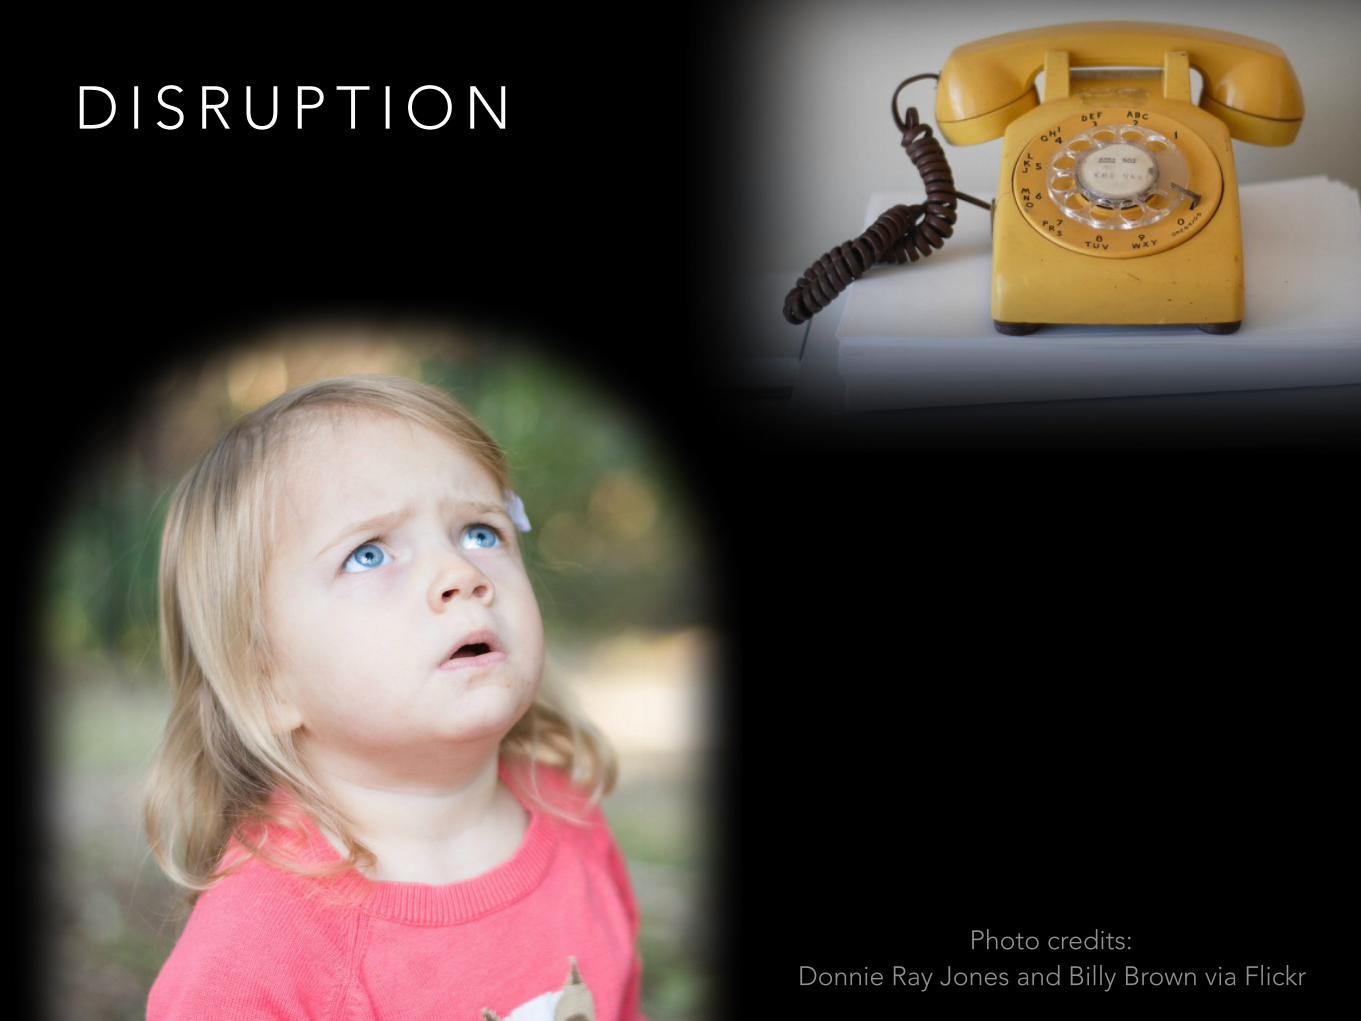
D I S R U P T I O N
Photo credits: Donnie Ray Jones and Billy Brown via Flickr
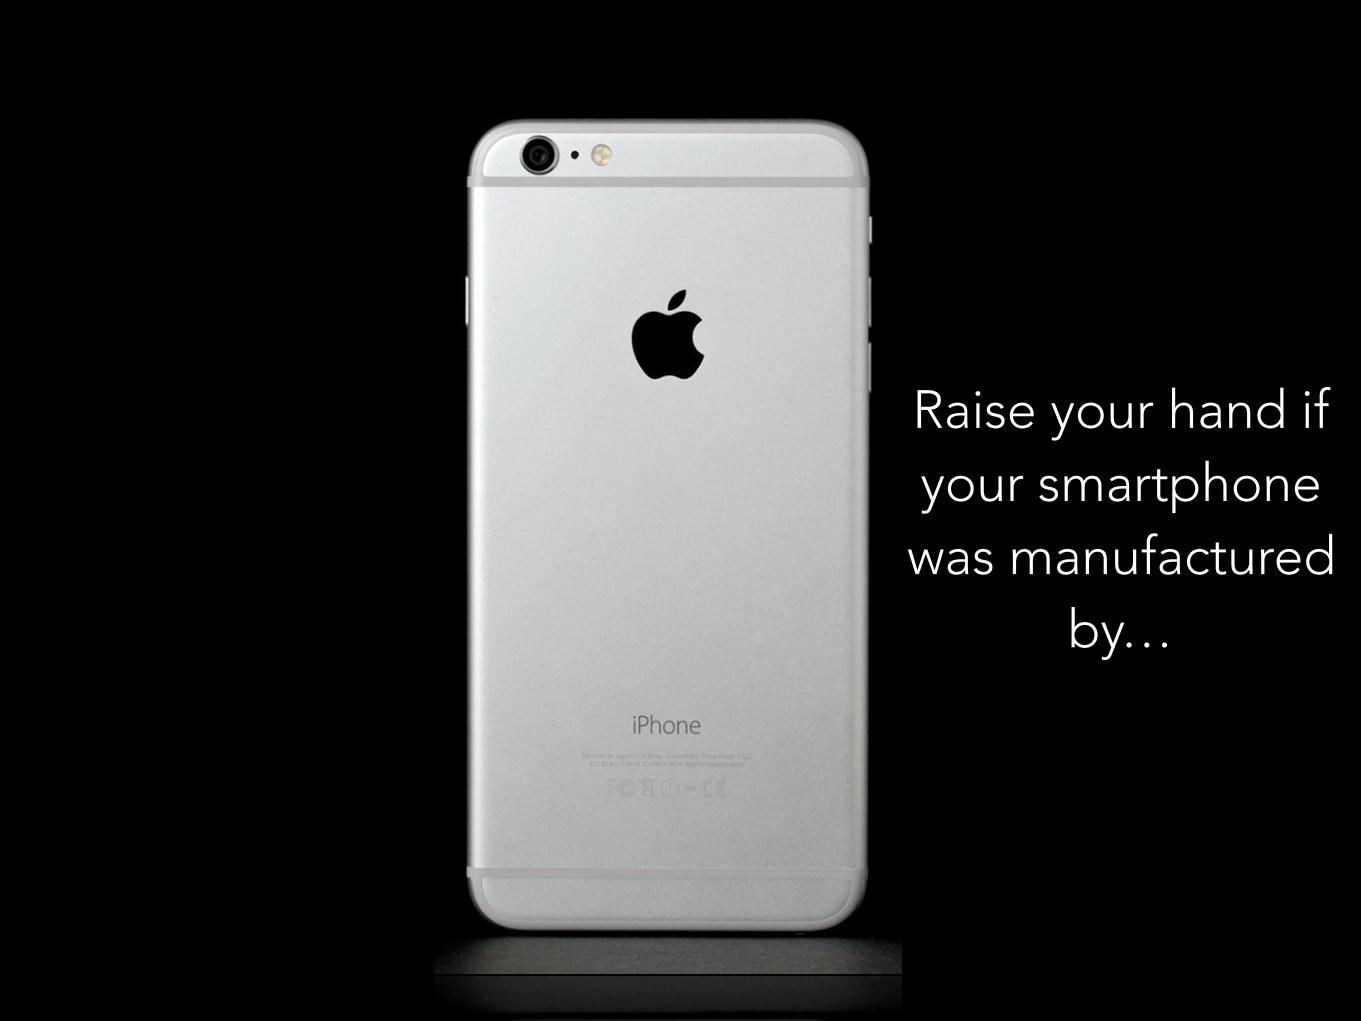
S M A R T P H O N E I M A G E
Raise your hand if your smartphone was manufactured
by…

…your landline phone company?
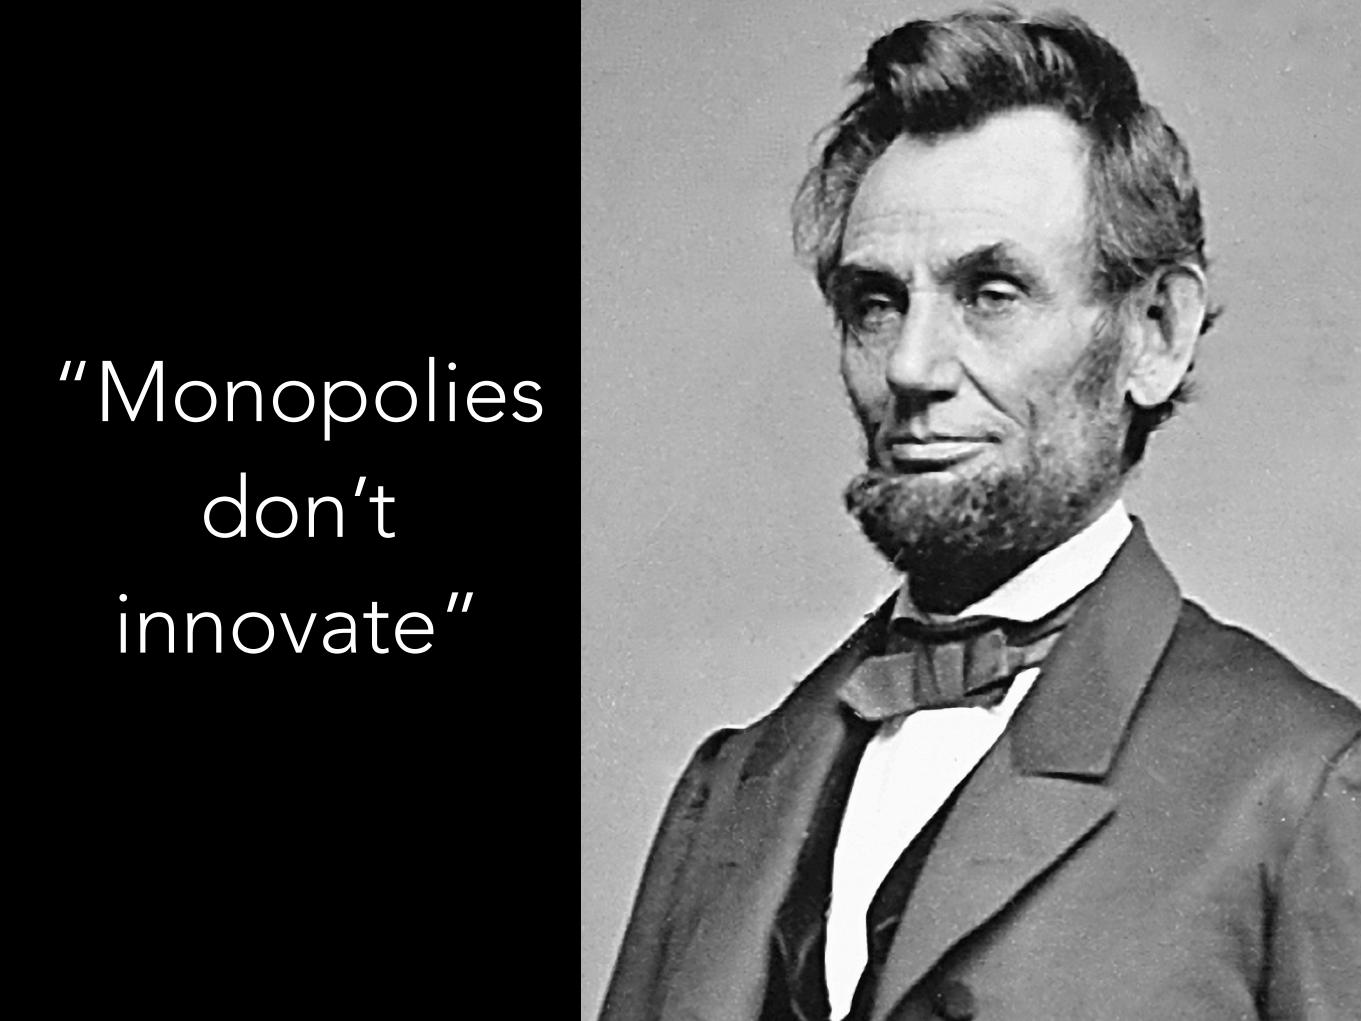
“Monopolies don’t
innovate”
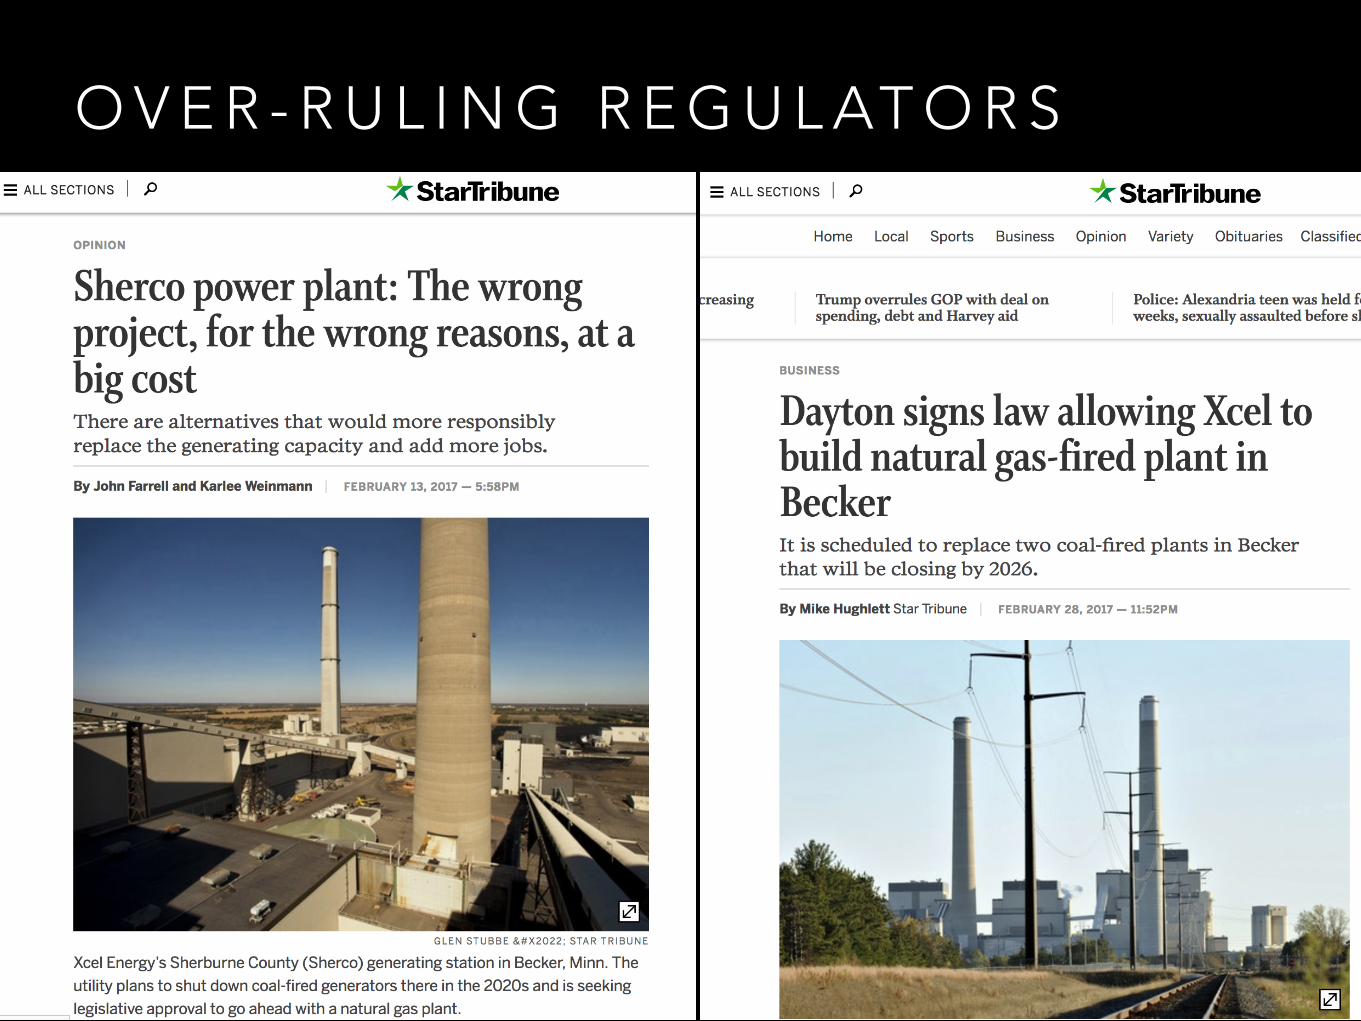
O V E R - R U L I N G R E G U L AT O R S
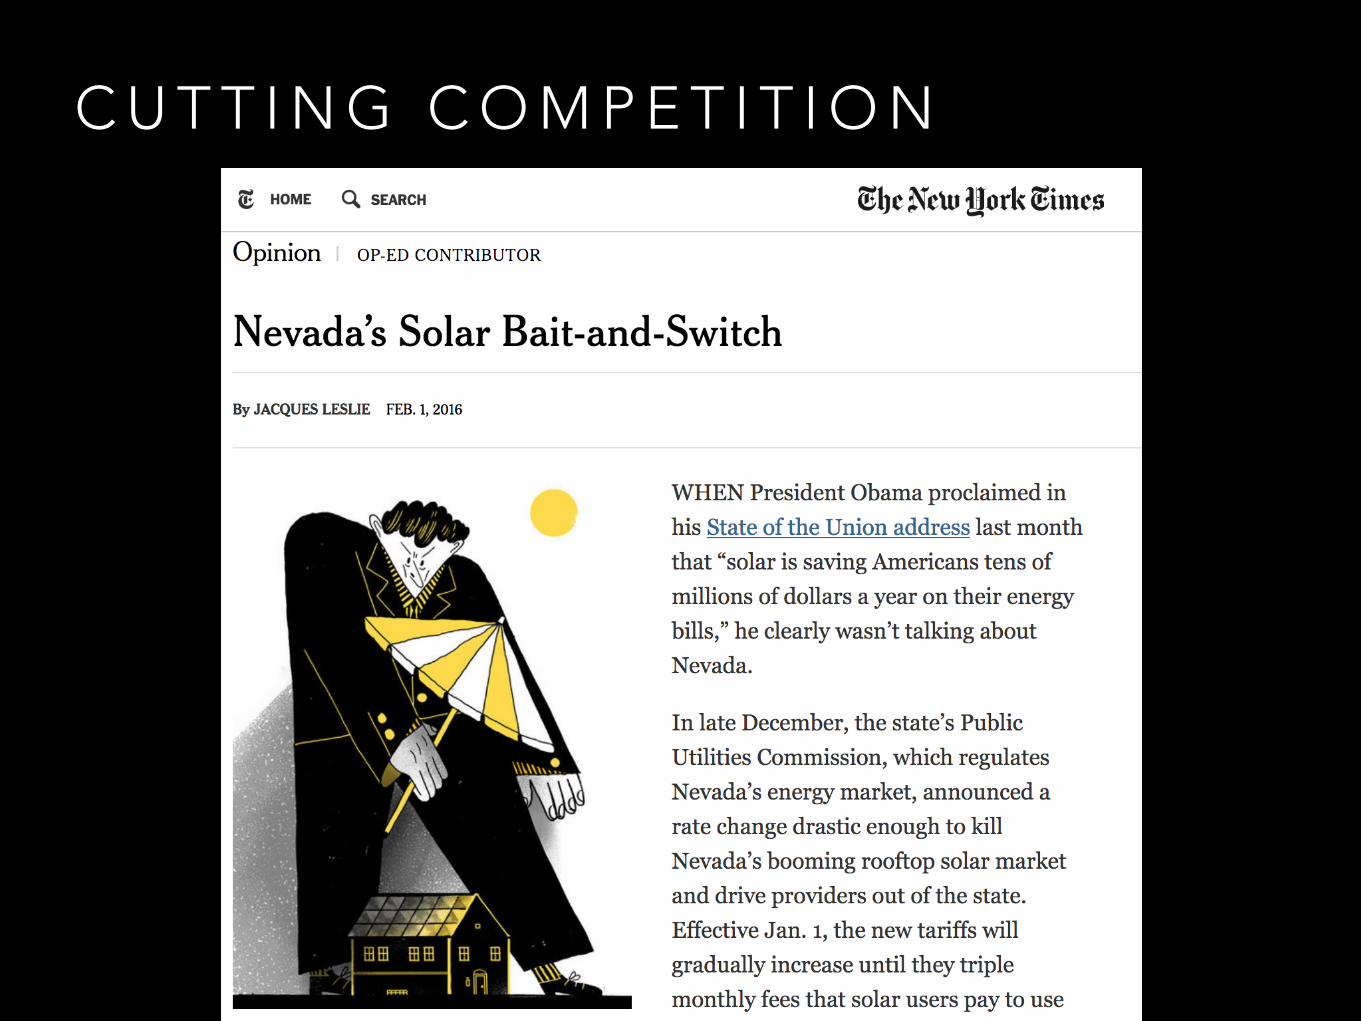
C U T T I N G C O M P E T I T I O N
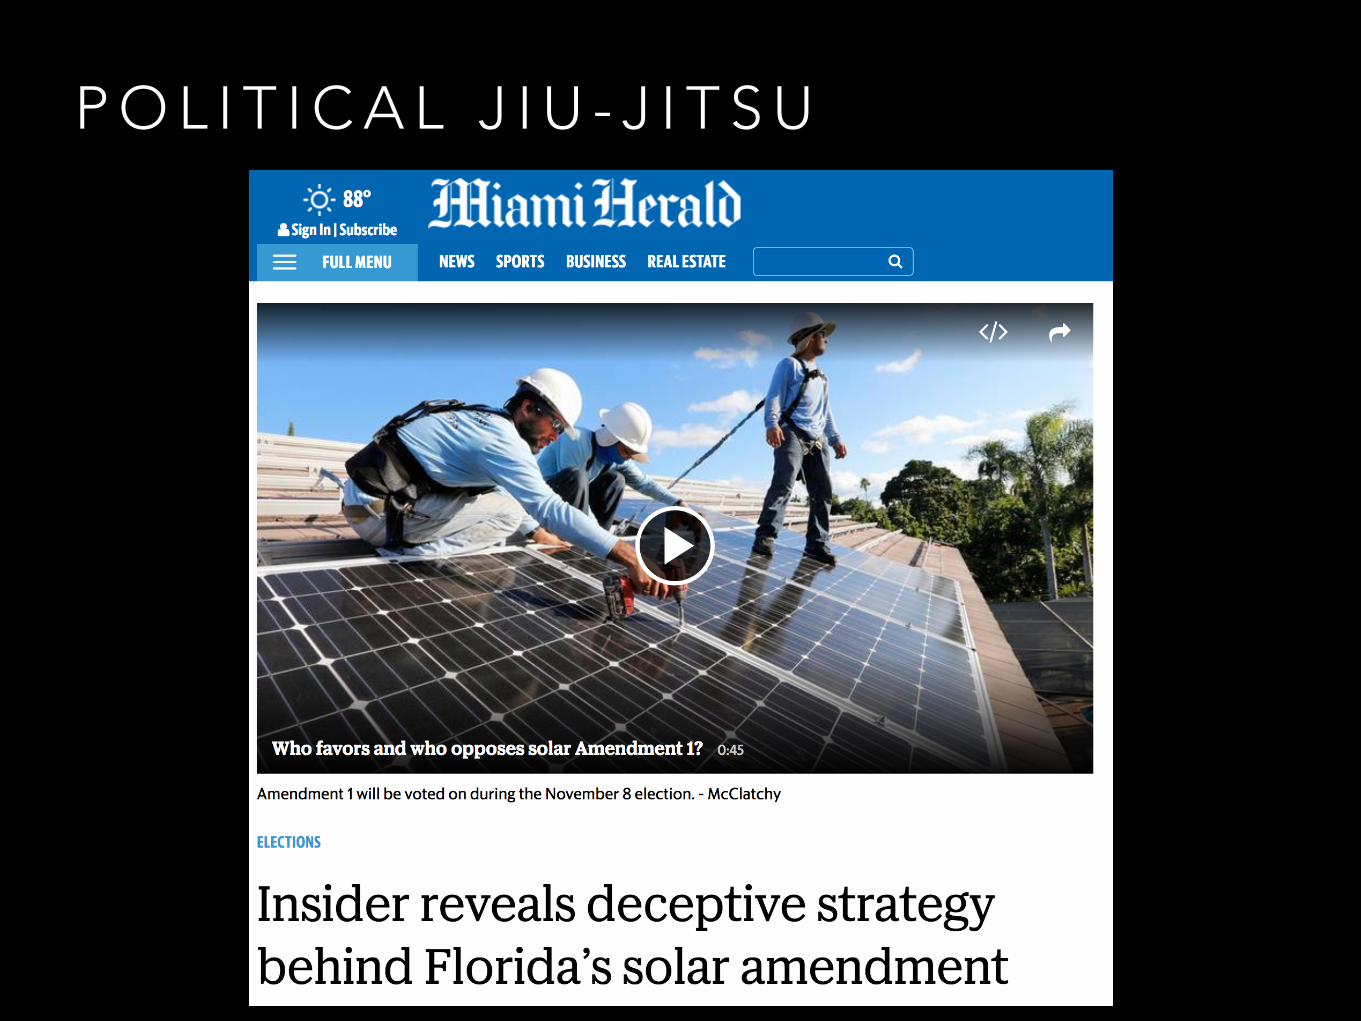
P O L I T I C A L J I U - J I T S U
S T O R Y: K I T C A R S O N E L E C T R I C C O O P E R AT I V E
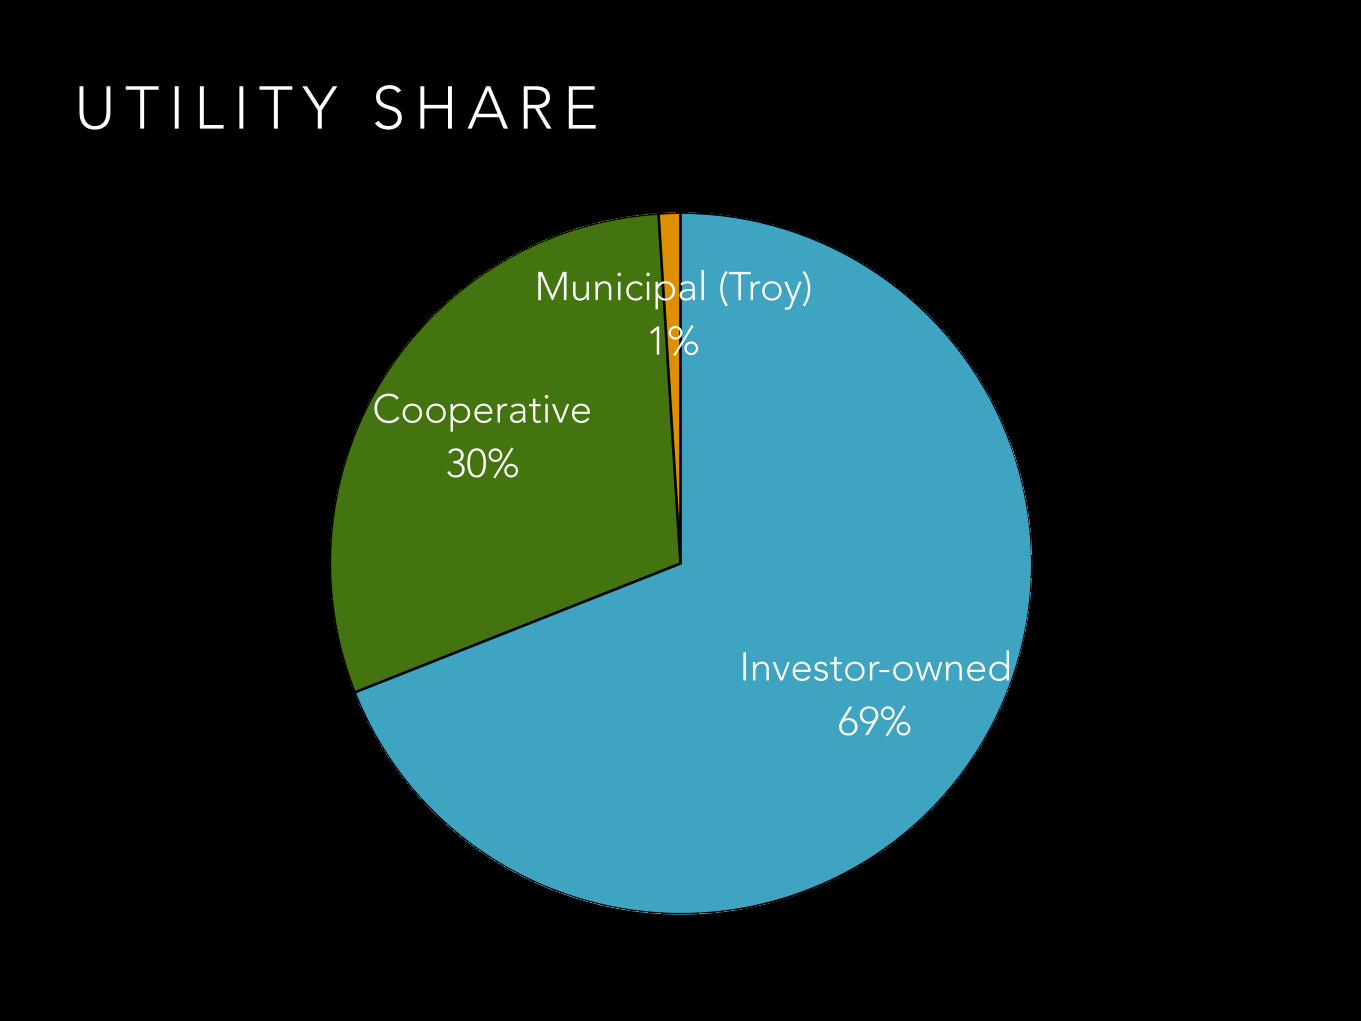
U T I L I T Y S H A R E
Municipal (Troy)1%
Cooperative30%
Investor-owned69%
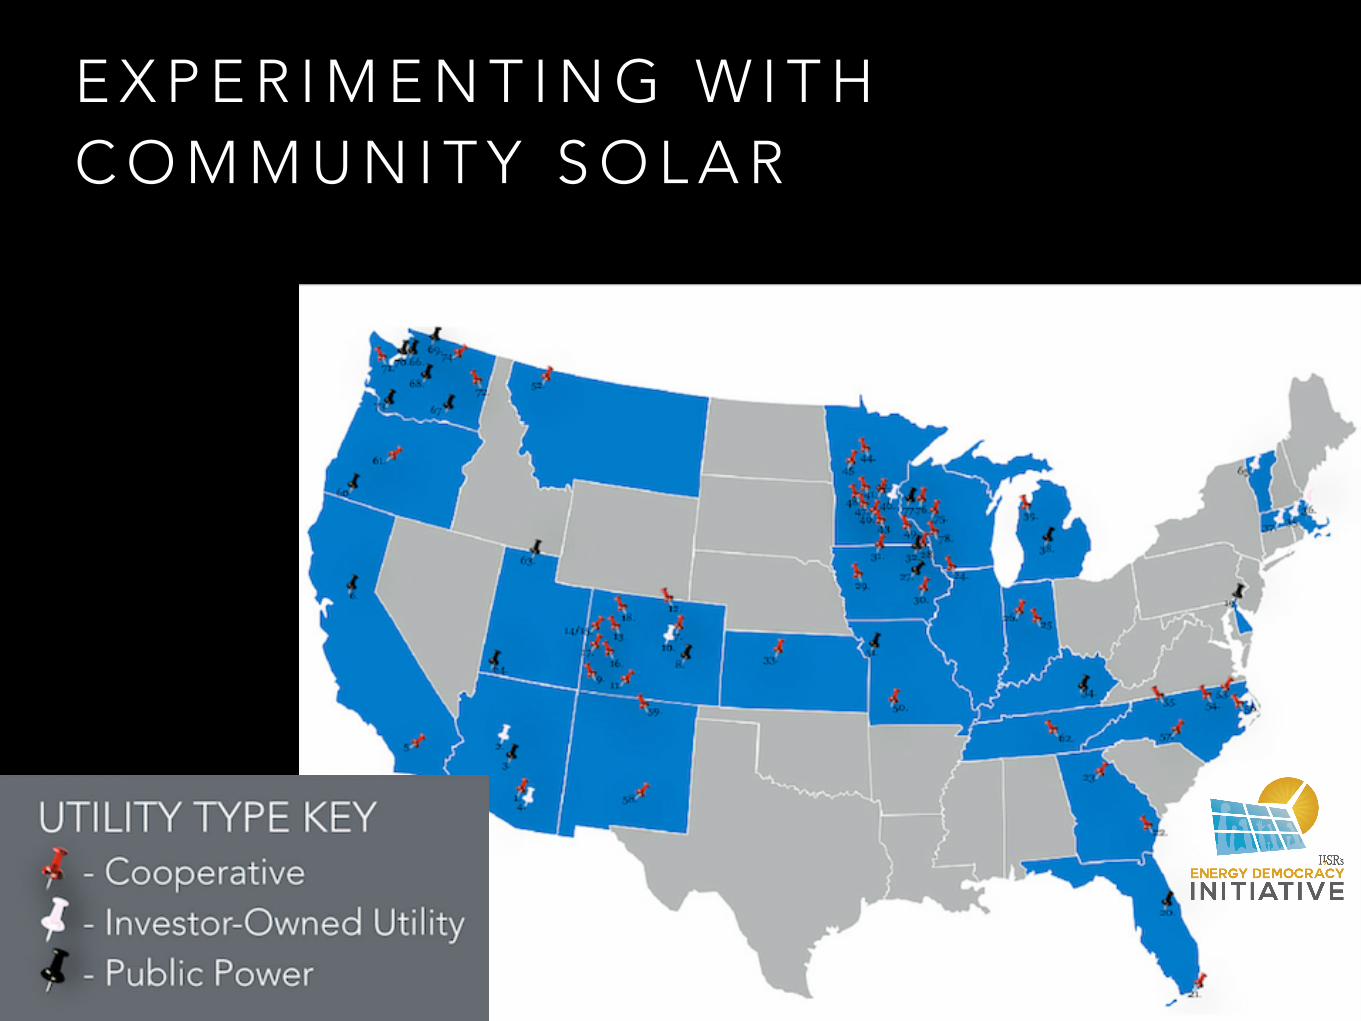
E X P E R I M E N T I N G W I T H C O M M U N I T Y S O L A R

E X P E R I M E N T I N G W I T H C O M M U N I T Y S O L A R
Source: ILSR’s Community Power Map
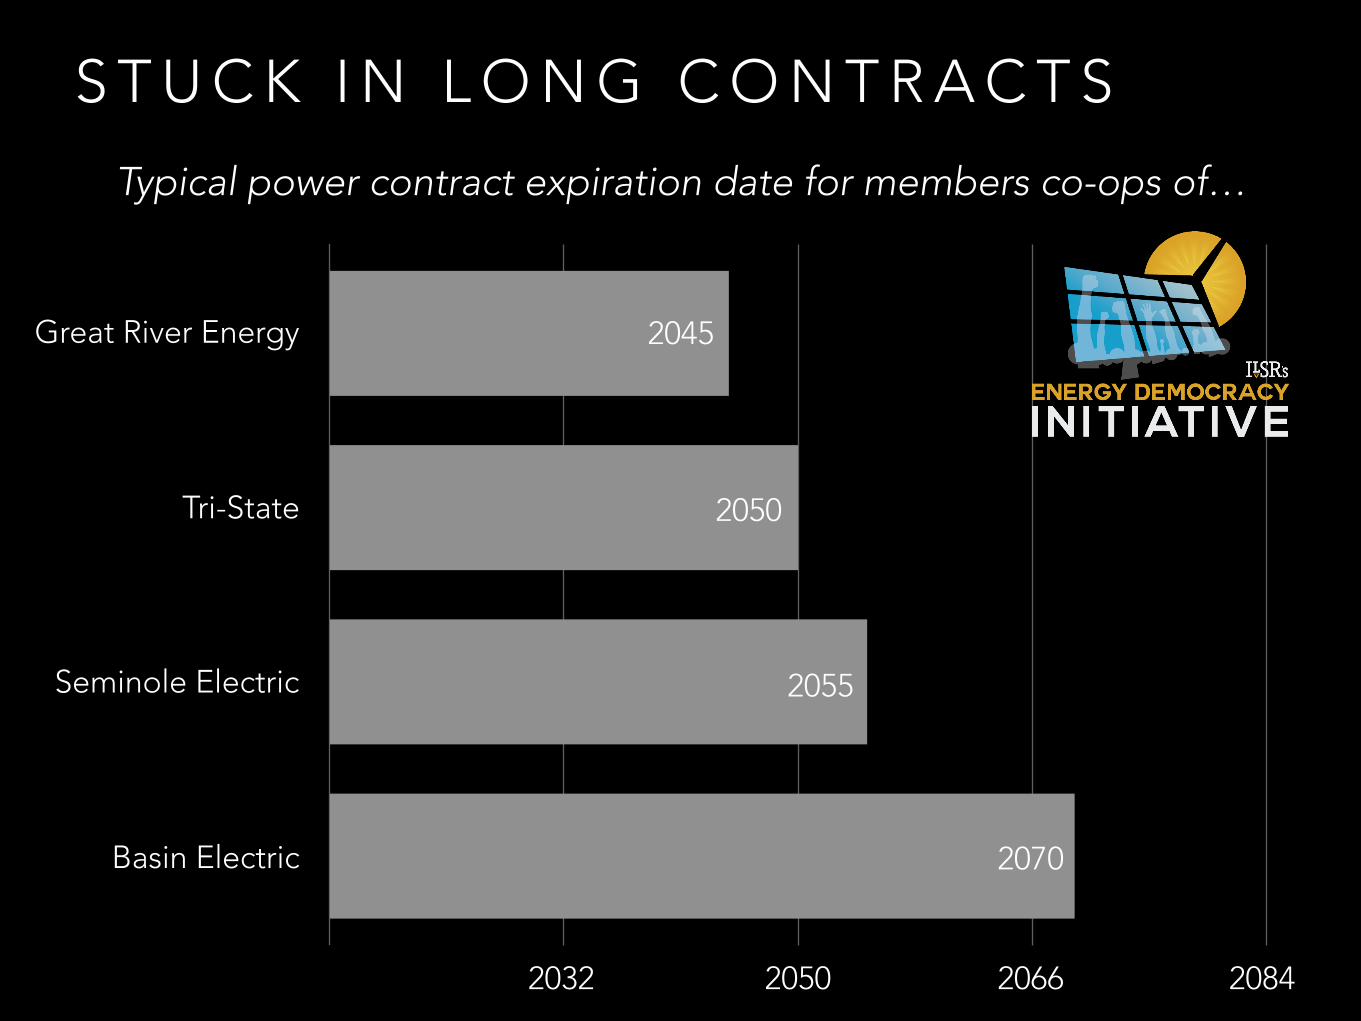
S T U C K I N L O N G C O N T R A C T S
Great River Energy
Tri-State
Seminole Electric
Basin Electric
Expiration date
0 17 34 51 6820502032 2084
Typical power contract expiration date for members co-ops of…
2066
2045
2050
2055
2070
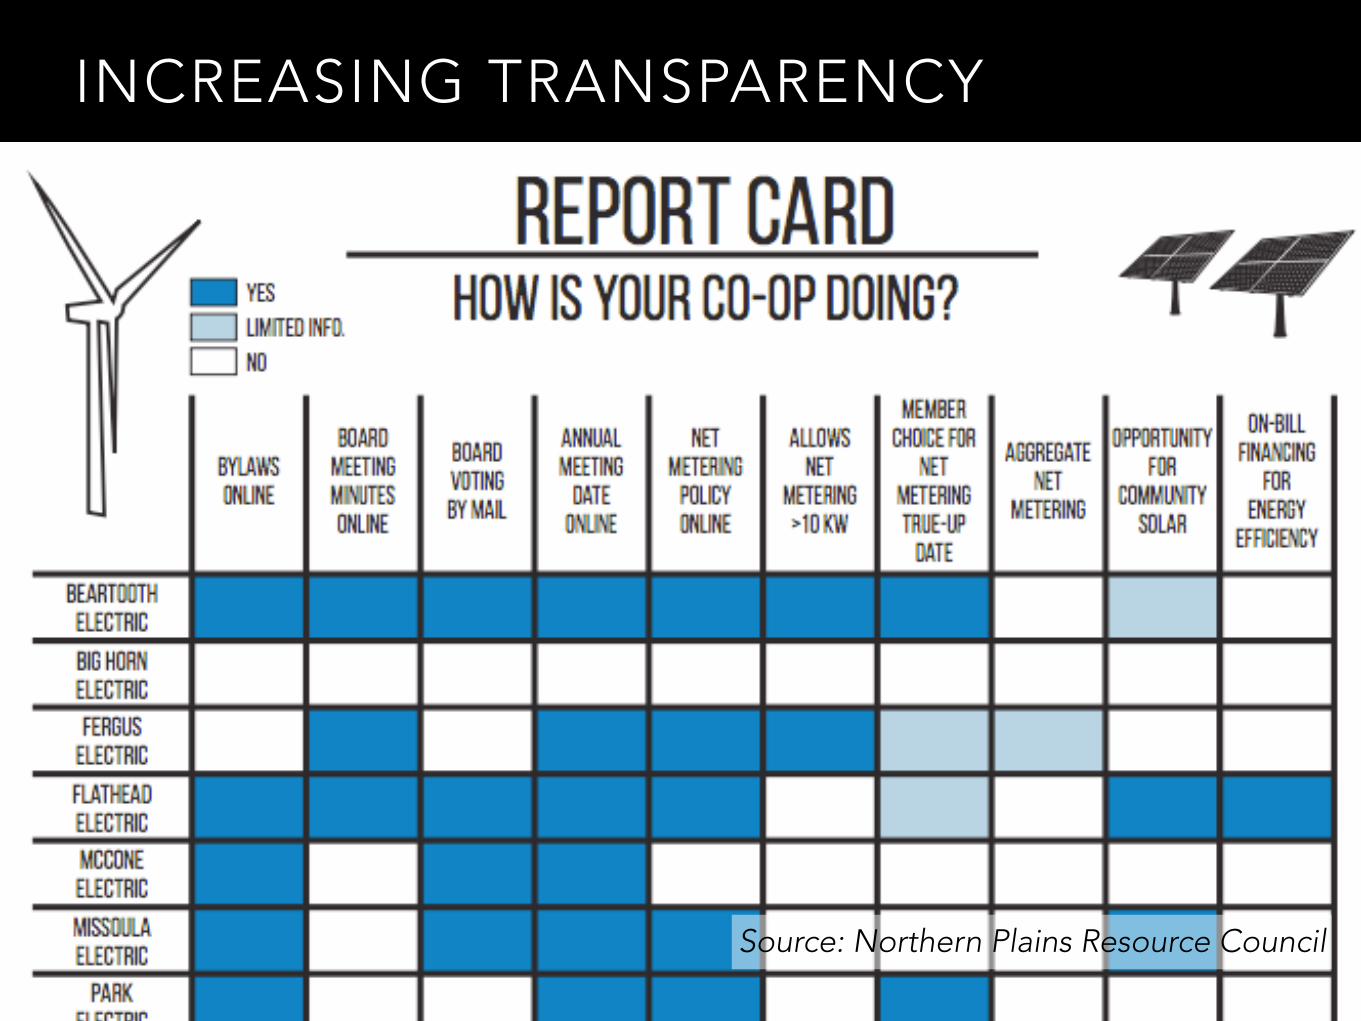
INCREASING TRANSPARENCY
Source: Northern Plains Resource Council

3 W AY S Y O U C A N L E A D

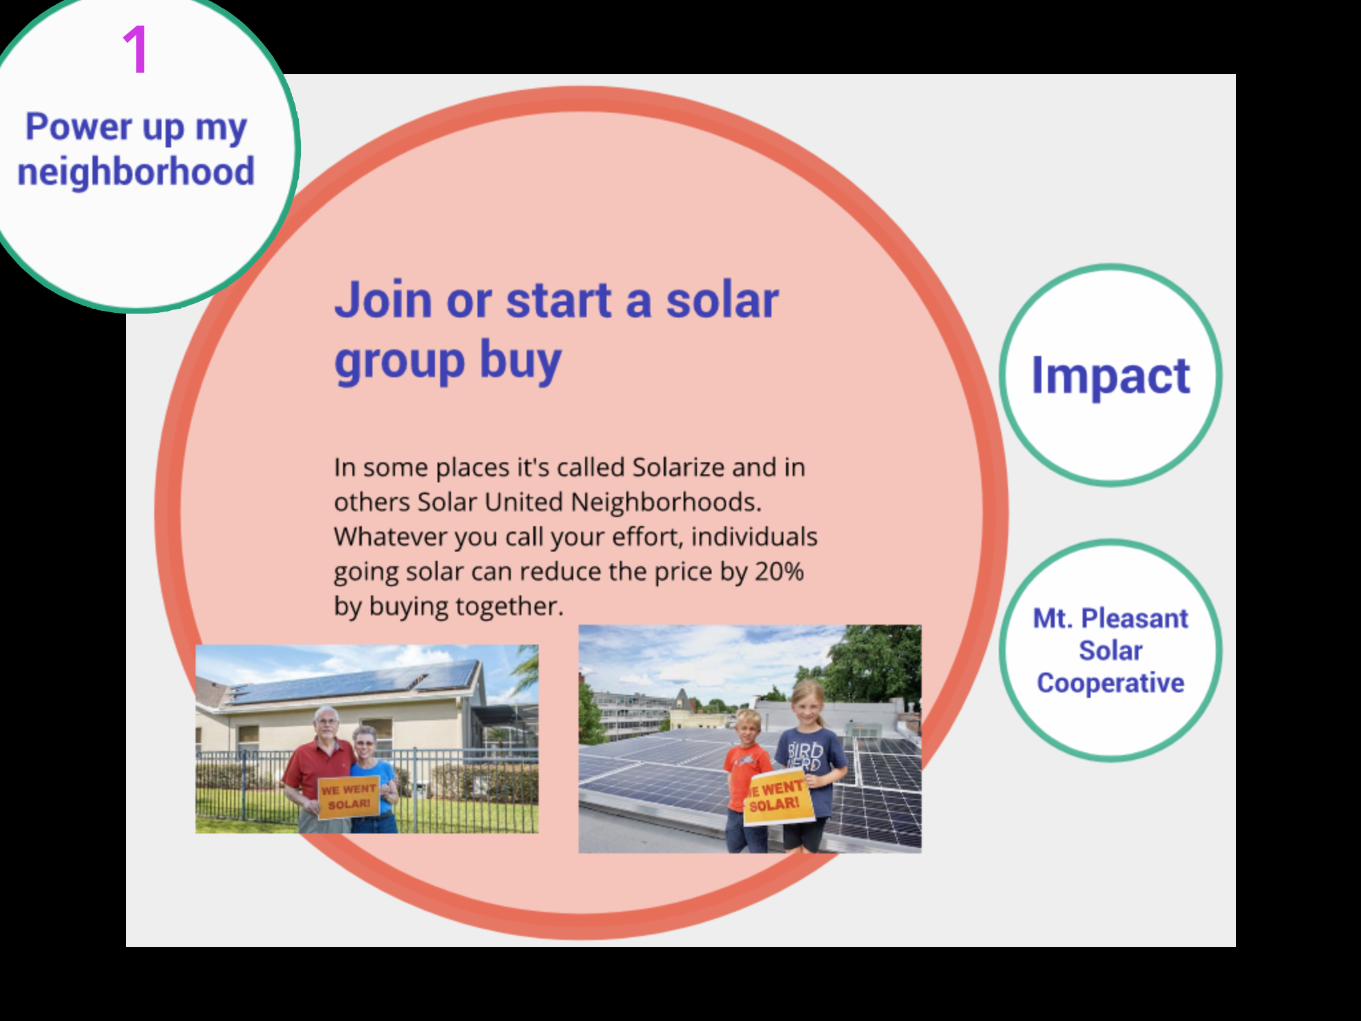
1
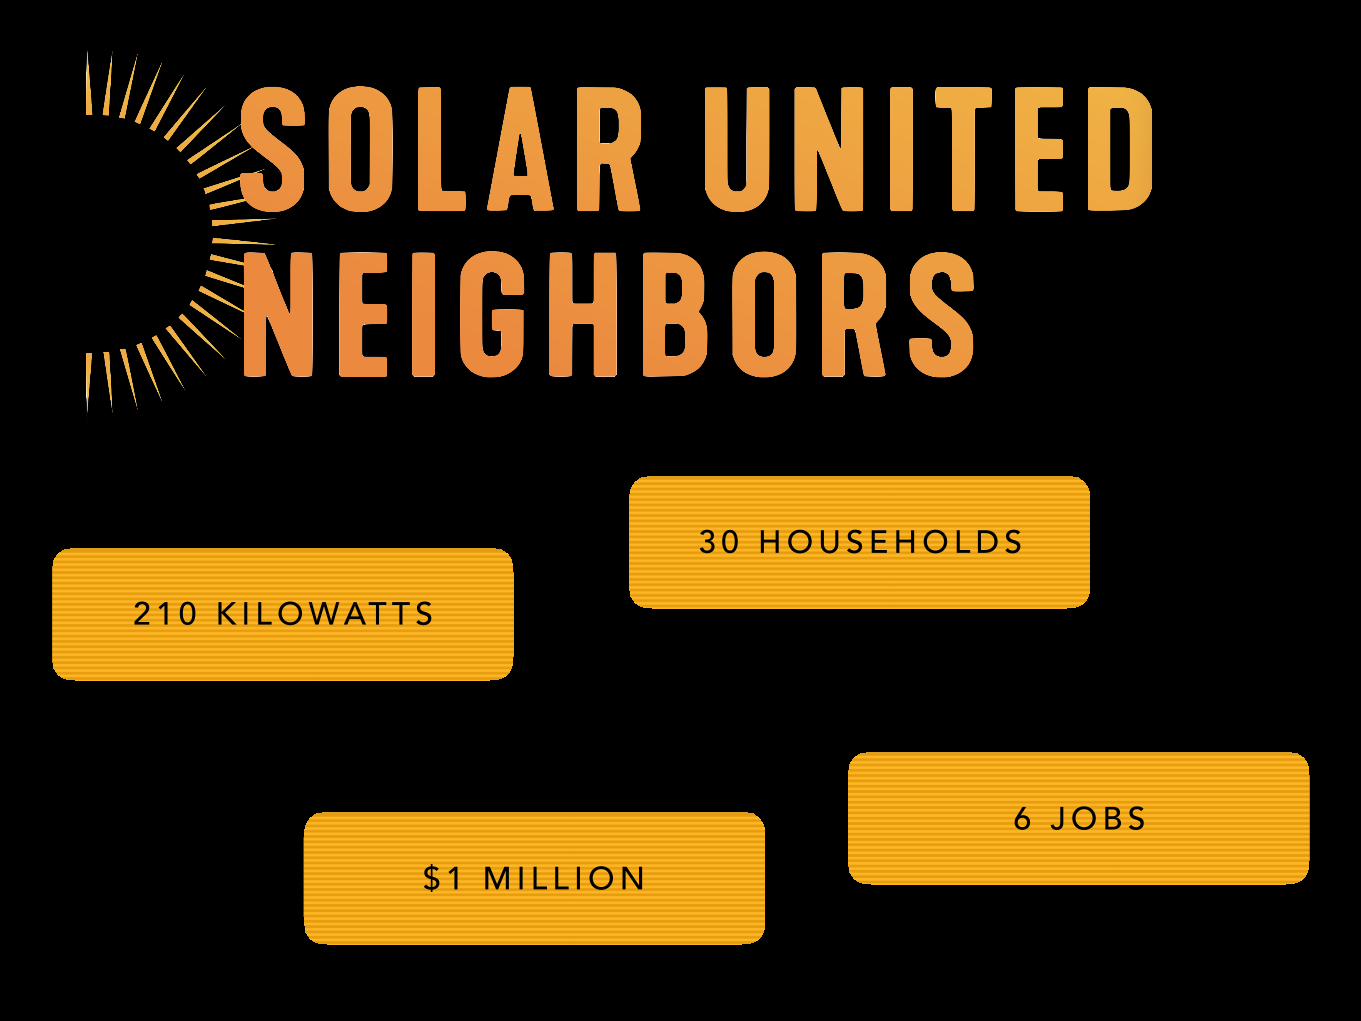
3 0 H O U S E H O L D S
2 1 0 K I L O WAT T S
6 J O B S$ 1 M I L L I O N

2

Commission-approved tariffsExisting programs
Midwest Energy
NH Elec. Co-op
Roanoke Elec. Co-op
How$mart KY
Several co-ops offer inclusive energy financing
Central Elec. PowerOuachita Electric
Clean Energy Works Portland

3


S T O R Y: M I N N E A P O L I S
W R A P U P ! N E T M E T E R I N G S T O R Y

1 9 7 9

S U R P R I S E !
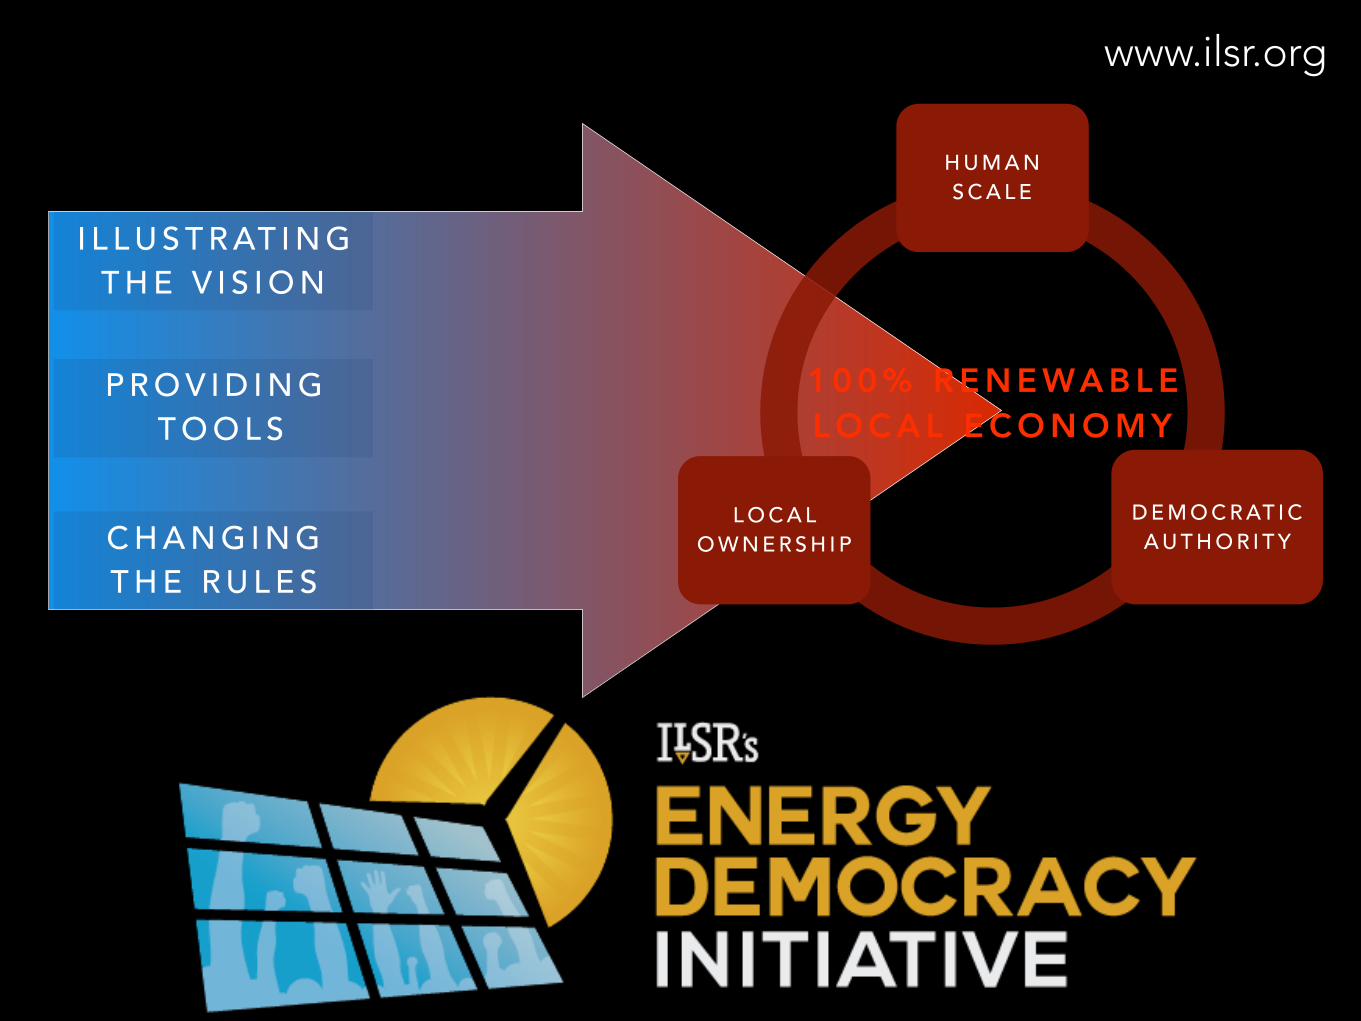
www.ilsr.org
C H A N G I N G T H E R U L E S
P R O V I D I N G T O O L S
1 0 0 % R E N E WA B L E L O C A L E C O N O M Y
H U M A N S C A L E
L O C A L O W N E R S H I P
D E M O C R AT I C A U T H O R I T Y
I L L U S T R AT I N G T H E V I S I O N

BeyondSharing:HowCommunitiesCanTakeOwnershipofRenewablePowerThe electric utility monopoly is breaking up, but will new companies make renewable energy become another form of wealth extraction or can community renewable energy enable communities to capture their renewable power?
John FarrellApril 2016
www.ilsr.org
R E A D O U R R E P O R T S
R E A D M O R E
@johnffarrellF O L L O W