Embed Size (px)
Citation preview

1
CHAPTER 1
2
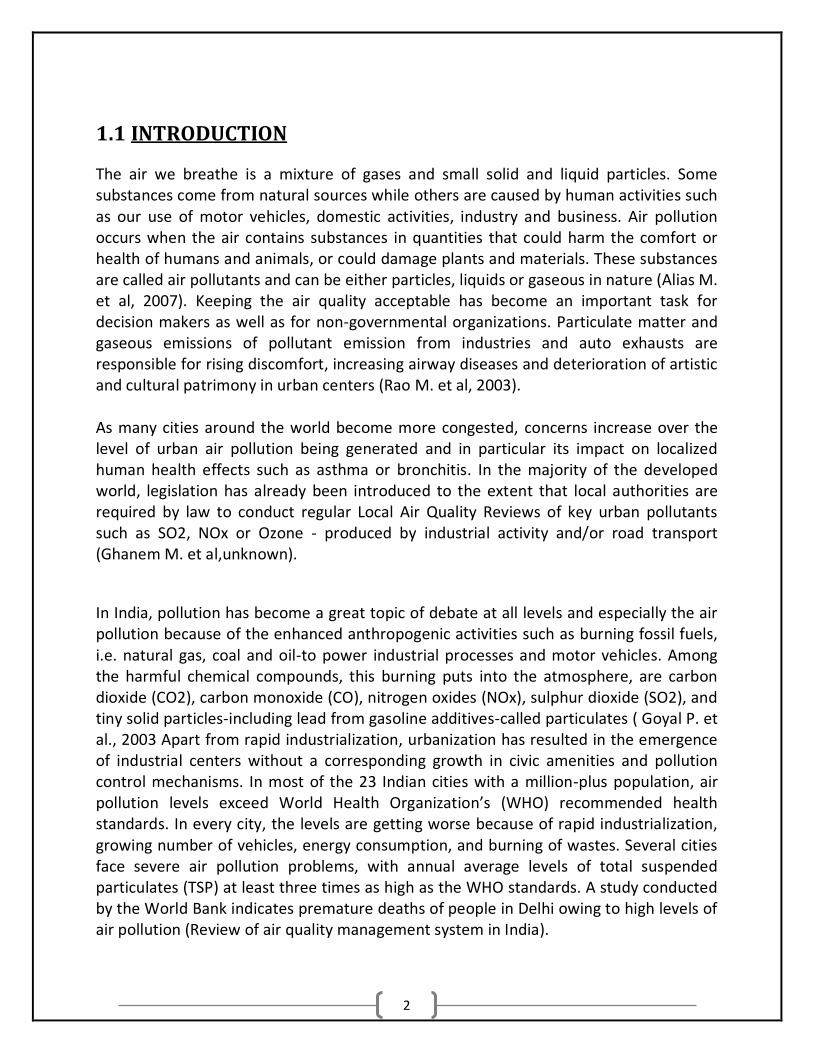
1.1 INTRODUCTION
The air we breathe is a mixture of gases and small solid and liquid particles. Some substances come from natural sources while others are caused by human activities such as our use of motor vehicles, domestic activities, industry and business. Air pollution occurs when the air contains substances in quantities that could harm the comfort or health of humans and animals, or could damage plants and materials. These substances are called air pollutants and can be either particles, liquids or gaseous in nature (Alias M. et al, 2007). Keeping the air quality acceptable has become an important task for decision makers as well as for non-governmental organizations. Particulate matter and gaseous emissions of pollutant emission from industries and auto exhausts are responsible for rising discomfort, increasing airway diseases and deterioration of artistic and cultural patrimony in urban centers (Rao M. et al, 2003). As many cities around the world become more congested, concerns increase over the level of urban air pollution being generated and in particular its impact on localized human health effects such as asthma or bronchitis. In the majority of the developed world, legislation has already been introduced to the extent that local authorities are required by law to conduct regular Local Air Quality Reviews of key urban pollutants such as SO2, NOx or Ozone - produced by industrial activity and/or road transport (Ghanem M. et al,unknown).
In India, pollution has become a great topic of debate at all levels and especially the air pollution because of the enhanced anthropogenic activities such as burning fossil fuels, i.e. natural gas, coal and oil-to power industrial processes and motor vehicles. Among the harmful chemical compounds, this burning puts into the atmosphere, are carbon dioxide (CO2), carbon monoxide (CO), nitrogen oxides (NOx), sulphur dioxide (SO2), and tiny solid particles-including lead from gasoline additives-called particulates ( Goyal P. et al., 2003 Apart from rapid industrialization, urbanization has resulted in the emergence of industrial centers without a corresponding growth in civic amenities and pollution control mechanisms. In most of the 23 Indian cities with a million-plus population, air pollution levels exceed World Health Organization’s (WHO) recommended health standards. In every city, the levels are getting worse because of rapid industrialization, growing number of vehicles, energy consumption, and burning of wastes. Several cities face severe air pollution problems, with annual average levels of total suspended particulates (TSP) at least three times as high as the WHO standards. A study conducted by the World Bank indicates premature deaths of people in Delhi owing to high levels of air pollution (Review of air quality management system in India).
3
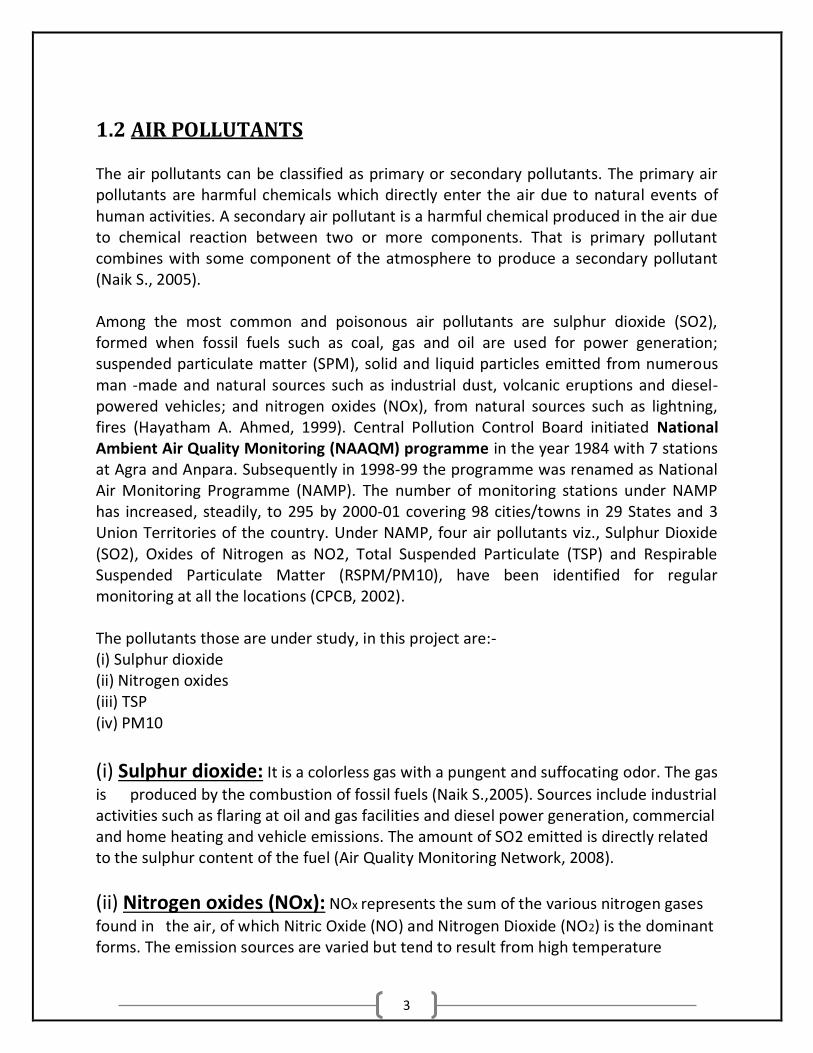
1.2 AIR POLLUTANTS The air pollutants can be classified as primary or secondary pollutants. The primary air pollutants are harmful chemicals which directly enter the air due to natural events of human activities. A secondary air pollutant is a harmful chemical produced in the air due to chemical reaction between two or more components. That is primary pollutant combines with some component of the atmosphere to produce a secondary pollutant (Naik S., 2005). Among the most common and poisonous air pollutants are sulphur dioxide (SO2), formed when fossil fuels such as coal, gas and oil are used for power generation; suspended particulate matter (SPM), solid and liquid particles emitted from numerous man -made and natural sources such as industrial dust, volcanic eruptions and diesel-powered vehicles; and nitrogen oxides (NOx), from natural sources such as lightning, fires (Hayatham A. Ahmed, 1999). Central Pollution Control Board initiated National Ambient Air Quality Monitoring (NAAQM) programme in the year 1984 with 7 stations at Agra and Anpara. Subsequently in 1998-99 the programme was renamed as National Air Monitoring Programme (NAMP). The number of monitoring stations under NAMP has increased, steadily, to 295 by 2000-01 covering 98 cities/towns in 29 States and 3 Union Territories of the country. Under NAMP, four air pollutants viz., Sulphur Dioxide (SO2), Oxides of Nitrogen as NO2, Total Suspended Particulate (TSP) and Respirable Suspended Particulate Matter (RSPM/PM10), have been identified for regular monitoring at all the locations (CPCB, 2002). The pollutants those are under study, in this project are:- (i) Sulphur dioxide (ii) Nitrogen oxides (iii) TSP (iv) PM10
(i) Sulphur dioxide: It is a colorless gas with a pungent and suffocating odor. The gas
is produced by the combustion of fossil fuels (Naik S.,2005). Sources include industrial activities such as flaring at oil and gas facilities and diesel power generation, commercial and home heating and vehicle emissions. The amount of SO2 emitted is directly related to the sulphur content of the fuel (Air Quality Monitoring Network, 2008).
(ii) Nitrogen oxides (NOx): NOx represents the sum of the various nitrogen gases
found in the air, of which Nitric Oxide (NO) and Nitrogen Dioxide (NO2) is the dominant forms. The emission sources are varied but tend to result from high temperature

4
combustion of fuel for industrial activities, commercial and residential heating, and vehicle use. Forest fires can be a large natural source of NOx (Air Quality Monitoring Network, 2008).
(iii) Suspended particulate matter (TSP): TSP refers to particles ranging in size
from the smallest to a generally accepted upper limit of 50-100 microns in diameter (1 micron = 1 millionth of a meter). TSP is dominated by the larger sized particles commonly referred to as “dust” and is associated with aesthetic and environmental impacts such as soiling of materials or smothering of vegetation (Air Quality Monitoring Network, 2008). The entire domain of particulate matter is known as Total Suspended Particulate, TSP (IPCC, 2001). This includes all airborne solid and liquid particles, except pure water, ranging in size from approximately 0.005mm to 100mm in diameter (Balaceanu C. et al., 2004).
(iv) PM10: Particulate matter is a ubiquitous pollutant, reflecting the fact that it has
both nature and anthropogenic sources. Natural sources of primary PM include windblown soil and mineral particles, volcanic dust, sea salt spray, biological material such as pollen, spores and bacteria and debris from forest fires (National Ambient Air Quality Objectives for Particulate matter, 1998). PM10 refers to particulate matter that is 10 μm or less in diameter. PM10 is generally subdivided into a fine fraction of particles 2.5 μm or less (PM2.5), and a coarse fraction of particles larger than 2.5 μm (National Ambient Air Quality Objectives For Particulate matter, 1998). In the atmosphere the particulate matters (PMs) may be classed as either primary or secondary. Primary particles are those such as carbon particles from combustion, mineral particles derived from stone abrasion, and sea salt. Secondary particles are those that are formed in the atmosphere by the chemical reaction of the gases, which combine to form less volatile compounds that then condense into particles (Balaceanu C. et al, 2004).

5
CHAPTER 2
6
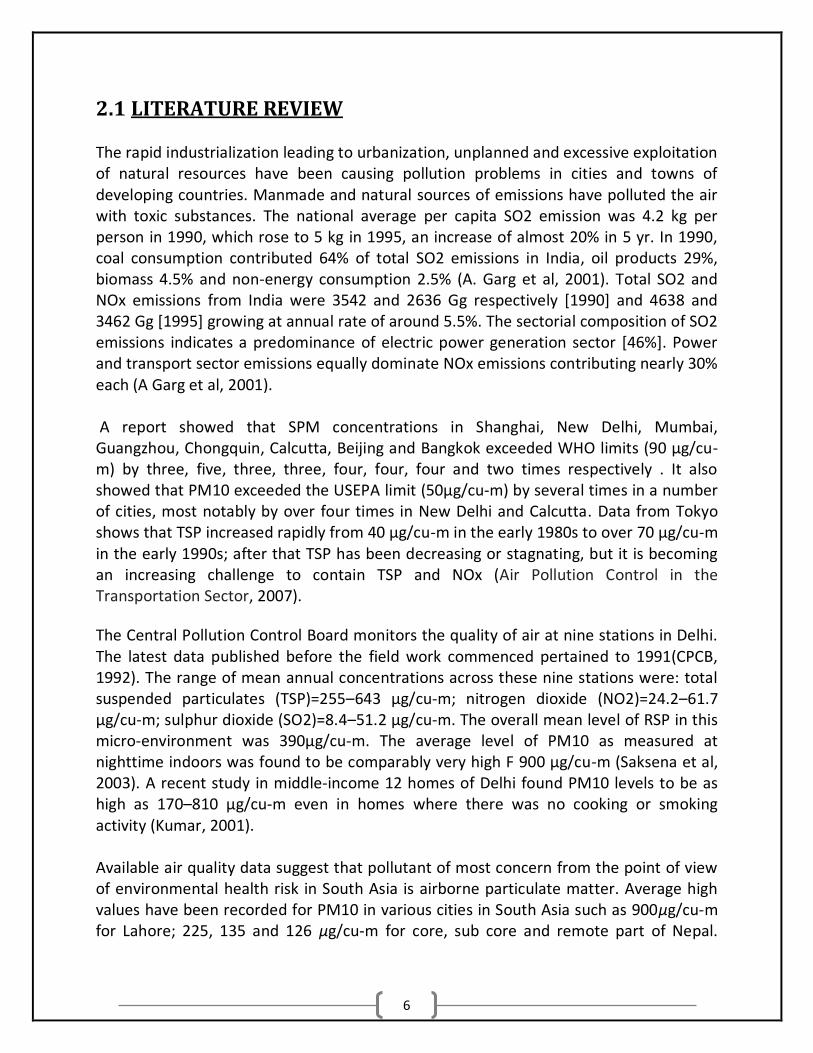
2.1 LITERATURE REVIEW The rapid industrialization leading to urbanization, unplanned and excessive exploitation of natural resources have been causing pollution problems in cities and towns of developing countries. Manmade and natural sources of emissions have polluted the air with toxic substances. The national average per capita SO2 emission was 4.2 kg per person in 1990, which rose to 5 kg in 1995, an increase of almost 20% in 5 yr. In 1990, coal consumption contributed 64% of total SO2 emissions in India, oil products 29%, biomass 4.5% and non-energy consumption 2.5% (A. Garg et al, 2001). Total SO2 and NOx emissions from India were 3542 and 2636 Gg respectively [1990] and 4638 and 3462 Gg [1995] growing at annual rate of around 5.5%. The sectorial composition of SO2 emissions indicates a predominance of electric power generation sector [46%]. Power and transport sector emissions equally dominate NOx emissions contributing nearly 30% each (A Garg et al, 2001). A report showed that SPM concentrations in Shanghai, New Delhi, Mumbai, Guangzhou, Chongquin, Calcutta, Beijing and Bangkok exceeded WHO limits (90 μg/cu-m) by three, five, three, three, four, four, four and two times respectively . It also showed that PM10 exceeded the USEPA limit (50μg/cu-m) by several times in a number of cities, most notably by over four times in New Delhi and Calcutta. Data from Tokyo shows that TSP increased rapidly from 40 μg/cu-m in the early 1980s to over 70 μg/cu-m in the early 1990s; after that TSP has been decreasing or stagnating, but it is becoming an increasing challenge to contain TSP and NOx (Air Pollution Control in the Transportation Sector, 2007).
The Central Pollution Control Board monitors the quality of air at nine stations in Delhi. The latest data published before the field work commenced pertained to 1991(CPCB, 1992). The range of mean annual concentrations across these nine stations were: total suspended particulates (TSP)=255–643 μg/cu-m; nitrogen dioxide (NO2)=24.2–61.7 μg/cu-m; sulphur dioxide (SO2)=8.4–51.2 μg/cu-m. The overall mean level of RSP in this micro-environment was 390μg/cu-m. The average level of PM10 as measured at nighttime indoors was found to be comparably very high F 900 μg/cu-m (Saksena et al, 2003). A recent study in middle-income 12 homes of Delhi found PM10 levels to be as high as 170–810 μg/cu-m even in homes where there was no cooking or smoking activity (Kumar, 2001). Available air quality data suggest that pollutant of most concern from the point of view of environmental health risk in South Asia is airborne particulate matter. Average high values have been recorded for PM10 in various cities in South Asia such as 900μg/cu-m for Lahore; 225, 135 and 126 μg/cu-m for core, sub core and remote part of Nepal.

7
Average values of PM10 and NO2 were 61 and 22 μg/cu-m at ambient site and at Kerbsite it was 90 and 25 μg/cu-m respectively (Kumar R. et al, 2006). The rural-industrial site at Satna shows significant different from urban, urban-industrial, rural, rural-remote and rural–urban influenced sites. With a minimum of one daily sample at each site, mean PM10 concentration at the rural-industrial Satna site varied from 65.5 to147.5 μg/cu-m, and from 205.0 to 320.3μg/cu-m at the urban-industrial Delhi site. With a minimum of one daily sample at each site, the mean TSP concentration at the rural-industrial Satna site varies from 283.9 to 678.0 μg/cu-m, while at the urban industrial Delhi site mean TSP concentration varies from 553.4 to 827.6 μg/cu-m. The maximum TSP concentration in Satna, 678.0 μg/cu-m, was on December 9, 2000. Maximum TSP concentration in Delhi, 827.6 μg/cu m, occurred on October 23, 2000. Levels of TSP in Ashok Vihar, a residential area in Delhi, reached 10 times the permissible limit in October 2000 (Shandilya Kaushik. K. et al, 2007). Monitoring of ambient respirable suspended particulate matter or PM10 and total suspended particulate (TSP) levels around a large coal-fired power station in India was carried out. Geometric mean values of PM10 and TSP concentrations at sites of downwind direction are found in ranges of 74–144 μg/cu-m (PM10) and 459–647 μg/cum (TSP) in post rainy season, 154–207 μg/cu-m (RSPM) and 437–610 μg/cu-m (SPM) in summer season and 180–275 μg/cum (PM10) and 933–1578 μg/cu-m (TSP) in winter season ( Sharma R. et al, 2005). In a study conducted in the city Kanpur it was found out that average pollution level in the city expressed in PM10 was 225.68 μg/cu-m during the year 2004. One of the monitoring stations i.e., Vikas Nagar registers wild fluctuations in the level of PM10. It varies from 295 to 463μg/cu-m during summer and from 42.5 to122 μg/cu-m during the monsoon and winter seasons respectively (Gupta U., 2007). In dry, unpolluted atmospheric conditions, it is estimated that the average SO2 concentration ranges from 0.03 to 0.3μg/cu-m (0.01 to 0.1 parts per billion or ppb). In remote areas, SO2 concentrations range 0.13 to 0.31μg/cu-m (0.05 to 0.12 ppb). In urban and industrialized areas, SO2 concentrations range from 2.6 to 2600 μg/cu-m (1 to 1000 ppb). A survey by the World Health Organization (WHO) of urban areas showed annual mean SO2 concentrations ranging from 20 to 60 μg/cu-m (7 to 21 ppb) and daily means rarely exceeding 125μg/cu-m (44 ppb) (WHO, 2000). IARC (1992) presents data for ambient air concentrations of SO2 in different parts of the world (WBK et al, 2003).

8
CHAPTER 3
9
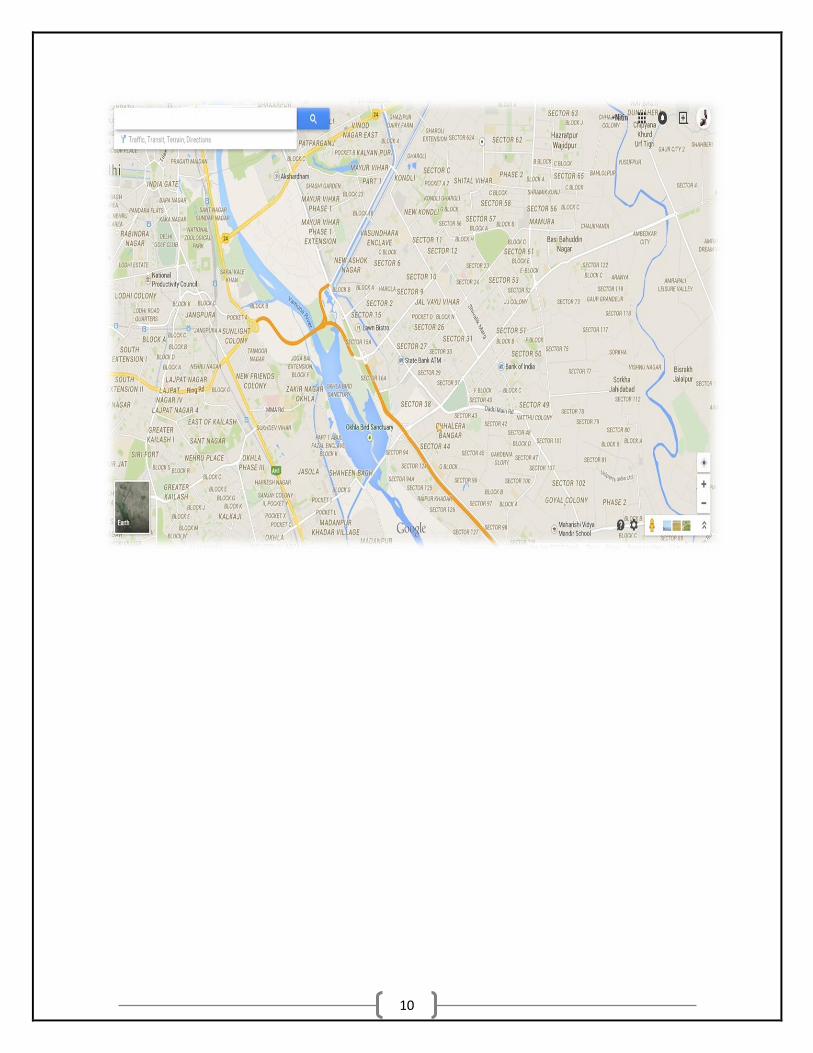
3.1 SITE DESCRIPTION The main concern of the project is to measure the concentration of sulphur dioxide, NOX, TSP and PM10 taking readings at different stations with the help of respirable dust sampler. These two critical gaseous pollutants and the particulate pollutants are in abundance in Noida’s environment since it is a commercial & residential area and a little change in their concentration in ambient air can make a strong effect on the existing living stock causing many adverse effects on health and skin. The stations were so chosen that there can be adequate safety measures as well as reduced interference of the local public with the devices used for the experiment. We investigated the decided sampling stations and found out the possible problems and the possible precautions to be taken while handling and use of the device for the project.
The monitoring stations chosen are:
1. Station-1: NOIDA SECTOR – 50
2. Station-2: NOIDA SECTOR – 14
3. Station-3: NOIDA SECTOR – 18
10

11
CHAPTER 4
12
4.1 METHODOLOGY
VARIOUS EXPERIMENTAL METHODS FOR THE POLLUTANTS According to the CPCB (Central pollution control board) the methods prescribed for the pollutant gases and the particulate pollutants are very sensitive ones yet percentage of errors are very less. The methods prescribed for the gases SO2, NOx and the particulate pollutants TSP, PM10 are respectively:
(i) Modified West and Gaeke method
(ii) Modified Jacob Hochheiser method
(iii) Gravimetric method
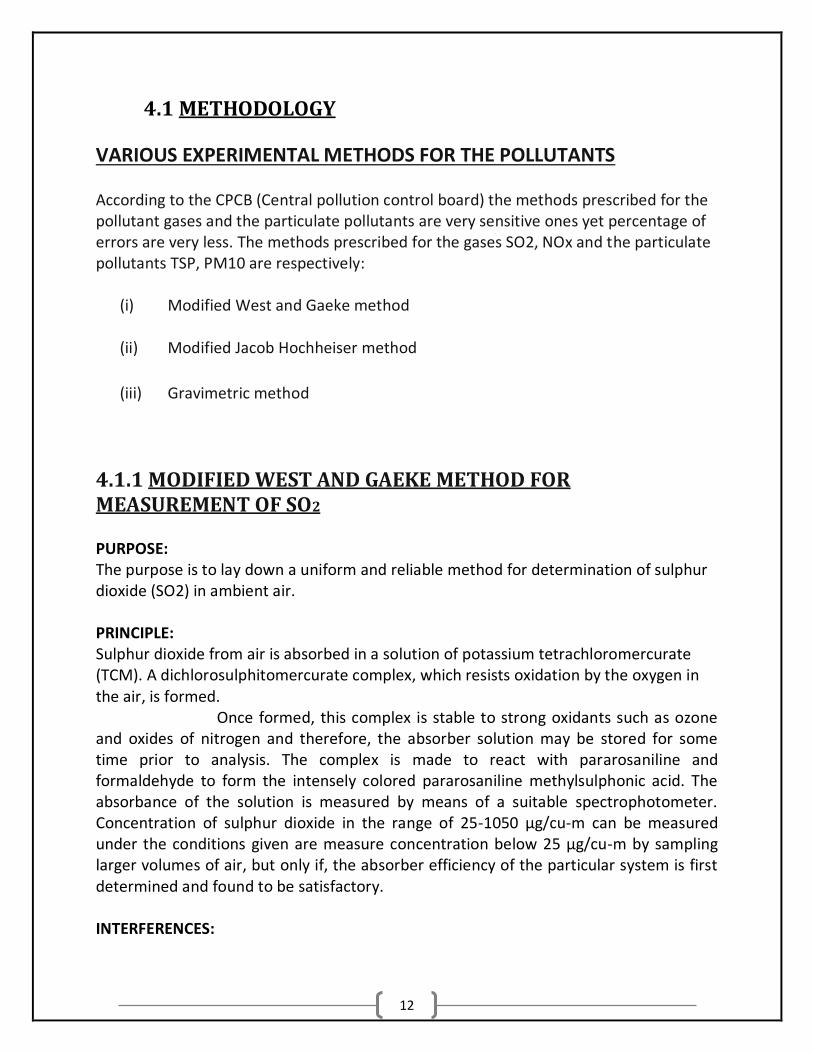
4.1.1 MODIFIED WEST AND GAEKE METHOD FOR MEASUREMENT OF SO2 PURPOSE: The purpose is to lay down a uniform and reliable method for determination of sulphur dioxide (SO2) in ambient air. PRINCIPLE: Sulphur dioxide from air is absorbed in a solution of potassium tetrachloromercurate (TCM). A dichlorosulphitomercurate complex, which resists oxidation by the oxygen in the air, is formed. Once formed, this complex is stable to strong oxidants such as ozone and oxides of nitrogen and therefore, the absorber solution may be stored for some time prior to analysis. The complex is made to react with pararosaniline and formaldehyde to form the intensely colored pararosaniline methylsulphonic acid. The absorbance of the solution is measured by means of a suitable spectrophotometer. Concentration of sulphur dioxide in the range of 25-1050 μg/cu-m can be measured under the conditions given are measure concentration below 25 μg/cu-m by sampling larger volumes of air, but only if, the absorber efficiency of the particular system is first determined and found to be satisfactory. INTERFERENCES:
13
The effects of the principal known interferences have been minimized or eliminated. Interferences by oxides of nitrogen are eliminated by sulphamic acid. Ozone is made to decompose by allowing the solution to stand for some time prior to analysis. The interference of trace metals may be eliminated by the addition of ethylenediamine tetra acetic acid (EDTA) to the absorbing solution prior to sampling. ANALYSIS: A spectrophotometer suitable for measurement of absorbance at 560 nm with an effective spectral band width of less than 15 nm is required. Reagent blank problems may occur with spectrophotometer having greater spectral bandwidths. The wavelength calibration of the instrument should be verified. REAGENTS:
(i) Water - High quality water must be used. It must be free from oxidants, particularly chlorine, which may not be removed by distillation. This criterion must be observed whether water is prepared by distilling or deionizing or by using a combination of both techniques.
(ii) Absorbing Reagents, 0.04 M Potassium Tetrachloro mercurate (TCM) – Dissolve 10.86 g, mercuric chloride, 0.066 g EDTA, and 6.0 g potassium chloride or sodium chloride 4.68 gm in water and bring to the mark in a 1 litre volumetric flask. The pH of this reagent should be approximately 4.0 but, it has been shown that there is no appreciable difference in collection efficiency over the range of pH 5 to pH 3. The absorbing reagent is normally stable for six months. If, a precipitate forms, discard the reagent after recovering the mercury.
(iii) Sulphamic Acid (0.6%) - Dissolve 0.6 g sulphamic acid in 100 ml distilled water. Prepare fresh daily.
(iv) Formaldehyde (0.2%) - Dilute 5 ml formaldehyde solution (36-38%) to 1 litre with distilled water. Prepare fresh daily.
(v) Purified Pararosaniline Stock Solution (0.2% Nominal)
14
PROCEDURE: Sampling and Analysis
(i) Sampling - Procedures are described for short-term (30 minutes, 1 hour, 4 hours) long-term (8 hours, 24 hours) sampling. Here we have taken 8 hours for gaseous as well as particulate sampling. Sample volumes should be adjusted, so that linearity is maintained between absorbance and concentration over the range in question.
(ii) 8 Hours Sampling - Insert a midget impinger into the sampling system. Add 10 ml TCM solution to the impinger (30 ml TCM solution for 4 hours sampling). Collect sample at 1 litre/minute for 30 minutes, 1 hour or 4 hours using either a rotameter, or a critical orifice, to control flow. Shield the absorbing reagent from direct sunlight during and after sampling by covering the impinger with aluminum foil to prevent deterioration. Determine the volume of air sampled by multiplying the flow rate by the time in minutes and record the atmospheric pressure and temperature. Remove and stopper the impinger. If, the sample must be stored for more than a day before analysis, keep it at 50C in a refrigerator; during hot weather, sampling is not recommended unless it is possible to refrigerate the samples as taken.
Determination:
For each set of determinations prepare a reagent blank by adding 10 ml of unexposed TCM solution to a 25 ml volumetric flask. Prepare a control solution by measuring 2 ml of working sulphite-TCM solution and 8 ml TCM solution into a 25 ml volumetric flask by pipette. To each flask containing either sample, control solution, or reagent blank, add 1 ml 0.6% sulphamic acid and allow to react 10 minutes to destroy the nitrite resulting from oxides of nitrogen. Measure by pipette and add 2 ml of 0.2% formaldehyde solution and 2 ml pararosaniline solution. Start a laboratory timer that has been set for 30 minutes. Bring all flasks to volume with freshly boiled and cooled distilled water and mix thoroughly. After 30 minutes and before 60 minutes, determine the absorbance of the sample, A, reagent blank, Ao, and the control solution at 560 nm using cells with a 1 cm path length. Use distilled water; not the reagent blank, as the optical reference. This is important because of the color sensitivity of the reagent blank to temperature changes which may be induced in the cell compartment of a spectrophotometer. Do not allow the colored solution to stand in the absorbance cells, because a film of dye may be deposited. Clean cells with alcohol and clean pipe cleaner after use. If, the temperature of the determinations does not differ by more than 20C from the calibration
15
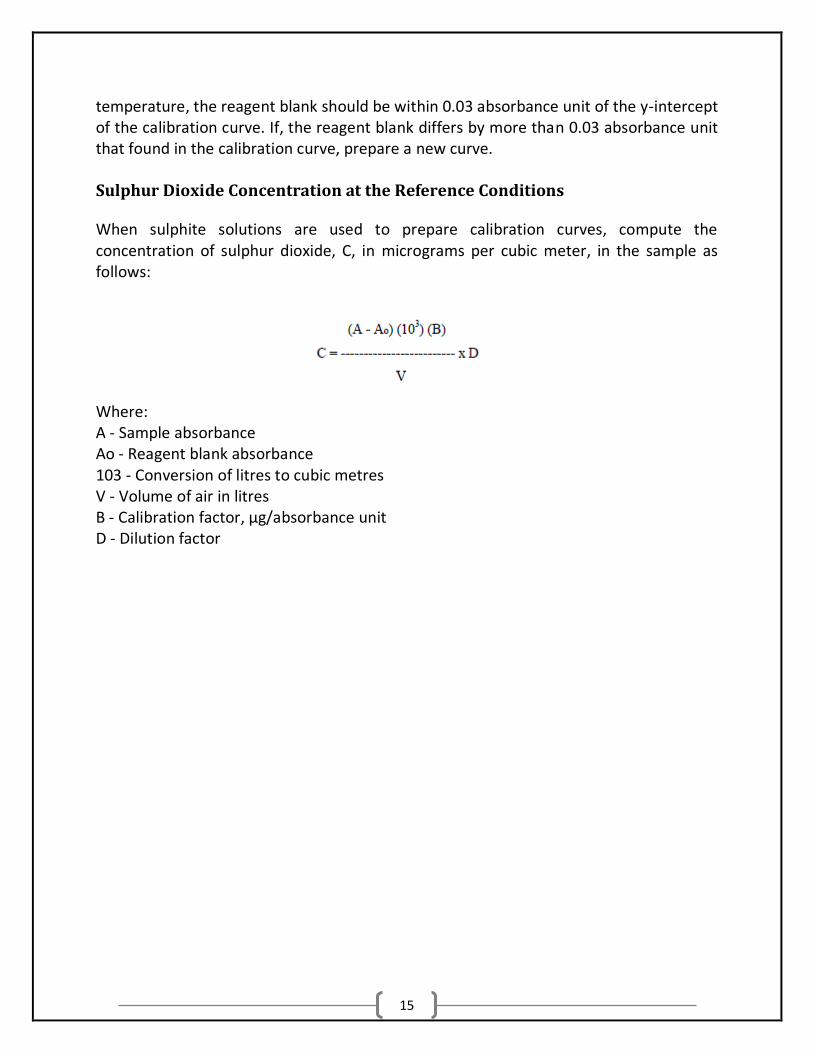
temperature, the reagent blank should be within 0.03 absorbance unit of the y-intercept of the calibration curve. If, the reagent blank differs by more than 0.03 absorbance unit that found in the calibration curve, prepare a new curve. Sulphur Dioxide Concentration at the Reference Conditions
When sulphite solutions are used to prepare calibration curves, compute the concentration of sulphur dioxide, C, in micrograms per cubic meter, in the sample as follows:
Where: A - Sample absorbance Ao - Reagent blank absorbance 103 - Conversion of litres to cubic metres V - Volume of air in litres B - Calibration factor, μg/absorbance unit D - Dilution factor
16
4.1.2 MODIFIED JACOB AND HOCHHEISER METHOD FOR DETERMINATION OF NOX IN THE ATMOSPHERE
PURPOSE: The purpose is to lay down a uniform and reliable method for sampling and analysis of nitrogen dioxide in ambient air. PRINCIPLE: Ambient nitrogen dioxide (NO2) is collected by bubbling air through a solution of sodium hydroxide and sodium arsenite. The concentration of nitrite ion (NO2) produced during sampling is determined colorimetrically by reacting the nitrite ion with phosphoric acid, sulfanilamide, and N-(1-naphthyl)-ethylenediamine dihydrochloride (NEDA) and measuring the absorbance of the highly colored azodye at 540 n m. INTERFERENCES: Nitric oxide (NO) is a positive interferant and carbon dioxide (CO2) is a negative interferant. The average error resulting from normal ambient concentrations on NO and CO2 is small for most monitoring situations and does not necessitate applying a correction to measurements obtained with the method. Potential interference from sulfur dioxide (SO2) is eliminated by converting any SO2 to sulfate with hydrogen peroxide during analysis. REAGENTS: Distilled Water - Must be reagent water as defined by ASTM procedure 1193-66 part 6.3 (consumption of potassium per-magnate test). Sodium Arsenite - CAUTION: Arsenic compounds are highly toxic and should be handled with extreme care. Avoid contact with skin and especially with eyes. Avoid generating dust or breathing dust. Keep away from food. Wash hands after handling it. Do not take internally. Absorbing Reagents - Dissolve 4.0 g of sodium hydroxide in distilled water, add 1.0 g of sodium arsenite, and dilute to 1,000 ml with distilled water. Sulfanilamide - Melting point 165 to 1670C. N-(1-Naphthyl)-ethylenediamine Di-hydrochloride (NEDA) - A 1% aqueous solution should have only one absorption peak at 320 nm over the range of 260-400 nm. NEDA
17
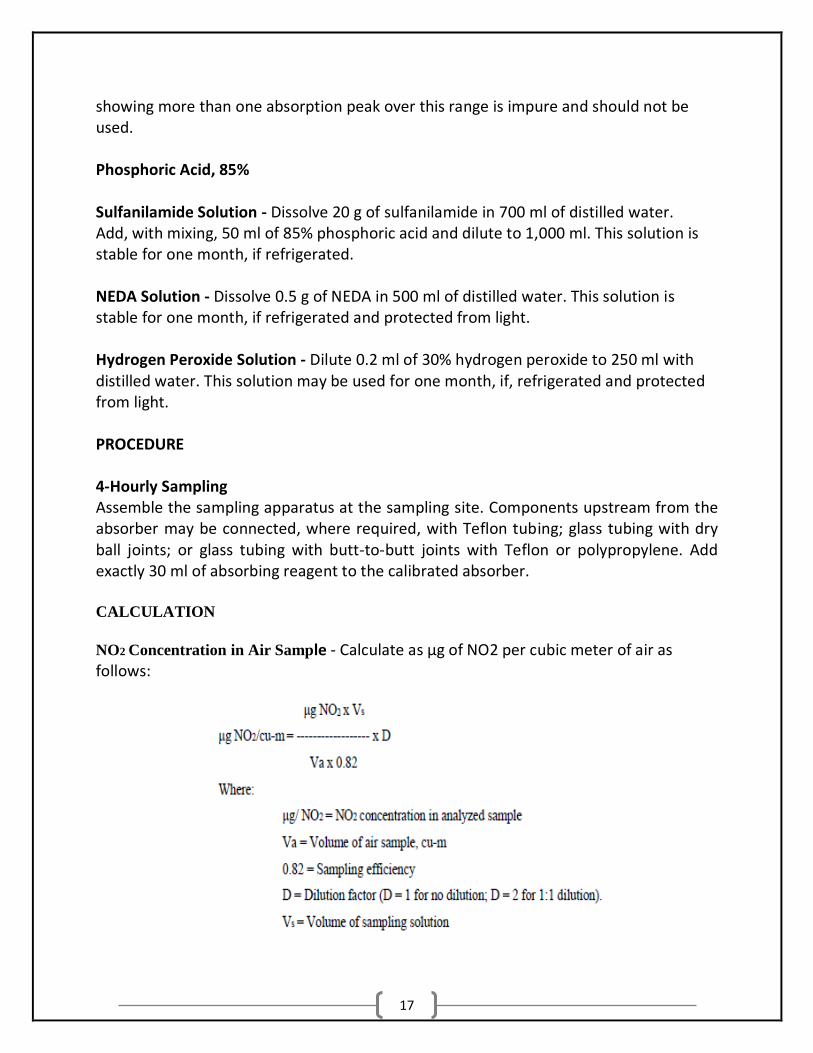
showing more than one absorption peak over this range is impure and should not be used. Phosphoric Acid, 85% Sulfanilamide Solution - Dissolve 20 g of sulfanilamide in 700 ml of distilled water. Add, with mixing, 50 ml of 85% phosphoric acid and dilute to 1,000 ml. This solution is stable for one month, if refrigerated. NEDA Solution - Dissolve 0.5 g of NEDA in 500 ml of distilled water. This solution is stable for one month, if refrigerated and protected from light. Hydrogen Peroxide Solution - Dilute 0.2 ml of 30% hydrogen peroxide to 250 ml with distilled water. This solution may be used for one month, if, refrigerated and protected from light. PROCEDURE 4-Hourly Sampling Assemble the sampling apparatus at the sampling site. Components upstream from the absorber may be connected, where required, with Teflon tubing; glass tubing with dry ball joints; or glass tubing with butt-to-butt joints with Teflon or polypropylene. Add exactly 30 ml of absorbing reagent to the calibrated absorber. CALCULATION
NO2 Concentration in Air Sample - Calculate as μg of NO2 per cubic meter of air as follows:
18
4.1.3 HIGH VOLUME METHOD FOR DETERMINATION OF RESPIRABLE SUSPENEDED PARTICULATE MATTER IN THE ATMOSPHERE
PURPOSE: The purpose is to lay down an uniform and reliable method for measurement of Total Suspended Particulate Matter (TSP) in the ambient air. PRINCIPLE: Air is drawn through a size-selective inlet and through a 20.3 X 25.4 cm (8 X 10 in) filter at flow rate which is typically 1132 L/min (40 ft3 /min). Particles with aerodynamic diameters less than the cut-point of the inlet are collected by the filter. The mass of these particles is determined by the difference in filter weights prior to and after sampling. The concentration of suspended particulate matter in the designated size range is calculated by dividing the weight gain of the filter by the volume of air sampled. INTERFERENCES:
Passive Deposition - Passive deposition occurs when windblown dust deposits on a filter both prior to and after sampling. Inlet Loading and Re-Entrainment - Material collected in size-selective inlets can become re entrained in the sample flow. Controlled studies are insufficient to quantify this interference. It can be minimized by greasing or oiling inlet impaction surfaces, though this may change the size selective properties. Filter Artifact Formation - Sulfur dioxide, nitrogen oxides, nitric acid and organic vapors can be absorbed on the filter medium along with the suspended particles thereby causing positive biases. Samples taken in the presence of high SO2 concentrations have been shown to yield up to 10μg/cu-m of excess sulfate on glass fiber filters. Filter Conditioning - Filter conditioning environments can result in different mass measurements as a function of relative humidity (RH). Soluble particles take on substantial quantities of water as RH increases, especially above the deliquescence point of approximately 70% RH. Increased mass deposits of 50% or more have been observed as RH increases to 100%. Twenty-four hours at a constant temperature and RH is considered adequate for sample equilibration. Shipping Losses - Particle loss during transport occurs when filters are heavily loaded with large dry aerosols. It is more prevalent on membrane than on glass fiber filters.

19
Particle loss is minimized by shorter sample duration in heavily polluted environments, use of fiber as opposed to membrane filters, folding the filter prior to transport, and careful shipping procedures.
Filter Media A 20.3 x 25.4 cm (8 x 10 in) glass fiber filter is used to collect particles. The choice of filter type results from a compromise among the following filter attributes: (i) mechanical stability, (ii) chemical stability, (iii) particle sampling efficiency, (iv) flow resistance, (v) clogging level, (vi) blank values, (vii) artifact formation, and (viii) cost and availability. EPA filter requirements specify 0.3 μm DOP sampling efficiency in excess of 99%, weight losses or gains due to mechanical or chemical instability of less than a 5 μg/cu-m equivalent, and alkalinity of less than 25 micro-equivalent/g to minimize sulfur dioxide (SO2) and nitrogen oxides (NOx) absorption. The most appropriate filter media for high volume sampling are cellulose fiber, glass fiber, quartz fiber, Teflon coated glass fiber, and Teflon membrane. None of these materials is perfect for all purposes. PROCEDURE: Filter Weighing - It is best to weigh filters in groups of ten to fifty. Wear gloves for all filter handling. Stack filter jackets with data forms printed on them in the same order (in ascending order of filter ID numbers, if possible) as the order of filters in the equilibration rack. Adjust the balance tare to read zero with nothing in the weighing chamber and adjust the span to read (or verify that it reads) 3.00000 g with the 3 g standard weight on the weighing pan. Place a filter in the weighing chamber and adjust the balance to its equilibrium position. If, a stable reading cannot be obtained, it may be necessary to neutralize electrostatic charges with a radioactive source prior to and during weighing. Field Sampling - Tilt back the inlet and secure it according to manufacturer's instructions. Loosen the face-plate wing-nuts and remove the face place. Remove the filter from its jacket and center it on the support screen with the rough side of the filter facing upwards. Replace the faceplate and tighten the wing-nuts to secure the rubber gasket against the filter edge. Gently lower the inlet. Inertial jet and cyclonic inlets must have their seals in contact with the top of the faceplate. Look underneath the inlet just as it is coming into contact with the faceplate to assure that this contact is being made. It may be necessary to readjust the position of the filter/motor assembly in the sampler housing to obtain such a seal. Excessively windy and wet conditions should be avoided when changing samples. Pre-loading in a filter cartridge assembly, temporary removal of the sampler to a protected area, or a wind or rain shield may be used if the sample must be changed in inclement weather. Set the timer for the desired start and stop time.
20
Calculation of Volume of Air Sampled
V = QT
Where, V = Volume of air sampled in cu-m Q = Average flow rate in cu-m/minute T = Total sampling time in minute Calculation of Respirable Suspended Particulate Matter in Ambient Air
Where:
SPM = Mass concentration of suspended particles in μg/cu-m
Wi = Initial weight of filter in g.
Wf = Final weight of filter in g.
V = Volume of air sampled in cu-m
106 = Conversion of g to μg.
21
4.1.4 MEASUREMENT OF SUSPENDED PARTICULATE MATTER
PURPOSE
The purpose is to lay down an uniform and reliable method for determination of PM10 (Particulate matter less than 10μm diameter) in ambient air. PRINCIPLE
Air is drawn through a size-selective inlet and through a 20.3 x 25.4 cm (8 x 10 in) filter at a flow rate which is typically 1132 L/min. Particles with aerodynamic diameter less than the cut point of the inlet are collected on the bowl. The mass of these particles is determined by the difference in bowl weights prior to and after sampling. The concentration of PM10 in the designated size range is calculated by dividing the weight gain of the bowl by the volume of air sampled. INTERFERENCES:
Passive Deposition- Passive deposition occurs when windblown dust deposits on a filter both prior to and after sampling. Re-circulation- Re-circulation occurs when the blower exhaust, which contains carbon and copper particles from the armature and brushes, is entrained in the sample air. Positive biases of 0.15μg/cu-m have been measured, which are insignificant mass interferences but which may affect carbon and copper measurements. Recirculation can be minimized by assuring a tight seal between the blower and the sampler housing or by ducting blower exhaust away from the sampler. CALCULATIONS:
Calculation of volume of air sampled
V=QT

22
Where, V=Volume of air sampled in cu-m. Q= Average flow rate in cu-m/min T= Total sampling time in min

23
CHAPTER 5

24
SULPHUR DIOXIDE (CALIBRATION CURVE)
25
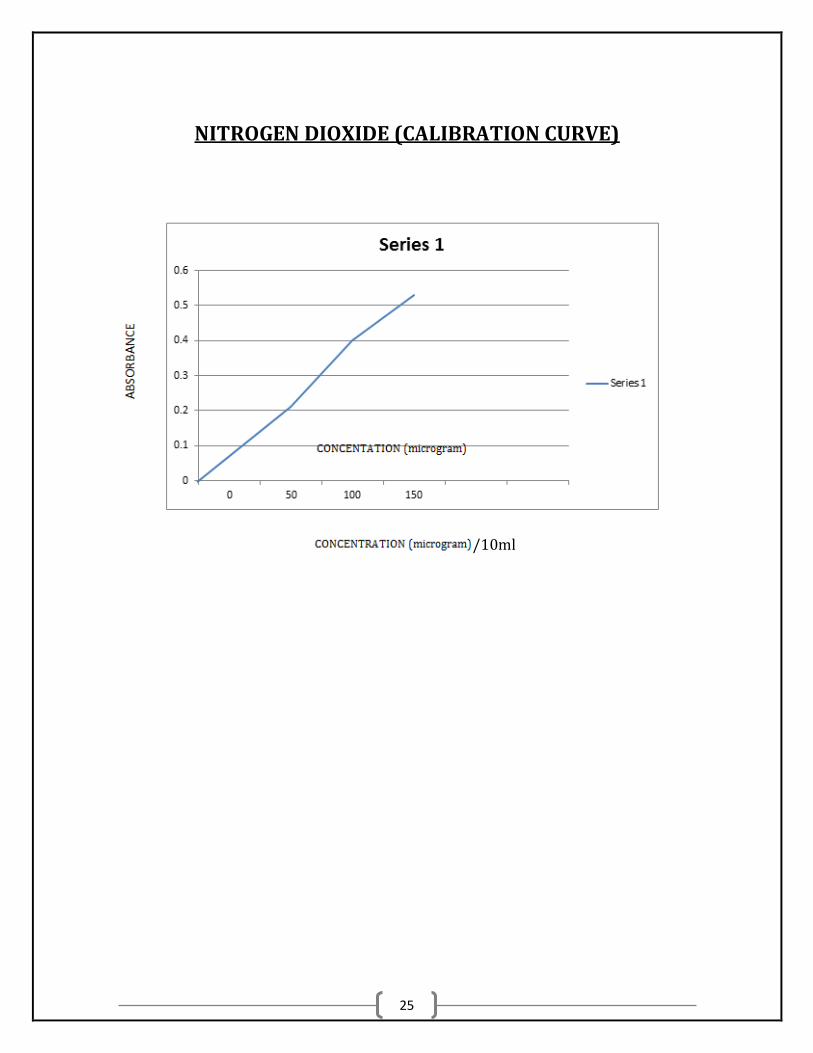
NITROGEN DIOXIDE (CALIBRATION CURVE)
/10ml

26
CHAPTER 6
27
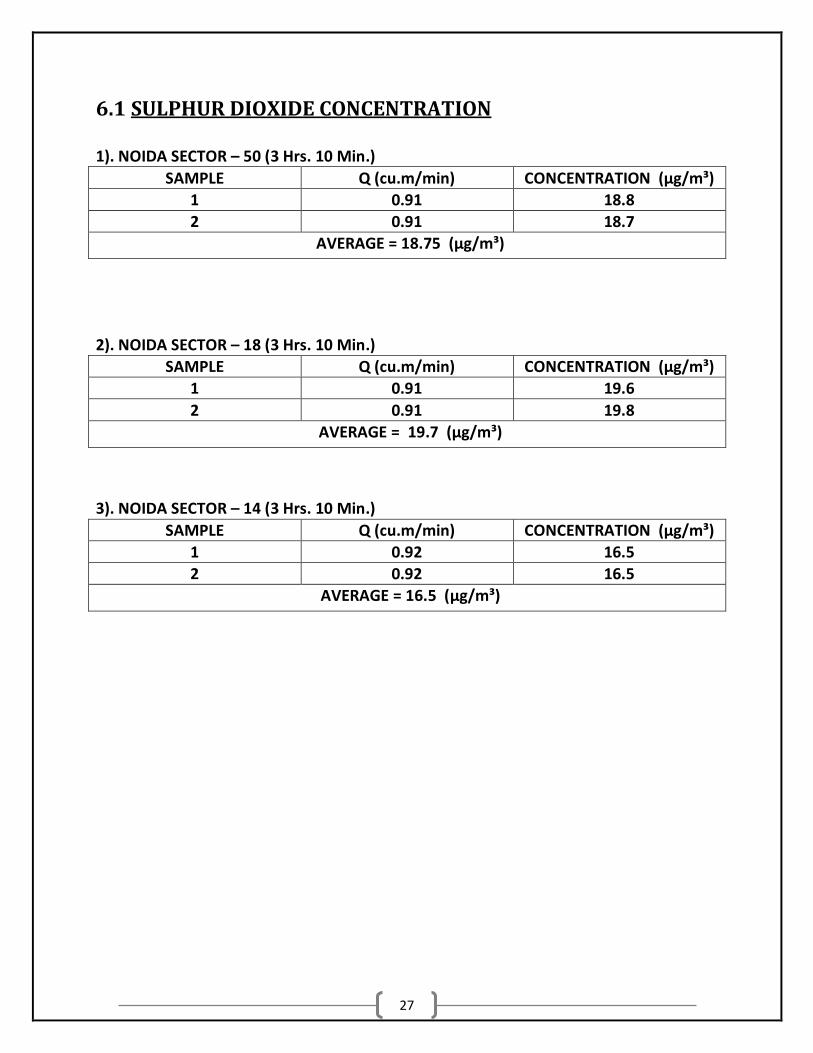
6.1 SULPHUR DIOXIDE CONCENTRATION 1). NOIDA SECTOR – 50 (3 Hrs. 10 Min.)
SAMPLE Q (cu.m/min) CONCENTRATION (µg/m³)
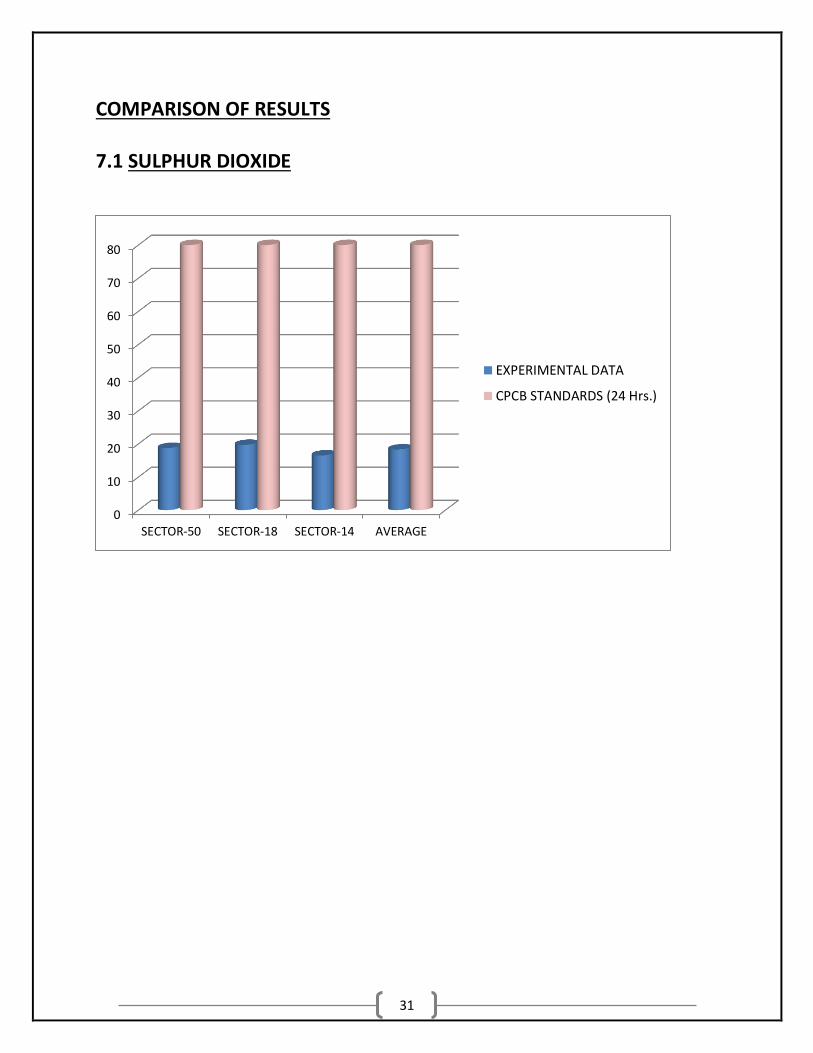
1 0.91 18.8
2 0.91 18.7
AVERAGE = 18.75 (µg/m³)
2). NOIDA SECTOR – 18 (3 Hrs. 10 Min.)
SAMPLE Q (cu.m/min) CONCENTRATION (µg/m³)
1 0.91 19.6
2 0.91 19.8
AVERAGE = 19.7 (µg/m³)
3). NOIDA SECTOR – 14 (3 Hrs. 10 Min.)
SAMPLE Q (cu.m/min) CONCENTRATION (µg/m³)
1 0.92 16.5
2 0.92 16.5
AVERAGE = 16.5 (µg/m³)
28
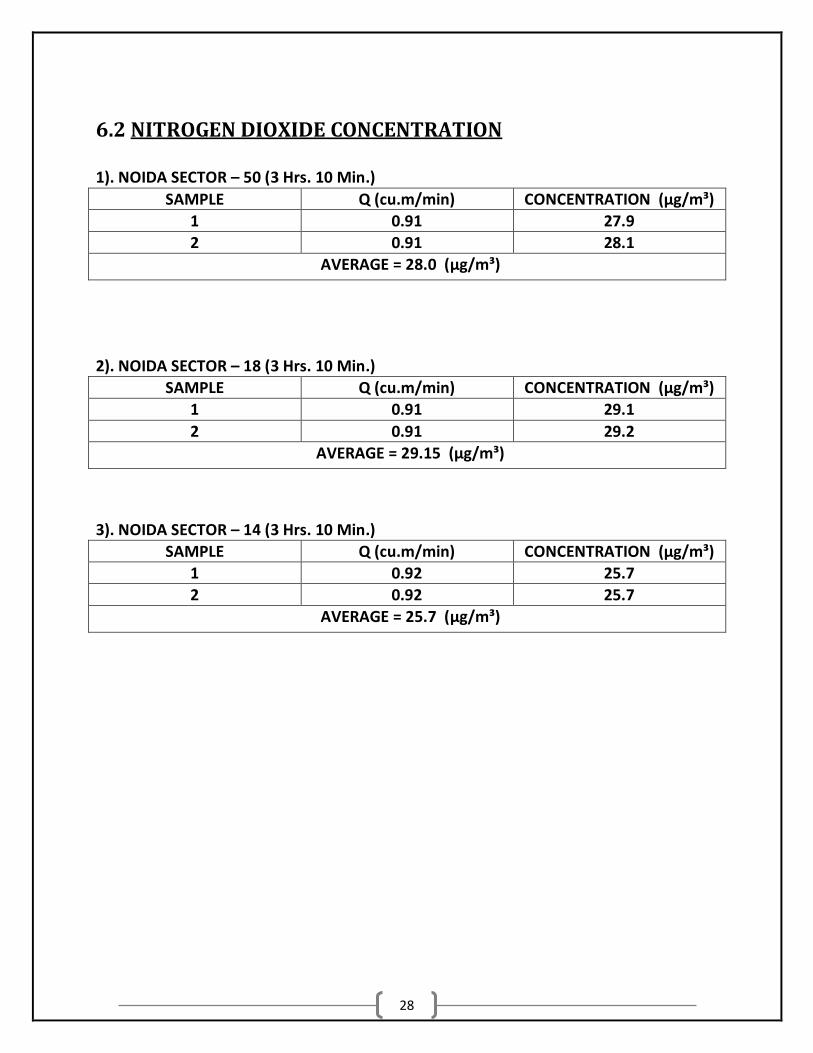
6.2 NITROGEN DIOXIDE CONCENTRATION 1). NOIDA SECTOR – 50 (3 Hrs. 10 Min.)
SAMPLE Q (cu.m/min) CONCENTRATION (µg/m³)
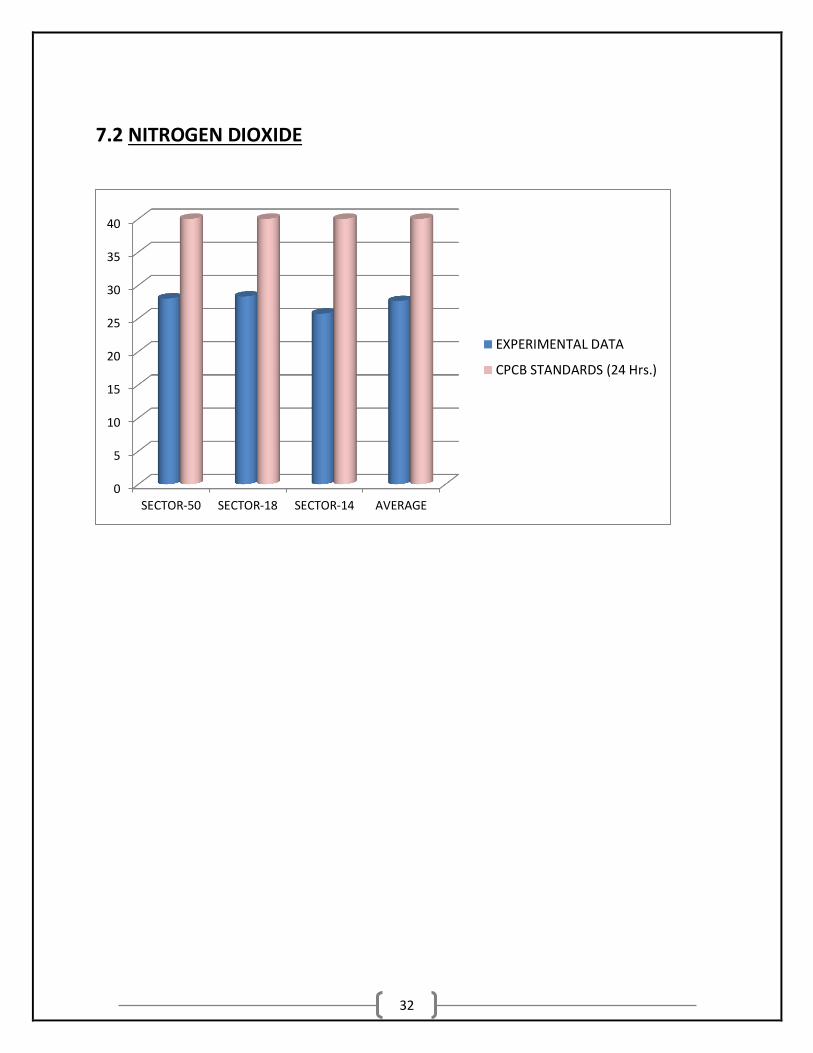
1 0.91 27.9
2 0.91 28.1
AVERAGE = 28.0 (µg/m³)
2). NOIDA SECTOR – 18 (3 Hrs. 10 Min.)
SAMPLE Q (cu.m/min) CONCENTRATION (µg/m³)
1 0.91 29.1
2 0.91 29.2
AVERAGE = 29.15 (µg/m³)
3). NOIDA SECTOR – 14 (3 Hrs. 10 Min.)
SAMPLE Q (cu.m/min) CONCENTRATION (µg/m³)
1 0.92 25.7
2 0.92 25.7
AVERAGE = 25.7 (µg/m³)
29
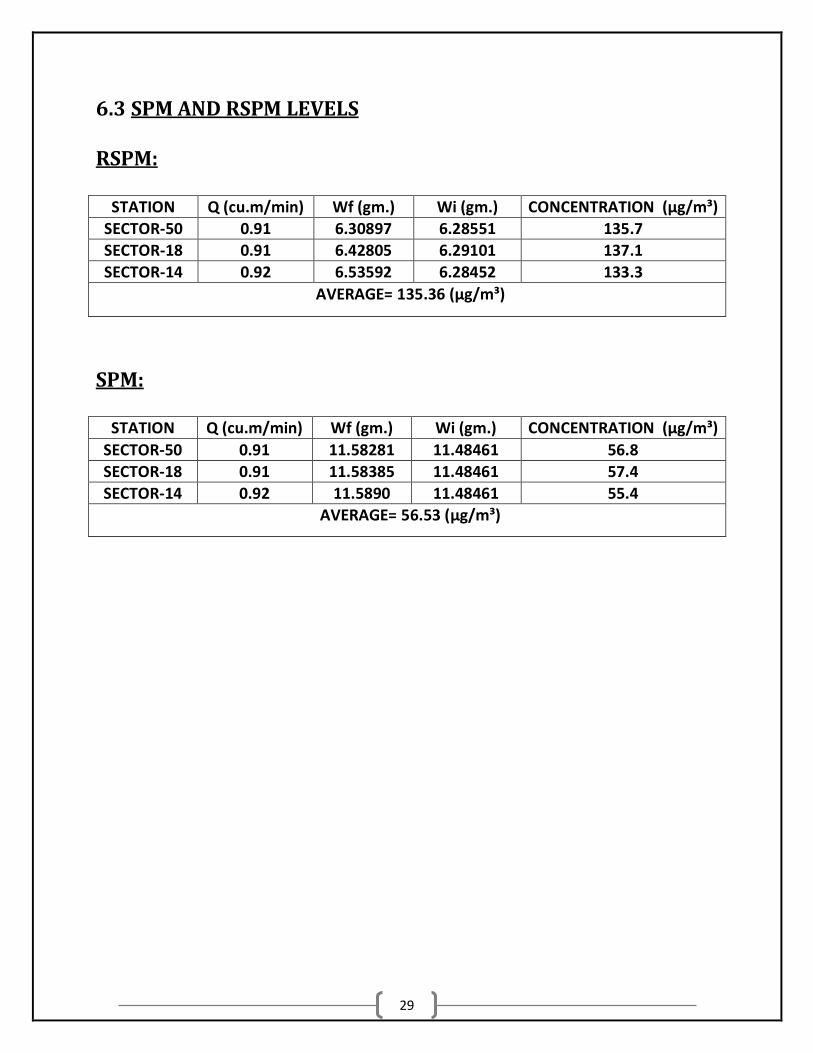
6.3 SPM AND RSPM LEVELS RSPM:
STATION Q (cu.m/min) Wf (gm.) Wi (gm.) CONCENTRATION (µg/m³)
SECTOR-50 0.91 6.30897 6.28551 135.7
SECTOR-18 0.91 6.42805 6.29101 137.1
SECTOR-14 0.92 6.53592 6.28452 133.3
AVERAGE= 135.36 (µg/m³)
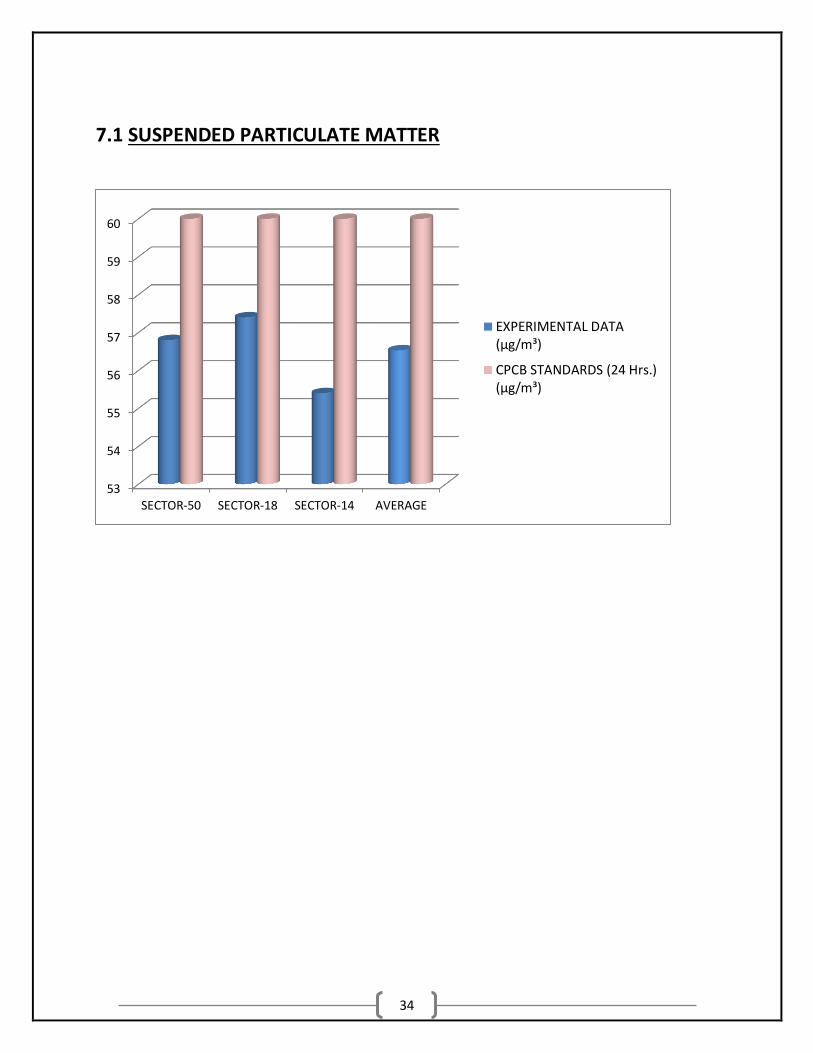
SPM:
STATION Q (cu.m/min) Wf (gm.) Wi (gm.) CONCENTRATION (µg/m³)
SECTOR-50 0.91 11.58281 11.48461 56.8
SECTOR-18 0.91 11.58385 11.48461 57.4
SECTOR-14 0.92 11.5890 11.48461 55.4
AVERAGE= 56.53 (µg/m³)

30
CHAPTER 7
31
COMPARISON OF RESULTS 7.1 SULPHUR DIOXIDE
0
10
20
30
40
50
60
70
80
SECTOR-50 SECTOR-18 SECTOR-14 AVERAGE
EXPERIMENTAL DATA
CPCB STANDARDS (24 Hrs.)
32
7.2 NITROGEN DIOXIDE
0
5
10
15
20
25
30
35
40
SECTOR-50 SECTOR-18 SECTOR-14 AVERAGE
EXPERIMENTAL DATA
CPCB STANDARDS (24 Hrs.)

33
7.3 RESPIRABLE SUSPENDED PARTICLE MATTER
0
20
40
60
80
100
120
140
SECTOR-50 SECTOR-18 SECTOR-14 AVERAGE
EXPERIMENTAL DATA(µg/m³)
CPCB STANDARDS (24 Hrs.)(µg/m³)
34
7.1 SUSPENDED PARTICULATE MATTER
53
54
55
56
57
58
59
60
SECTOR-50 SECTOR-18 SECTOR-14 AVERAGE
EXPERIMENTAL DATA(µg/m³)
CPCB STANDARDS (24 Hrs.)(µg/m³)

35
CHAPTER 8

36
Air quality Index calculation: Vast amount of data that are generated as a result of air quality monitoring program complicates the meaningful interpretation (of data) and demands extensive statistical and computational efforts. Air Quality Index (AQI), although a useful tool devised to simplify interpretation of data, may result in some loss of scientific information. In this research, adaptability of some of the existing AQls that have been used by various agencies is examined (Rao M. et al, 2003). The quality of air in the study area can be estimated from the air quality index. The air quality index was calculated from the observed TSP, PM10, NOx and SO2 values using the formula;
AQI = ¼ ×( ISPM/SSPM + IRSPM/SRSPM + ISO2/SSO2 + INOX/SNOX )× 100
AQI = ¼ ×( ISPM/SSPM + IRSPM/SRSPM + ISO2/SSO2 + INOX/SNOX )× 100
= 77.76
THEREFORE, THE AMBIENT AIR QUALITY IN NOIDA CITY IS TO BE CONSIDERED AS POLLUTED.
AMBIENT AIR QUALITY STANDARD OF CENTRAL POLLUTION CONTROL BOARD
37
CHAPTER 9
38
CONCLUSION Ambient air quality was assessed using three monitoring stations in the Noida City; the studies have clearly revealed the levels of air pollutants for SPM, RSPM, NOx and SO2. The values of all these pollutants (particulates and gaseous) are observed to be very much below National Ambient Air Quality Standards except the values of RSPM. This increase in AQI at this site is probably due to the increased transportation on the road, construction works around the city.
39
REFERENCES

40
1 Ahmed Haytham A. Air Quality in Egypt August 1999, Air Quality Monthly Report, Monthly report, August 1999. 2 Air Pollution Control in the Transportation Sector. Third Phase Research Report of the Urban Environmental Management Project, 2007.
3 Alias Masitah, Hamzah Zaini and Kenn Lee See. PM10 and Total suspended particulates (TSP) measurements in various power stations, The Malayasian Journal Of Analytical Sciences, Vol 11, No 1, (2007): 255-261. 4. Ambient air quality assessment, CPCB (2002). 5. Balaceanu C., Stefan S. The assessment of the TSP particulate matter in the urban ambient air, Romanian Reports in Physics, Vol 56 , No 4, (2004): 757-768. 6. Barman S.C., Singh Ramesh, Negi M.P.S., Bhargava S.K. Ambient air quality of Lucknow City (India) during use of fireworks on Diwali Festival, Environ Monit. Asses, No 137, (2008): 495-504. 7. Chan Shin Wai., Li Steven. Air Pollution Business risk or competitive advantage, (2007): 852. 8. Chaulya S.K. Spatial and temporal variations of SPM, RPM, SO2 and NOx concentrations in an opencast coal mining area, J. Eviron. Monit., No 6, (2004): 134-142. 9. Garg A., Shukla P.R., Bhattacharya S., Dadhwal V.K. Sub-region (district) and sector level SO2 and NOx emissions for India: assessment of inventories and mitigation flexibility, Atmospheric Environment, Vol 35, (2001) : 703-713. 10. Ghanem M., Guo Y., Hassard J., Osmond M., and Richards M. Sensor Grids For Air Pollution Monitoring. 11. Goyal P., Sidhartha. Present scenario of air quality in Delhi: a case study of CNG implementation., Atmospheric Environment, Vol 37, (2003): 5423-5431.
41
12. Gupta Usha. Valuation of Urban Air Pollution: A Case Study of Kanpur City in India Environ Resource. Econ., (2008). 13. Kumar Rakesh, Joseph Abba Elizabeth. Air Pollution concentrations of PM2.5, PM10 and NO2 at ambient and kerbsite and their Correlation in metro city – Mumbai.