Embed Size (px)
Citation preview

Amgen 2015 Environmental Sustainability Report Highlights

2
Highlighted by our launch of six innovative products,
2015 was a year in which Amgen advanced our strategy
for long-term growth. We delivered new and existing
medicines for patients in more countries than ever
before, executing our ambitious plans even as we made
transformational changes to make us stronger and more
competitive. As Amgen evolves, we remain committed
to being a responsible company. We strive to extend the
positive impact our medicines make around the world to
our work in the communities in which we operate. We
commit significant time, energy, and resources to efforts
that make us a better global citizen.
Environmental sustainability is one aspect of Amgen’s
responsible approach. As a biology-focused company, we
have a deep appreciation for the natural environment. We
continuously improve operations in a variety of ways to
improve our environmental impact. We are making progress
toward licensure of our pioneering Next-Generation
Biomanufacturing plant in Singapore, which will considerably
curb water use, carbon emissions, and the generation of
solid waste. In response to drought, we accelerated our
already-substantial water conservation efforts at sites
in California and Puerto Rico. We have achieved large
reductions in carbon emissions from our overall business
primarily by making systems more efficient and using
less energy. We have evaluated renewable and alternative
energy technology options at every major Amgen site
and have included renewable and alternative energy
projects in our long range plan.
We are proud to be recognized externally for our sustainability
performance. In 2015, Amgen earned placement on the
Dow Jones Sustainability World Index for a second year
and was named to the North America Index for a third
year. Amgen placed significantly higher in both the US and
Global listings in the Newsweek 2015 Green Rankings
compared to previous years.
We have launched a Responsibility section on Amgen.com
as part of our broader commitment to communicating our
non-financial performance. In addition to this environmental
sustainability report, the section contains information on
the Amgen Foundation, our Access to Medicine program,
corporate giving initiatives, and the health and safety of
our staff.
Just as I value how our staff are motivated by the opportunity
to make the world a better place, I appreciate that our
peers and the public take time to review and assess
Amgen’s performance. I invite you to share your thoughts
about Amgen’s progress with environmental sustainability
through the feedback link on this report website.
Robert A. Bradway
Leadership Message
Robert A. Bradway
Chairman and Chief Executive Officer

3
The overall aim of our 2020 targets is to protect the environment, improve efficiency, and increase stakeholder
value. Our targets are designed to track our progress through deliberate efforts—without influence from growth
or contraction in our business. We created a portfolio of projects and initiatives that we specifically execute to bring
results in our target areas. We track the performance of these projects and initiatives against a 2012 baseline,
counting results of projects and initiatives confirmed through a formal measurement process.
Progress Through 20152020 Target
Waste Reduce 1,490 metric tons (MT) of waste to landfill or incineration 35% of 2012 baseline
Water Reduce 269,000 cubic meters (CM)10% of 2012 baseline
Carbon Reduce 3,000 metric tons (MT) of fleet* carbon20% of 2012 baseline
Carbon Reduce 38,500 metric tons (MT) of facility carbon10% of 2012 baseline 13,500 MT
688 MT
2,300 MT
This brochure, a supplement to Amgen’s 2015 Environmental Sustainability Report found at
environment.amgen.com, highlights how the company is making steady progress to deliver on the
goals of our 2020 Environmental Sustainability Plan and Targets. We’ve proven that sustainable
operations are a wise investment, improving efficiency and creating value.
0% 20% 40% 60% 80% 100% 120%
*Currently showing progress for US sales fleet. Baseline is being established for sales fleet outside the US, which will be integrated into target.
142,000 CM
2012 Baseline 2020 Target
Our Targets
4
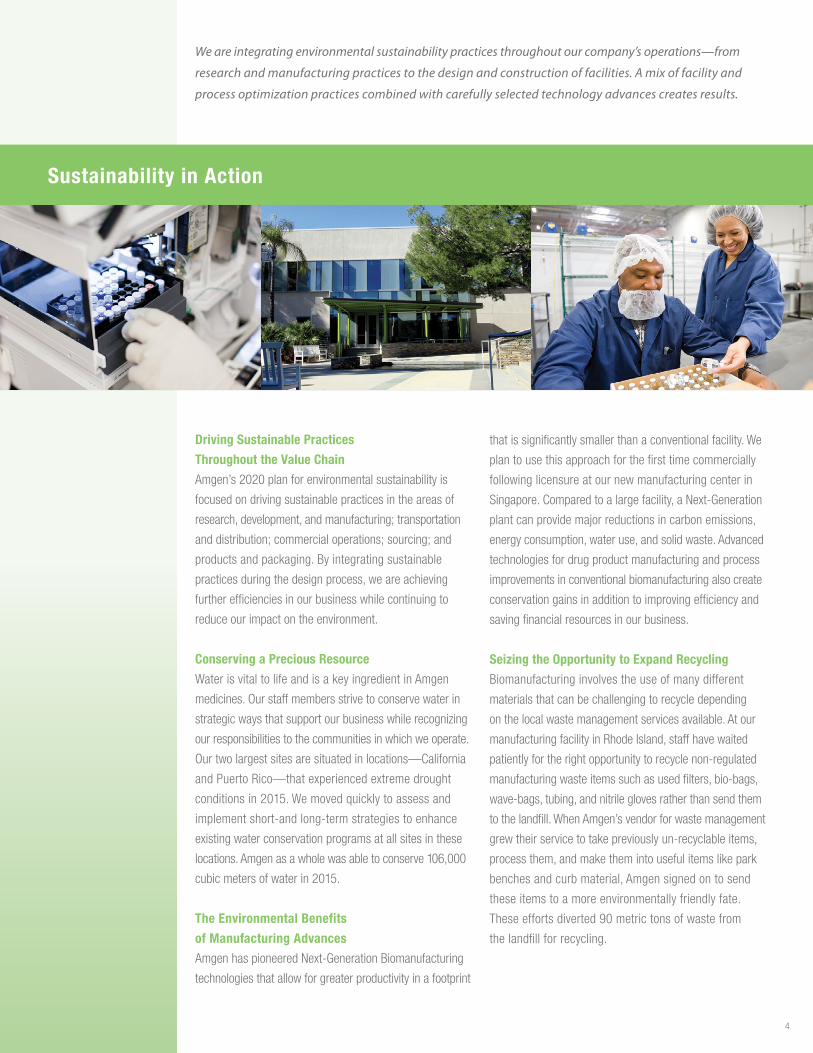
We are integrating environmental sustainability practices throughout our company’s operations—from
research and manufacturing practices to the design and construction of facilities. A mix of facility and
process optimization practices combined with carefully selected technology advances creates results.
Sustainability in Action
Driving Sustainable Practices
Throughout the Value Chain
Amgen’s 2020 plan for environmental sustainability is
focused on driving sustainable practices in the areas of
research, development, and manufacturing; transportation
and distribution; commercial operations; sourcing; and
products and packaging. By integrating sustainable
practices during the design process, we are achieving
further efficiencies in our business while continuing to
reduce our impact on the environment.
Conserving a Precious Resource
Water is vital to life and is a key ingredient in Amgen
medicines. Our staff members strive to conserve water in
strategic ways that support our business while recognizing
our responsibilities to the communities in which we operate.
Our two largest sites are situated in locations—California
and Puerto Rico—that experienced extreme drought
conditions in 2015. We moved quickly to assess and
implement short-and long-term strategies to enhance
existing water conservation programs at all sites in these
locations. Amgen as a whole was able to conserve 106,000
cubic meters of water in 2015.
The Environmental Benefits
of Manufacturing Advances
Amgen has pioneered Next-Generation Biomanufacturing
technologies that allow for greater productivity in a footprint
that is significantly smaller than a conventional facility. We
plan to use this approach for the first time commercially
following licensure at our new manufacturing center in
Singapore. Compared to a large facility, a Next-Generation
plant can provide major reductions in carbon emissions,
energy consumption, water use, and solid waste. Advanced
technologies for drug product manufacturing and process
improvements in conventional biomanufacturing also create
conservation gains in addition to improving efficiency and
saving financial resources in our business.
Seizing the Opportunity to Expand Recycling
Biomanufacturing involves the use of many different
materials that can be challenging to recycle depending
on the local waste management services available. At our
manufacturing facility in Rhode Island, staff have waited
patiently for the right opportunity to recycle non-regulated
manufacturing waste items such as used filters, bio-bags,
wave-bags, tubing, and nitrile gloves rather than send them
to the landfill. When Amgen’s vendor for waste management
grew their service to take previously un-recyclable items,
process them, and make them into useful items like park
benches and curb material, Amgen signed on to send
these items to a more environmentally friendly fate.
These efforts diverted 90 metric tons of waste from
the landfill for recycling.

5
Amgen staff approach opportunities to make environmental
improvements with the same enthusiasm and rigor they
apply to scientific challenges. Staff-supported improvements
in technology and processes have created significant
conservation benefits, saved financial resources, and earned
many awards over the years. Amgen maintains a yearly
Environmental Champions program, which honors numerous
staff from around the company for their green actions.
Reaching Out in the Community
Amgen staff are avid volunteers, contributing to a number
of environmentally beneficial events throughout the year.
Various Amgen sites participate annually in the International
Coastal Cleanup, a global volunteering opportunity in which
participants clear waterways and beaches of trash while
collecting data that support the Ocean Conservancy in its
goal of trash-free seas. Other environmental volunteering
events in which staff participate include Clean Up Australia
Day and a work party at Kendall Square in Massachusetts.
The National Parks Service and Ventura County honored
Amgen volunteers for their commitment to the community
and the environment in 2015.
The Amgen Foundation is deeply committed to fostering
the next generation of scientific innovators, including our
support of important initiatives that advance environmental
education in our local communities, such as NatureBridge
school programs at the Golden Gate National Park campus
and in the Santa Monica Mountains.
Sustainable Commuting
Amgen supports carpools, vanpools, public transportation
vouchers, bicycle commuting, and electric car charging
where possible. We tailor our alternative transportation
programs to the resources available in the communities
where Amgen operates facilities.
Education for the Environment
Amgen celebrated Earth Day at most of its US-based
locations in 2015. Events encouraged staff to develop
environmentally friendly habits both at work and at home
in the areas of recycling, composting, waste reduction,
energy efficiency, and alternative commuting. Water
conservation was of special importance during drought
conditions in 2015, and Earth Day events focused on
things that staff can do at home and at work to conserve
water. Various Amgen sites promoted waste reduction and
recycling strategies in support of America Recycles Day.
The success of our environmental sustainability plan depends on the creativity and resourcefulness of our
staff, who demonstrate their commitment to the environment both at work and in their communities.

6
175
2007–2015 Energy Use and Energy Use Avoided* Through Conservation Efforts (1,000 GJ)
2,000
4,000
1,000
0
3,000
5,000
*Value represents year-over-year, cumulative, and continuing avoidance.
2007–2015 Carbon Emissions and Carbon Emissions Avoided* Through Conservation Efforts (1,000 MT)
200
400
100
0
300
500
416
2007
19
391
2008
50
407
2010
63
381
2011
*Value represents continued avoidance based on fleet efficiency improvements
Energy
Carbon
Conserving Resources
Conserving energy allows Amgen to retain more financial resources for
our core business of discovering, developing, manufacturing, and delivering
innovative human therapeutics. Amgen has a comprehensive carbon
reduction strategy that focuses on eliminating energy use, increasing
energy efficiency, and increasing the proportion of renewable and
alternative energy used. We complete utilities projects that provide
substantial returns for both energy savings and carbon reduction across
our network of facilities around the world. Two solar projects are currently
scheduled for implementation. We have realized millions in cost savings
and reduced carbon emissions by 97,500 metric tons, or 23 percent,
from 2008 through 2015 by implementing energy conservation and
carbon reduction projects.
We are making progress towards our sales fleet carbon reduction target,
raising the minimum fuel efficiency standard for vehicles year by year.
We continue to expand the range of fuel-efficient vehicle choices
available for mobile staff—and to rotate out less fuel-efficient vehicles.
2007–2015 US Fleet Fuel Use and Fuel Use Avoided Through Conservation (per 1,000 Gal)*
2,000
1,000
500
0
1,500
2,500
US Fleet Fuel Use US Fuel Use Avoided 2007 Through 2012
US Fuel Use Avoided 2013+
Fuel Efficiency
412
2009
36 84
385
2012
369
2015
4,341
2007
4,019
245
2008
542
3,916
2010
718
3,903
2011
407
4,006
2009
919
3,849
2012
3,812
2015
1,498
2007
1,443
14
2008
1,849
345
2010
1,784
363
2011
1,297
169
2009
1,739
427
2012
1,738
427
104
2013
1,381
427
2014
289
1,414
427
2015
498
Performance
Energy Use Energy Use Avoided 2007 Through 2012*
Energy Use Avoided 2013+
919
106
3,817
2013
919
131
3,706
2014
919
Carbon Emissions Carbon Emissions Avoided From 2007 Through 2012*
Carbon Emissions Avoided 2013+
*Value represents year-over-year, cumulative and continuing avoidance.
84
8
363
2013
84 84
10 13.5
354
2014

7
2007–2015 Routine Waste Categorized by Waste Hierarchy (Metric Tons)
80%
20%
60%
0%
50%
70%
10%
90%
30%
100%
40%
Disposed Recycled, Composted, and Reused
Reduction From 2007 Through 2012*
Reduction* 2013+
The Waste Hierarchy as a Model for Our Waste-Reduction Goals
More Sustainable
Less Sustainable
Waste
Reducing Waste; Saving WaterAmgen has improved the rate of recycling from 35 percent to 52 percent
from 2007 through 2015. To build on the success of existing programs
and uncover new ways to stop waste at the source, we continue to
analyze waste audits conducted at our largest sites. We use data from
these audits to shape initiatives for recycling and waste reduction.
Amgen continues to assess water use and employ data-driven approaches
to identify new opportunities to capture water savings, especially at our
largest sites located in drought-prone geographies. We integrate water-
saving practices and technologies such as smart irrigation systems,
low-water landscaping, and waterless urinals. A key component of
Amgen’s water conservation program is a wastewater treatment plant
at our manufacturing site in Puerto Rico that has enabled an average of
70 percent of the treated wastewater to be recycled on-site each year.
Energy conservation projects often provide water conservation benefits.
3,000
1,000
500
2,000
1,500
2,500
3,500
2007–2015 Water Intake and Intake Avoided* Through Conservation Efforts (1,000 CM)
Water
0
Reduction
Recycling, Composting, Reuse
Disposal
3,542
6,604
2007
4,037
249
4,798
2008
4,757
442
4,370
2010
5,197
875
4,449
2011
4,532
358
4,177
2009
4,762
1,094
4,256
2012
4,520
1,094320
4,260
2013
4,501
1,094
441
4,429
2014 2015
2007
3,286
2008
2,738
550
2009
2,537
601
2010
2,574
663
2011
2,577
673
2015
2,520
2012
2,720
686
Water Intake Water Intake Avoided From 2007 Through 2012*
Water Intake Avoided* 2013+
*Value represents year-over-year, cumulative and continuing avoidance.
2013
2,725
686
19
2014
2,487
686 686
36 142
5,235
4,819
1,094
688

8
Strategy and Analysis
Organizational Profile
Number Disclosure Reported Response
G4-1 CEO statement: relevance of sustainability to the company environment.amgen.com (Leadership Message)
Number Disclosure Reported Response
G4-3 Name of the organization Amgen
G4-4 Primary brands, products, and services www.amgen.com (Product websites)
G4-5 Location of headquarters Thousand Oaks, CA
G4-6 Number of countries of operation www.amgen.com (Amgen Fact Sheet)
G4-7 Nature of ownership and legal form www.amgen.com (Amgen Fact Sheet)
G4-8 Markets served www.amgen.com (Amgen Fact Sheet)
G4-9Scale of organization (number of staff, number of operations, net sales, debt/equity, quantity of products provided
www.amgen.com (Amgen Fact Sheet)
G4-10 Staff information: number, region, gender, etc. www.amgen.com (Amgen Fact Sheet)
G4-13 Any changes during reporting period Amgen closed its facilities in Washington and Colorado at the end of 2015.
This report contains Standard Disclosures from the Global Reporting Initiative (GRI) Sustainability Reporting Guidelines. The GRI guidelines offer a useful framework to help companies standardize their sustainability reporting.
The scope of the environmental data in our report includes 20 manufacturing, research and development, and distribution facilities in North America, South America, Europe, and Eurasia. These facilities represent approximately 94 percent of our operations, based on the square footage of our facilities. The remaining square footage primarily includes administrative offices. Recently acquired facilities are outside the scope of this report.
Our 2015 environmental data for this report has undergone limited assurance by Bureau Veritas.
The index summarizes Amgen’s disclosures in relation to the GRI G4 indicators.
GRI Index
Identified Material Aspects and Boundaries
Number Disclosure Reported Response
G4-17 Entities covered by the report
Amgen facilities within the scope of this report are as follows:
United States: : Thousand Oaks, California; Cambridge, Massachusetts; Woburn, Massachusetts; Greenwich, Rhode Island; Louisville, Kentucky; South San Francisco, California; Boulder and Longmont, Colorado; Juncos, Puerto Rico; Seattle and Bothell, Washington; Field Sales US Fleet
Canada: Burnaby, British Columbia
Europe: Breda, Netherlands; Uxbridge, Abingdon, and Cambridge, United Kingdom; Dun Laoghaire, Ireland
Brazil: São Paulo
Turkey: Yenibosna and Sekerpinar
Reported Partial
Number Disclosure Reported Response
G4-18 Process for defining report content and determining boundaries for aspectsenvironment.amgen.com (Amgen’s Environmental Sustainability Plan)
environment.amgen.com (Stakeholder Engagement)
G4-19 List all material aspects environment.amgen.com (Amgen’s Environmental Sustainability Plan)
G4-222 Effects of any restatements from information provided in previous reports No restatements
G4-23 Significant changes from previous reports in scope or aspect boundariesAmgen closed its facilities in Washington and Colorado at the end of 2015. Data from our facilities in Brazil and Turkey are now included in the 2015 report.
Number Disclosure Reported Response
G4-242 Stakeholder groups engaged by the organization environment.amgen.com (Stakeholder Engagement)
Number Disclosure Reported Response
G4-34 Governance structure of the organization environment.amgen.com (Governance)
Number Disclosure Reported Response
G4-56 Organization’s values, principles, standards and norms of behavior www.amgen.com (Mission and Values)
Number Disclosure Reported Response
G4-28 Reporting period January 1, 2015, to December 31, 2015
G4-29 Date of most previous report May 2015
G4-30 Reporting cycle Annual
G4-31 Contact for questions regarding report [email protected]
G4-32 GRI content index environment.amgen.com (GRI Index)
G4-33 Scope and basis of external assurance environment.amgen.com (Assurance)
Number Disclosure Reported Response
G4-EC1 Direct economic value generated and distributed Yes www.amgen.com (2015 Annual Report and Financial Summary)
G4-EC2Financial implications and other risks and opportunities for the organization’s activities due to climate change
Yes
We’re actively working to conserve energy and reduce greenhouse gas emissions that result from our operations. We have also considered potential risks to our business associated with climate change such as extreme weather events and increasing regulation. Financial impact is considered as part of our risk management processes. Having plans in place to mitigate these risks increases the overall sustainability of the business.
G4-EC8 Significant indirect economic impacts, including the extent of impacts www.amgen.com (Amgen Foundation)

9
Number Disclosure Reported Response
G4-1 CEO statement: relevance of sustainability to the company environment.amgen.com (Leadership Message)
Number Disclosure Reported Response
G4-3 Name of the organization Amgen
G4-4 Primary brands, products, and services www.amgen.com (Product websites)
G4-5 Location of headquarters Thousand Oaks, CA
G4-6 Number of countries of operation www.amgen.com (Amgen Fact Sheet)
G4-7 Nature of ownership and legal form www.amgen.com (Amgen Fact Sheet)
G4-8 Markets served www.amgen.com (Amgen Fact Sheet)
G4-9Scale of organization (number of staff, number of operations, net sales, debt/equity, quantity of products provided
www.amgen.com (Amgen Fact Sheet)
G4-10 Staff information: number, region, gender, etc. www.amgen.com (Amgen Fact Sheet)
G4-13 Any changes during reporting period Amgen closed its facilities in Washington and Colorado at the end of 2015.
Identified Material Aspects and Boundaries (continued)
Stakeholder Engagement
Governance
Ethics and Integrity
Number Disclosure Reported Response
G4-18 Process for defining report content and determining boundaries for aspectsenvironment.amgen.com (Amgen’s Environmental Sustainability Plan)
environment.amgen.com (Stakeholder Engagement)
G4-19 List all material aspects environment.amgen.com (Amgen’s Environmental Sustainability Plan)
G4-222 Effects of any restatements from information provided in previous reports No restatements
G4-23 Significant changes from previous reports in scope or aspect boundariesAmgen closed its facilities in Washington and Colorado at the end of 2015. Data from our facilities in Brazil and Turkey are now included in the 2015 report.
Number Disclosure Reported Response
G4-242 Stakeholder groups engaged by the organization environment.amgen.com (Stakeholder Engagement)
Number Disclosure Reported Response
G4-34 Governance structure of the organization environment.amgen.com (Governance)
Number Disclosure Reported Response
G4-56 Organization’s values, principles, standards and norms of behavior www.amgen.com (Mission and Values)
Report Profile
Number Disclosure Reported Response
G4-28 Reporting period January 1, 2015, to December 31, 2015
G4-29 Date of most previous report May 2015
G4-30 Reporting cycle Annual
G4-31 Contact for questions regarding report [email protected]
G4-32 GRI content index environment.amgen.com (GRI Index)
G4-33 Scope and basis of external assurance environment.amgen.com (Assurance)
Economic
Number Disclosure Reported Response
G4-EC1 Direct economic value generated and distributed Yes www.amgen.com (2015 Annual Report and Financial Summary)
G4-EC2Financial implications and other risks and opportunities for the organization’s activities due to climate change
Yes
We’re actively working to conserve energy and reduce greenhouse gas emissions that result from our operations. We have also considered potential risks to our business associated with climate change such as extreme weather events and increasing regulation. Financial impact is considered as part of our risk management processes. Having plans in place to mitigate these risks increases the overall sustainability of the business.
G4-EC8 Significant indirect economic impacts, including the extent of impacts www.amgen.com (Amgen Foundation)
GRI Index
Reported Partial
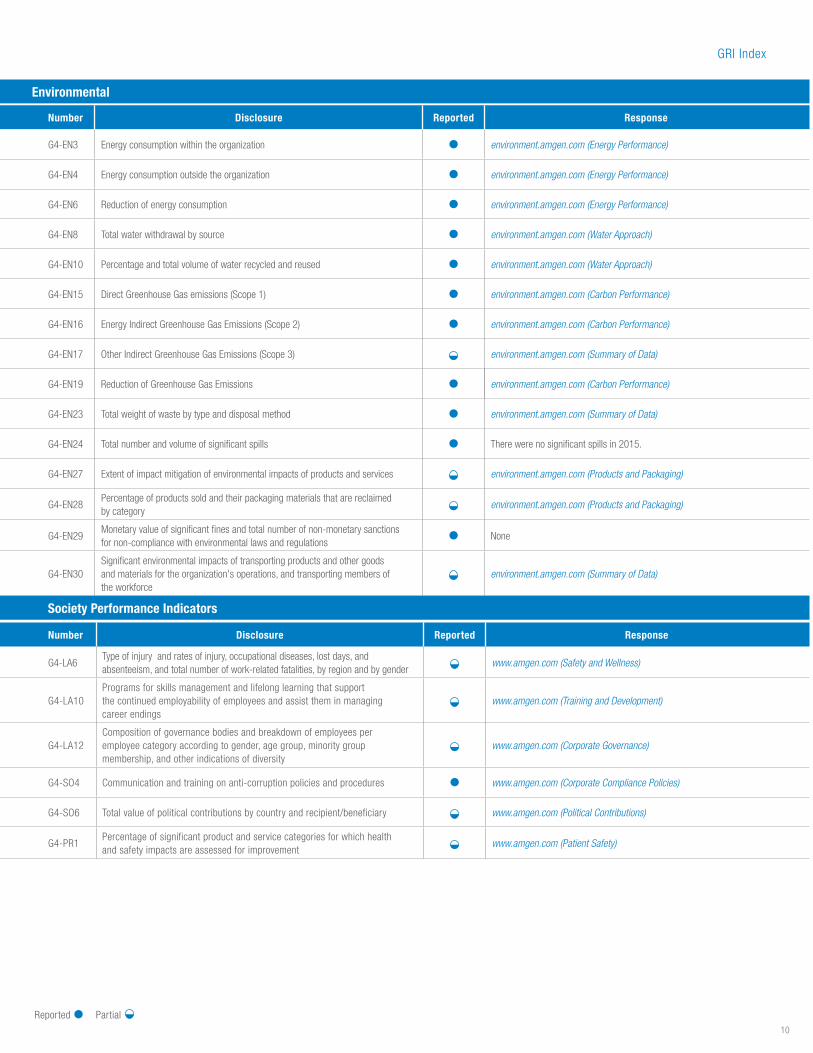
Environmental
Number Disclosure Reported Response
G4-EN3 Energy consumption within the organization environment.amgen.com (Energy Performance)
G4-EN4 Energy consumption outside the organization environment.amgen.com (Energy Performance)
G4-EN6 Reduction of energy consumption environment.amgen.com (Energy Performance)
G4-EN8 Total water withdrawal by source environment.amgen.com (Water Approach)
G4-EN10 Percentage and total volume of water recycled and reused environment.amgen.com (Water Approach)
G4-EN15 Direct Greenhouse Gas emissions (Scope 1) environment.amgen.com (Carbon Performance)
G4-EN16 Energy Indirect Greenhouse Gas Emissions (Scope 2) environment.amgen.com (Carbon Performance)
G4-EN17 Other Indirect Greenhouse Gas Emissions (Scope 3) environment.amgen.com (Summary of Data)
G4-EN19 Reduction of Greenhouse Gas Emissions environment.amgen.com (Carbon Performance)
G4-EN23 Total weight of waste by type and disposal method environment.amgen.com (Summary of Data)
G4-EN24 Total number and volume of significant spills There were no significant spills in 2015.
G4-EN27 Extent of impact mitigation of environmental impacts of products and services environment.amgen.com (Products and Packaging)
G4-EN28Percentage of products sold and their packaging materials that are reclaimed by category
environment.amgen.com (Products and Packaging)
G4-EN29Monetary value of significant fines and total number of non-monetary sanctions for non-compliance with environmental laws and regulations
None
G4-EN30Significant environmental impacts of transporting products and other goods and materials for the organization's operations, and transporting members of the workforce
environment.amgen.com (Summary of Data)
10
Society Performance Indicators
Number Disclosure Reported Response
G4-LA6Type of injury and rates of injury, occupational diseases, lost days, and absenteeism, and total number of work-related fatalities, by region and by gender
www.amgen.com (Safety and Wellness)
G4-LA10Programs for skills management and lifelong learning that support the continued employability of employees and assist them in managing career endings
www.amgen.com (Training and Development)
G4-LA12Composition of governance bodies and breakdown of employees per employee category according to gender, age group, minority group membership, and other indications of diversity
www.amgen.com (Corporate Governance)
G4-SO4 Communication and training on anti-corruption policies and procedures www.amgen.com (Corporate Compliance Policies)
G4-SO6 Total value of political contributions by country and recipient/beneficiary www.amgen.com (Political Contributions)
G4-PR1Percentage of significant product and service categories for which health and safety impacts are assessed for improvement
www.amgen.com (Patient Safety)
GRI Index
Reported Partial

Number Disclosure Reported Response
G4-EN3 Energy consumption within the organization environment.amgen.com (Energy Performance)
G4-EN4 Energy consumption outside the organization environment.amgen.com (Energy Performance)
G4-EN6 Reduction of energy consumption environment.amgen.com (Energy Performance)
G4-EN8 Total water withdrawal by source environment.amgen.com (Water Approach)
G4-EN10 Percentage and total volume of water recycled and reused environment.amgen.com (Water Approach)
G4-EN15 Direct Greenhouse Gas emissions (Scope 1) environment.amgen.com (Carbon Performance)
G4-EN16 Energy Indirect Greenhouse Gas Emissions (Scope 2) environment.amgen.com (Carbon Performance)
G4-EN17 Other Indirect Greenhouse Gas Emissions (Scope 3) environment.amgen.com (Summary of Data)
G4-EN19 Reduction of Greenhouse Gas Emissions environment.amgen.com (Carbon Performance)
G4-EN23 Total weight of waste by type and disposal method environment.amgen.com (Summary of Data)
G4-EN24 Total number and volume of significant spills There were no significant spills in 2015.
G4-EN27 Extent of impact mitigation of environmental impacts of products and services environment.amgen.com (Products and Packaging)
G4-EN28Percentage of products sold and their packaging materials that are reclaimed by category
environment.amgen.com (Products and Packaging)
G4-EN29Monetary value of significant fines and total number of non-monetary sanctions for non-compliance with environmental laws and regulations
None
G4-EN30Significant environmental impacts of transporting products and other goods and materials for the organization's operations, and transporting members of the workforce
environment.amgen.com (Summary of Data)
Number Disclosure Reported Response
G4-LA6Type of injury and rates of injury, occupational diseases, lost days, and absenteeism, and total number of work-related fatalities, by region and by gender
www.amgen.com (Safety and Wellness)
G4-LA10Programs for skills management and lifelong learning that support the continued employability of employees and assist them in managing career endings
www.amgen.com (Training and Development)
G4-LA12Composition of governance bodies and breakdown of employees per employee category according to gender, age group, minority group membership, and other indications of diversity
www.amgen.com (Corporate Governance)
G4-SO4 Communication and training on anti-corruption policies and procedures www.amgen.com (Corporate Compliance Policies)
G4-SO6 Total value of political contributions by country and recipient/beneficiary www.amgen.com (Political Contributions)
G4-PR1Percentage of significant product and service categories for which health and safety impacts are assessed for improvement
www.amgen.com (Patient Safety)
Type Unit 2007 2011 2012 2013 2014 2015
Total Combustion On-site (Direct) (d) 1,000 GJ 2,151 1,897 1,790 1,828 1,744 1,828
Natural Gas 1,000 GJ 1,848 1,462 1,390 1,400 1,322 1,371
Diesel 1,000 GJ 303 425 390 416 411 448
Propane 1,000 GJ 0 10 10 11 11 10
Total Purchased Energy (Indirect) (e) 1,000 GJ 2,190 2,006 2,059 1,990 1,962 1,983
Fossil Fuel 1,000 GJ 1,541 1,497 1,545 1,435 1,418 1,419
Hydro 1,000 GJ 287 196 191 210 200 217
Nuclear 1,000 GJ 240 194 195 185 185 178
Nonspecified Renewables 1,000 GJ 106 107 114 152 144 156
Nonspecified 1,000 GJ 16 13 13 8 14 13
Total Energy 1,000 GJ 4,341 3,903 3,849 3,817 3,706 3,812
Total Energy Normalized to Net Sales 1,000 GJ/$B net sales 303 255 231 210 192 182
Confirmed Results of Energy Reduction Projects (b,c) 1,000 GJ - 718 919 106 131 175
Type Unit 2007 2011 2012 2013 2014 2015
Total Carbon Combustion On-site (Scope 1) (f) 1,000 MT CO2Eq 126 104 98 101 96 103
Natural Gas 1,000 MT CO2Eq 104 74 70 71 67 71
Diesel 1,000 MT CO2Eq 22 30 27 29 29 32
Propane 1,000 MT CO2Eq - 0.60 0.63 1 1 1
Total Carbon Purchased Energy (Scope 2) (g) 1,000 MT CO2Eq 290 277 287 263 258 266
Electricity 1,000 MT CO2Eq 284 273 283 259 254 263
Steam 1,000 MT CO2Eq 6 4 4 4 4 3
Total Carbon from Energy 1,000 MT CO2Eq 416 381 385 363 354 369
Total Carbon Normalized to Net Sales 1,000 MT CO2Eq/$B net sales 29.1 24.9 23.1 20 18 18
Total Carbon Normalized to Total Energy MTCO2Eq/GJ 0.095 0.098 0.100 0.095 0.10 0.097
Confirmed Results of CO2 Reduction Projects (b,c) 1,000 MT CO2 0 63 84 8 10 13.5
Energy ( a )
Carbon ( a )
Summary of Data
11

12
Type Unit 2007 2011 2012 2013 2014 2015
Total Water Withdrawal (k,c) 1,000 CM 3,286 2,577 2,720 2,725 2,487 2,520
Municipal 1,000 CM 3,249 2,560 2,707 2,712 2,482 2,453
Other - (Reservoir) Trucked In 1,000 CM 8 - - - - -
Ground 1,000 CM 29 17 13 13 5 68
Total Water Withdrawal Normalized to Net Sales 1,000 CM/$B net sales 230 169 163 150 129 120
Water Fate 1,000 CM - 2,584 2,720 2,739 2,487 2,512
Consumed Into Products 1,000 CM - 20 21 21 28 71
Lost to Evaporation 1,000 CM - 633 713 684 657 736
Discharged to Treatment 1,000 CM - 1,663 1,662 1,758 1,551 1,449
Discharged Directly to Environment 1,000 CM - 267 324 276 250 256
Recycled 1,000 CM - 533 535 655 525 759
Percentage of Water Recycled per Total Water Withdrawal % - 21 20 24 21 30%
Confirmed Results of Water Reduction Projects (b) 1,000 CM - 673 686 19 36 142
Type Unit 2007 2011 2012 2013 2014 2015
Carbon US Sales Fleet (Scope 1) 1,000 MT CO2Eq 13 16 15 16 13 13
Carbon US Sales Fleet Emissions Avoided (Scope 1) (o) 1,000 MT CO2Eq 0 3 4 1 2 2.3
Carbon Executive Air Fleet (Scope 1) 1,000 MT CO2Eq 5 7 6 5 5 6
Carbon from Fugitive Refrigerant Emissions (Scope 1) MT CO2Eq - - - 4,231 5,499 3,958
Carbon Business Travel - Commercial (Scope 3) (i,j) 1,000 MT CO2Eq - 50 65 67 65 74
Carbon from Amgen Materials Transportation (Scope 3) (i,j) 1,000 MT CO2Eq - - 25 27 25 29
Water ( a )
Summary of Data
Other Carbon ( h )

13
Type Unit 2007 2011 2012 2013 2014 2015
US Sales Fleet Fuel Efficiency MPG-US 19 23 23 25 26 27
US Sales Fleet Fuel Use Avoided (o) 1,000 GL - 363 427 104 289 498
US Sales Fleet Fuel Use 1,000 GL 1,498 1,784 1,739 1,738 1,381 1,414
Waste ( a , c )
Compliance ( a )
Fleet
Type Unit 2007 2011 2012 2013 2014 2015
Diversion from Landfill Rate (l) % 38 59 59 - - -
Recycling Rate (l) % 34.9 53.9 52.8 51.3 50.4 52.1
Total Routine Waste MT 10,146 9,645 9,018 8,780 8,929 10,054
Hazardous Waste MT 1,343 1,116 1,180 1,157 1,113 1,455
Recycled MT 251 235 245 105 84 190
Incinerated for Energy Recovery MT 375 284 347 402 387 447
Incinerated Not for Energy Recovery MT 523 424 422 468 473 683
Landfilled MT 118 153 126 147 132 102
Treated (m) MT 76 20 40 36 38 33
Nonhazardous Waste MT 8,803 8,529 7,838 7,623 7,816 8,599
Composted MT 260 485 583 532 628 947
Reused MT 32 60 44 274 178 153
Recycled MT 2,999 4,418 3,890 3,583 3,610 3,945
Incinerated for Energy Recovery MT 432 397 576 604 605 700
Incinerated Not for Energy Recovery MT 194 176 79 48 88 259
Landfilled MT 4,885 2,985 2,662 2,530 2,661 2,543
Treated (m) MT - 8 4 52 47 52
Total Routine Waste Normalized to Net Sales MT/$B net sales 709 631 542 483 462 480
Total Nonroutine Waste (n) MT 31,415 12,458 16,902 8,452 3,722 2,253
Confirmed Results of Routine Waste Reduction Projects (b) MT - 875 1,094 320 441 688
Type Unit 2007 2011 2012 2013 2014 2015
Environmental Notices of Violation (NOVs) (w) # NOV 8 2 2 2 6 1
Summary of Data

14
Summary of Data—Notes
(p) Environmental notices of violation (NOVs) reported that resulted from agency inspections.
(a)
Amgen has included data from 20 facilities covering energy and carbon, water, and waste. The facilities represent approximately 94 percent of Amgen’s worldwide facility space based on total square feet. Included facilities are in Thousand Oaks, California, US; Greenwich, Rhode Island, US; Boulder and Longmont, Colorado, US; Seattle and Bothell, Washington, US; Juncos, Puerto Rico, US; Louisville, Kentucky, US; South San Francisco, California, US; Cambridge and Woburn, Massachusetts, US; Burnaby, Canada; Breda, Netherlands; Dun Laoghaire, Ireland; Uxbridge, Abingdon, and Cambridge, United Kingdom; Sao Paolo, Brazil; and Yenisbosna and Sekerpinar, Turkey. This includes leased buildings where we have operational control over building infrastructure, including utilities. In 2011, Amgen acquired a facility in São Paulo. In 2012, Amgen acquired four companies: Micromet, KAI Pharmaceuticals, deCODE genetics, and Mustafa Nevzat Pharmaceuticals. In 2013 Amgen acquired Onyx Pharmaceuticals. No data will be included for our Micromet, KAI Pharmaceuticals, deCODE genetics, or Onyx Pharmaceuticals in this report, as we are still working through the integration process for these facilities.
(b)
Measurement and verification of conservation and reduction projects for energy and carbon, water, and waste are based on adaptation of the International Performance Measurement and Verification Protocol (IPMVP), Concepts and Options for Determining Energy and Water Savings Volume 1, EVO 10000-1.2007, April 2007. Project measurements are conducted using reasonable means, including direct measurements and scientific estimations as appropriate. Values for conservation and reduction projects represent year-over-year, cumulative and continuing avoidance based on a 2007 baseline, then rebaselined in 2012 to match the next generation 2020 Target design. Results from conservation and reduction projects from sites in Brazil and Turkey are not included in the 2015 report.
(c)Immaterial changes to 2007–15 data may have occurred due to refinements in calculations. All changes have been confirmed through a documented change control process.
(d)
Direct energy use results from the operation of equipment that is owned or controlled by Amgen at the facilities listed in note (a). Data on the use of natural gas, propane, and diesel in boilers, furnaces, and HVAC are recorded from utility bills or purchase records. Data on the use of diesel in emergency generators are recorded from purchase records or meter readings and, in some cases, estimated from run-hours. Utility bills recorded in units of volume are converted to energy by using the Global Reporting Initiative Version 3.1, EN3 table, to convert volumes of primary sources (natural gas, diesel), or from specific fuel analysis data (diesel used in Juncos, Puerto Rico), and the US Energy Information Administration/Annual Energy Review Table A1 (propane). Energy from emergency generators recorded as run-hours is estimated using the manufacturer’s specified fuel-feed rate for each generator.
(e)
Indirect energy use results from purchased energy in the forms of electricity and steam at the Amgen facilities listed in note (a). Data on the use of electricity and steam are recorded from utility bills. Utility bills for purchased steam that are recorded in units of mass (i.e., ‘lb steam’) are converted to energy by using the latent heat of evaporation from the saturated steam tables, then dividing by the efficiency of the supplier’s steam generator.
(f)
Scope 1 carbon emissions result from direct energy sources defined in note (d). Additional Scope 1 Carbon emissions from our US sales fleet, executive air fleet, and fugitive emissions from chillers, coolers, and HVAC are found in the Other Carbon category in this data summary. Carbon data from natural gas sources are calculated using regional specific emission factors from US EPA Rule Part 98A Table C-3 (US weighted average) for all US sites; from the Ireland UFCCC for Amgen’s facility in Dun Laoghaire, Ireland; from U.K. Defra/DECC’s 110819 Guidelines for Amgen’s facilities in the United Kingdom (Uxbridge, Abingdon, and Cambridge); from the NL Agency standard CO
2 emission factors for Amgen’s facility in the Netherlands (Breda); and from the Methodology for Reporting
2013 Ministry of Environment Victoria, BC, 2013, for Amgen’s facility in Burnaby, Canada. Carbon emissions data from propane and diesel fuel sources (except Amgen’s facility in Juncos, Puerto Rico) are calculated using the Greenhouse Gas Protocol Cross-Sector Tools-Stationary Combustion-V.1.0 (August 2012). Carbon from diesel use in Amgen’s Juncos, Puerto Rico, facility are calculated using specific fuel analysis information and from US EPA Rule Part 98A Table C-1. Carbon data from direct energy sources prior to 2011 were calculated using emission factors from the Greenhouse Gas Protocol Cross-Sector Tools-Stationary Combustion-V.1.0 (Jul 2009). Scope 1 emissions that are not included in this data summary include process-related emissions from cell respiration (carbon as a by-product) and pH adjustments (CO
2 injection). Analysis of these sources in 2013 showed that cell respiration and emissions from pH adjustments are negligible
(less than 0.1 percent of our total carbon emissions).
(g)
Scope 2 carbon emissions result from indirect energy sources defined in note (e). Carbon data from purchased electricity are calculated using emission factors from US EPA eGRID 2012 for all US locations except Amgen’s facility in Puerto Rico, which has been determined using EPA GHG Report YE 2012 for Power Suppliers in Puerto Rico; from the Greenhouse Gas Division, Environment Canada (2006 data)-V.1.0 (April 2009) for Amgen’s facility in Burnaby, Canada; and from specific utility annual providers’ reports for Amgen facilities in the United Kingdom (Uxbridge, Abingdon, and Cambridge), the Netherlands (Breda), and Dun Laoghaire, Ireland. Carbon data from purchased steam are calculated using the Emission Factor for Natural Gas as identified in US EPA Rule Part 98A Table C-3 (US weighted average) for Amgen’s facility in Cambridge, Massachusetts. Carbon data from indirect energy sources prior to 2011 were calculated using emission factors from US EPA eGRID2007 Version 1.1 for US facilities.
General
Energy
Carbon

15
Summary of Data—Notes
(p) Environmental notices of violation (NOVs) reported that resulted from agency inspections.
(o)Emissions and fuel use avoided are the result of improvements in fleet efficiency from years 2007 through 2012 based on a 2007 baseline, and 2013+ based on a 2012 baseline.
(d)
Direct energy use results from the operation of equipment that is owned or controlled by Amgen at the facilities listed in note (a). Data on the use of natural gas, propane, and diesel in boilers, furnaces, and HVAC are recorded from utility bills or purchase records. Data on the use of diesel in emergency generators are recorded from purchase records or meter readings and, in some cases, estimated from run-hours. Utility bills recorded in units of volume are converted to energy by using the Global Reporting Initiative Version 3.1, EN3 table, to convert volumes of primary sources (natural gas, diesel), or from specific fuel analysis data (diesel used in Juncos, Puerto Rico), and the US Energy Information Administration/Annual Energy Review Table A1 (propane). Energy from emergency generators recorded as run-hours is estimated using the manufacturer’s specified fuel-feed rate for each generator.
(e)
Indirect energy use results from purchased energy in the forms of electricity and steam at the Amgen facilities listed in note (a). Data on the use of electricity and steam are recorded from utility bills. Utility bills for purchased steam that are recorded in units of mass (i.e., ‘lb steam’) are converted to energy by using the latent heat of evaporation from the saturated steam tables, then dividing by the efficiency of the supplier’s steam generator.
(f)
Scope 1 carbon emissions result from direct energy sources defined in note (d). Additional Scope 1 Carbon emissions from our US sales fleet, executive air fleet, and fugitive emissions from chillers, coolers, and HVAC are found in the Other Carbon category in this data summary. Carbon data from natural gas sources are calculated using regional specific emission factors from US EPA Rule Part 98A Table C-3 (US weighted average) for all US sites; from the Ireland UFCCC for Amgen’s facility in Dun Laoghaire, Ireland; from U.K. Defra/DECC’s 110819 Guidelines for Amgen’s facilities in the United Kingdom (Uxbridge, Abingdon, and Cambridge); from the NL Agency standard CO
2 emission factors for Amgen’s facility in the Netherlands (Breda); and from the Methodology for Reporting
2013 Ministry of Environment Victoria, BC, 2013, for Amgen’s facility in Burnaby, Canada. Carbon emissions data from propane and diesel fuel sources (except Amgen’s facility in Juncos, Puerto Rico) are calculated using the Greenhouse Gas Protocol Cross-Sector Tools-Stationary Combustion-V.1.0 (August 2012). Carbon from diesel use in Amgen’s Juncos, Puerto Rico, facility are calculated using specific fuel analysis information and from US EPA Rule Part 98A Table C-1. Carbon data from direct energy sources prior to 2011 were calculated using emission factors from the Greenhouse Gas Protocol Cross-Sector Tools-Stationary Combustion-V.1.0 (Jul 2009). Scope 1 emissions that are not included in this data summary include process-related emissions from cell respiration (carbon as a by-product) and pH adjustments (CO
2 injection). Analysis of these sources in 2013 showed that cell respiration and emissions from pH adjustments are negligible
(less than 0.1 percent of our total carbon emissions).
(g)
Scope 2 carbon emissions result from indirect energy sources defined in note (e). Carbon data from purchased electricity are calculated using emission factors from US EPA eGRID 2012 for all US locations except Amgen’s facility in Puerto Rico, which has been determined using EPA GHG Report YE 2012 for Power Suppliers in Puerto Rico; from the Greenhouse Gas Division, Environment Canada (2006 data)-V.1.0 (April 2009) for Amgen’s facility in Burnaby, Canada; and from specific utility annual providers’ reports for Amgen facilities in the United Kingdom (Uxbridge, Abingdon, and Cambridge), the Netherlands (Breda), and Dun Laoghaire, Ireland. Carbon data from purchased steam are calculated using the Emission Factor for Natural Gas as identified in US EPA Rule Part 98A Table C-3 (US weighted average) for Amgen’s facility in Cambridge, Massachusetts. Carbon data from indirect energy sources prior to 2011 were calculated using emission factors from US EPA eGRID2007 Version 1.1 for US facilities.
(h)
The Other Carbon category contains additional Scope 1 and Scope 3 carbon emissions that are tracked. Carbon emissions from our executive air fleet are calculated using emission factors from the Greenhouse Gas Protocol Cross-Sector Tools-Transport-Fuel-Use (August 2012). Carbon emissions from our US sales fleet are calculated using emission factors from the GHG Protocol Emission Factors for Petrol passenger cars (volume) (GHG Protocol) = 8.81 kg/gal. Fuel use and mileage data are collected at the pump for each vehicle. Carbon emissions from our commercial business travel are calculated by Amgen’s travel provider using the Defra tool. Carbon emissions from Amgen’s material transportation have been provided by the carrier using its own specific methods. Fugitive emissions from process equipment (e.g., refrigerant from refrigeration and HVAC equipment) are calculated using emission factors from the Greenhouse Gas Protocol Cross-Sector Tools-Transport-Fuel-Use (August 2012). Processes are in place to maintain chillers, coolers, and HVAC equipment to prevent unintended emissions.
(i)Scope 3 carbon emissions are a consequence of the activities of the company but occur from sources not owned or controlled by the company. Scope 3 carbon emissions that are currently tracked include emissions from Amgen’s commercial business travel (air and rail) and material transportation.
(j)Commercial business travel was not tracked in 2007 or 2008. Material transportation was not tracked from 2007 to 2011. The accuracy of carbon emissions tracking from chillers, coolers, and HVAC improved in 2013 and will now be reported going forward.
(k) Immaterial discrepancy between values for total water fate and total water withdrawal is due to rounding and compilation of individual facility totals.
(l)
Recycling rate is the proportion of waste that is recycled, composted, and reused compared with the total volume of routine, nonhazardous and hazardous waste generated. Diversion from landfill is the proportion of waste that is incinerated (both for energy recovery and not), landfilled, and treated compared with the total routine, nonhazardous waste generated.
(m)Treatment means the physical, thermal, chemical, or biological processes that change the characteristics of the waste in order to reduce its volume or hazardous nature, facilitate its handling, or enhance recovery.
(n) Nonroutine waste constitutes waste generated outside the normal operations of our facilities and consists mainly of construction and demolition waste.
Other Carbon
Water
Waste
Fleet
Compliance

16
Summary of Data—Assurance
INDEPENDENT ASSURANCE STATEMENT
Introduction and objectives of work
Bureau Veritas North America, Inc. (BVNA) has been engaged by Amgen to conduct an independent assurance of selected environmental data included in Amgen’s 2015 Environmental Sustainability Report.
This Assurance Statement applies to the related information included within the scope of work described below.
The data presented in Amgen’s 2015 Environmental Sustainability Report is the sole responsibility of the management of Amgen. BVNA was not involved in the drafting of the Report. Our sole responsibility was to provide independent verification of the accuracy of selected information included in the Report.
Scope of work
Amgen requested BVNA to verify the accuracy of the following environmental data summarized in Amgen’s Environmental Sustainability Report for the Calendar Year 2015 reporting period:
Energy Use (Total, Direct and Indirect) Greenhouse Gas Emissions (Direct Scope 1 and Indirect Scope 2 location-based) Water Withdrawal and Fate Waste Quantities and Disposition
Excluded from the scope of our work is any verification of information relating to:
Text or other written statements associated with Amgen’s 2015 Environmental Sustainability Report
Activities outside the defined verification period of Calendar Year 2015
Methodology
As part of its independent verification, BVNA undertook the following activities:
1. Interviews with relevant personnel of Amgen regarding data collection and reporting systems;
2. Review of Amgen’s data and information systems and methodology for collection, aggregation, analysis and internal audit of information used to determine the environmental data;
3. Review of documentary evidence produced by Amgen;
4. Audit of Amgen’s data traced back to the source for facilities located in Providence, Rhode Island and Juncos, Puerto Rico during site visits; and
5. Review of the centralized data, methods for consolidation of site data and site data available in the centralized data management system during a visit to Amgen’s headquarters location in Thousand Oaks, California.
Our assurance work was conducted in accordance with Bureau Veritas procedures based on the International Standard on Assurance Engagements (ISAE) 3000 and ISO Standard 14064-3 Greenhouse Gases - Part 3: Specification with Guidance for the Validation and Verification of Greenhouse Gas Assertions. In accordance with our internal procedures for limited assurance, we use these as our reference standards.
17
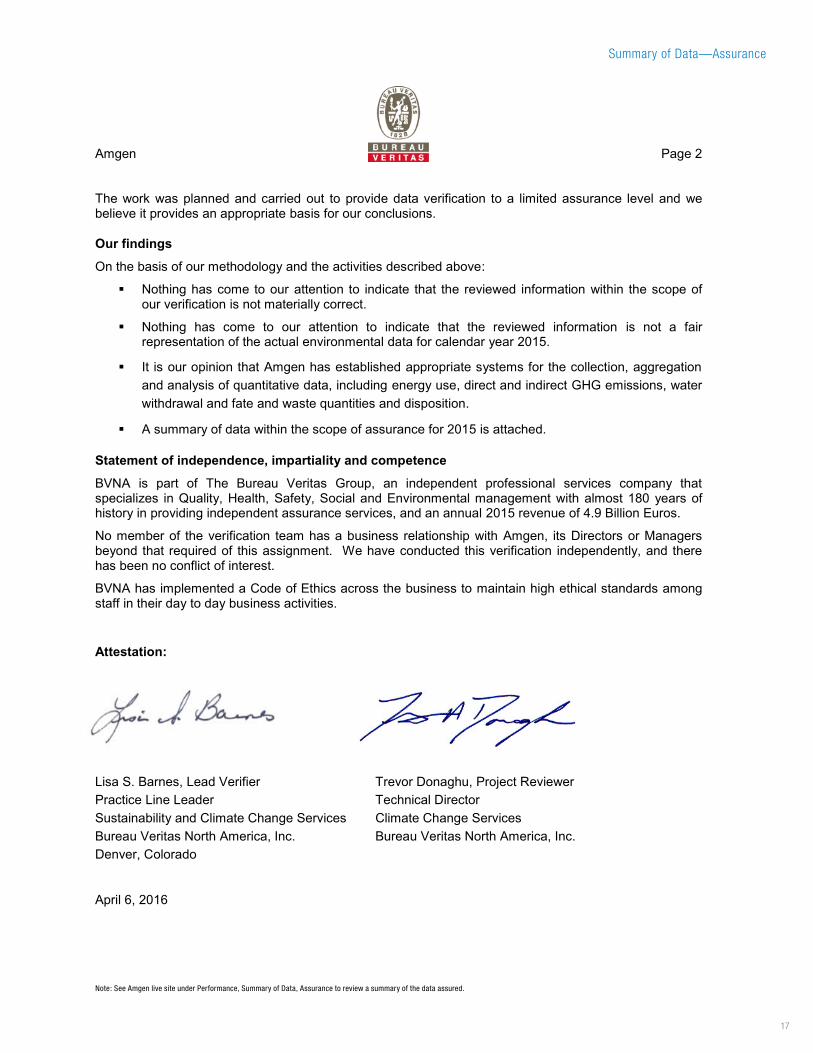
Amgen Page 2 The work was planned and carried out to provide data verification to a limited assurance level and we believe it provides an appropriate basis for our conclusions.
Our findings
On the basis of our methodology and the activities described above:
Nothing has come to our attention to indicate that the reviewed information within the scope of our verification is not materially correct.
Nothing has come to our attention to indicate that the reviewed information is not a fair representation of the actual environmental data for calendar year 2015.
It is our opinion that Amgen has established appropriate systems for the collection, aggregation and analysis of quantitative data, including energy use, direct and indirect GHG emissions, water withdrawal and fate and waste quantities and disposition.
A summary of data within the scope of assurance for 2015 is attached.
Statement of independence, impartiality and competence
BVNA is part of The Bureau Veritas Group, an independent professional services company that specializes in Quality, Health, Safety, Social and Environmental management with almost 180 years of history in providing independent assurance services, and an annual 2015 revenue of 4.9 Billion Euros.
No member of the verification team has a business relationship with Amgen, its Directors or Managers beyond that required of this assignment. We have conducted this verification independently, and there has been no conflict of interest.
BVNA has implemented a Code of Ethics across the business to maintain high ethical standards among staff in their day to day business activities.
Attestation:
Lisa S. Barnes, Lead Verifier Trevor Donaghu, Project Reviewer Practice Line Leader Technical Director Sustainability and Climate Change Services Climate Change Services Bureau Veritas North America, Inc. Bureau Veritas North America, Inc. Denver, Colorado
April 6, 2016
Summary of Data—Assurance
Note: See Amgen live site under Performance, Summary of Data, Assurance to review a summary of the data assured.

18
“As a biology-focused company, we have a deep
appreciation for the natural environment. We
continuously improve operations in a variety of
ways to improve our environmental impact.”
— Robert A. Bradway, Chairman and CEO, Amgen
19
To view Amgen’s full 2015 Environmental Sustainability
Report, see environment.amgen.com. We welcome
your feedback.
Forward-Looking Statements This brochure contains forward-looking statements that are based on the current expectations and beliefs of Amgen. All statements,
other than statements of historical fact, are statements that could be deemed forward-looking statements, including those related to our
environmental sustainability program design; expected environmental sustainability goals, targets, plans, focus areas, savings or progress
towards any of the same; current and future R&D, manufacturing, commercialization, infrastructure or other workplace-related processes,
improvements or practices and other such estimates and results. Forward-looking statements involve significant risks and uncertainties,
including those discussed below and more fully described in the Securities and Exchange Commission reports filed by Amgen, including
our most recent annual report on Form 10-K and any subsequent periodic reports on Form 10-Q and Form 8-K. Unless otherwise noted,
Amgen is providing this information as of the date of this brochure and does not undertake any obligation to update any forward-looking
statements contained in this document as a result of new information, future events or otherwise.
No forward-looking statement can be guaranteed and actual results may differ materially from those we project. Our results may be affected
by our ability to successfully market both new and existing products domestically and internationally, clinical and regulatory developments
involving current and future products, sales growth of recently launched products, competition from other products including biosimilars,
difficulties or delays in manufacturing our products and global economic conditions. In addition, sales of our products are affected by
pricing pressure, political and public scrutiny and reimbursement policies imposed by third-party payers, including governments, private
insurance plans and managed care providers and may be affected by regulatory, clinical and guideline developments and domestic and
international trends toward managed care and healthcare cost containment. Furthermore, our research, testing, pricing, marketing and
other operations are subject to extensive regulation by domestic and foreign government regulatory authorities. We or others could identify
safety, side effects or manufacturing problems with our products after they are on the market. Our business may be impacted by government
investigations, litigation and product liability claims. In addition, our business may be impacted by the adoption of new tax legislation or
exposure to additional tax liabilities. If we fail to meet the compliance obligations in the corporate integrity agreement between us and the
U.S. government, we could become subject to significant sanctions. Further, while we routinely obtain patents for our products and technology,
the protection offered by our patents and patent applications may be challenged, invalidated or circumvented by our competitors, or we
may fail to prevail in present and future intellectual property litigation. We perform a substantial amount of our commercial manufacturing
activities at a few key facilities and also depend on third parties for a portion of our manufacturing activities, and limits on supply may constrain
sales of certain of our current products and product candidate development. In addition, we compete with other companies with respect to
many of our marketed products as well as for the discovery and development of new products. Discovery or identification of new product
candidates cannot be guaranteed and movement from concept to product is uncertain; consequently, there can be no guarantee that any
particular product candidate will be successful and become a commercial product. Further, some raw materials, medical devices and
component parts for our products are supplied by sole third-party suppliers. The discovery of significant problems with a product similar to
one of our products that implicate an entire class of products could have a material adverse effect on sales of the affected products and on
our business and results of operations. Our efforts to acquire other companies or products and to integrate the operations of companies we
have acquired may not be successful. We may not be able to access the capital and credit markets on terms that are favorable to us, or at
all. We are increasingly dependent on information technology systems, infrastructure and data security. Our stock price is volatile and may
be affected by a number of events. Our business performance could affect or limit the ability of our Board of Directors to declare a dividend or
our ability to pay a dividend or repurchase our common stock.
Amgen Inc.
One Amgen Center Drive
Thousand Oaks, CA 91320-1799
www.amgen.com
© 2016 Amgen Inc. All rights reserved.
Printed on paper made with 100% post-consumer waste.
Please recycle.
Design by Saputo Design, Inc.