Embed Size (px)
Citation preview
Assessing the groundwater resources and estimating future demand for irrigation in three districts of Nepal
Presenter:Romulus O. Okwany, PhD.
Acknowledgement:Birendra YadavUNESCO-IHE
Presentation Outline
• Background• Problem statement• Research objectives• Research questions• Study Area• Methodology• Results• Conclusions and Recommendations
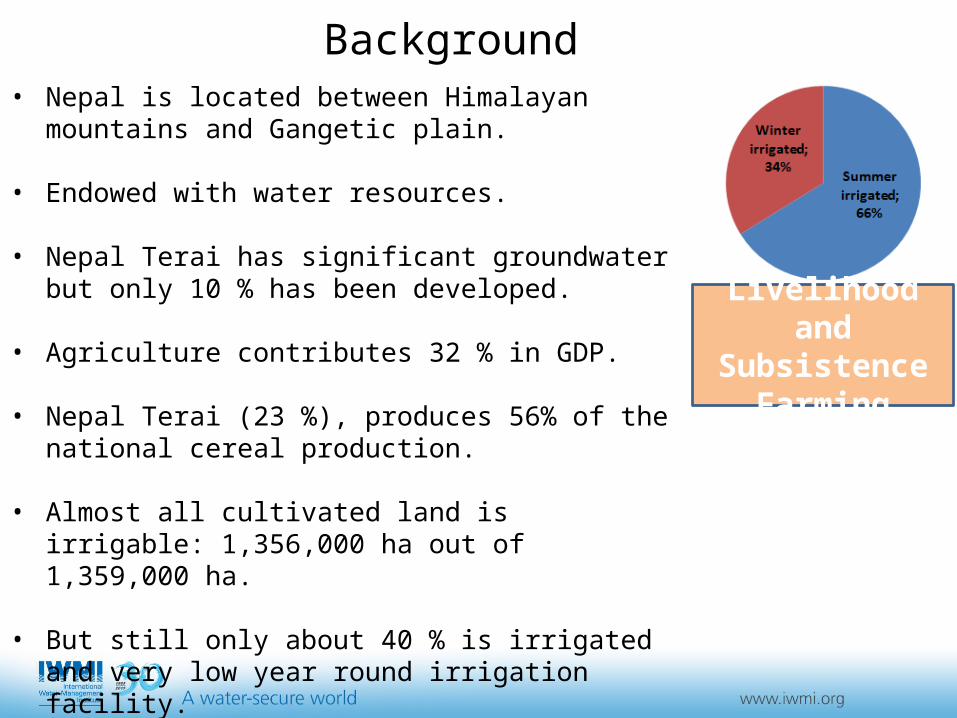
Background• Nepal is located between Himalayan mountains and
Gangetic plain.
• Endowed with water resources.
• Nepal Terai has significant groundwater but only 10 % has been developed.
• Agriculture contributes 32 % in GDP.
• Nepal Terai (23 %), produces 56% of the national cereal production.
• Almost all cultivated land is irrigable: 1,356,000 ha out of 1,359,000 ha.
• But still only about 40 % is irrigated and very low year round irrigation facility.
Livelihood and Subsistence
Farming
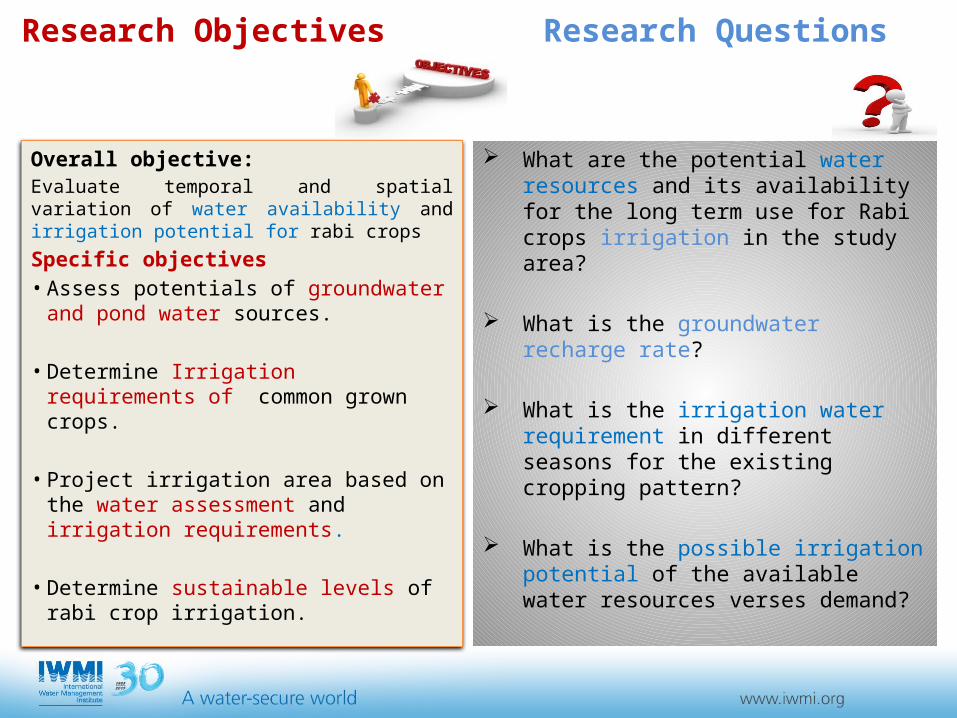
Research Questions
What are the potential water resources and its availability for the long term use for Rabi crops irrigation in the study area?
What is the groundwater recharge rate?
What is the irrigation water requirement in different seasons for the existing cropping pattern?
What is the possible irrigation potential of the available water resources verses demand?
Research Objectives
Overall objective:Evaluate temporal and spatial variation of water availability and irrigation potential for rabi crops
Specific objectives• Assess potentials of groundwater and
pond water sources.
• Determine Irrigation requirements of common grown crops.
• Project irrigation area based on the water assessment and irrigation requirements.
• Determine sustainable levels of rabi crop irrigation.
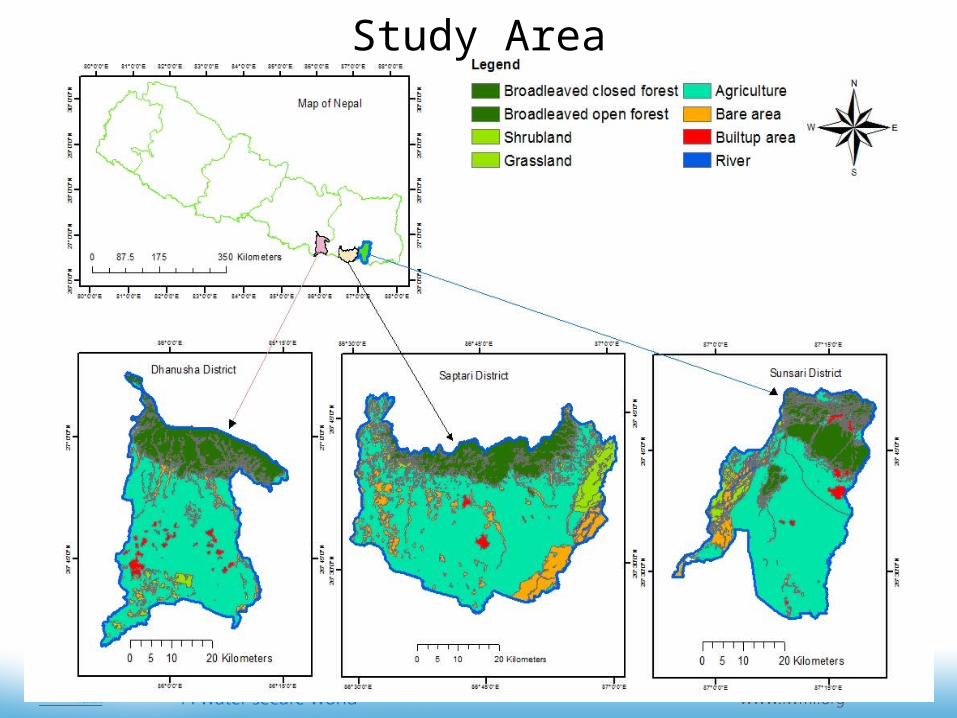
Study Area

Methodology

Results
JANMAR
MAY JUL
SEP
NOV0
100
200
300
400
500
600 0.00.51.01.52.02.53.03.54.04.55.0
Sunsari DistrictAvg. Rainfall Avg. ET Avg. WT
Mon
thly
Pre
cipi
tatio
n an
d PE
T (m
m)
Gro
undw
ater
Tab
le d
epth
BG
S (m
)JAN
MARMAY JU
LSE
PNOV
0
100
200
300
400
500
600 0.00.51.01.52.02.53.03.54.04.55.0
Saptari District
Mon
thly
Pre
cipi
tatio
n an
d PE
T (m
m) G
roundwater Table depth BG
S (m)
JAN FE
BM
ARAPR
MAY
JUN JU
LAUG
SEP
OCTNOV
DEC0
100
200
300
400
500
600 0.00.51.01.52.02.53.03.54.04.55.0
Dhanusha District
Mon
thly
Pre
cipi
tati
on &
PET
(mm
) Groundw
ater Table Depth BG
S (m)
Average Monthly Rainfall, PET and Water Table

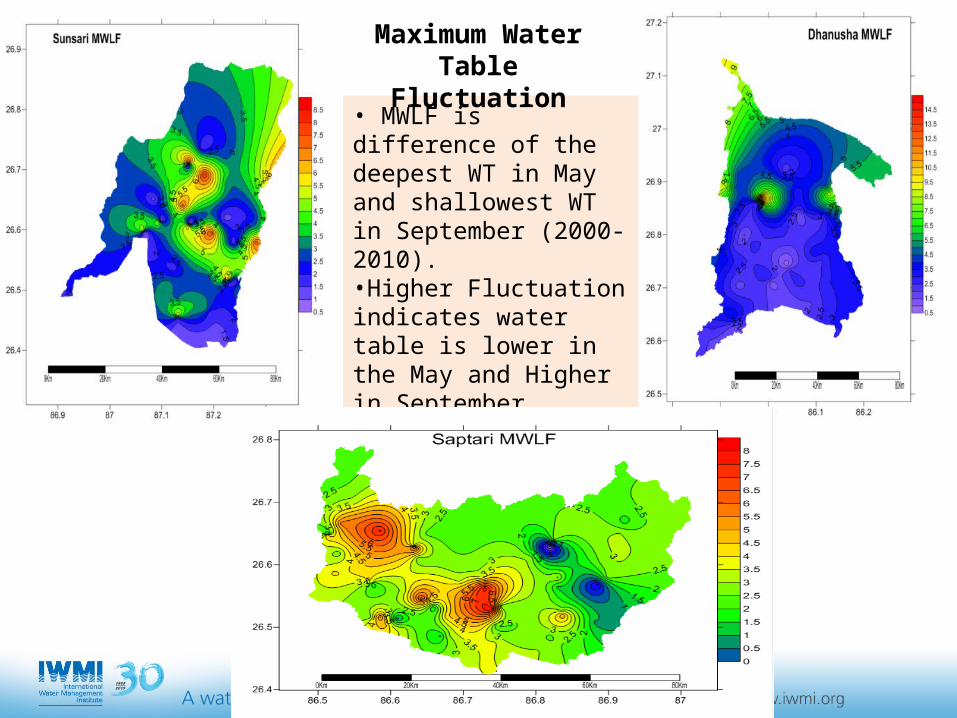
• MWLF is difference of the deepest WT in May and shallowest WT in September (2000-2010).•Higher Fluctuation indicates water table is lower in the May and Higher in September.•Filling in Monsoon and evacuating in dry season.
Maximum Water Table Fluctuation
2004 2005 2006 2007 2008 2009 20106.6
6.8
7.0
7.2
7.4
7.6
7.8
8.0
8.2
8.4
8.6Water Table Recovery
GWT Godam Rajbiraj
Years
Wat
er T
able
BGS
(m)
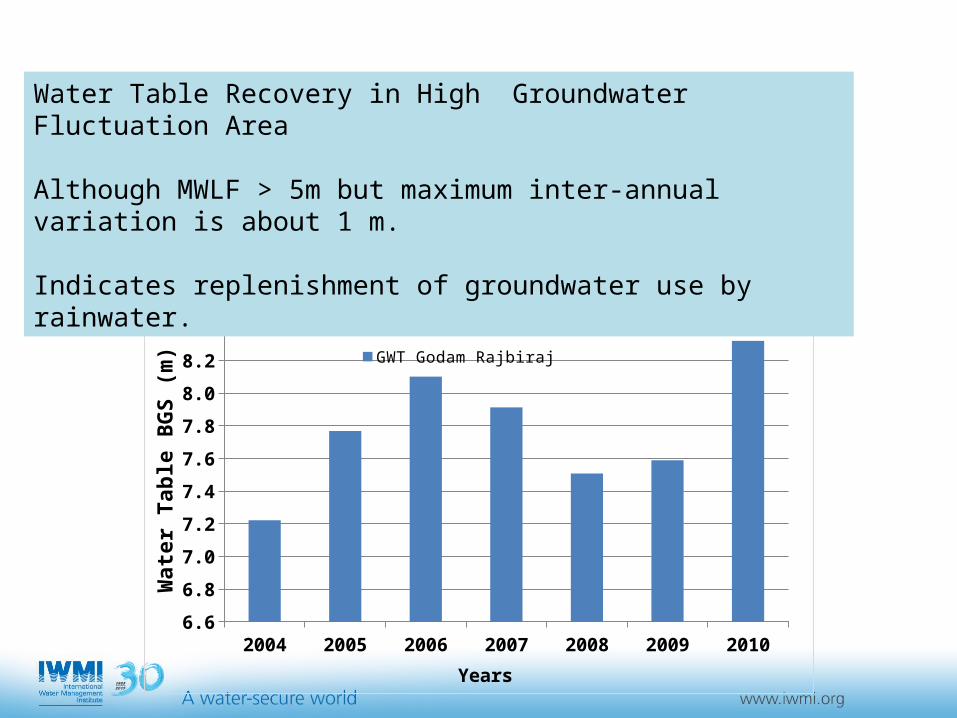
Water Table Recovery in High Groundwater Fluctuation Area
Although MWLF > 5m but maximum inter-annual variation is about 1 m.
Indicates replenishment of groundwater use by rainwater.

Annual Recharge Estimation Using Surfer and WTF Method
Name of Districts
Surfer Annual Recharge (mm/yr)
WTF Annual Recharge (mm/yr)
Average Annual
Recharge (mm/yr)
Average Annual
Rainfall (mm/yr)
Recharge as % of Rainfall
Sunsari 141 135 138 2163 6%
Saptari 161 169 165 1749 9%
Dhanusha 119 132 126 1624 8%
Result Accuracy• Results from Surfer and WTF shows close results. • Recharge study area 143 mm/yr is very close national internal ground
water recharge of 145 mm/yr (Margat and Van der Gun, 2013).
2000 2001 2002 2003 2004 2005 2006 2007 2008 2009 20100
50
100
150
200
250
300
350 Sunsari District
Surfer WTF
Average Annual Groundwater Recharge and Rainfall

Pond Water Source
Districts No. of Permanent Ponds
No. of Temporary Ponds
Potential annual volume for use ( MCM)
Sunsari 707 576 1.55
Saptari 1848 996 7.00
Dhanusha 1956 902 4.82

Total Annual Available Water for Use
Gross irrigation requirements of common crops
Gross Irrigation Requirement (mm)
Crops Paddy Wheat Pulses/Oilseeds Winter Vegetable Maize
Sunsari 186 150 110 115 48
Saptari 350 245 151 154 125
Dhanusha 327 169 122 187 72
Districts Groundwater Volume (MCM)
Pond water Volume (MCM)
Total Annual Water Availability (MCM)
Sunsari 158 2 160
Saptari 205 7 212
Dhanusha 146 5 151
District
Non irrigated area (ha)
Irrigation requirement Volume based on current use form groundwater (MCM)
Total Available
water (MCM)
Summer Volume Winter Volume Spring
Volume
Total Volume (MCM)
Summer Winter Summer Winter (Rabi Crop) Spring
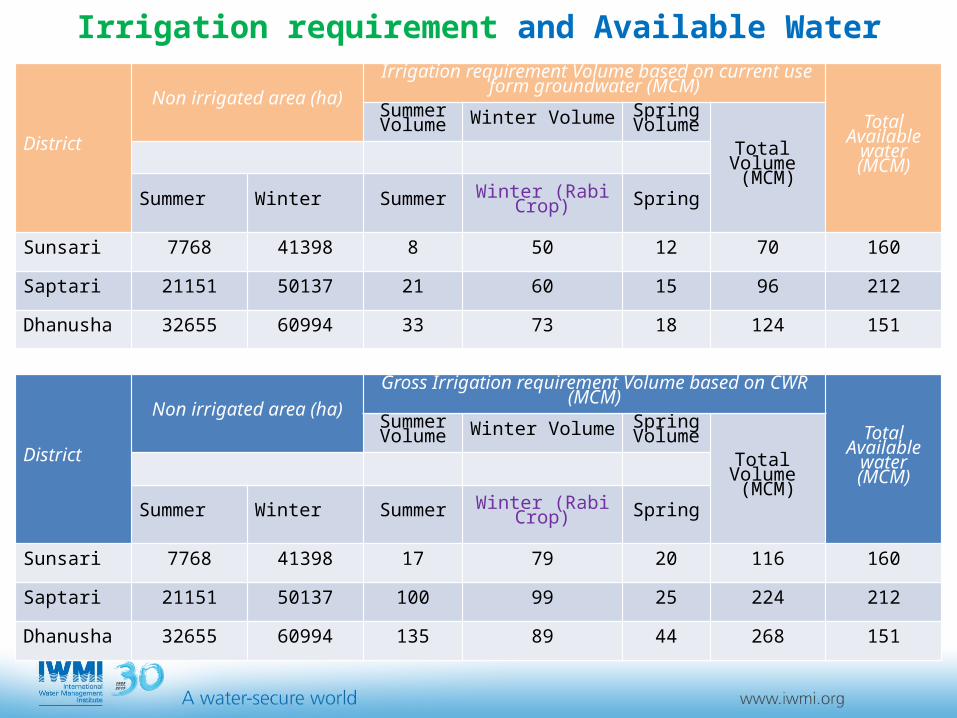
Sunsari 7768 41398 8 50 12 70 160
Saptari 21151 50137 21 60 15 96 212
Dhanusha 32655 60994 33 73 18 124 151
District
Non irrigated area (ha)
Gross Irrigation requirement Volume based on CWR (MCM)
Total Available
water (MCM)
Summer Volume Winter Volume Spring
Volume
Total Volume (MCM)
Summer Winter Summer Winter (Rabi Crop) Spring
Sunsari 7768 41398 17 79 20 116 160
Saptari 21151 50137 100 99 25 224 212
Dhanusha 32655 60994 135 89 44 268 151
Irrigation requirement and Available Water
Districts Agriculture Demand (MCM)
Domestic use (MCM)
Industry and cattle use (MCM)
Total Demand (MCM)
Water Availability (MCM)
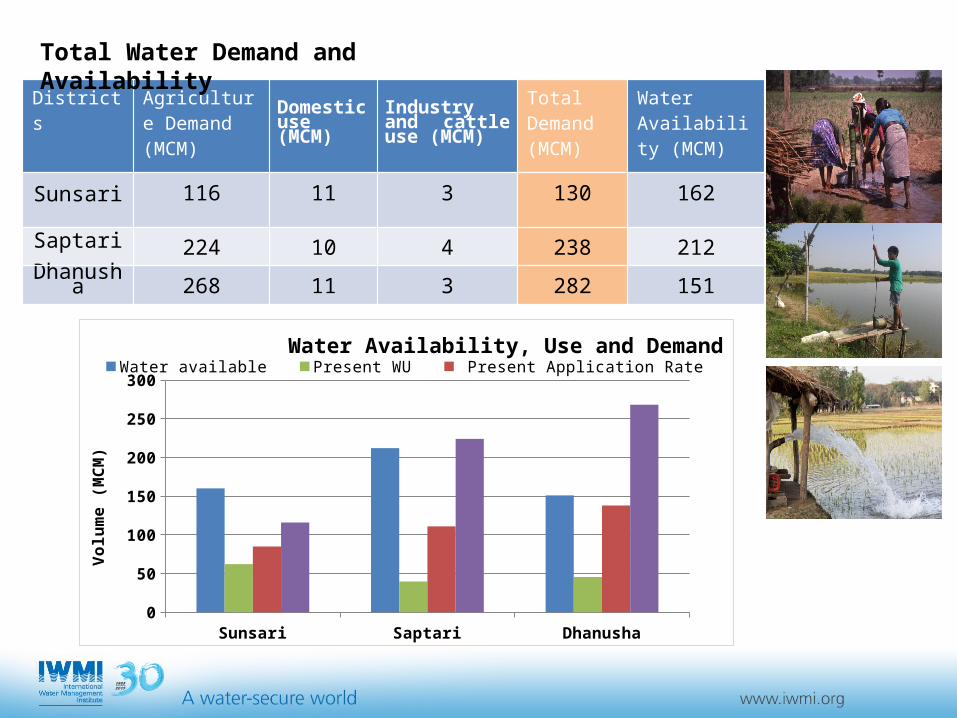
Sunsari 116 11 3 130 162
Saptari 224 10 4 238 212
Dhanusha 268 11 3 282 151
Total Water Demand and Availability
Sunsari Saptari Dhanusha0
50
100
150
200
250
300
Water Availability, Use and Demand Water available Present WU Present Application Rate Total Demand
Volu
me
(MCM
)

• Potential water sources for Rabi crop can be Groundwater and Pond water.
• Potential annual water sources available for use was found 160, 212 and 151 MCM for Sunsari, Saptari and Dhanusha districts respectively.
• Average annual groundwater recharge of 138, 165 and 146 mm/yr was found Sunsari, Saptari and Dhanusha districts respectively.
• Total irrigation volume requirement for all seasons are 116, 224 and 268 MCM for Sunsari, Saptari and Dhanusha districts respectively.
• Significantly high water availability than Rabi crop demand indicates that available water can be used sustainably for Rabi crops.
• For Summer season, it is possible to irrigate all non irrigated agricultural land in Sunsari whereas only 97 % and 11 % of non irrigated area in Saptari and Dhanusha districts respectively.
Recommendations• Utilizations of available water by facilitating the farmers or group is necessary
to raise production and productivity in the study area.
• Development and Management of Temporary ponds to increase the water availability as well as recharge.
• Conjunctive use of groundwater for sustainability and to minimize the cost of irrigation.
• Adoption of proper irrigation methods to minimize the losses of water.
• Important to know base flow for groundwater balance.
• WRA is an important for better planning and sustainable development.
Recommendations and Future Research
Future Research• More comprehensive study on spatial specific yield.• Economics of groundwater use.

Thank You!
Contact Information:Romulus O. Okwany
Email: [email protected]: @Romulus_Okwany https://
np.linkedin.com/pub/romulus-okwany/1a/472/466
Australian Center for International Agricultural Research (ACIAR)Research program on Water, Land and Ecosystems (WLE)