Embed Size (px)
Citation preview
Building active and competitive cities solves many problemsActive Cities SummitJune 9, 2015
Chad SpoonCommunications & Partnership Manager, ALR

www.activelivingresearch.org
USPS honors “iconic images of America”
www.activelivingresearch.org
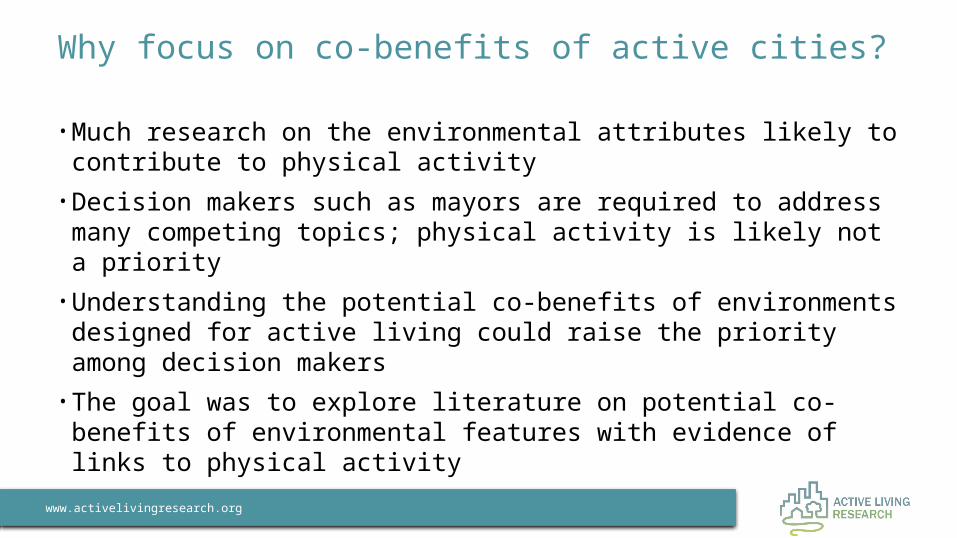
• Much research on the environmental attributes likely to contribute to physical activity
• Decision makers such as mayors are required to address many competing topics; physical activity is likely not a priority
• Understanding the potential co-benefits of environments designed for active living could raise the priority among decision makers
• The goal was to explore literature on potential co-benefits of environmental features with evidence of links to physical activity
Why focus on co-benefits of active cities?

www.activelivingresearch.org
Outcomes of Activity Supportive Built Environments
Outcome / Co-Benefit
Description
Physical health Chronic diseases, obesity
Mental health Depression, anxiety, well being, quality of life
Social benefits Neighborhood/social cohesion, human capital
Environmental
benefits
Carbon dioxide emissions, pollutants
Injury prevention Crime, violence, car crashes
Economic benefits Land value, governmental infrastructure costs, real estate profitability, productivity/job performance, health care costs, economic performance of cities

www.activelivingresearch.org
• These settings must be considered in the design of Active Cities• What are the key modifiable features of these settings that have evidence of
association with physical activity?– A short list of features was identified for each setting
• ALR led a lit review to document co-benefits of active design—and found many
Where to start

www.activelivingresearch.org
• 221 sources were identified, yielding 521 relevant findings– 418 findings from higher-quality
sources contributed to quasi-quantitative scoring
• All findings are detailed in tables and scored for quality
• Used quasi-quantitative approach to summarize results to create “net” scores
Making the case
www.activelivingresearch.org
Active cities solve many problems
www.activelivingresearch.org
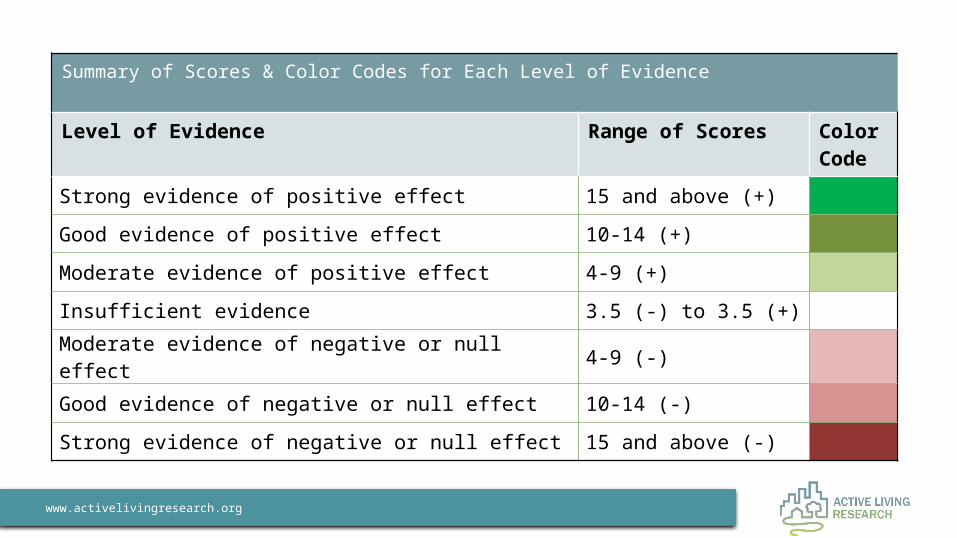
Summary of Scores & Color Codes for Each Level of Evidence
Level of Evidence Range of Scores Color Code
Strong evidence of positive effect 15 and above (+)
Good evidence of positive effect 10-14 (+)
Moderate evidence of positive effect 4-9 (+)
Insufficient evidence 3.5 (-) to 3.5 (+)
Moderate evidence of negative or null effect 4-9 (-)
Good evidence of negative or null effect 10-14 (-)
Strong evidence of negative or null effect 15 and above (-)

www.activelivingresearch.org
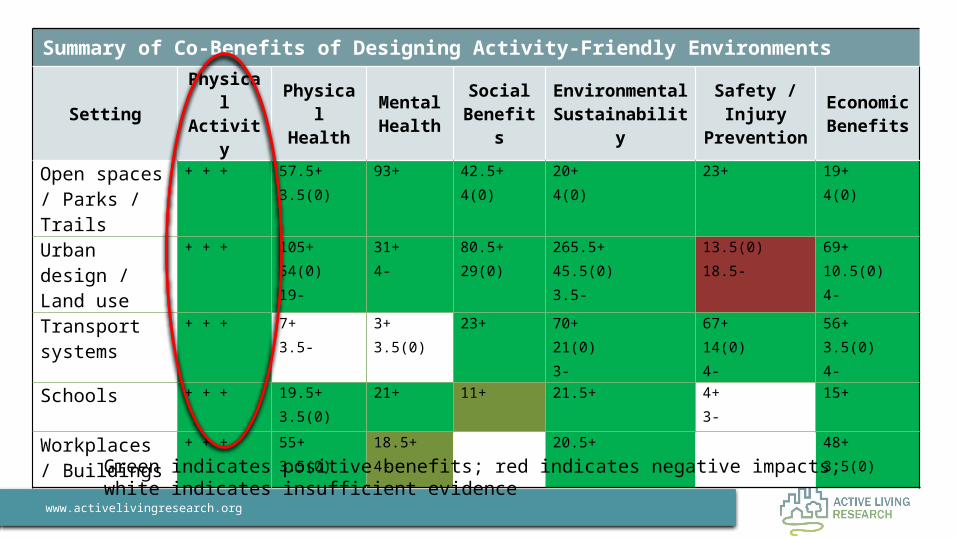
Summary of Co-Benefits of Designing Activity-Friendly Environments
Setting Physical Activity
Physical Health
Mental Health
Social Benefit
s
Environmental
Sustainability
Safety / Injury
Prevention
Economic
Benefits
Open spaces / Parks / Trails
+ + + 57.5+3.5(0)
93+ 42.5+4(0)
20+4(0)
23+ 19+4(0)
Urban design / Land use
+ + + 105+54(0)19-
31+4-
80.5+29(0)
265.5+45.5(0)3.5-
13.5(0)18.5-
69+10.5(0)4-
Transport systems
+ + + 7+3.5-
3+3.5(0)
23+ 70+21(0)3-
67+14(0)4-
56+3.5(0)4-
Schools + + + 19.5+3.5(0)
21+ 11+ 21.5+ 4+3-
15+
Workplaces / Buildings
+ + + 55+3.5(0)
18.5+4-
20.5+ 48+3.5(0)
Green indicates positive benefits; red indicates negative impacts; white indicates insufficient evidence
www.activelivingresearch.org
Summary of Co-Benefits of Designing Activity-Friendly Environments
Setting Physical Activity
Physical Health
Mental Health
Social Benefit
s
Environmental
Sustainability
Safety / Injury
Prevention
Economic
Benefits
Open spaces / Parks / Trails
+ + + 57.5+3.5(0)
93+ 42.5+4(0)
20+4(0)
23+ 19+4(0)
Urban design / Land use
+ + + 105+54(0)19-
31+4-
80.5+29(0)
265.5+45.5(0)3.5-
13.5(0)18.5-
69+10.5(0)4-
Transport systems
+ + + 7+3.5-
3+3.5(0)
23+ 70+21(0)3-
67+14(0)4-
56+3.5(0)4-
Schools + + + 19.5+3.5(0)
21+ 11+ 21.5+ 4+3-
15+
Workplaces / Buildings
+ + + 55+3.5(0)
18.5+4-
20.5+ 48+3.5(0)
Green indicates positive benefits; red indicates negative impacts; white indicates insufficient evidence

www.activelivingresearch.org
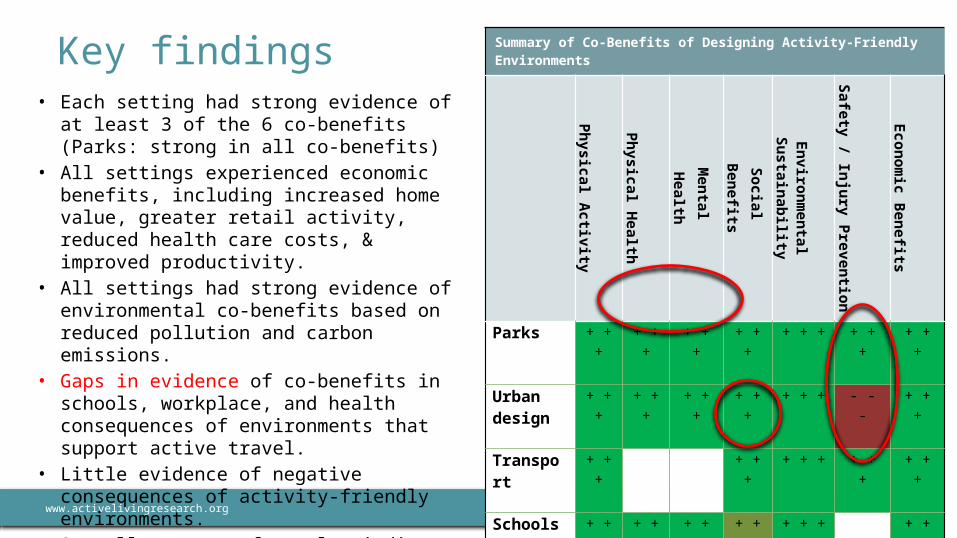
• Each setting had strong evidence of at least 3 of the 6 co-benefits (Parks: strong in all co-benefits)
• All settings experienced economic benefits, including increased home value, greater retail activity, reduced health care costs, & improved productivity.
• All settings had strong evidence of environmental co-benefits based on reduced pollution and carbon emissions.
• Gaps in evidence of co-benefits in schools, workplace, and health consequences of environments that support active travel.
• Little evidence of negative consequences of activity-friendly environments.
• Overall pattern of results indicate overwhelmingly positive effects for numerous important outcomes from activity-friendly environment designs.
Key findings Summary of Co-Benefits of Designing Activity-Friendly Environments
Physica
l Activity
Physica
l Health
Mental Health
Social
Benefits
Environmental
Sustainabil
ity
Safety /
Injury
Prevention
Economic Benefits
Parks + + +
+ + +
+ + +
+ + +
+ + + + + +
+ + +
Urban design
+ + +
+ + +
+ + +
+ + +
+ + + - - - + + +
Transport
+ + +
+ + +
+ + + + + +
+ + +
Schools + + +
+ + +
+ + +
+ + + + + + + +
Buildings
+ + +
+ + +
+ + + + + + + +

www.activelivingresearch.org
• Each setting had strong evidence of at least 3 of the 6 co-benefits (Parks: strong in all co-benefits)
• All settings experienced economic benefits, including increased home value, greater retail activity, reduced health care costs, & improved productivity.
• All settings had strong evidence of environmental co-benefits based on reduced pollution and carbon emissions.
• Gaps in evidence of co-benefits in schools, workplace, and health consequences of environments that support active travel.
• Little evidence of negative consequences of activity-friendly environments.
• Overall pattern of results indicate overwhelmingly positive effects for numerous important outcomes from activity-friendly environment designs.
Key findings Summary of Co-Benefits of Designing Activity-Friendly Environments
Physica
l Activity
Physica
l Health
Mental Health
Social
Benefits
Environmental
Sustainabil
ity
Safety /
Injury
Prevention
Economic Benefits
Parks + + +
+ + +
+ + +
+ + +
+ + + + + +
+ + +
Urban design
+ + +
+ + +
+ + +
+ + +
+ + + - - - + + +
Transport
+ + +
+ + +
+ + + + + +
+ + +
Schools + + +
+ + +
+ + +
+ + + + + + + +
Buildings
+ + +
+ + +
+ + + + + + + +

www.activelivingresearch.org
An active city is a competitive city. The return on investments are across every dimension of civic life – productivity, education, safety, economic development, health, and more.

www.activelivingresearch.org
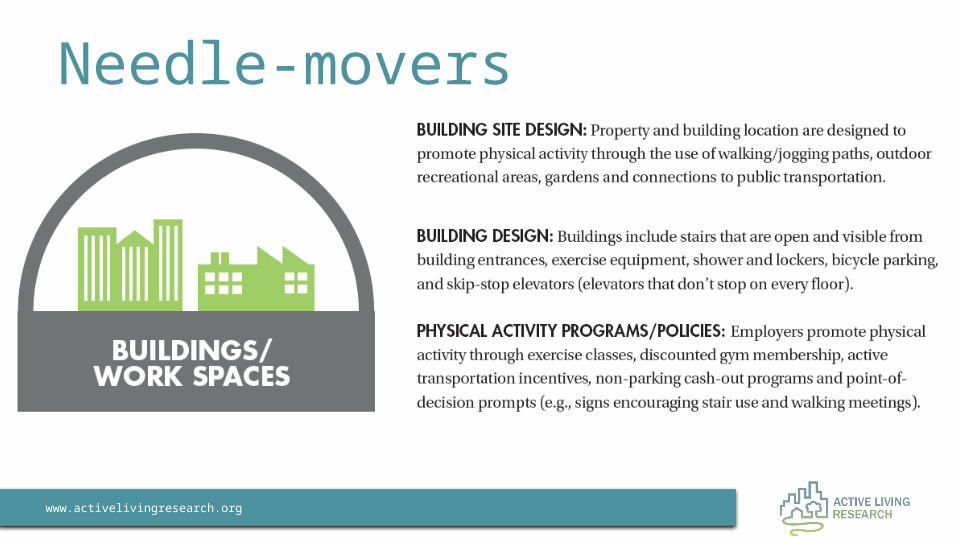
Needle movers with economic benefits Open
Spaces / Parks / Trails
Urban Design / Land Use
Transportation Systems Schools Workplaces /
Buildings
Presence, proximity
Residential density Pedestrian / Bike facilities
School siting Building siting
Design features Mixed land use Crosswalk markings Recreation facilities
Mixed land use around workplace
Trails Streetscale pedestrian design
Traffic calming Shared use agreements
Building site design
PA programs / promotion
Greenery Public Transport Building design
Incivilities Accessibility & street connectivity
Traffic speed/ Volume Worksite PA policies and programs
Public gardens Safe routes to school Workplace furniture design
Ciclovia / Play streets
Managed parking

www.activelivingresearch.org
Parks / trails– Homes near parks can sell for up to $2,262 more than homes without
parks nearby– Study in Nebraska found for every $1 spent on trails, almost $3 in
savings in direct medical costs– Public investments in the Platte River Greenway in Denver of $70M
fueled $2.5B in residential, commercial, and other development along the corridor
Pedestrian / bike facilities– Making places better for walking can boost footfall and trading by up to
40% and raise retail rents by 20%– Projects in UK shown to increase employment by 300%– Bike investments in Portland estimated to result in health care cost
savings up to $594M by 2040
Economic benefits

www.activelivingresearch.org
Mixed land use– Homes in more walkable neighborhoods worth $4K– $34K more than those in
less walkable neighborhoods– A higher Walk Score rating associated with 42% increase in net operating
incomeSchool siting– Community-based schools support higher property values and saves in
construction and operating costsWorksite PA programs– Save at least $3 for every $1 invested– Lower absentee rates, improved productivity and fewer health-related work
limitations
Economic benefits

www.activelivingresearch.org
Physical & mental health benefits– Living near heavy traffic volume translates into about a 5% increase in BMI – Urban greenery associated with less stress, speedier hospital recoveries, & improved mental health
Safety benefits– Study of 37 Complete Streets improvements in US averted $18.1M in collision costs in 1 year (plus
increases in property values, new businesses, & higher employment)– Traffic calming reduces crash rates by 29%– SRTS produced 44% reduction in youth pedestrian injuries
Environmental benefits– 5% increase in walkability associated with 6.5% decrease in VMT, equating to 6% decrease in
emissions
Public demand– More than half of Americans prefer neighborhoods that are close to shops, have mix of incomes
and provides public transportation
Additional benefits

www.activelivingresearch.org
Designed to Move: Active Cities• Making the Case findings serve as 1st
chapter• How to achieve an active city• Working across city departments• Checklists, practical steps/ideas,
sample metrics• Talking points for city leaders• Case studies of ‘bright spots’• Tools and resources

www.activelivingresearch.org
• Download “Making the Case” report at: activelivingresearch.org/making-case-designing-active-cities
• Download the published journal article in International Journal of Behavioral Nutrition and Physical Activity at: ijbnpa.org/content/12/1/30
• Contact: Chad Spoon, [email protected]

www.activelivingresearch.org
Extra slides as needed

www.activelivingresearch.org
Needle-movers

www.activelivingresearch.org
Needle-movers

www.activelivingresearch.org
Needle-movers

www.activelivingresearch.org
Needle-movers
www.activelivingresearch.org
Needle-movers

www.activelivingresearch.org
69 entries. Of 36 cells, 3 had strong evidence of co-benefits, 3 had good evidence, and 7 had moderate evidence

www.activelivingresearch.org
202 entries. Of 30 cells, 8 had strong evidence of co-benefits, 5 had good evidence, and 6 had moderate evidence of positive effects. 5 cells with negative effects.
Urban Design / Land Use Summary ScoresBuilt
Environment Attribute
Physical Health
Mental Health
Social Benefits
Environmental Sustainability
Safety / Injury
Prevention
Economic Benefits
Residential density
19+21.5(0)7.5-
13.5+14.5(0)
88+21(0)3.5-
4.5(0)7.5-
15+3.5(0)
Mixed land use
28+17(0)4-
4.5+4-
33+11(0)
95+21(0)
4.5(0)11-
22.5+3.5(0)4-
Streetscale pedestrian design
7.5+ 7.5+ 7.5+ 7+
Greenery 20.5+3.5(0)
26.5+ 12+ 39.5+ 12+
Accessibility & Street connectivity
30+12(0)7.5-
14.5+3.5(0)
35.5+3.5(0)
4.5(0) 12.5+3.5(0)

www.activelivingresearch.org
81 entries. Of 48 cells, 5 had strong evidence of co-benefits, 2 had good evidence, and 6 had moderate evidence of positive effects. 1 cell with negative effects.
Transportation Systems Summary ScoresBuilt
Environment Attribute
Physical Health
Mental Health
Social Benefits
Environmental Sustainability
Safety / Injury
Prevention
Economic Benefits
Pedestrian / Bicycle facilities
3+ 7+ 10.5+3.5(0)
27.5+4(0)
22.5+3.5(0)
Crosswalk markings
6(0)4-
Traffic calming 3.5+ 3.5(0) 3+ 3+3-
23+ 3+
Public Transport 3.5- 28.5+17.5(0)
20+4-
Traffic speed/ Volume
3.5+ 3+ 14+ 7+ 7+
Safe routes to school
3+ 3.5+ 9.5+4(0)
Ciclovia / Play streets
7+ 3.5+
Managed parking
10.5+

www.activelivingresearch.org
27 entries. Of 18 cells, 2 had strong evidence of co-benefits, 1 had good evidence, and 5 had moderate evidence of positive effects.

www.activelivingresearch.org
39 entries. Of 36 cells, 3 had strong evidence of co-benefits, 3 had good evidence, and 5 had moderate evidence of positive benefits.

www.activelivingresearch.org
Example of data abstracting

www.activelivingresearch.org
Example of setting summary of findings matrix