Embed Size (px)
Citation preview
0 Tetra Tech NUS, Inc.
Comparison of Factor Analysis and SingleElement Geochemical Predictions Using
Linear Regression with Weighted Variance
Russell Sloboda, Tetra Tech NUS
Poster Presentation for the 18th Annual
Association for Environmental Health and Sciences
West Coast Conference on Soils, Sediments, and Water
March 10 – 13, 2008, San Diego, California
Tetra Tech NUS, Inc.

1 Tetra Tech NUS, Inc.
I. ABSTRACT
•At a military base, metals concentrations were characterized inbackground soils using geochemical prediction methods appliedto a database representing several USDA soil types.
•Linear regression 95 percent Upper Prediction Limits (UPL) wereestimated for future comparisons of site data to background.
•Simple linear regressions were based on one predictor metal,such as iron, while factor analysis predicted soil metalconcentrations based on overall mineral patterns in a sample.
•Linear prediction equations were based on metals that exhibitfactor loadings onto the factor scores for a metal of interest.
•Factor analysis back-predictions subtracted the influence of themetal of interest and renormalized factor pattern coefficients.
•Accuracy of factor analysis predictive ability was assessed bystripping out the influence of a metal of interest and evaluatingthe residual errors of observed versus predicted values.

2 Tetra Tech NUS, Inc.
II. PROBLEM DEFINITION AND STUDY GOALS
•State Regulations for Arsenic Concentrations in Soil:
–Average < 7 mg/kg, <= 10% samples > 7 mg/kg, no samples > 15 mg/kg
•Within a military base, 1179 soil samples were analyzed for arsenic:
– Average = 10 mg/kg, 31% samples > 7 mg/kg arsenic, 19% > 15 mg/kg
•US Dept. of Agriculture (USDA) soil types found within base areas:
–Mansfield mucky silt loam (MA) –Merrimack sandy loam (MM)
–Newport silt loam (NE) –Pittstown silt loam (PM)
–Stissing silt loam (SE) –Beach soils (BA)
–Udorthents-Urban land complex (UD) = Soil disturbed by cutting/filling
•Background Sampling Goals to allow future comparisons to site data:
–Background database for 2 sample hypothesis tests & geochemical tests
–Assess soil type differences to see if can combine background soil types
–Geochemical prediction model applicability to disturbed soil or fill thatmay contain any combination of soil types in the background data
–Characterize all metals, natural or anthropogenic & unimpacted by IR sites

3 Tetra Tech NUS, Inc.
III. Box Plots of Background Soil Arsenic Data
• Interquartile rangevaries by soil type
•4 possible outliers
•All positive results
•Beaches (BASS):
–Lowest conc.
•MA, PM, & SE soil:
–conc.[SB] > [SS]
•NE soil type:
–conc.[SS] > [SB]
•MM soil type:
–conc.[SS] ~ [SB]

4 Tetra Tech NUS, Inc.
IV. Box Plots of Bedrock Arsenic Data
7.4
42.2
0
20
40
60
80
Phylite Conglomerate
Ars
en
ic,
mg
/kg
q1 (25%)
MIN
median
MAX
ND (o)
Hit (●)
outlier ?
q3 (75%)
Samples collected below the soil layers,up to 51 feet into bedrock.
Conglomerate:
Range = 0.2 to 27 mg/kgAverage = 9.6 mg/kg
2 out of 11 samples >15 mg/kg
RI Formation (Phylite):
Range = 1.3 to 79 mg/kgAverage = 38 mg/kg
14 out of 19 samples >15 mg/kg
Observations: ContributingSources of Arsenic in Bedrock

5 Tetra Tech NUS, Inc.
V. Approximate Arsenic Distributional Shape
Lognormal Q-Q Plot for ARSENIC
-1
0
1
2
3
4
5
-3 -2 -1 0 1 2 3
Theoretical Quantiles
Ord
ere
dO
bs
erv
ati
on
s
Blue -- Subsurface Soil
Lavender - Surface Soil
Shapiro Francia Test:
Sample Statistic = 0.9924
Critical Value = 0.987
Data are lognormal

6 Tetra Tech NUS, Inc.
VI. Hypothesis tests show soil type differences
A statistical significance level (P value) of 0.025 is used for all tests. Overall decision isYES if any one of the Mann-Whitney/Gehan, Upper Ranks Test, or T-Test is YES,regardless of other test results. Overall decision is NO if at least one of Mann-Whitney/Gehan, Upper Ranks Test, or T-Test is NO, and none of the aforementionedtests are YES. Overall decision is YES/NO if Z/Fisher Test is YES/NO, respectively, andother tests are NA.

7 Tetra Tech NUS, Inc.
VII. Arsenic Elemental Correlations: Surface Soil

8 Tetra Tech NUS, Inc.
VIII. Arsenic Elemental Correlations: Subsurface Soil

9 Tetra Tech NUS, Inc.
IX. Scatter Plot: Arsenic (Untransformed) vs Iron
0
12
24
36
48
60
72
0 10000 20000 30000 40000 50000 60000
Iron, mg/kg
Ars
en
ic,m
g/k
g
BASS MASB MASS MMSB MMSS NESBNESS PMSB PMSS SESB SESD SESS

10 Tetra Tech NUS, Inc.
X. Scatter Plot: Arsenic (0.67 Power) vs Iron
0
2
4
6
8
10
12
14
16
18
0 10000 20000 30000 40000 50000 60000Iron, mg/kg
Ars
en
ic0
.67
Po
we
r
BASS MASB MASS MMSB MMSS NESBNESS PMSB PMSS SESB SESD SESS

11 Tetra Tech NUS, Inc.
XI. Linear Regression with Weighted Residuals
•Why weight the residuals in geochemical regression?
–Residuals (Y-observed minus Y-predicted) increase with X
–Wedge-shaped scatter plot
•What is weighted Least-Squares Regression Analysis?
–Modification of ordinary least-squares that accommodatesnonconstant variance: As X increases, so does spread in observedY values
•Mathematics: Instead of minimizing sum of squares of thedeviations of the predicted Y values from the line, minimize thesum of the square of deviations multiplied by a weighting factorfor each point, Wj.
•Goals for prediction limits so that percent coverage is correct:
–Weighted residuals have constant variance with increasing X
–Weighted residuals are normally distributed (probability plot)
–The number of outliers is roughly 5 percent and similar by soil type

12 Tetra Tech NUS, Inc.
XII. Weighted Regression Prediction Formula

13 Tetra Tech NUS, Inc.
XIIIa. (Arsenic)0.67 Regressed on Iron: Surface Soil
0
2
4
6
8
10
12
14
16
18
0 10000 20000 30000 40000 50000
FE
AS
^0.6
7
All Data
BASS
MASS
MMSS
NESS
PMSS
SESS
AS^0.67=(2.34E-4)xFE+-0.63 R^2=0.81 Std.Error Y-est.=1.06
Weighted 1/SQRT(MAX(x-Xmin,4273.5)*MAX(y-Ymin,1.0))
14 Tetra Tech NUS, Inc.
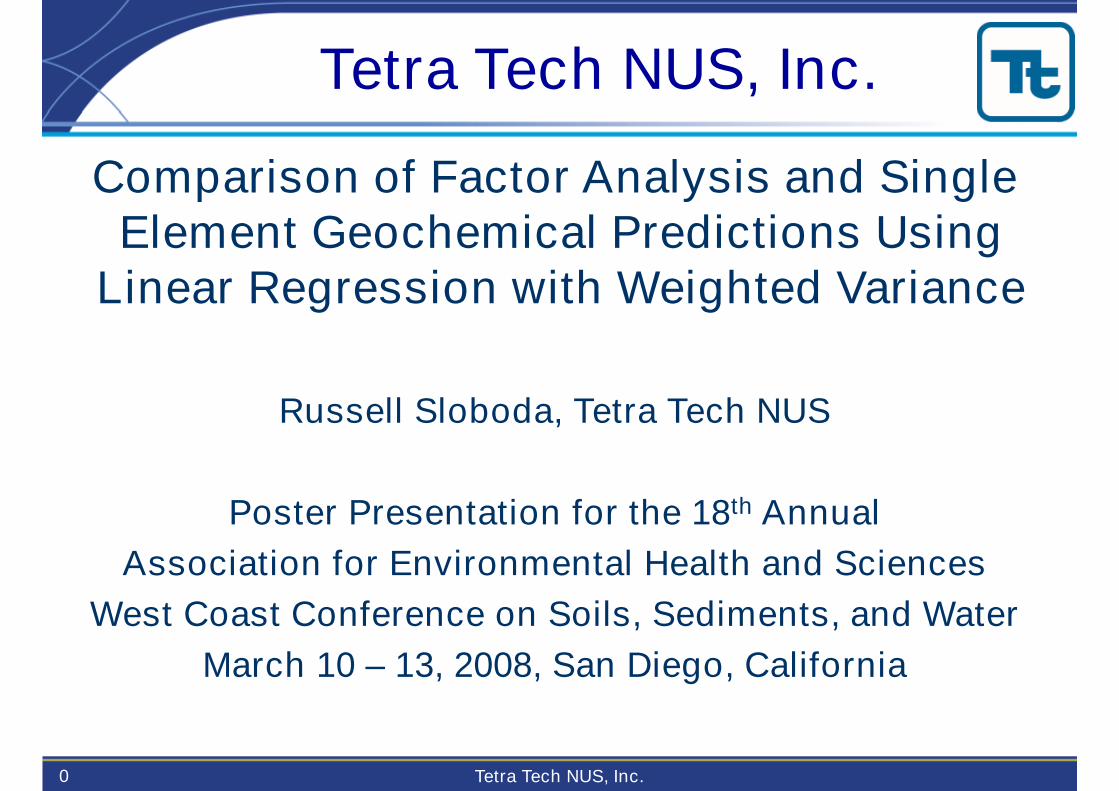
XIIIb. (Arsenic)0.67 Regressed on Iron: Subsurf. Soil
0
2
4
6
8
10
12
14
16
18
0 10000 20000 30000 40000 50000
FE
AS
^0
.67
All Data
MASB
MMSB
NESB
PMSB
SESB
AS^0.67=(2.34E-4)xFE+-0.63 R^2=0.81 Std.Error Y-est.=1.06
Weighted 1/SQRT(MAX(x-Xmin,4273.5)*MAX(y-Ymin,1.0))

15 Tetra Tech NUS, Inc.
XIVa. (Arsenic)0.67 Regressed on As Predicted by FA
0
2
4
6
8
10
12
14
16
18
-5 0 5 10 15 20 25 30 35 40 45
AS predict (from Factor Anal.)
AS
^0.6
7
All Data
BASS
MASS
MMSS
NESS
PMSS
SESS
AS^0.67=0.30xAS predict (from Factor Anal.)+1.25 R^2=0.84 Std.Error Y-est.=0.96
Weighted 1/SQRT(MAX(x-Xmin,0.7)*MAX(y-Ymin,0.2))

16 Tetra Tech NUS, Inc.
XIVb. (Arsenic)0.67 Regressed on As Predicted by FA
0
2
4
6
8
10
12
14
16
18
-5 0 5 10 15 20 25 30 35 40 45
AS predict (from Factor Anal.)
AS
^0
.67
All Data
MASB
MMSB
NESB
PMSB
SESB
AS^0.67=0.30xAS predict (from Factor Anal.)+1.25 R^2=0.84 Std.Error Y-est.=0.96
Weighted 1/SQRT(MAX(x-Xmin,0.7)*MAX(y-Ymin,0.2))

17 Tetra Tech NUS, Inc.
XV. Arsenic Factor Pattern Matrix & Contributions

18 Tetra Tech NUS, Inc.
XVI. Factor Matrix Manipulations to Predict Metals

19 Tetra Tech NUS, Inc.
XVII. Prediction Accuracy: Factor Analysis vs. 1 Metal
• Regressions apply to majority of base – 70% of base consists of UD,unknown combination of soils disturbed by cutting or filling
• Two useful regressions for arsenic – one based on iron, the other based onfactor analysis (linear combination of all metals)
• Site-related samples can be plotted to see if arsenic <95% prediction limits
• Uncertainty and accuracy of regressions are listed (next slide):–Low regression residual errors were attained after back-transforming data into
original units (arsenic mg/kg)
–Even coverage across regression domain
–Good regression statistics: standard error of the Y-estimate and r2
• Geochemical regressions were developed for a total of 12 metals:–Single-metal predictions were compared to factor analysis for 11 metals
–4 Different Factor Analyses used different SS/SB data sets, transformations,and numbers of factors
–All factor analyses used Varimax rotation (other rotations had inferior results)

20 Tetra Tech NUS, Inc.
XIXa. All Metals: Regression Accuracy & Coverage

21 Tetra Tech NUS, Inc.
XIXb. All Metals: Regression Accuracy & Coverage

22 Tetra Tech NUS, Inc.
XIXc. All Metals: Regression Accuracy & Coverage