Embed Size (px)
Citation preview
Cycling Equity
(including new analysis of data from the Active
People Survey with Anna Goodman)
Rachel Aldred
Reader in Transport
University of Westminster
rachelaldred.org @RachelAldred
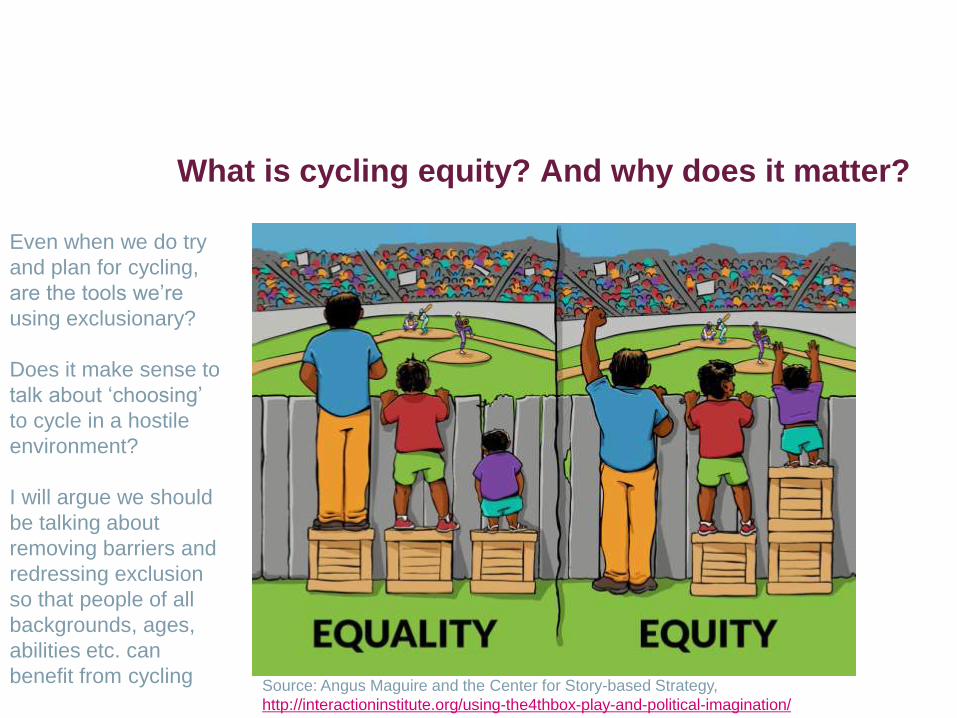
What is cycling equity? And why does it matter?
Source: Angus Maguire and the Center for Story-based Strategy,
http://interactioninstitute.org/using-the4thbox-play-and-political-imagination/
Even when we do try
and plan for cycling,
are the tools we’re
using exclusionary?
Does it make sense to
talk about ‘choosing’
to cycle in a hostile
environment?
I will argue we should
be talking about
removing barriers and
redressing exclusion
so that people of all
backgrounds, ages,
abilities etc. can
benefit from cycling
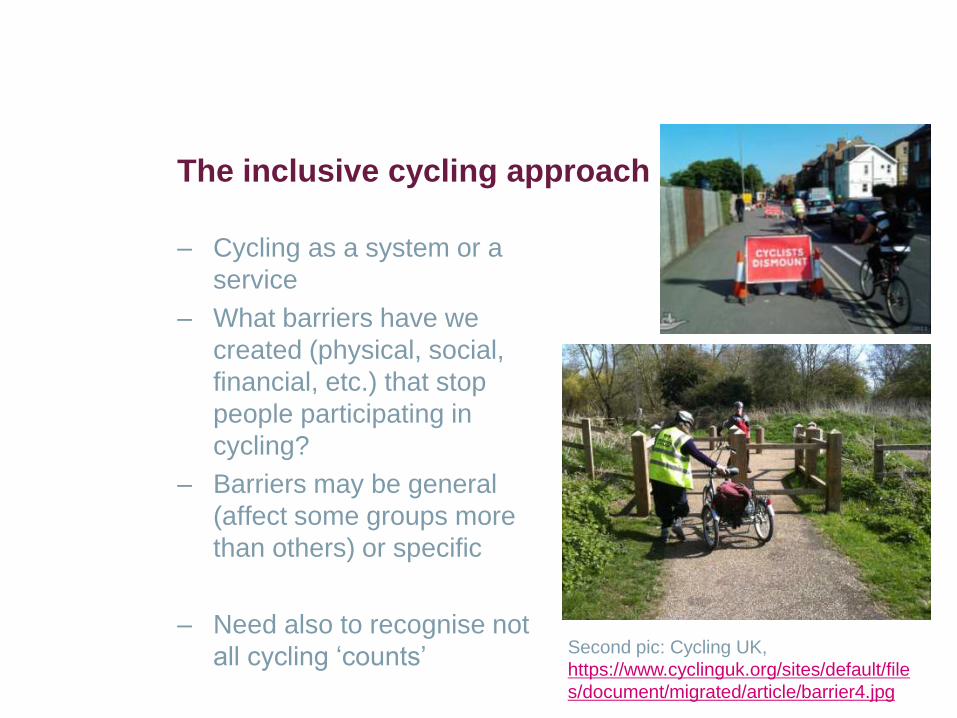
The inclusive cycling approach
– Cycling as a system or a
service
– What barriers have we
created (physical, social,
financial, etc.) that stop
people participating in
cycling?
– Barriers may be general
(affect some groups more
than others) or specific
– Need also to recognise not
all cycling ‘counts’ Second pic: Cycling UK,
https://www.cyclinguk.org/sites/default/file
s/document/migrated/article/barrier4.jpg
Inequalities in cycling participation in England
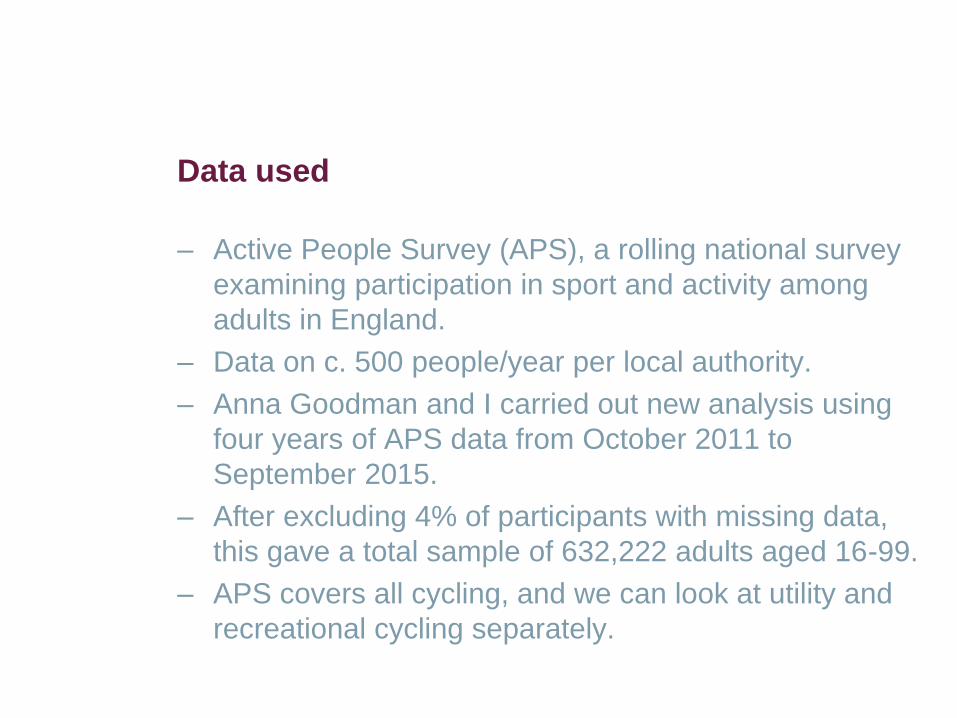
Data used
– Active People Survey (APS), a rolling national survey
examining participation in sport and activity among
adults in England.
– Data on c. 500 people/year per local authority.
– Anna Goodman and I carried out new analysis using
four years of APS data from October 2011 to
September 2015.
– After excluding 4% of participants with missing data,
this gave a total sample of 632,222 adults aged 16-99.
– APS covers all cycling, and we can look at utility and
recreational cycling separately.
Unadjusted results, all cycling in past 4 weeks
– NB this 1st set of graphs refers to all cycling (utility
and recreational – and there may be differences)
– Unadjusted = not controlling for other factors – so
differences between groups may be due to other
underlying factors (e.g. lower participation at older
ages may be connected to disability)
– These inequalities are all culturally specific – for all
of them, there are places where they don’t apply
or the gaps shown are reversed
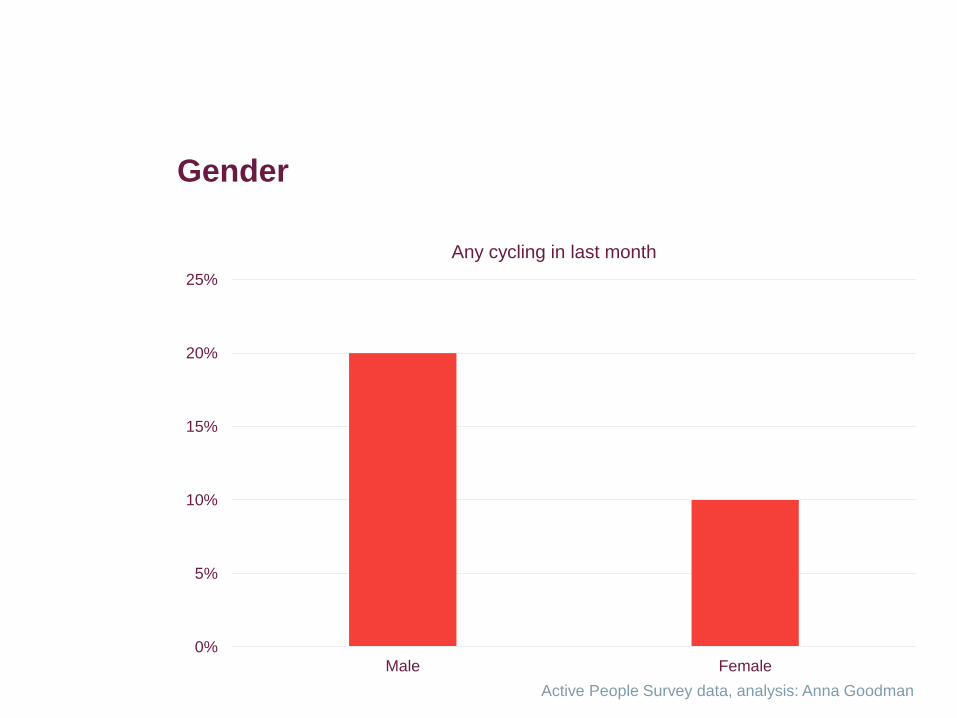
Gender
0%
5%
10%
15%
20%
25%
Male Female
Any cycling in last month
Active People Survey data, analysis: Anna Goodman
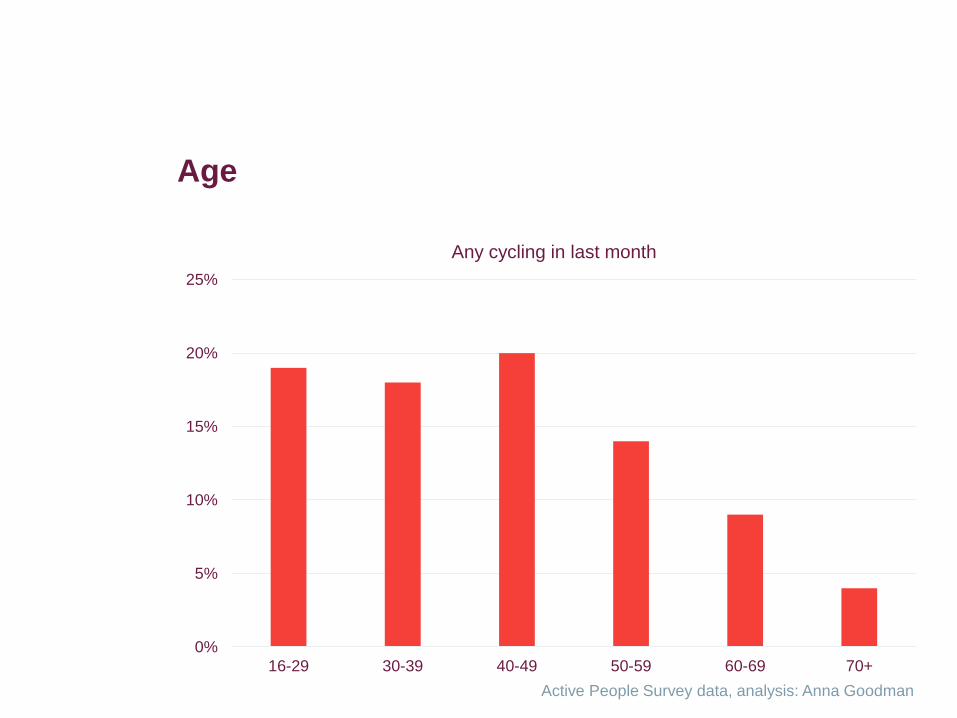
Age
0%
5%
10%
15%
20%
25%
16-29 30-39 40-49 50-59 60-69 70+
Any cycling in last month
Active People Survey data, analysis: Anna Goodman
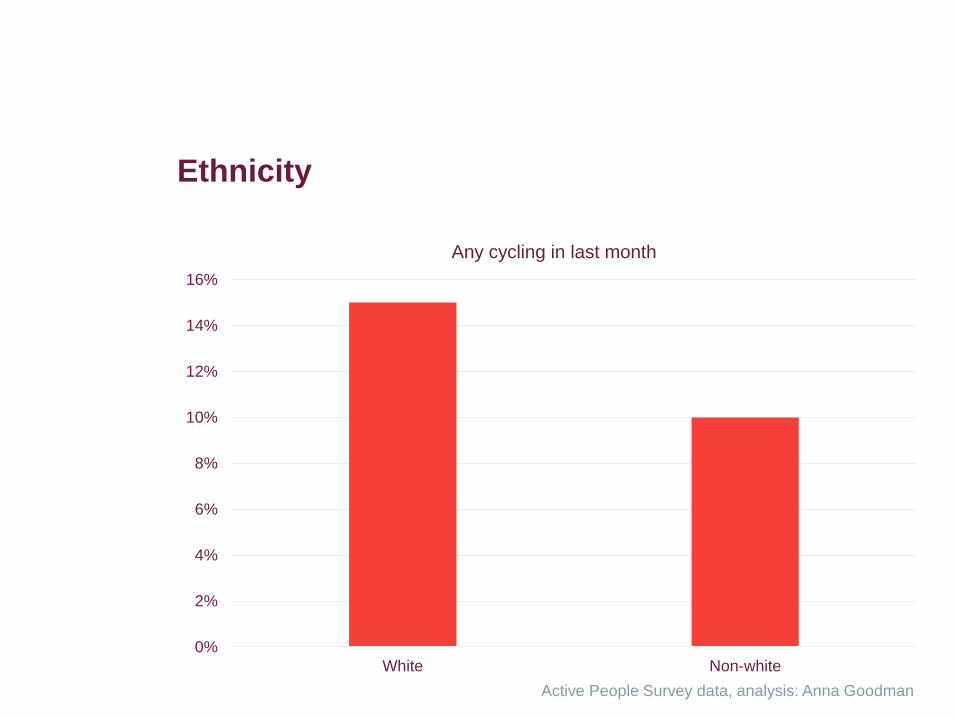
Ethnicity
0%
2%
4%
6%
8%
10%
12%
14%
16%
White Non-white
Any cycling in last month
Active People Survey data, analysis: Anna Goodman
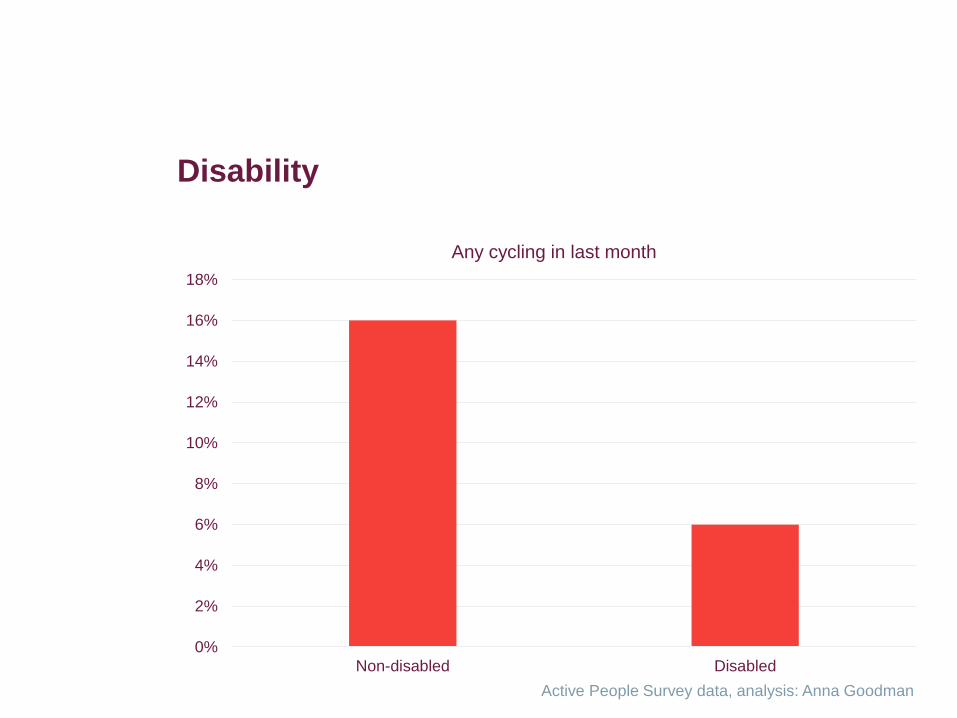
Disability
0%
2%
4%
6%
8%
10%
12%
14%
16%
18%
Non-disabled Disabled
Any cycling in last month
Active People Survey data, analysis: Anna Goodman
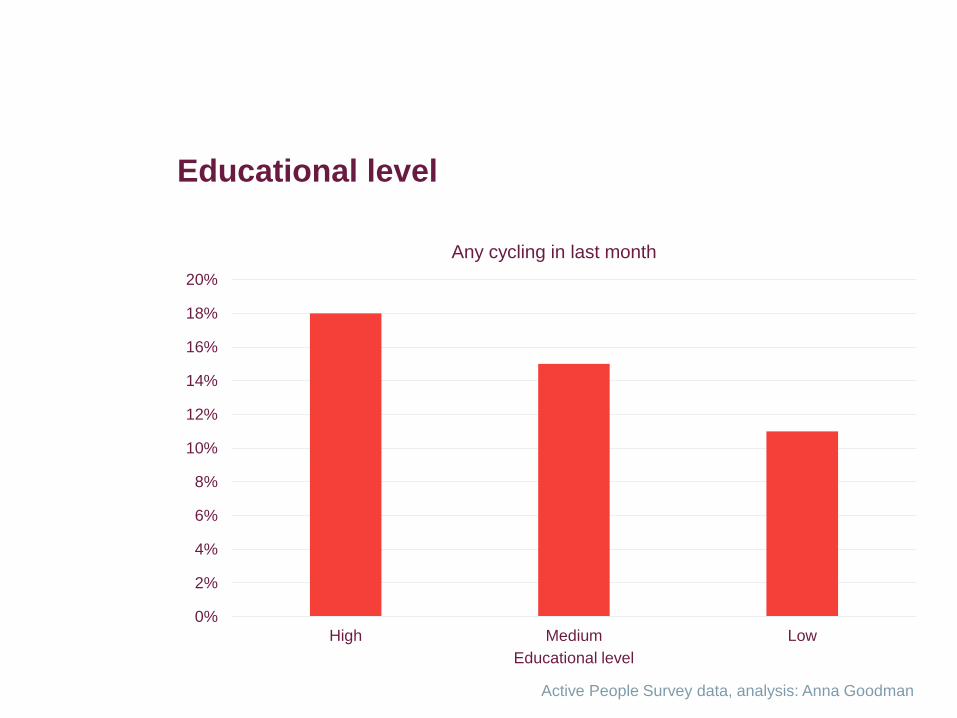
Educational level
0%
2%
4%
6%
8%
10%
12%
14%
16%
18%
20%
High Medium Low
Educational level
Any cycling in last month
Active People Survey data, analysis: Anna Goodman
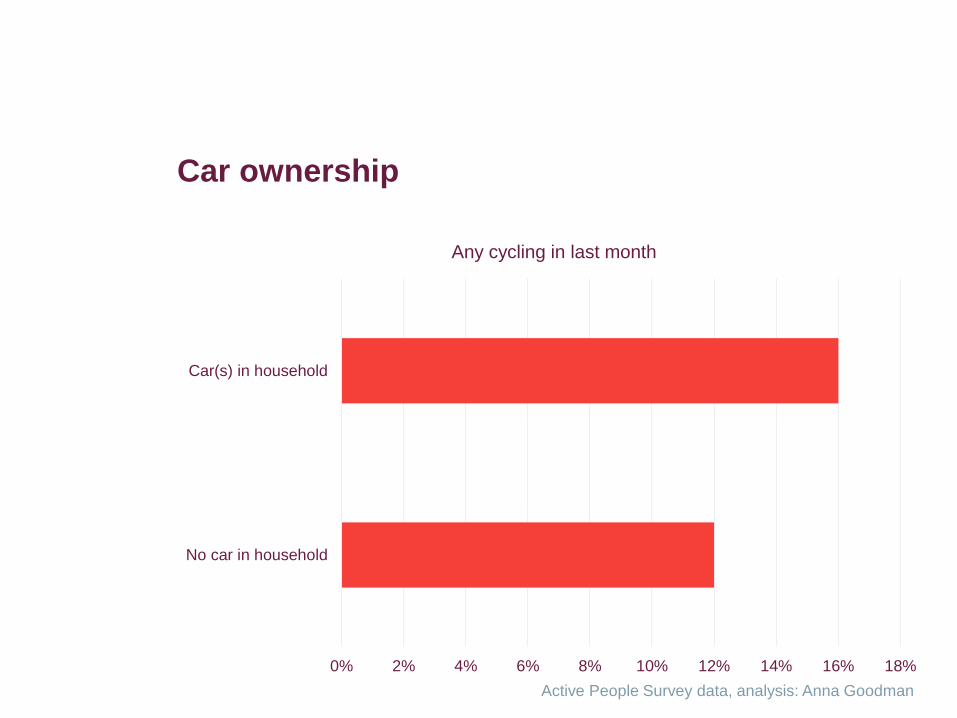
Car ownership
0% 2% 4% 6% 8% 10% 12% 14% 16% 18%
No car in household
Car(s) in household
Any cycling in last month
Active People Survey data, analysis: Anna Goodman
Adjusted analysis, utility and leisure cycling
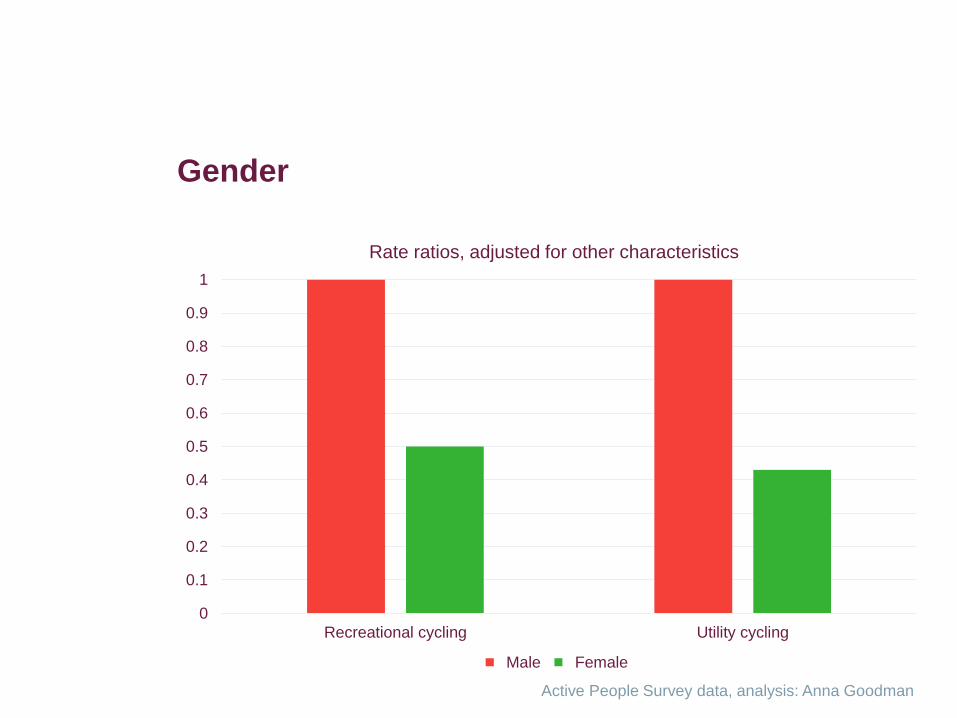
Gender
0
0.1
0.2
0.3
0.4
0.5
0.6
0.7
0.8
0.9
1
Recreational cycling Utility cycling
Rate ratios, adjusted for other characteristics
Male Female
Active People Survey data, analysis: Anna Goodman
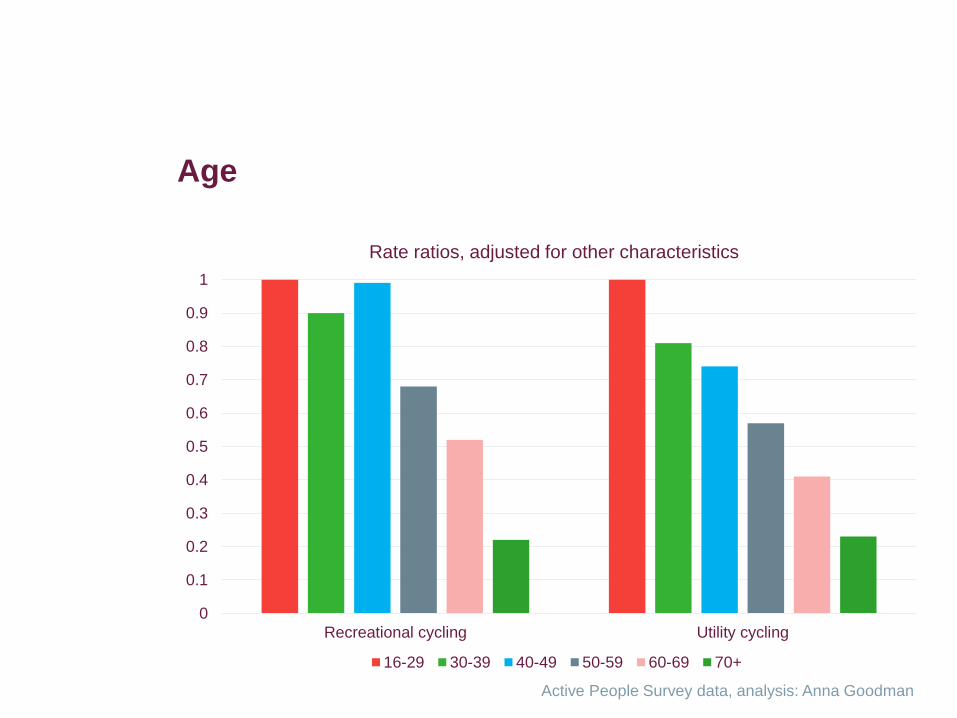
Age
0
0.1
0.2
0.3
0.4
0.5
0.6
0.7
0.8
0.9
1
Recreational cycling Utility cycling
Rate ratios, adjusted for other characteristics
16-29 30-39 40-49 50-59 60-69 70+
Active People Survey data, analysis: Anna Goodman
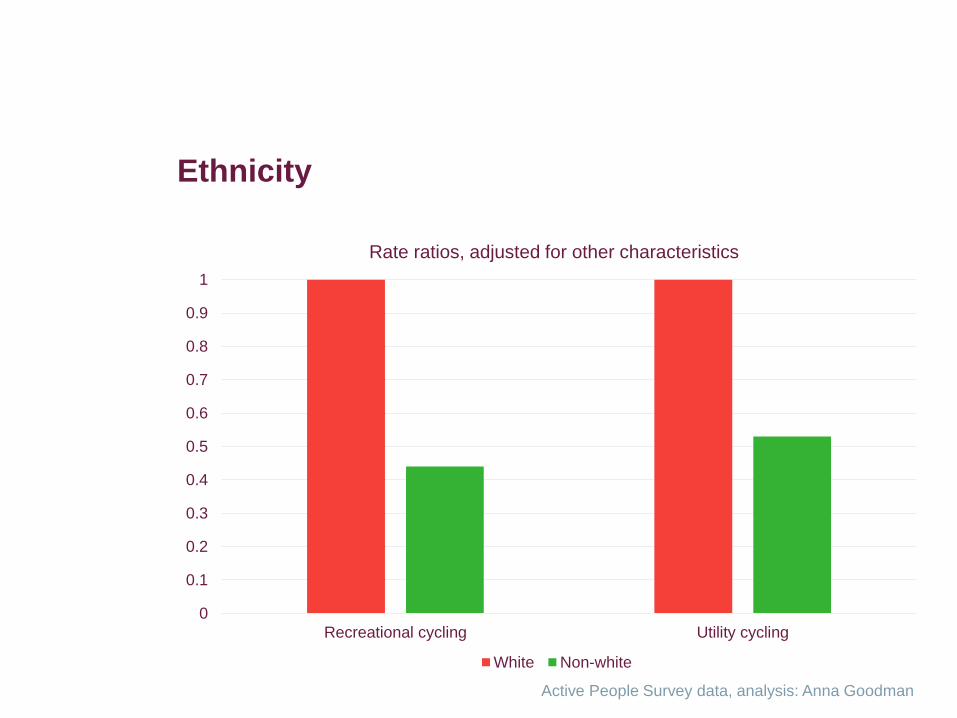
Ethnicity
0
0.1
0.2
0.3
0.4
0.5
0.6
0.7
0.8
0.9
1
Recreational cycling Utility cycling
Rate ratios, adjusted for other characteristics
White Non-white
Active People Survey data, analysis: Anna Goodman
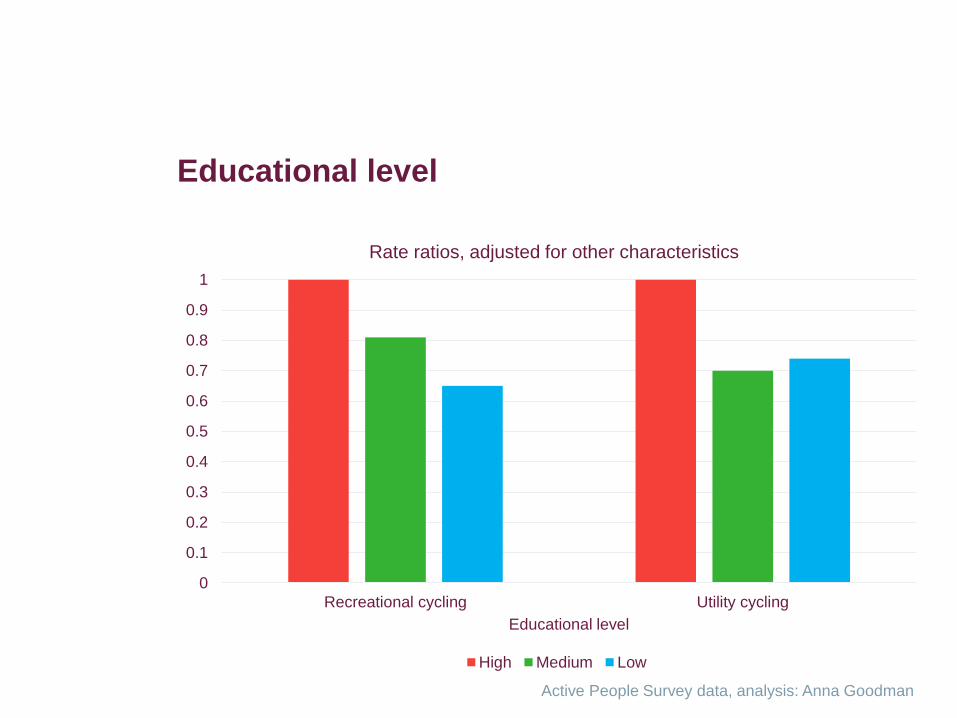
Educational level
0
0.1
0.2
0.3
0.4
0.5
0.6
0.7
0.8
0.9
1
Recreational cycling Utility cycling
Educational level
Rate ratios, adjusted for other characteristics
High Medium Low
Active People Survey data, analysis: Anna Goodman
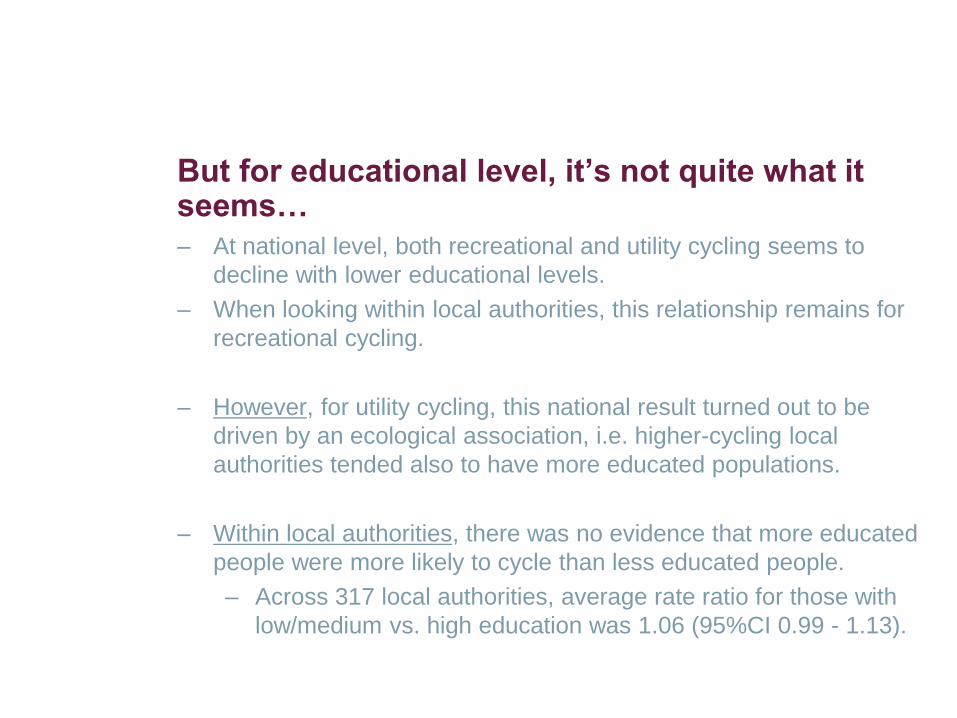
But for educational level, it’s not quite what it seems…
– At national level, both recreational and utility cycling seems to
decline with lower educational levels.
– When looking within local authorities, this relationship remains for
recreational cycling.
– However, for utility cycling, this national result turned out to be
driven by an ecological association, i.e. higher-cycling local
authorities tended also to have more educated populations.
– Within local authorities, there was no evidence that more educated
people were more likely to cycle than less educated people.
– Across 317 local authorities, average rate ratio for those with
low/medium vs. high education was 1.06 (95%CI 0.99 - 1.13).
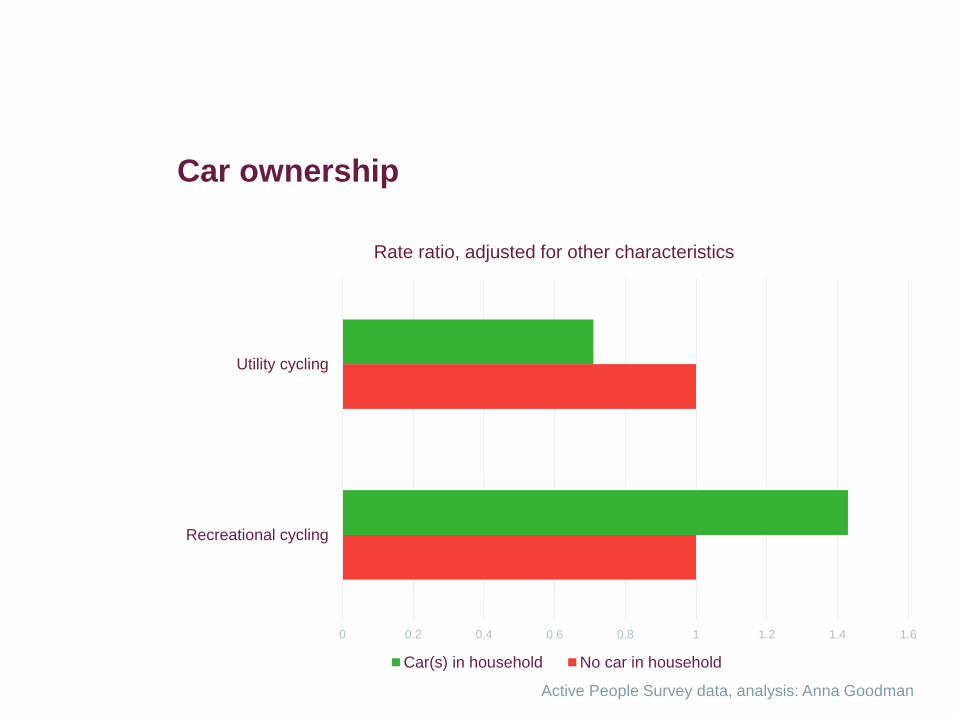
Car ownership
0 0.2 0.4 0.6 0.8 1 1.2 1.4 1.6
Recreational cycling
Utility cycling
Rate ratio, adjusted for other characteristics
Car(s) in household No car in household
Active People Survey data, analysis: Anna Goodman
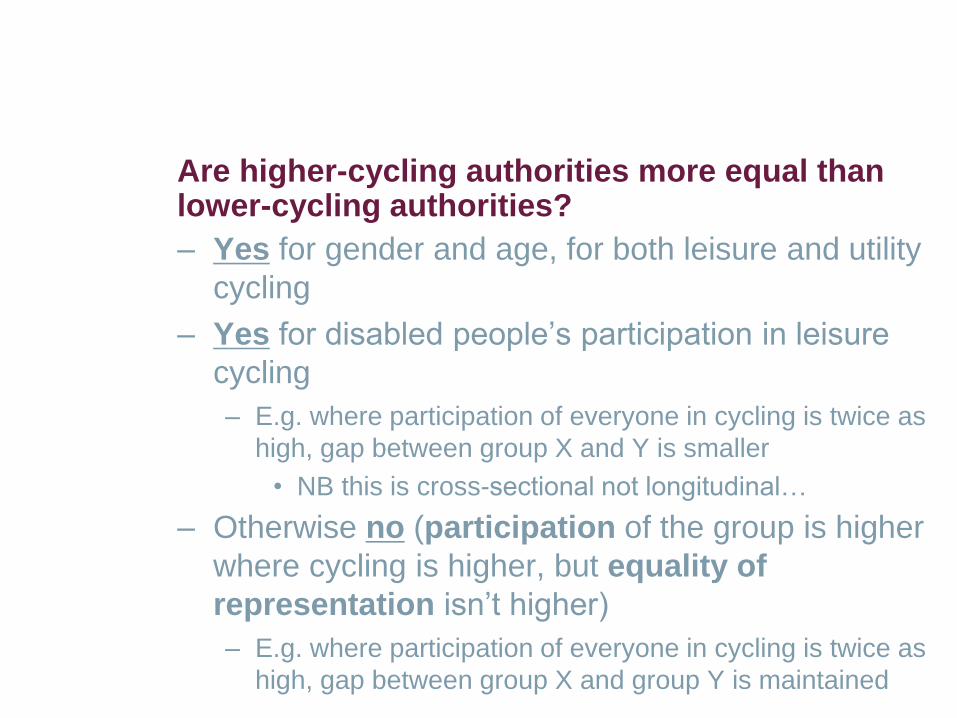
Are higher-cycling authorities more equal than lower-cycling authorities?
– Yes for gender and age, for both leisure and utility
cycling
– Yes for disabled people’s participation in leisure
cycling
– E.g. where participation of everyone in cycling is twice as
high, gap between group X and Y is smaller
• NB this is cross-sectional not longitudinal…
– Otherwise no (participation of the group is higher
where cycling is higher, but equality of
representation isn’t higher)
– E.g. where participation of everyone in cycling is twice as
high, gap between group X and group Y is maintained
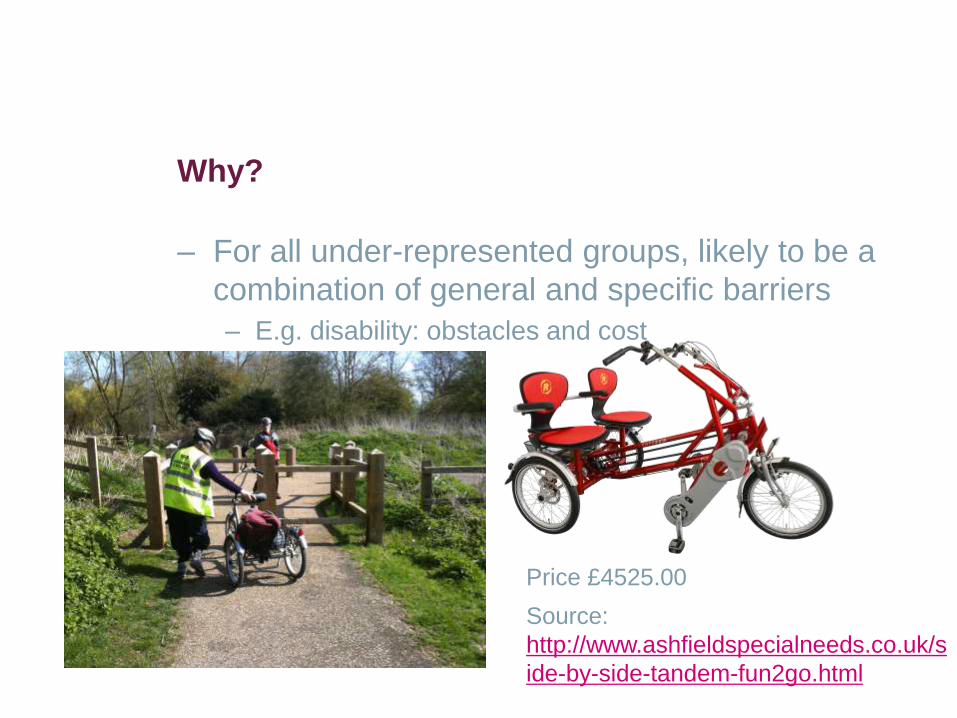
Why?
– For all under-represented groups, likely to be a
combination of general and specific barriers
– E.g. disability: obstacles and cost
Price £4525.00
Source:
http://www.ashfieldspecialneeds.co.uk/s
ide-by-side-tandem-fun2go.html
Newcastle & Gateshead
– 13.9% and 9.2% respectively did any cycling in the
past month
– But how equally is this distributed?
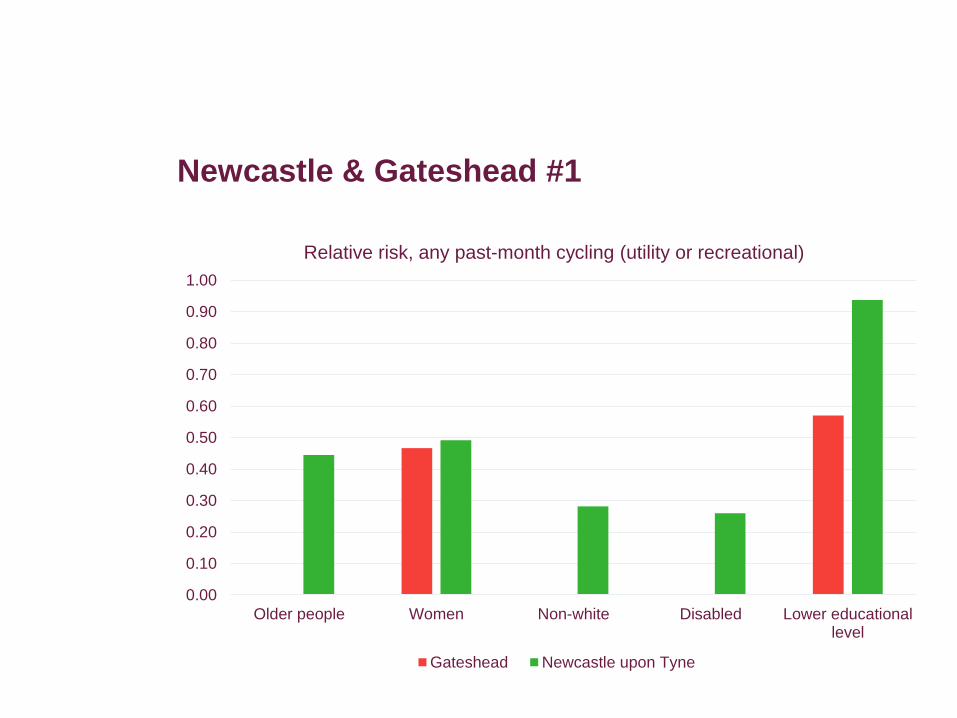
Newcastle & Gateshead #1
0.00
0.10
0.20
0.30
0.40
0.50
0.60
0.70
0.80
0.90
1.00
Older people Women Non-white Disabled Lower educationallevel
Relative risk, any past-month cycling (utility or recreational)
Gateshead Newcastle upon Tyne
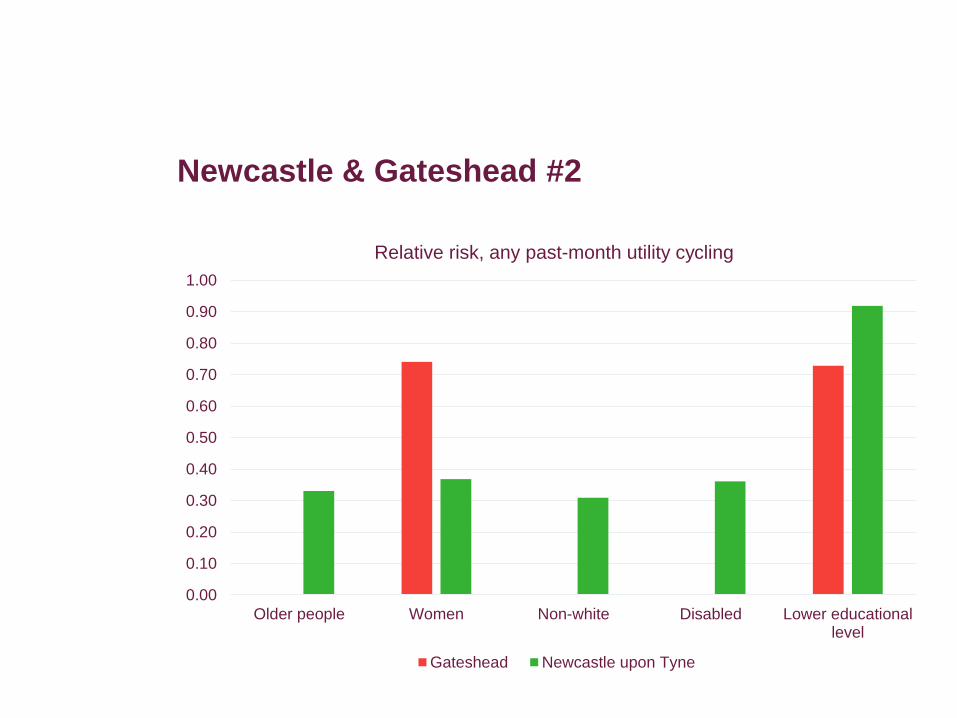
Newcastle & Gateshead #2
0.00
0.10
0.20
0.30
0.40
0.50
0.60
0.70
0.80
0.90
1.00
Older people Women Non-white Disabled Lower educationallevel
Relative risk, any past-month utility cycling
Gateshead Newcastle upon Tyne
Making cycling equal
Explaining inequalities
– Important not to assume these are fixed/natural –
even where they also exist in higher-cycling
English local authorities
– Generally other examples where inequalities do
not exist, or relationships are reversed
(and assumptions can change dramatically – I found papers
from 80s and 90s assuming non-white and lower income
Britons naturally cycled more)
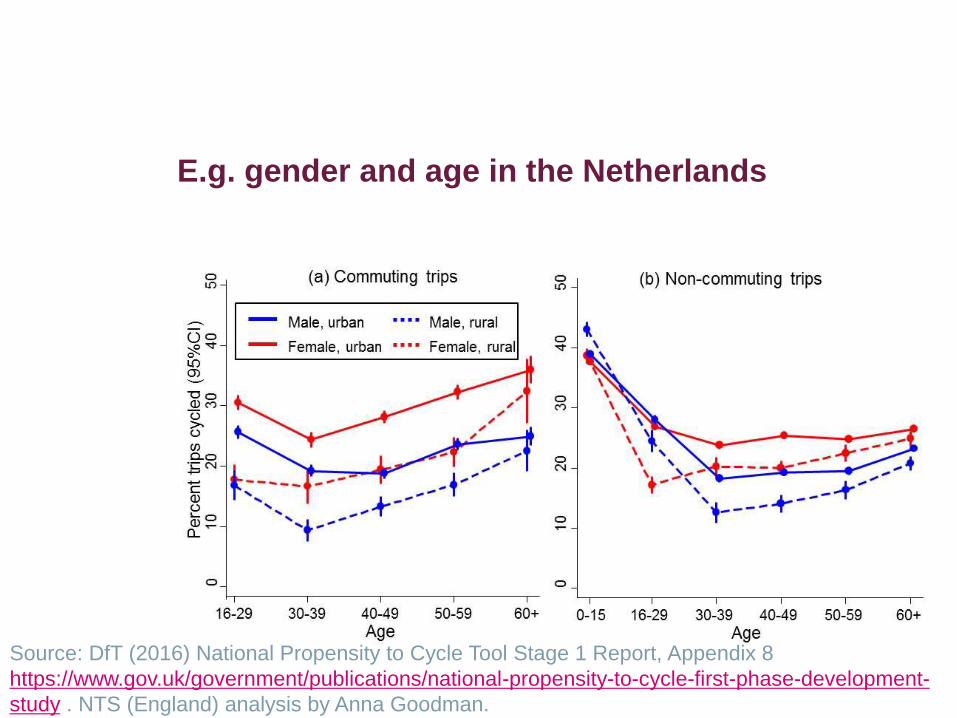
E.g. gender and age in the Netherlands
Source: DfT (2016) National Propensity to Cycle Tool Stage 1 Report, Appendix 8
https://www.gov.uk/government/publications/national-propensity-to-cycle-first-phase-development-
study . NTS (England) analysis by Anna Goodman.
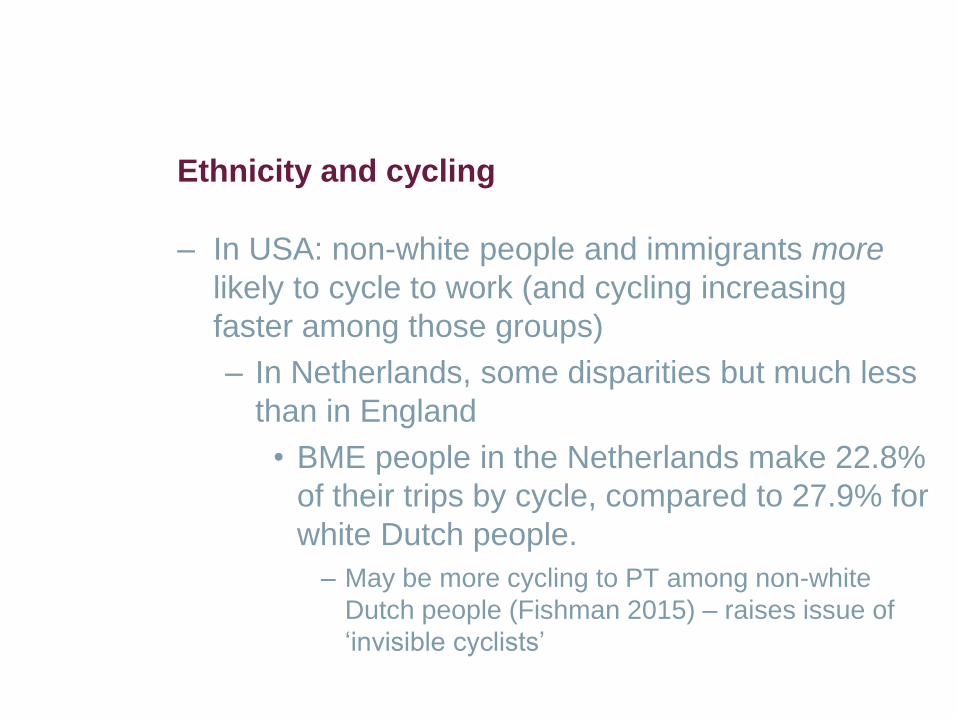
Ethnicity and cycling
– In USA: non-white people and immigrants more
likely to cycle to work (and cycling increasing
faster among those groups)
– In Netherlands, some disparities but much less
than in England
• BME people in the Netherlands make 22.8%
of their trips by cycle, compared to 27.9% for
white Dutch people.
– May be more cycling to PT among non-white
Dutch people (Fishman 2015) – raises issue of
‘invisible cyclists’
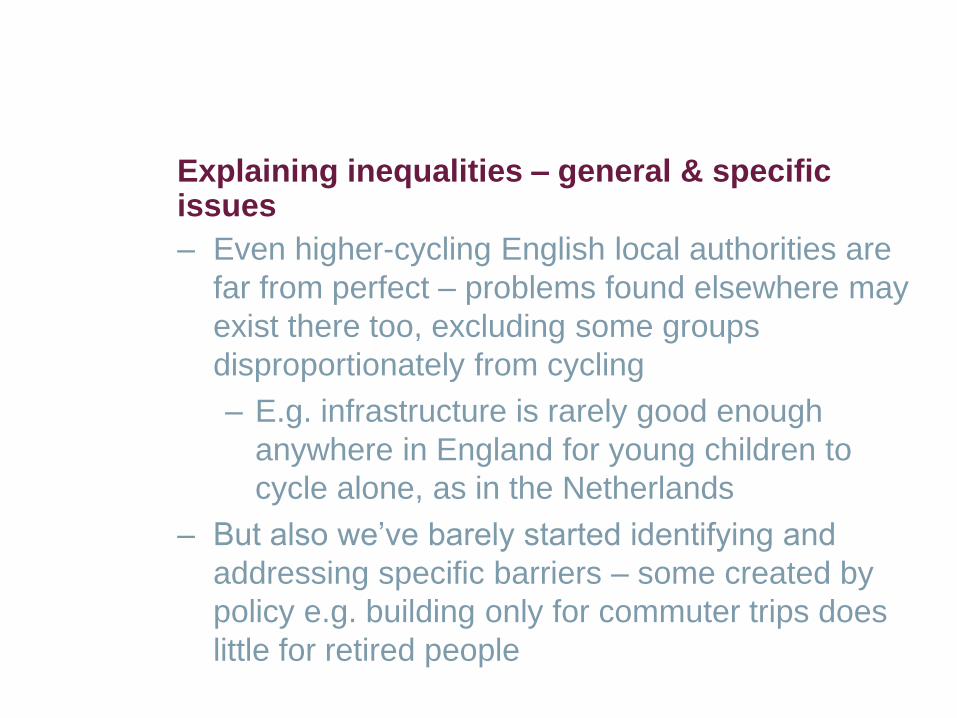
Explaining inequalities – general & specific issues
– Even higher-cycling English local authorities are
far from perfect – problems found elsewhere may
exist there too, excluding some groups
disproportionately from cycling
– E.g. infrastructure is rarely good enough
anywhere in England for young children to
cycle alone, as in the Netherlands
– But also we’ve barely started identifying and
addressing specific barriers – some created by
policy e.g. building only for commuter trips does
little for retired people
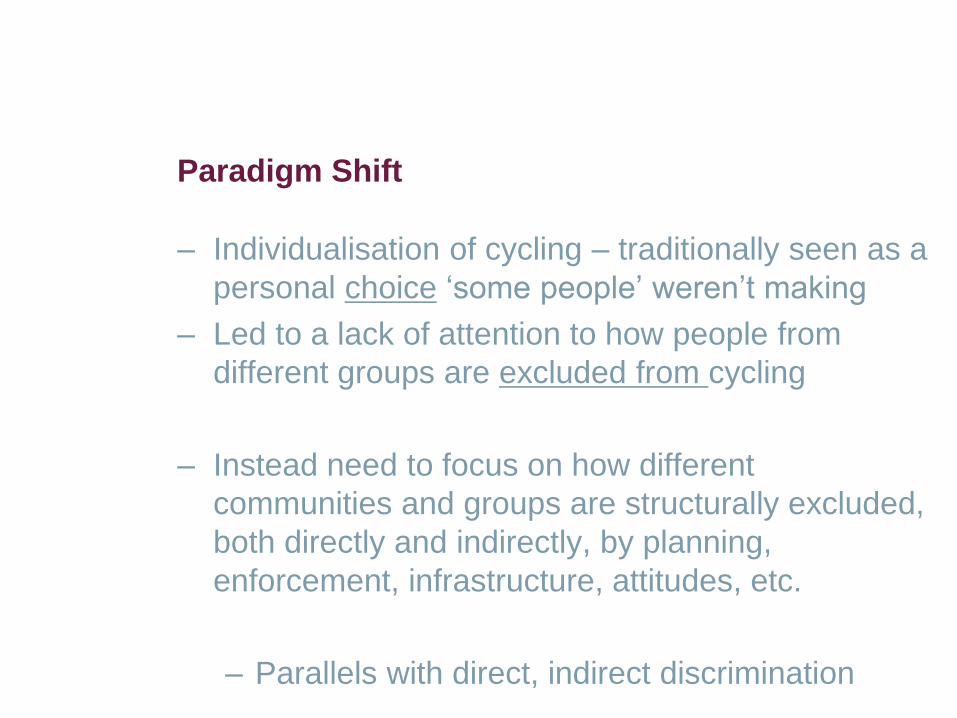
Paradigm Shift
– Individualisation of cycling – traditionally seen as a
personal choice ‘some people’ weren’t making
– Led to a lack of attention to how people from
different groups are excluded from cycling
– Instead need to focus on how different
communities and groups are structurally excluded,
both directly and indirectly, by planning,
enforcement, infrastructure, attitudes, etc.
– Parallels with direct, indirect discrimination
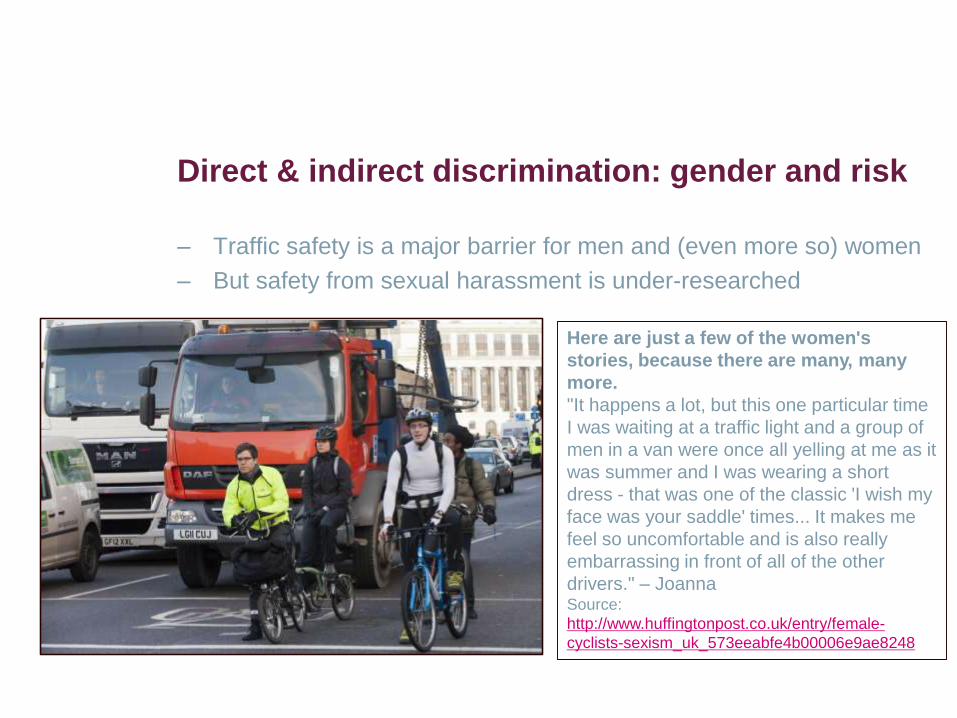
Direct & indirect discrimination: gender and risk
– Traffic safety is a major barrier for men and (even more so) women
– But safety from sexual harassment is under-researched
Here are just a few of the women's
stories, because there are many, many
more.
"It happens a lot, but this one particular time
I was waiting at a traffic light and a group of
men in a van were once all yelling at me as it
was summer and I was wearing a short
dress - that was one of the classic 'I wish my
face was your saddle' times... It makes me
feel so uncomfortable and is also really
embarrassing in front of all of the other
drivers." – JoannaSource:
http://www.huffingtonpost.co.uk/entry/female-
cyclists-sexism_uk_573eeabfe4b00006e9ae8248
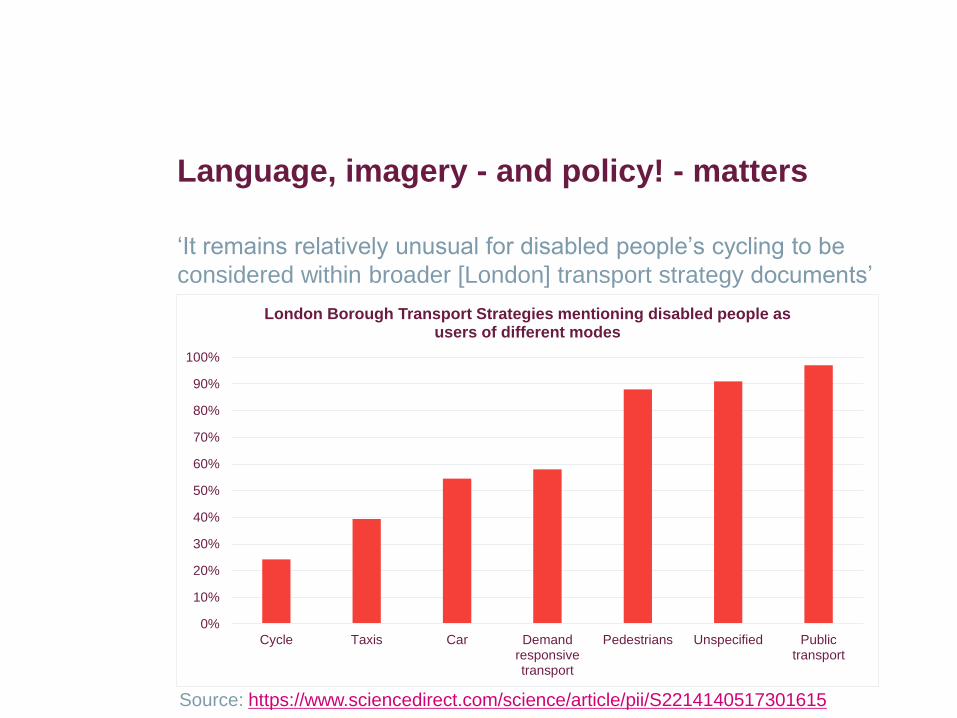
Language, imagery - and policy! - matters
‘It remains relatively unusual for disabled people’s cycling to be
considered within broader [London] transport strategy documents’
0%
10%
20%
30%
40%
50%
60%
70%
80%
90%
100%
Cycle Taxis Car Demandresponsivetransport
Pedestrians Unspecified Publictransport
London Borough Transport Strategies mentioning disabled people as users of different modes
Source: https://www.sciencedirect.com/science/article/pii/S2214140517301615
Language, imagery - and policy! - matters
– ‘It remains relatively unusual for disabled people’s
cycling to be considered within broader [London]
transport strategy documents […]
– By contrast it was more usual for cycling strategies
to at least mention disabled people as cyclists or
potential cyclists. However, discussion of policies
that might increase disabled people’s participation
in cycling was often limited to general aspirations
or references to leisure cycling clubs and training.
Few images showed non-standard cycles of the
kind that might be used by some disabled cyclists.’
Source: https://www.sciencedirect.com/science/article/pii/S2214140517301615
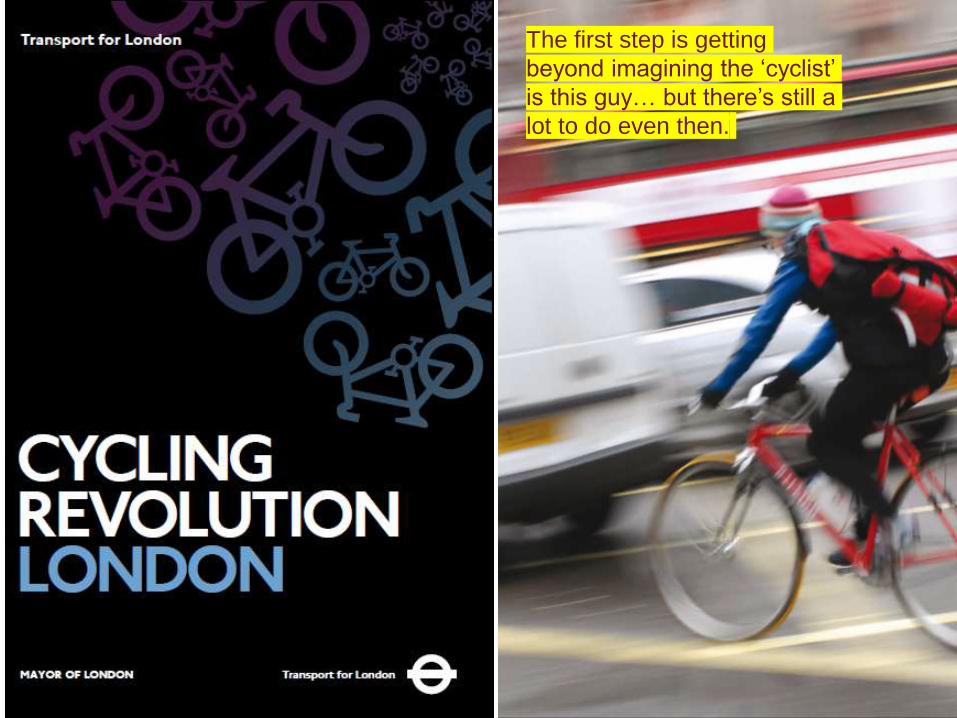
The first step is getting
beyond imagining the ‘cyclist’
is this guy… but there’s still a
lot to do even then.
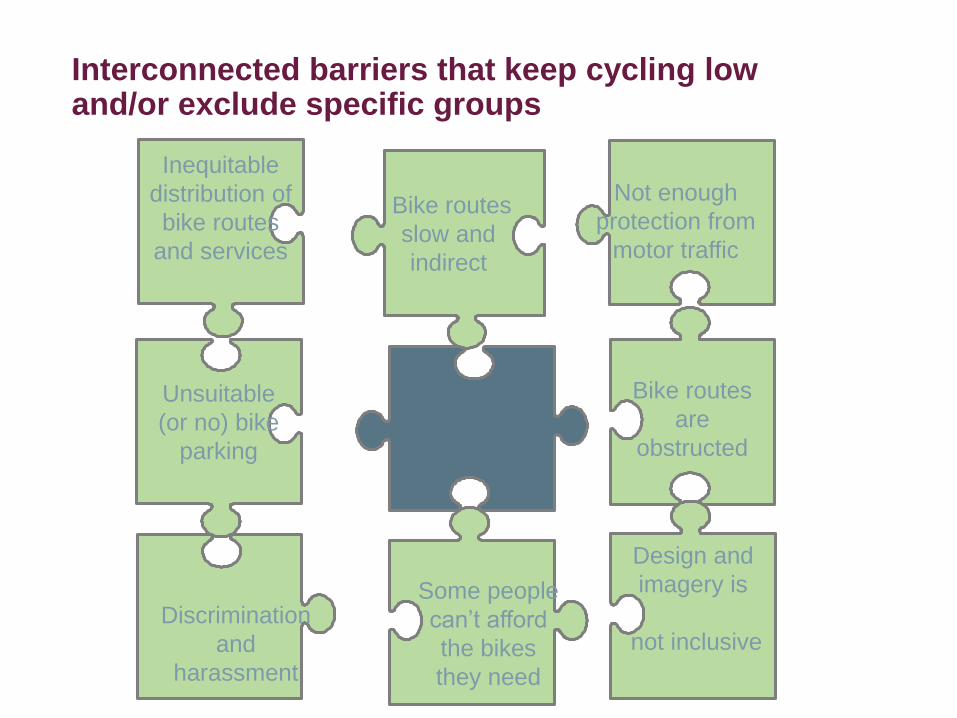
Bike routes
are
obstructed
Not enough
protection from
motor traffic
Design and
imagery is
not inclusive
Unsuitable
(or no) bike
parking
Inequitable
distribution of
bike routes
and services
Discrimination
and
harassment
Some people
can’t afford
the bikes
they need
Bike routes
slow and
indirect
Interconnected barriers that keep cycling low and/or exclude specific groups
Don’t expect overnight changes… but inclusive planning will make a difference.
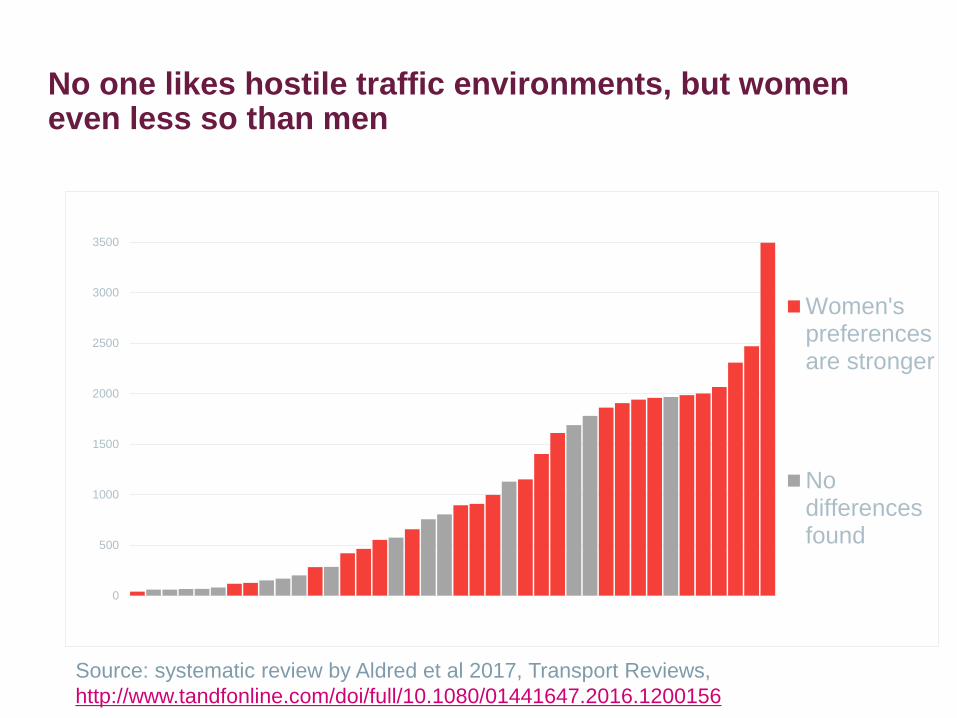
No one likes hostile traffic environments, but women even less so than men
0
500
1000
1500
2000
2500
3000
3500
Women'spreferencesare stronger
Nodifferencesfound
Source: systematic review by Aldred et al 2017, Transport Reviews,
http://www.tandfonline.com/doi/full/10.1080/01441647.2016.1200156
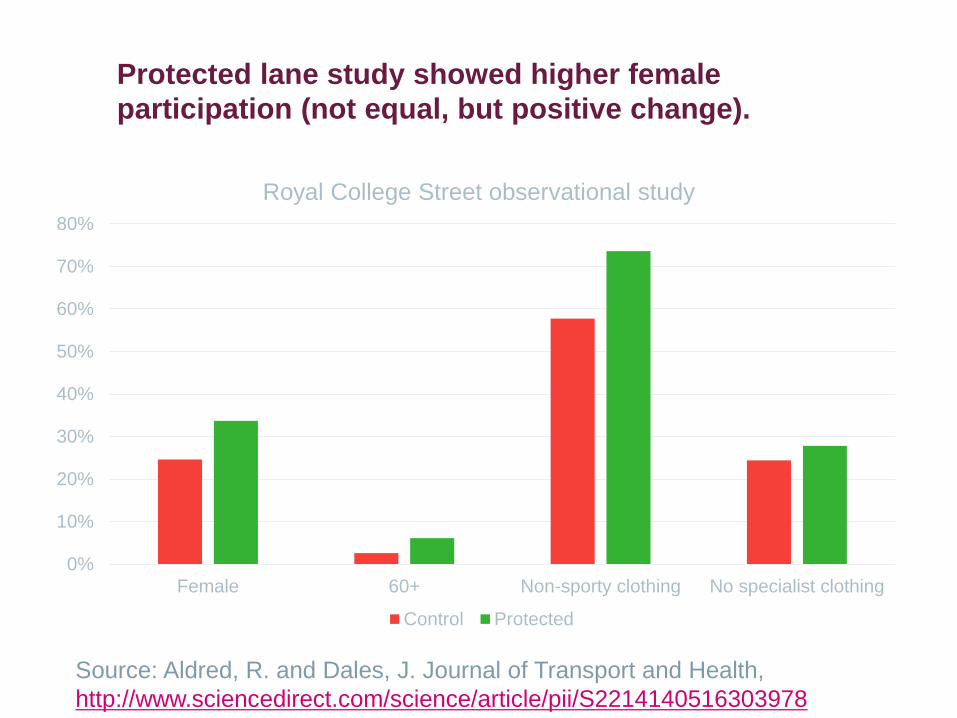
Protected lane study showed higher female
participation (not equal, but positive change).
Source: Aldred, R. and Dales, J. Journal of Transport and Health,
http://www.sciencedirect.com/science/article/pii/S2214140516303978
0%
10%
20%
30%
40%
50%
60%
70%
80%
Female 60+ Non-sporty clothing No specialist clothing
Royal College Street observational study
Control Protected

Cycling Equity
(including new analysis of data from the Active
People Survey with Anna Goodman)
Rachel Aldred
Reader in Transport
University of Westminster
rachelaldred.org @RachelAldred


![[Aldred, Cyril] - Akhenaton, faraón de Egipto](https://img.pdfslide.net/doc/110x75/55cfe6a55503467d968bac25/aldred-cyril-akhenaton-faraon-de-egipto.jpg)