Embed Size (px)
Citation preview

OVERVIEW OF THE USE OF
ENVIRONMENTALLY-RELATED
PRODUCT TAXES IN OECD
COUNTRIESNils Axel Braathen,
Principal Administrator, Environment Directorate

Revenues from environmentally related taxes In per cent of GDP, Selected countries, 2012
2
-2
-1
0
1
2
3
4
5
% o
f GD
P
Other
Motor vehicles
Energy
* 2011 figures ** 2010 figure
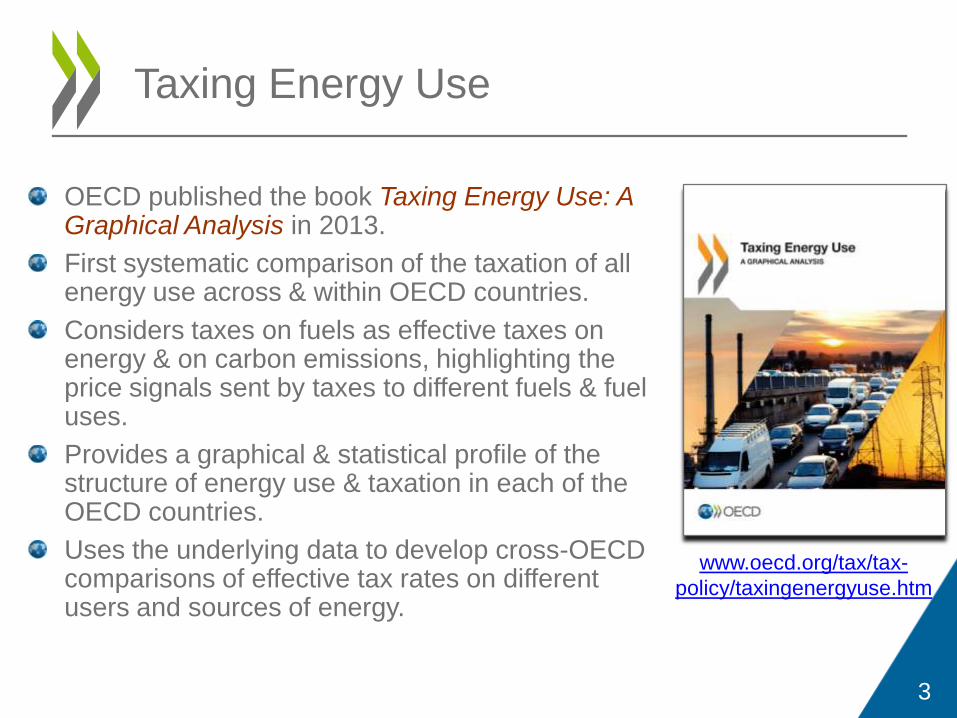
OECD published the book Taxing Energy Use: A Graphical Analysis in 2013.
First systematic comparison of the taxation of all energy use across & within OECD countries.
Considers taxes on fuels as effective taxes on energy & on carbon emissions, highlighting the price signals sent by taxes to different fuels & fuel uses.
Provides a graphical & statistical profile of the structure of energy use & taxation in each of the OECD countries.
Uses the underlying data to develop cross-OECD comparisons of effective tax rates on different users and sources of energy.
3
Taxing Energy Use
www.oecd.org/tax/tax-
policy/taxingenergyuse.htm

4
Taxation of energy in the OECD area:On a carbon content basis
Source: OECD (2013), Taxing Energy Use: A Graphical Analysis.
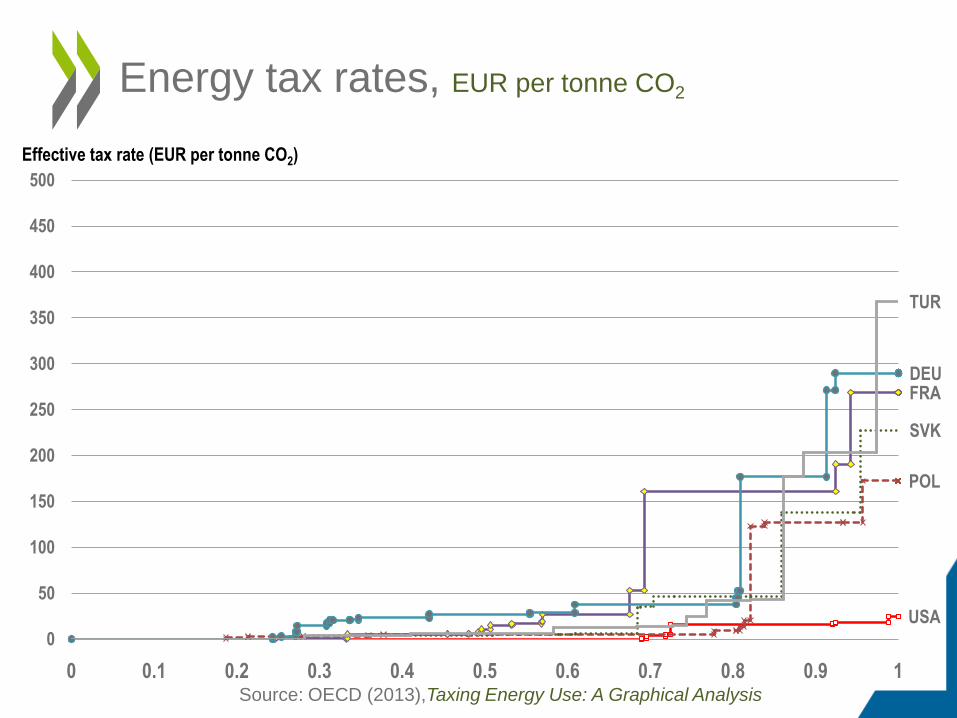
Energy tax rates, EUR per tonne CO2
5
USA
POL
SVK
FRADEU
TUR
0
50
100
150
200
250
300
350
400
450
500
0 0.1 0.2 0.3 0.4 0.5 0.6 0.7 0.8 0.9 1
Effective tax rate (EUR per tonne CO2)
Source: OECD (2013),Taxing Energy Use: A Graphical Analysis
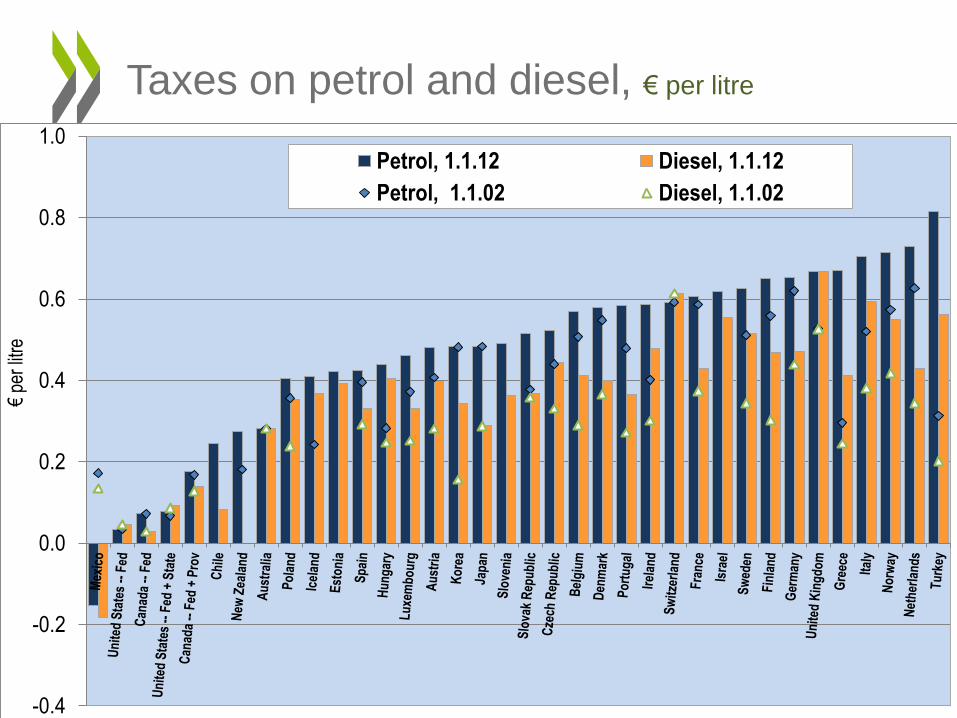
Taxes on petrol and diesel, € per litre
6
-0.4
-0.2
0.0
0.2
0.4
0.6
0.8
1.0
€pe
r lit
re
Petrol, 1.1.12 Diesel, 1.1.12
Petrol, 1.1.02 Diesel, 1.1.02
Taxes on motor vehicles
One-off taxes, linked to the first registration of a motor vehicle;
Recurrent (annual) taxes on the ownership of motor vehicles.
Both types can be differentiated according to various (environmental) criteria:– Expected CO2 emissions;
– Expected emissions of NOx or other pollutants;
– Petrol vs. diesel motor;
– Engine capacity in kW;
– Engine size, in cm³;
– Vehicle weight, etc.
Also fuel taxes and other vehicle-related taxes and charges (e.g. road-use charges) will influence vehicle choices.
7

One-off taxes on motor vehicles
8
0
20
40
60
80
100
120
140
160
EUR
(000
s)
Small Vehicle Medium Vehicle Large Vehicle
Small: 53 kW;
Medium: 132 kW;
Large: 300 kW
All petrol-driven
In addition, Greece has introduced
major motor vehicle taxes.
Tax rates as of 01.01.10

CO2-related motor vehicle taxes
Can be linked directly to expected CO2 emissions, or to the
expected fuel efficiency of the vehicle.
Since a litre of petrol and diesel causes emissions of a fixed
amount of CO2 (2.343 and 2.682 kg respectively), the CO2
emissions are given once the fuel efficiency is known.
Variations between petrol- and diesel-vehicles; depending on
the price of the vehicle; according to vehicle ownership, etc.
Can be part of a bonus–malus system, with subsidies for low-
emission vehicles.
At least 19 OECD countries (+ South Africa) apply some form
of CO2-related differentiation of their motor vehicle taxes.
17 countries apply CO2-related one-off taxes.
9 countries apply CO2-related recurrent taxes. 9
10
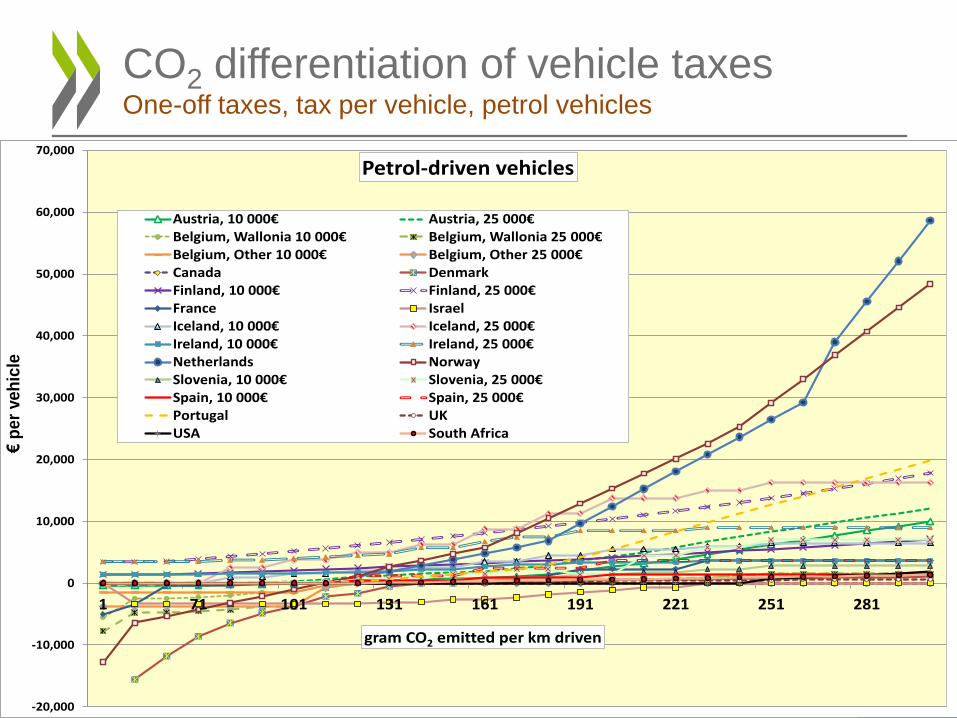
CO2 differentiation of vehicle taxesOne-off taxes, tax per vehicle, petrol vehicles
-20,000
-10,000
0
10,000
20,000
30,000
40,000
50,000
60,000
70,000
1 71 101 131 161 191 221 251 281
€p
er
veh
icle
gram CO2 emitted per km driven
Petrol-driven vehicles
Austria, 10 000€ Austria, 25 000€Belgium, Wallonia 10 000€ Belgium, Wallonia 25 000€Belgium, Other 10 000€ Belgium, Other 25 000€Canada DenmarkFinland, 10 000€ Finland, 25 000€France IsraelIceland, 10 000€ Iceland, 25 000€Ireland, 10 000€ Ireland, 25 000€Netherlands NorwaySlovenia, 10 000€ Slovenia, 25 000€Spain, 10 000€ Spain, 25 000€Portugal UKUSA South Africa
11
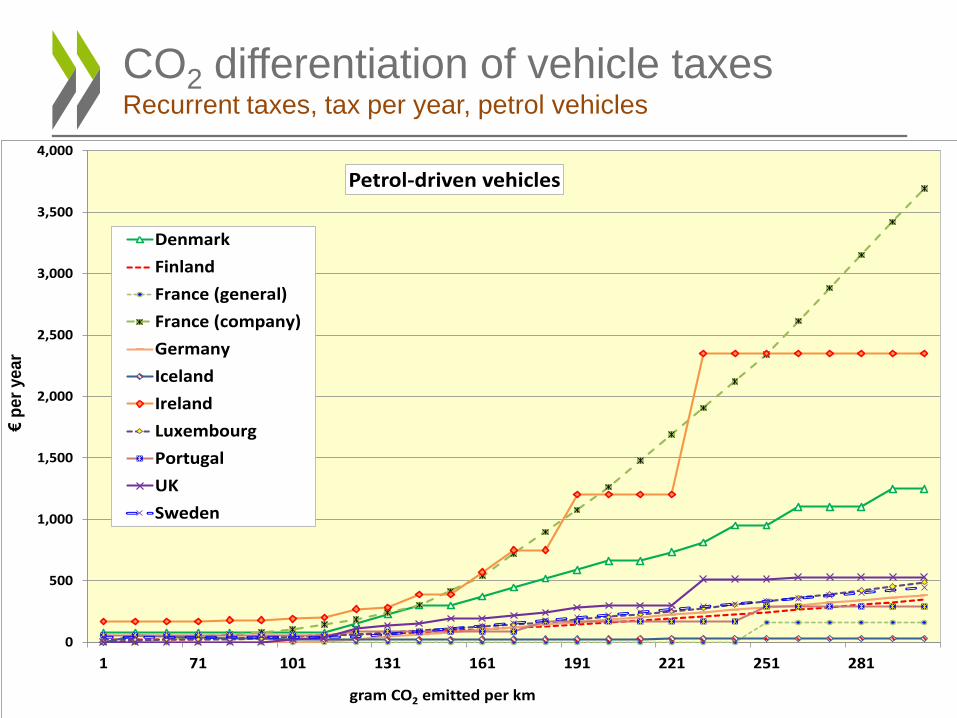
CO2 differentiation of vehicle taxesRecurrent taxes, tax per year, petrol vehicles
0
500
1,000
1,500
2,000
2,500
3,000
3,500
4,000
1 71 101 131 161 191 221 251 281
€p
er
ye
ar
gram CO2 emitted per km
Petrol-driven vehicles
Denmark
Finland
France (general)
France (company)
Germany
Iceland
Ireland
Luxembourg
Portugal
UK
Sweden

Taxes per tonne CO2 emitted over the
vehicles’ lifetime
Once tax rates per vehicle or per year are known, if one
makes a few assumptions, one can calculate the tax rates
per tonne of CO2 that the vehicle will emit over its lifetime.
Assumes that
– Each vehicle is driven 200 000km over its lifespan;
– For recurrent taxes, the lifespan of each vehicle is 15 years;
– Need also to decide on which discount rate to use (if any).
12

13
CO2 differentiation of vehicle taxesTotal taxes per tonne lifetime CO2 emissions, diesel vehicles
-600
-400
-200
0
200
400
600
800
1,000
€pe
r to
nne
CO2
emit
ted
over
the
veh
icle
life
tim
e 100 gram CO2 per km
-600
-400
-200
0
200
400
600
800
1,000
€pe
r to
nne
CO2
emit
ted
over
the
veh
icle
life
tim
e 150 gram CO2 per km
-600
-400
-200
0
200
400
600
800
1,000
€pe
r to
nne
CO2
emit
ted
over
the
veh
icle
life
tim
e 200 gram CO2 per km
-600
-400
-200
0
200
400
600
800
1,000
€pe
r to
nne
CO2
emit
ted
over
the
veh
icle
life
tim
e 250 gram CO2 per km
One-off Recurrent

CO2-related vehicle taxes – Some comments I
Some countries apply tax rates per tonne of CO2emitted that
are very high, especially for high-emission vehicles.
Keep in mind that each tonne emitted will do the same
damage, regardless of whether it is emitted from a vehicle
that causes large or small CO2 emissions per km driven.
The emission reduction incentives that are provided in the
vehicle sector are in some case out of proportion to the
incentives given to other sectors of the economy.
The taxes have contributed to a major reduction in vehicles’
average CO2 emissions – but the shift in demand contributes
to reduce the amount of revenues raised.
14
Some countries apply higher tax rates per tonne CO2 emitted from
diesel-driven than from petrol-driven vehicles, but each tonne of
CO2 emitted causes the same harm.
This is done to counteract a shift in demand towards diesel-driven
vehicles that a focus only on CO2 emissions contributes to – with
very negative impacts for local air pollution and human health.
It is better to address this problem by including emissions of other
air pollutants in the tax base – for example, like it is done in Israel.
There emissions in gramme per km of CO, HC, NOx, PM10 and CO2
are given weights of 500, 900, 10 000, 20 000 and 30, respectively.
The weights are used to calculate reductions offered in otherwise
very high motor vehicle taxes, according to their “Green Grade”.
15
CO2-related vehicle taxes – Some comments II

16
Taxes on lubricating oils
0.0
0.1
0.2
0.3
0.4
0.5
0.6
Australia Norway UnitedStates --Alabama
UnitedStates --Florida
Finland France Poland SlovakRepublic
Slovenia
EUR
per
litr
e or
per
kg
Per litre Per kg

17
0
5
10
15
20
25
30
35
Denmark UnitedStates --
SouthCarolina
Iceland Poland Portugal SlovakRepublic
Sweden Switzerland
EUR
per
cel
l/ba
tter
y or
per
kg
Per cell / battery Per kg
Taxes on nickel-cadmium batteries

18
Taxes on vehicle batteries
0.0
0.5
1.0
1.5
2.0
2.5
3.0
3.5
4.0
EUR
per
bat
tery
or
per
kg
Per battery Per kg
19
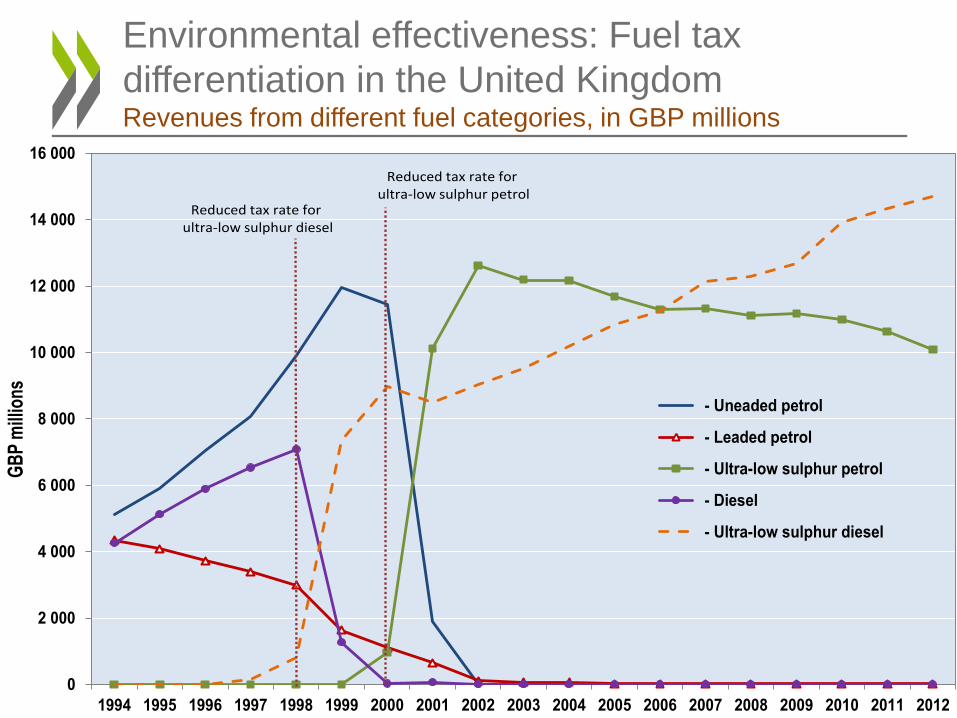
Environmental effectiveness: Fuel tax
differentiation in the United KingdomRevenues from different fuel categories, in GBP millions
0
2 000
4 000
6 000
8 000
10 000
12 000
14 000
16 000
1994 1995 1996 1997 1998 1999 2000 2001 2002 2003 2004 2005 2006 2007 2008 2009 2010 2011 2012
GB
P m
illio
ns
- Uneaded petrol
- Leaded petrol
- Ultra-low sulphur petrol
- Diesel
- Ultra-low sulphur diesel
Reduced tax rate for ultra-low sulphur petrol
Reduced tax rate for ultra-low sulphur diesel

20
Environmental effectiveness: Fuel taxes and
fuel use in the transport sector per GDP unit
0.0
0.2
0.4
0.6
0.8
1.0
0
10
20
30
40
50
60
70
80
90
94 95 96 97 98 99 00 01 02 03 04 05 06 07 08 09 10
United States
0.0
0.2
0.4
0.6
0.8
1.0
0
10
20
30
40
50
60
70
80
90
94 95 96 97 98 99 00 01 02 03 04 05 06 07 08 09 10
Turkey
0.0
0.2
0.4
0.6
0.8
1.0
0
10
20
30
40
50
60
70
80
90
94 95 96 97 98 99 00 01 02 03 04 05 06 07 08 09 10
France
0.0
0.2
0.4
0.6
0.8
1.0
0
10
20
30
40
50
60
70
80
90
94 95 96 97 98 99 00 01 02 03 04 05 06 07 08 09 10
Germany
Further information
www.oecd.org/env/policies/database
www.oecd.org/env/taxes
www.oecd.org/env/tools-evaluation/carbon-prices.htm
www.oecd.org/env/taxingenergyuse.htm
21